Abstract
The digital economy, as a major economic form after the agricultural and industrial economies, has become a new driving force in the development of the national economy, and it may provide opportunities for rural economic development through new businesses such as the platform economy and live e-commerce. However, there may also be a risk of a digital divide, and the mechanism of its impact on shared prosperity needs to be scientifically verified. Based on the panel data of 2243 counties in China from 2011 to 2021, the article empirically examines how the digital economy promotes common prosperity among regions and the spatial spillover effects of the digital economy. The findings suggest that, first, the geographic distance matrix reveals a positive spatial relationship between the digital economy and shared prosperity, and the phenomenon of geo-graphic agglomeration is observed, which manifests itself as a high-high-low aggregation. Second, the digital economy has had an impact that transcends space, enabling counties to both “expand the cake” and “share the cake” more equitably. Third, the coordinated, inclusive, and structurally optimizing effects of the digital economy help counties achieve common prosperity by upgrading the level of public services and promoting the upgrading of industrial structure. Ultimately, the digital economy promotes the common prosperity and long-term development of county economies through innovation-driven and optimized resource allocation.
1. Introduction
The United Nations has proposed that eradicating all forms of poverty is the first of the 17 goals of the 2030 Agenda for Sustainable Development [1]. From 1990 to 2014, the world made remarkable progress in reducing extreme poverty, with more than 1 billion people lifted out of extreme poverty [2]. However, the 2019 coronavirus disease pandemic has led to an increase in extreme poverty in the world [3]. Poverty is a major challenge for every country. China has achieved a comprehensive victory in the battle against poverty, with more than 90 million rural poor lifted out of poverty, 800 poor counties removed from the poverty list, and 128,000 poor villages listed [4]. Despite China’s major success in overcoming absolute poverty, the problem of uneven distribution of income among the population still exists, and uneven and insufficient development is still highlighted. Eliminating poverty, improving people’s livelihoods and realizing common prosperity are the core concepts of socialism and the common goal of all people. The twentieth National Congress of the Communist Party of China emphasized that “modernization with universal affluence is Chinese-style modernization”. The Congress reaffirmed its commitment to ensuring that the quest for a better life for the people remains the cornerstone and objective of modernity, with a commitment to uphold social fairness and equity, advancing common prosperity, and preventing excessive disparities. Structurally, common prosperity encompasses two key dimensions: “sharing” and “prosperity” [5]. In the pursuit of this goal, it is crucial to balance efficiency with fairness, ensuring both the expansion of wealth creation (“making the cake bigger”) and its equitable distribution (“dividing the cake well”). Therefore, it is of positive significance for the world’s sustainable development to construct an assessment system oriented to the realization of the goal of common prosperity and to explore the path of realizing common prosperity in China.
Sustainable development emphasizes stable and inclusive economic growth, requiring not only the enhancement of overall economic strength but also the narrowing of regional, urban–rural, and social disparities to ensure that all people share in the dividends of progress [6]. Developing the digital economy represents a strategic move to capitalize on the opportunities presented by emerging advancements in science and technology, alongside industrial transformation. It aligns with the goal of encouraging common prosperity via superior development and holds significant advantages in driving sustainable economic growth [7]. In the past few years, emerging technologies such as artificial intelligence and a huge volume of data have empowered industries across the board, accelerating the digital transformation of traditional sectors toward high-end, intelligent development. The increasing affordability and ease of use of digital tools help bridge the “capability gap” among users, enabling broader participation in the digital economy [8]. The circulation and utilization of data elements unlock new possibilities for “equal opportunities”, offering diverse innovation entities equal access to emerging industries and value creation. With the high penetration of digital technology across both urban and rural areas, its widespread application provides essential technical support for integrated urban–rural development [9], enhances fairness in primary income distribution, and contributes to “dividing the cake well”. Furthermore, digital technology plays a pivotal role in promoting regional coordinated development [10]. By driving industrial digitalization in central and western regions, it fosters economic growth, mitigates regional imbalances, enhances overall economic resilience, and lays the foundation for long-term, stable development [11].
In this context, integrating the concept of sustainable development into the digital economy development strategy—where economic growth and fair distribution complement each other—is essential. However, existing articles mainly use provincial and municipal macro data to explore the direct impact of digital economy on economic growth or the urban–rural income gap, which lays the foundation for the research design of this paper, but there are still the following deficiencies that need to be supplemented. First, the existing articles explore the mechanism of the digital economy on economic growth or urban–rural income gap, and few articles consider the impact of the digital economy on the common wealth from the perspectives of both economic growth and fair distribution at the same time. Secondly, the data reported in existing literature mainly come from provincial or municipal statistical yearbooks, and the research object is not specific enough. Finally, as a digital technology and means to break through time and space limitations, the impact on neighboring regions cannot be ignored. The following are this study’s possible marginal contributions: First, this study quantifies the impact of the digital economy on “making the cake bigger” and “sharing the cake” equitably. Second, by moving beyond the reliance on conventional data sources such as statistical yearbooks, EPS, and Wind databases, this study utilizes web crawler technology to collect data from the official TianYanCha website, creating a micro dataset that covers the business conditions of enterprises across 2243 districts and counties from 2011 to 2021. This approach provides more accurate data support for policy evaluation. Third, this study examines whether advanced digital economy regions at the level of county can foster common prosperity in lagging areas through spatial spillovers, and to what extent lagging regions can effectively leverage these spillovers.
This article is structured as follows: the research theories and theoretical analysis are presented in Section 2; Section 3 presents the Description of variables; the empirical study of spatial spillover effects is presented in Section 4; and Section 5 presents the empirical testing of mechanisms of action; the findings and policy recommendations are presented in Section 6.
2. Literature Review
2.1. Common Prosperity
Scholars have carried out a wealth of research on common prosperity, mainly focusing on the definition of the concept of common prosperity and the construction of the evaluation index system and other related contents. Regarding the definition of the connotation of common prosperity, as the essential requirement of socialism with Chinese characteristics, the theoretical foundation of common prosperity can be traced back to the socialist distribution theory of Marxism, which emphasizes the realization of “distribution according to needs” through the liberation of productive forces [12]. Modern academic definitions of common wealth generally emphasize the dual attributes of “common” and “affluence”; the dimension of “affluence” refers to the comprehensive improvement of material wealth and spiritual life, including the “affluence” dimension, which refers to the comprehensive improvement of material wealth and spiritual life, covering economic growth, income level, public services, ecological environment, and other areas of development [13,14,15]. The “common” dimension emphasizes the universality of the fruits of development, and aims to achieve social equity by narrowing the gap between urban and rural areas, regions, and groups [16]. In terms of common prosperity measurements, comprehensive measurement and single-indicator measurement dominate. Comprehensive measurement is mainly conducted through the construction of an evaluation index system to evaluate the level of common wealth in China. Scholars have built such evaluation index systems based on three aspects of common wealth: development, sharing, and accessibility [17,18]. These systems are combined with panel data and spatial measurement methods to quantify the regional synergistic effects of common wealth [19]. Some scholars have also utilized big data technology to construct the “common wealth index”, integrating non-traditional indicators such as e-commerce consumption and satellite night light data [20]. Single-indicator measurements mainly measure common wealth from the perspectives of economic inequality, multidimensional poverty, and public services [21,22,23,24]. The Gini coefficient, the urban–rural income ratio, and the regional GDP per capita difference index are widely used to measure the wealth distribution gap [25,26]. Other scholars assess the fairness of the distribution of public goods from the coverage of medical resources and the index of compulsory education equalization.
2.2. Digital Economy
The term “digital economy” was firstly proposed by Tapscott [27]. Economic activities supported by digital technology began to appear in the 1950s, and since the emergence of the international financial crisis in 2008, foreign countries have launched more in-depth research on digital economy [28,29]. With the rapid development and application of cutting-edge information technology, such as cloud computing, big data, artificial intelligence, and the Internet of Things, the digital economy is developing rapidly [30]. Research on the digital economy mainly focuses on theoretical and concept definition, measurement methods, and on the analysis of the influencing factors. When measuring the level of development of the digital economy, academics usually adopt different indicator systems for assessment. Measurement methods can be carried out at the macro, meso, and micro levels. At the national or regional macro level, the development of the digital economy is usually measured by indicators such as ICT investment, digital infrastructure construction (e.g., 5G network penetration), the degree of digital financial development, and the proportion of value added by the digital industry to GDP [31,32,33,34]. In addition, spatial econometric models are used to assess the spatial spillover effects of the digital economy on regional economic growth [35]. At the industry meso level, the development impact of digital economy can be measured by indicators such as the level of industry digitization and the degree of e-commerce penetration and transformation [36,37]. Research shows that the digital economy not only promotes the upgrading of industrial structures, but also enhances the synergistic development of regional industries and promotes the rise of new industries [38,39]. At the micro level of enterprises and individuals, the measurement of digital economy usually involves indicators such as the degree of digital transformation of enterprises, the application of data-driven decision-making, and the level of digital skills of employees [40,41,42,43]. Studies have found that the digital economy has a profound impact on the economic behaviors of micro-entities by enhancing labor productivity, optimizing enterprise management models, and improving market transparency [44,45,46].
2.3. Digital Economy and Common Prosperity
Based on the above review of the literature on the digital economy and common wealth, it is evident that the digital economy will have a greater impact on common wealth, but the existing literature has not formed a unified view on the relationship between the two. Some scholars believe that the digital economy will significantly promote common wealth, and scholars have explored the direct effect of the digital economy on common wealth through the construction of relevant models [47,48]. Some scholars also believe that the digital divide is very easy to appear in the process of digital economic development. The digital divide is essentially an unequal opportunity phenomenon in the process of digital development, which mainly refers to the opportunity gap between individuals from different socio-economic backgrounds in accessing and using ICT technology to carry out a variety of activities [49]. The creation of the digital divide will make it difficult for farmers to share in the dividends of digital development. This will make the distribution of benefits related to the digital economy unbalanced and will hinder the realization of common prosperity [50].
3. Theoretical Analysis and Study Hypothesis
3.1. The Regional Diffusion Effects of the Digital Economy on Common Prosperity
With the widespread adoption of digital technologies, traditional industries are now integrating deeply with digital systems, leading to the emergence of innovative business models and company structures [51]. Additionally, the employment structure has been optimized, partly due to the rise of the digital economy [52]. On one hand, the digital economy has created new job opportunities in fields such as data analysis and artificial intelligence. On the other hand, it has reshaped employment patterns in traditional industries, enabling workers to adapt more easily to market changes and pursue career development. Digital technology also helps governments deliver public services more effectively, such as online education and telemedicine, thus improving access to quality resources. Concurrently, digital technology supports government initiatives such as poverty alleviation and social security [53], helping to reduce social inequality.
The digital economy has a substantial spatial spillover effect, promoting prosperity across regions through its powerful network and diffusion effects. The continuous improvement of communication networks and rapid development of digital technologies have enabled the digital economy to spread quickly across regions. Information, knowledge, and resources flow more freely between areas, thanks to the adoption of technologies such as cloud computing, big data, and artificial intelligence. This diffusion effect enhances local economic development while also benefiting neighboring regions through spatial networks, thereby fostering synergistic interregional growth.
Moreover, regional economic activities interact and link in ways that further drive spatial spillovers. The digital economy breaks down the spatial barriers of traditional economies, allowing economic activities in different regions to become interconnected. Through e-commerce platforms, digital supply chains, and other tools, businesses can collaborate and compete across regions, leading to upgrades and optimization of industrial chains. Additionally, the digital economy facilitates the exchange of information and resources between consumers, producers, and service providers, reinforcing regional economic linkages [54]. These interactions not only enhance local efficiency but also promote the economic development of nearby regions through geographic spillover effects. This cross-regional sharing of resources reduces disparities in economic growth, supporting more equitable development. This logical relationship is shown in Figure 1.
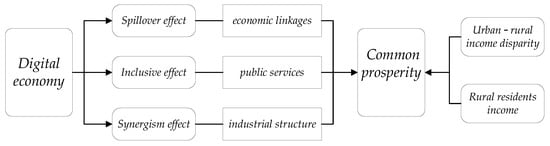
Figure 1.
Theoretical framework.
H1:
The digital economy generates a spatial spillover effect, simultaneously encouraging counties to “expand the cake” and “share the cake”.
3.2. Digital Economy, Public Services, and Common Prosperity
The inclusive effect of the digital economy can effectively encourage the equalization of public services and enhance the matching efficiency and standards of public services [55]. As the digital and physical economies become more intertwined, the mode of production of human society is moving into a new era, characterized by the digital economy. Although rural and urban areas have already achieved “the same network and the same speed” in terms of network coverage, the financial implications of the digital economy in advancing the equality of essential public services reveal structural aberrations and misalignments because of the inconsistent regional growth, the weak innovation capacity of the core industries of the digital economy in many counties, and the relatively insufficient digital literacy of rural households, thus hindering the method via which everyone can achieve common prosperity [56,57]. As an emerging kinetic energy, the digital economy, with its excellent resource integration capability, dynamic feedback mechanism, and data mining and sharing capacity, can encourage the growth of fundamental public services in the direction of intelligence, refinement, and universality, increasing the pace at which fundamental public services are being equalized [58].
As an important feature of today’s era, the digital economy, with its deep penetration into the countryside, is effectively promoting the redistribution of social resources with its powerful technology-driven force and fully demonstrating its inclusive effect, which promotes the vigorous development of digital village construction [59,60]. This process not only enhances the level of informatization in rural areas, but also promotes the optimal allocation of social resources at a deeper level. Through advanced technologies with cloud computing and large data, the limitations of traditional resource allocation have been broken, enabling resources to flow more precisely and efficiently to the countryside, somewhat increasing the relative wages of people living in remote areas, diminishing the gap between urban and rural areas [61,62].
The digital economy encourages everyone to share public services, enabling people in rural areas to enjoy the same public service entitlements as urban residents. Digitization has, on the one hand, greatly increased the quality of public services and broadened their reach. This not only gives people equal access to public services, but further promotes the diversification of public goods and the high-quality development of public services. Everyone has access to opportunities for fair participation, fair development and fair enjoyment, and social justice is better realized. The digital economy also has actively contributed to promoting the deepening of digital financial inclusion [63]. Through digitalization, financial services in rural areas have been greatly improved, and the coverage of financial services has been successfully expanded in both breadth and depth. This has not only eased the financing constraints of enterprises and enhanced the ease and effectiveness of financial assistance for the growth of the rural sector, but also improved the weakest areas, such as rural medical care and education through digital construction, reducing the disparity between public services in urban and rural areas even more [64]. The logical relationship is shown in Figure 1.
H2:
The digital economy affects the expansion and distribution of the cake by influencing public services.
3.3. Digital Economy, Industrial Structure, and Common Prosperity
The digital economy promotes the gradual upgrading of the industrial structure from a lower to a higher level and enhances the long-term ability to achieve shared prosperity [65]. Amidst the advancements in scientific and technological innovation and other related progress, and with the rapid rise of advanced technology sectors, labor-intensive industries are undergoing a process of transformation and substitution to high technology content. In this process, the policy orientation is clearly inclined to urbanization and development, resulting in the incubation and growth of new technologies and emerging industries often taking precedence in large cities. This phenomenon further exacerbates the existing gap in human capital development and employment access among urban and rural populations. As the industrial structure continues to be optimized and upgraded, i.e., moving to a higher level, the urban–rural divide among residents caused by differences in education levels, skill acquisition, and access to information is likely to widen further, posing a more serious challenge to the promotion of balanced development of society as a whole [66].
Although the overall size of the economy has continued to expand, just as the “cake” is getting bigger and bigger, the pattern of its distribution has become more and more unbalanced, showing a significant inequality in distribution [67]. The substantial income gap, which persists both in urban versus rural settings and among different administrative regions, mirrors a chasm-like divide [68]. This divide not only hinders interregional complementarity and integration but also deepens the gap and exclusion between advanced and relatively lagging regions, reinforcing a stark segmentation dynamic [69]. A balanced distribution of resources and peaceful regional coexistence are required in order to overcome this phenomenon, which poses a serious challenge to the coordinated growth of the regional economy. Furthermore, the structure of industries reveals a clear disconnect. The input–output chains within industries have been severely disrupted by the growing income disparity between different sectors [70]. On one hand, the demand for high-quality intermediate inputs in frontier industries is often difficult to meet effectively from lagging industries, causing the supply and demand to diverge. On the other hand, the disparity in development and opportunity between industries is exacerbated when workers in less-developed industries are unable to take advantage of the positive spillover effects of technical innovation and industrial upgrading in frontier industries.
First, employment opportunities in certain traditional agricultural sectors have declined as capital and technology have intensified, and the demand for highly skilled labor increases. If the education and skill levels of rural residents cannot meet the requirements of emerging industries, they may struggle to secure high-paying jobs [71]. Coupled with intensified market competition and policy adjustments, rural residents may face greater competitive pressure in the job market. Additionally, as the industrial structure advances, resources may move more frequently to cities in order to facilitate the growth of new industries. This shift may result in relatively slower development of infrastructure and rural public services, further limiting the opportunities and income levels of rural residents. In contrast, urban areas are developing rapidly because they are supported by more resources, and urban residents tend to have greater access to high-quality instruction and practice, which facilitates their adaptation to the demands of emerging industries and their acquisition of lucrative employment opportunities [72]. Rural residents may have relatively lower levels of education and skills, limiting their competitiveness in the high-skilled labor market and further increasing economic disparity [73,74]. This logical relationship is shown in Figure 1.
H3:
The digital economy affects the expansion and distribution of the cake by influencing the industrial structure.
4. Description of Variables
4.1. Explanatory Variable
The establishment of digital economy indicators is based on four factors: the digital environment, industrial digitalization, the digital infrastructure, and digital industrialization [75,76]. The digital economy is built upon the foundation of digital infrastructure. It refers to the infrastructure system that transmits data and computing power, with communication networks as the carrier, driven by a new generation of data and information [77]. This infrastructure is essential to the spread of digital culture, in addition to providing a strong basis for the expansion of the digital economy. The digitization of industries stands as a fundamental pillar within the digital economy. It involves the application of digital technologies and data resources to traditional industries, aiming to enhance output and efficiency. This approach accelerates the translation cycle of research and technical advancements and fosters creativity and cross-sector convergence in conventional industries, injecting fresh momentum into their pursuit of superior-quality growth. The superior-grade growth of the digital economy is largely dependent on digital industrialization. It outlines the approach of leveraging digital and IT solutions to drive the modernization and transformation of traditional industries toward intelligent, digitized, and service-oriented models [78]. The digital environment, with its three main characteristics of digitization, embeddedness, and relational connectivity, allows for the fusion and re-innovation of huge amounts of data and improves the ability to analyze data, while information technology helps to realize intelligent living by embedding digital technologies into social life. In addition, the huge amount of data stored in the digital environment allow for unlimited possibilities of development within social life [79]. The digital economy indicator system is constructed as shown in Table 1.

Table 1.
Development of assessment metrics for the digital economy.
4.2. Explained Variable
This paper argues that the income levels of rural inhabitants compared to their urban counterparts, along with the disparity in earnings between these regions, can act as pivotal metrics to assess the progress toward common prosperity [80]. To fully realize the common prosperity strategy, it is essential to focus on the earnings of rural populations relative to urban ones, reducing the income disparity between city and countryside, preventing extreme wealth division, fostering balanced regional growth, and guaranteeing that the fruits of progress are fairly distributed among everyone.
4.3. Control Variables
In this paper, we mainly choose the following control variables. Financial Development Level (FDL) is calculated by dividing the total amount of loans from financial institutions by the GDP of the county at the year’s end [81]. Enterprise Development Level (EDL) is determined by dividing the total industrial output value of enterprises above the authorized size by the county’s gross domestic product [82]. Real Estate Development Investment (RDI) is the amount of money invested in real estate development at the county level [83]. Environmental Quality (PMA) is measured by annual average PM2.5 [84]. Economic Development Level (ED), which reflects local economic activity, is determined by dividing the county’s GDP by the permanent population [85]. Social Welfare Level (SWN) is quantified based on the count of social welfare establishments.
4.4. Mechanism Variables
(1) Level of public services.
As the social security system has become more developed and sophisticated, its share of the national economy has increased, which has significantly promoted the optimization of China’s income distribution pattern [86]. Specifically, the comprehensive social security system, encompassing minimum living standards, pension schemes, health coverage, unemployment benefits, and educational support, has demonstrated a beneficial impact on adjusting the national income distribution structure and has significantly fostered the balanced integration of social equity with economic growth. This shift not only reflects the country’s high priority on people’s livelihood and well-being, but also serve as an important cornerstone for building a more just and sustainable society [87]. Therefore, combined with the findings of current research, the extent of fundamental public service provision is assessed from three perspectives: social welfare, healthcare and medical, and education. The system of indicators for public service levels is constructed as shown in Table 2.
Table 2.
System of indicators for public service levels.
(2) Optimization of industrial structure:
where S1, S2, and S3 represent contributions from the primary, secondary, and tertiary sectors, illustrating the progression of the industrial framework from basic to advanced levels and from less to more efficient operations.
4.5. Data Source
There are three main types of data sources: (1) statistical data, gathered mainly from the China City Statistical Yearbook, the statistical yearbooks of various provinces, cities and counties, the statistical development bulletin, and the data from the Chinese Academy of Social Sciences and the State Intellectual Property Office; (2) dynamic web pages containing data such as the number of businesses using agricultural robots, the number of artificial intelligence enterprises, the vitality of the electronic information service industry, and other data are crawled with the help of Python language, respectively. The data are crawled from Enterprise Search platforms and prefecture-level municipal government portals; (3) remote sensing data: PM2.5 environmental quality data come from the PM2.5 raster data published by Dalhousie University. Finally, the research sample consisted of panel data from 2243 Chinese districts and counties from 2011 to 2021.
5. Empirical Analysis of Spatial Spillover Effects
5.1. Model Settings
5.1.1. Spatial Matrix Settings
To ensure a comprehensive and objective examination of how common prosperity affects different regions at the county level, a geographic matrix was developed utilizing the attributes of physical distance between locations. The geographical matrix was constructed according to the physical proximity among various districts and counties, as well as the spatial relationship between cities, where closer proximity indicates a stronger connection. It can be inferred from this that the high level of common prosperity in a specific region may be affected by neighboring cities.
5.1.2. Spatial Econometric Model
The spatial lag model (SAR) is centered on the analysis of spatial spillovers between dependent variables, i.e., exploring how changes in the dependent variable in a neighboring geographic unit may have a ripple effect about the target region’s dependent variable [88]. The spatial error model not only considers those spatial propagation factors that are difficult to observe directly, but also explores how the error terms (or disturbance terms) in neighboring regions indirectly affect the dependent variables in a specific region through spatial interactions. The SDM, as a more comprehensive version of SAR, constructs a more comprehensive and refined spatial econometric analysis framework by introducing the spatially lagged component of the independent variable, i.e., by simultaneously taking into account the spatial dimension’s spillover effects of the independent and dependent variables.
For the dependent variable, is its n-dimensional vector; the n × k-dimensional matrix of the independent variables is denoted as ; , , and represent n × n-dimensional spatial weight matrices, which may consist of distinct or identical matrices; represents the dependent variable’s spatial autocorrelation coefficient; the correlation parameters of the independent variables are represented by the vector ; represents the coefficient of spatial autocorrelation for the independent variables; signifies the coefficient of spatial error; is a constant term; the random error terms are and ; and the n-order unitary matrix is denoted by . SAR models are those in which , , and ; SEM models are those in which , , and ; and SDM models are those in which , , and .
5.2. Testing the Internet Economy’s Effect on Common Prosperity
5.2.1. Spatial Autocorrelation Test
As shown in Table 3, the rural citizens’ relative income, the rural–urban economic disparity, and the digital economy’s Moran’s I were statistically significant between 2011 and 2021 at the 1% level and larger than 0. Accordingly, there was a positive spatial association and agglomeration effect between the digital economy and common prosperity.
Table 3.
Global Moran index measurement results.
5.2.2. Spatial Overflow Test
As shown in Table 4, both urban–rural disparity in income and the relative income of rural inhabitants have considerably positive spatial autoregressive coefficients (ρ). This indicates that there is significant spatial dependence across regions, meaning that the spatial factor cannot be overlooked when exploring the implications of the digital economy for mutual prosperity. Based on the regression findings of the spatial Durbin model, the effect decomposition approach is used to separate the direct and indirect impacts of the independent variable’s overall influence on the dependent variable. Specifically, when the region’s digital economy grows by 1%, rural people’ relative income rises by 0.0674%, and the urban–rural income gap narrows by 0.0744%. Meanwhile, through spatial spillover effects, advancements in the digital economy indirectly increase the relative income of rural residents in nearby areas by 0.712%, reducing differences in income between urban and rural areas by 1.5023%. Finally, nationwide improvements in the digital economy lead to a 0.7795% increase in the relative income of rural residents and a 1.5768% reduction in the income disparity between urban and rural areas. These results demonstrate that the digital economy furthers the attainment of common prosperity by influencing nearby regions through geographical impacts in addition to fostering common wealth within a region. Therefore, the digital economy’s spatial spillover impact contributes not only to a “bigger cake” within the region but also aids neighboring regions in achieving a “fair distribution of the cake”. This largely validates Hypothesis 1.
Table 4.
Spatial spillover effect test.
The main reasons for this may lie in the following aspects. On the one hand, from the perspective of industrial development, the growth of the digital economy has given rise to new rural industry models in the region. The rise of rural e-commerce has broken the geographical restrictions on the sale of traditional agricultural products and reduced transaction costs. At the same time, rural e-commerce has also driven the development of rural logistics, packaging and other related industries, providing more employment opportunities and sources of income for rural residents, raising the relative income level of rural residents, and thus narrowing the urban–rural income gap. On the other hand, the spread of knowledge and technology is an important factor. When a region’s digital economy develops, its accumulated knowledge of digital technology and advanced business models will spread to neighboring regions through personnel mobility and information sharing. Rural residents in neighboring regions can learn the e-commerce operation skills of developed regions and return to their local areas to launch e-commerce businesses, improving the efficiency and prices of agricultural products, and thus increasing their incomes. Moreover, rural enterprises in the surrounding areas can also learn from the digital management experience of developed regions to optimize business operations and improve productivity, which in turn will drive the income growth of rural residents and narrow the income gap between urban and rural areas.
5.2.3. Robustness Test
In 2021, Zhejiang Province became a pioneering region for common prosperity, taking the lead in exploring the path toward common prosperity. Meanwhile, Zhejiang province is a leader in the development of digital industrialization, a model for the digital transformation of industries, an innovator in digital economy mechanisms, and a globally influential center for digital science and technology innovation. This may lead to outcomes that differ from those of other regions. This uniqueness could potentially skew the research conclusions. To ensure the representativeness of the sample and eliminate any bias, county-level data from Zhejiang Province were excluded from the analysis. The results of the robustness test are shown in Table 5. The regression results after excluding these samples demonstrate that the coefficients’ direction and importance under the spatial model remain consistent with previous findings, thereby confirming the resilience of the conclusions.
Table 5.
Robustness test results.
6. Empirical Testing of Mechanisms of Action
6.1. Mechanism Modeling
To investigate the ways in which industrial structure and public service level impact shared wealth in the digital economy, the following mediation effect model is constructed:
If serves as the mediating variable, stands for the county, and for the year, then the level of public services is the dependent variable, is the explanatory variable, and denotes a series of control variables; individual effects are denoted by , and time effects by .
6.2. Coordination of the Analysis of Inclusive Mechanisms
The influence of the digital economy on public service levels is examined using a two-way fixed-effects model, with public services serving as the mediating variable. Public service levels are the dependent variable, and the digital economy is the primary independent variable in the regression findings shown in column (3) in Table 6. The results show that the coefficient of the digital economy is considerably positive at the 1% significance level, indicating that it plays an essential role in raising the standard of public services.
Table 6.
Coordination of inclusive mechanisms.
Existing literature highlights that the digital economy drives innovation in public service delivery, making services more accessible and efficient, especially in underdeveloped regions [89]. Digital platforms enable citizens to access government services online, overcoming traditional geographical and time barriers. Telemedicine and online education serve as prime examples, where digital technologies offer remote populations access to high-quality healthcare and education, thereby narrowing the urban–rural divide in service availability [90]. Furthermore, the use of digital technologies has enhanced the accuracy of public service delivery, enabling governments to more effectively assess and respond to public needs. This has facilitated the provision of more targeted and personalized services, promoted social justice, and addressed regional disparities [91]. Digital tools also improve efficiency and reduce errors in public service processes, thereby enhancing service quality and fostering a more equitable distribution of resources.
6.3. Analysis of Structural Optimization Mechanisms
According to the regression results in column (3) in Table 7, the upgrading of industrial structure is significantly and positively affected by the digital economy as the main explanatory variable at the 1% level. This indicates the importance of the digital economy in driving the transformation of the industrial system. The digital economy makes it easier for existing sectors to transform into networked, intelligent, and digitalized systems through the use of digital technologies and data resources. In addition to improving traditional industries, the digital economy has triggered the emergence of new areas, such as the Internet of Things, cloud computing, artificial intelligence, and big data. These fields have driven the rapid expansion of intra-industry structures and injected new dynamics into economic growth [92]. The digital economy has accelerated the evolution of the entire industrial landscape by encouraging innovation and supporting new industries. In addition, through the extensive application of ICT, the digital economy promotes the coordination and optimization of industrial structure. By optimizing the industrial structure, the digital economy helps to establish a modern industrial system that transcends the boundaries of industry and geography, facilitates collaboration upstream and downstream of the industrial chain, and promotes common prosperity.
Table 7.
Structural optimization mechanisms.
7. Conclusions and Discussion
7.1. Conclusions
Using panel data from 24,673 counties between 2011 and 2021, a spatial econometric model was used to examine the relationship between the digital economy and common prosperity. The following deductions were made: (1) Positive geographical correlation: The digital economy and shared prosperity both exhibit positive geographical correlation and spatial aggregation, shown as high–high and low–low clustering in the geographic distance matrix. Regardless of whether the model is used for SAR, SEM, or SDM, the digital economy significantly increases the relative income of rural residents and reduces the economic gap between urban and rural regions. (2) Spatial spillover effect: The digital economy has an effect on the broader public’s prosperity. In addition to raising the relative income of local rural residents, it effectively closes the income gap between urban and rural communities. It also affects neighboring regions, reducing the economic gap between urban and rural populations and raising the relative income of rural residents in neighboring areas. Therefore, spatial factors should not be overlooked when analyzing the relationship between the two. This is consistent with the findings of Zhou and Guo, as well as Chen and Zhang [93,94]. (3) Coordinated and inclusive impact: The digital economy has a structural optimization impact in addition to a coordinated and inclusive effect. It helps counties achieve common prosperity by promoting the development of public service levels and advancing industrial structure.
7.2. Discussion
In addition to the above findings, this paper discusses the results in depth from the perspectives of theoretical contributions and policy extension. In terms of theoretical contributions, this study reveals spillover effects that may be ignored by traditional linear analysis by introducing the geographic distance matrix and the spatial measurement model. The digital economy, characterized by positive correlation and spatial agglomeration, may form growth poles through technology diffusion, labor mobility, or capital mobility, which aligns with the dynamic evolution of the “center-periphery” theory in the new economic geography [95], but the unique low marginal cost characteristic of the digital economy may accelerate this process. The path through which the digital economy promotes common wealth through industrial structure optimization can be interpreted under the framework of Schumpeter’s innovation theory—digitalization not only gives rise to new businesses [96], but also transforms and upgrades the traditional industries by means of digital technology, which may become a new mechanism for narrowing the gap between urban and rural areas. In terms of policy extension, this study finds that there is a significant spatial spillover effect of digital economy and suggests the construction of a cross-administrative digital synergistic development belt and the establishment of a regional compensation mechanism for the benefits of the digital economy, so as to avoid siphoning effects that exacerbate regional polarization. Based on the discussion of the findings, this paper offers the following recommendations.
First, it is essential to enhance the spatial connectivity between regions and release the digital dividends across areas. Strengthening regional linkages within the digital economy is crucial, with more developed regions playing a driving role. This makes cross-regional collaboration initiatives in the digital economy easier, encouraging resource sharing and the complementarity of regional assets. Through mechanisms such as technology transfer, cooperative research and development, and more, less developed regions can benefit from the advanced experience and technological advancements of regions with a high level of digital economy development in areas such as digital technology, big data analysis, and cloud computing. This will help the latter improve their technological capabilities.
Secondly, it is crucial to develop sound digital infrastructure and promote digital literacy education. To unlock the potential of digital economic development and build a bridge for its growth, the focus must first be on the hardware foundation. This includes accelerating the construction of digital infrastructure, expanding broadband coverage, coordinating the digital resources across regions, and ensuring the rational allocation of data resources. Additionally, lowering the cost of internet access will enable more households to afford connectivity. Following this, internet education and training programs should be introduced to encourage wider participation. By enhancing digital literacy and skills, individuals will be better equipped to navigate the digital world, thereby narrowing the digital divide.
Thirdly, creating a special plan for the digital economy is essential. In regions with a high level of digital economy growth, the primary objective should be to improve the present development framework. In order to consistently overcome current barriers, it is necessary to enhance the digital economy system and pertinent regulations, encouraging technical innovation and advocating for closer integration between the digital and real economies. It is crucial to create strategies that are specific to the economic features and present state of development of areas with comparatively low levels of digital economy growth. These policies should aim to retain regional resources and minimize resource loss to external areas. Cooperation with areas with a higher degree of digital economic development can also help to balance regional digital development, improve economic exchanges, and use the positive spillover effects of more developed regions to propel shared prosperity in less developed areas.
Future research should focus on utilizing micro-level primary data, including surveys of residents, enterprises, etc., to more realistically explore the effects of the digital economy on farm households. Additionally, scholars should explore the mechanisms through which the digital economy exerts spatial spillover effects on common wealth and explore in depth the mechanisms through which the digital economy impacts the common wealth of neighboring regions, so as to provide insights for provinces and cities to realize overall common wealth. Furthermore, researching the interactions between the expansion of the digital economy and other socioeconomic policies such as healthcare, education, and labor market reforms may yield important information for creating an all-encompassing plan to attain common prosperity.
Author Contributions
Conceptualization, J.D., L.W. and Q.Z.; data curation, J.D.; formal analysis, J.D., L.W. and Q.Z.; funding acquisition, L.W.; methodology, J.D., L.W. and Q.Z.; supervision, J.D., L.W. and Q.Z.; software, L.W.; writing—original draft, J.D.; writing—review and editing, J.D., L.W. and Q.Z. All authors have read and agreed to the published version of the manuscript.
Funding
This work was supported by Philosophy and Social Science planning project of Henan Province (2022BZH010).
Institutional Review Board Statement
Not applicable.
Informed Consent Statement
Not applicated.
Data Availability Statement
Data are available in a publicly accessible repository.
Conflicts of Interest
The authors declare no conflicts of interest. The funders had no role in the design of this study; in the collection, analyses, or interpretation of data; in the writing of the manuscript; or in the decision to publish the results.
References
- United Nations. Transforming Our World: The 2030 Agenda for Sustainable Development (A/RES/70/1); United Nations: New York, NY, USA, 2015. [Google Scholar]
- Page, L.; Pande, R. Ending global poverty: Why money isn’t enough. J. Econ. Perspect. 2018, 32, 173–200. [Google Scholar] [CrossRef]
- Pereira, M.; Oliveira, A.M. Poverty and food insecurity may increase as the threat of COVID-19 spreads. Public Health Nutr. 2020, 23, 3236–3240. [Google Scholar] [CrossRef]
- Peng, J.Q.; Zhao, Z.H.; Chen, L.L. The impact of high—Standard farmland construction policy on rural poverty in China. Land 2022, 11, 1578. [Google Scholar] [CrossRef]
- Liu, Y.; Dong, K.; Wang, J.; Taghizadeh-Hesary, F. Towards sustainable development goals: Does common prosperity contradict carbon reduction? Econ. Anal. Policy 2023, 79, 70–88. [Google Scholar] [CrossRef]
- Rodríguez-Pose, A.; Hardy, D. Addressing poverty and inequality in the rural economy from a global perspective. Appl. Geogr. 2015, 61, 11–23. [Google Scholar] [CrossRef]
- Alshuwaikhat, H.M.; Mohammed, I. Sustainability matters in national development visions—Evidence from Saudi Arabia’s Vision for 2030. Sustainability 2017, 9, 408. [Google Scholar] [CrossRef]
- Gorman, N.; MacGill, I.; Bruce, A. How to support the adoption of open-source energy system modelling software? Insights from interviews with users and developers. Energy Res. Soc. Sci. 2024, 111, 103479. [Google Scholar] [CrossRef]
- Salemink, K.; Strijker, D.; Bosworth, G. Rural development in the digital age: A systematic literature review on unequal ICT availability, adoption, and use in rural areas. J. Rural Stud. 2017, 54, 360–371. [Google Scholar] [CrossRef]
- Jia, X.; Zhu, T. Spatiotemporal Evolution of the Coupling-Coordinated Development of Digital Factors and Rural–Industrial Integration. Sustainability 2024, 16, 10056. [Google Scholar] [CrossRef]
- Prabhakar, A.C. Driving Economic Prosperity: Fostering Job-Oriented Sustainable and Inclusive Development in India. Open J. Bus. Manag. 2024, 12, 2854–2885. [Google Scholar] [CrossRef]
- Lewis, E.O.; MacKenzie, D.; Kaminsky, J. Exploring equity: How equity norms have been applied implicitly and explicitly in transportation research and practice. Transp. Res. Interdiscip. Perspect. 2021, 9, 100332. [Google Scholar] [CrossRef]
- Huo, D.; Lv, X.; Bukhari, A.A.A.; Bukhari, W.A.A.; Pervaiz, A. Transformative pathways to sustainable wealth: Do natural and human capital really matter? J. Clean. Prod. 2024, 469, 143199. [Google Scholar] [CrossRef]
- Occhipinti, J.A.; Buchanan, J.; Hynes, W.; Eyre, H.A.; Tran, K.; Song, Y.J.C.; Hickie, I.B. Estimating the mental wealth of nations: Valuing social production and investment. Nat. Ment. Health 2023, 1, 247–253. [Google Scholar] [CrossRef]
- Occhipinti, J.A.; Buchanan, J.; Skinner, A.; Song, Y.J.C.; Tran, K.; Rosenberg, S.; Hickie, I.B. Measuring, modeling, and forecasting the mental wealth of nations. Front. Public Health 2022, 10, 879183. [Google Scholar] [CrossRef]
- Shigetomi, Y.; Chapman, A.; Nansai, K.; Matsumoto, K.I.; Tohno, S. Quantifying lifestyle—Based social equity implications for national sustainable development policy. Environ. Res. Lett. 2020, 15, 084044. [Google Scholar] [CrossRef]
- Liu, Y.; Du, J.; Wang, K. Towards common prosperity: The role of mitigating energy inequality. Energy Policy 2024, 195, 114386. [Google Scholar] [CrossRef]
- Liu, Y.; Dong, X.; Dong, K. Pathway to prosperity? The impact of low-carbon energy transition on China’s common prosperity. Energy Econ. 2023, 124, 106819. [Google Scholar] [CrossRef]
- Xie, T.C.; Zhang, Y.; Song, X.Y. Research on the spatiotemporal evolution and influencing factors of common prosperity in China. Environ. Dev. Sustainab. 2024, 26, 1851–1877. [Google Scholar] [CrossRef]
- Peng, G.; Yang, D.L.; Zhu, L. Measurement, spatial characteristics and dynamic evolution of the common prosperity level in Chinese cities. China Soft Sci. 2022, 04, 289–303. [Google Scholar]
- Diffenbaugh, N.S.; Burke, M. Global warming has increased global economic inequality. Proc. Natl. Acad. Sci. USA 2019, 116, 9808–9813. [Google Scholar] [CrossRef]
- Li, Y.; Jin, Q.; Li, A. Understanding the multidimensional poverty in South Asia. J. Geogr. Sci. 2022, 32, 2053–2068. [Google Scholar] [CrossRef]
- Wang, Y.; Huo, Z.; Li, D.; Zhang, M. Evaluation of common prosperity level and regional difference analysis along the Yangtze River Economic Belt. Int. J. Environ. Res. Public Health 2022, 19, 11851. [Google Scholar] [CrossRef] [PubMed]
- Zhang, J.; Huang, B.; Chen, X.; Zhu, C.; Gan, M. Multidimensional evaluation of the quality of rural life using big data from the perspective of common prosperity. Int. J. Environ. Res. Public Health 2022, 19, 14166. [Google Scholar] [CrossRef]
- Hao, N.; Ji, M. Development of platform economy and urban–rural income gap: Theoretical deductions and empirical analyses. Sustainability 2023, 15, 7684. [Google Scholar] [CrossRef]
- Zhang, X.; Liu, H. Heterogeneity perspective on the dynamic identification of low-income groups and quantitative decomposition of income increase: Evidence from China. Sustainability 2022, 14, 9367. [Google Scholar] [CrossRef]
- Tapscott, D. The Digital Economy: Promise and Peril in the Age of Networked Intelligence; McGraw-Hill: New York, NY, USA, 1996. [Google Scholar]
- Shahbaz, M.; Wang, J.; Dong, K.; Zhao, J. The impact of digital economy on energy transition across the globe: The mediating role of government governance. Renew. Sustain. Energy Rev. 2022, 166, 112620. [Google Scholar] [CrossRef]
- Dong, F.; Hu, M.; Gao, Y.; Liu, Y.; Zhu, J.; Pan, Y. How does digital economy affect carbon emissions? Evidence from global 60 countries. Sci. Total Environ 2022, 852, 158401. [Google Scholar] [CrossRef] [PubMed]
- Xue, Y.; Tang, C.; Wu, H.; Liu, J.; Hao, Y. The emerging driving force of energy consumption in China: Does digital economy development matter? Energy Policy 2022, 165, 112997. [Google Scholar] [CrossRef]
- Xu, Q.; Zhong, M.R.; Cao, M. Does digital investment affect carbon efficiency? Spatial effect and mechanism discussion. Sci. Total Environ. 2022, 827, 154321. [Google Scholar] [CrossRef]
- Ding, Y.L.; Luo, Q.F. Polycentric spatial Structure, digital economy and urban green sustainable development. J. Clean. Prod. 2024, 468, 143080. [Google Scholar] [CrossRef]
- Sun, H.; Chen, T.; Wang, C.N. Spatial impact of digital finance on carbon productivity. Geosci. Front. 2024, 15, 101674. [Google Scholar] [CrossRef]
- Leng, X.; Tong, G. The digital economy empowers the sustainable development of China’s agriculture—Related industries. Sustainability 2022, 14, 10967. [Google Scholar] [CrossRef]
- Yu, H.; Wang, J.; Xu, J.; Ding, B. Does digital economy agglomeration promote green economy efficiency? A spatial spillover and spatial heterogeneity perspective. Environ. Dev. Sustain. 2024, 27, 7379–7406. [Google Scholar] [CrossRef]
- Meng, X.N.; Xu, S.C.; Hao, M.G. Can digital—Real integration promote industrial green transformation: Fresh evidence from China’s industrial sector. J. Clean. Prod. 2023, 426, 139116. [Google Scholar] [CrossRef]
- Jula, N.M.; Staicu, G.I.; Moraru, L.C.; Bodislav, D.A. Toward a Sustainable Development of E—Commerce in EU: The Role of Education, Internet Infrastructure, Income, and Economic Freedom on E—Commerce Growth. Sustainability 2024, 16, 3809. [Google Scholar] [CrossRef]
- Sun, H.; Zhang, Y.; Liu, B.; Sheng, G.; Cheng, Y.; Zuo, Y.; Tao, F. Negative collaboration risk analysis and control in manufacturing service collaboration based on complex network evolutionary game. Expert Syst. Appl. 2025, 261, 125545. [Google Scholar] [CrossRef]
- Gardas, B.B.; Gunasekaran, A.; Narwane, V.S. Unlocking factors of digital twins for smart manufacturing: A case of emerging economy. Int. J. Comput. Integr. Manuf. 2024, 37, 1463–1493. [Google Scholar] [CrossRef]
- Lv, L.; Chen, Y. The Collision of digital and green: Digital transformation and green economic efficiency. J. Environ. Manag. 2024, 351, 119906. [Google Scholar] [CrossRef]
- Espina-Romero, L.; Chafloque-Céspedes, R.; Izaguirre Olmedo, J.; Albarran Taype, R.; Ochoa-DíazA. Driving Digital Transformation in Lima’s SMEs: Unveiling the Role of Digital Competencies and Organizational Culture in Business Success. Admin. Sci. 2025, 15, 19. [Google Scholar] [CrossRef]
- Sultana, S.; Akter, S.; Kyriazis, E. Theorising data—Driven innovation capabilities to survive and thrive in the digital economy. J. Strateg. Mark. 2024, 32, 864–890. [Google Scholar] [CrossRef]
- Stofkova, J.; Poliakova, A.; Stofkova, K.R.; Malega, P.; Krejnus, M.; Binasova, V.; Daneshjo, N. Digital skills as a significant factor of human resources development. Sustainability 2022, 14, 13117. [Google Scholar] [CrossRef]
- Le Viet, H.; Dang Quoc, H. The factors affecting digital transformation in Vietnam logistics enterprises. Electronics 2023, 12, 1825. [Google Scholar] [CrossRef]
- Siswanti, I.; Riyadh, H.A.; Nawangsari, L.C.; Mohd Yusoff, Y.; Wibowo, M.W. The impact of digital transformation for sustainable business: The meditating role of corporate governance and financial performance. Cogent Bus. Manag. 2024, 11, 2316954. [Google Scholar] [CrossRef]
- Sedighi, M.; Hashemi, N. Navigating the digital landscape: Communication visibility and entrepreneurial opportunity identification. J. Entrep. Emerg. Econ. 2024, 17, 701–724. [Google Scholar] [CrossRef]
- Zou, J.; Yao, L.; Wang, B.; Zhang, Y.; Deng, X. How does digital inclusive finance promote the journey of common prosperity in China? Cities 2024, 150, 105083. [Google Scholar] [CrossRef]
- Xia, J.i.; Liu, C. Empowerment of Common Prosperity Through Digital Economy: Pathways and Policy Design. Res. Econ. Manag. 2021, 42, 3–13. [Google Scholar]
- Yue, Q.; Zhang, M.; Song, Y. Impact of digital divide on energy poverty across the globe: The mediating role of income inequality. Energy Policy 2024, 195, 114349. [Google Scholar] [CrossRef]
- Peng, Z.; Dan, T. Digital dividend or digital divide? Digital economy and urban-rural income inequality in China. Telecomm. Policy 2023, 47, 102616. [Google Scholar]
- Babar, M.; Qureshi, B.; Koubaa, A. Review on Federated Learning for digital transformation in healthcare through big data analytics. Futur. Gener. Comput. Syst. 2024, 160, 14–28. [Google Scholar] [CrossRef]
- Chen, Y. Research on the impact of the digital economy on the level of industrial structure: An empirical study of 280 cities in China. PLoS ONE 2024, 19, e0298343. [Google Scholar] [CrossRef]
- Wu, T. Digital divide, social security, and relative poverty in Chinese households. Int. Rev. Econ. Financ. 2024, 96, 103716. [Google Scholar] [CrossRef]
- Scupola, A.; Zanfei, A. Governance and innovation in public sector services: The case of the digital library. Gov. Inf. Q. 2016, 33, 237–249. [Google Scholar] [CrossRef]
- Jiang, Y. Public service equalization, digital financial inclusion and the rural revitalization: Evidence from Chinese 283 prefecture-level cities. Int. Rev. Econ. Financ. 2024, 96, 103648. [Google Scholar] [CrossRef]
- Li, B.; Li, T.; Yu, M.; Chen, B. Can equalization of public services narrow the regional disparities in China? A spatial econometrics approach. China Econ. Rev. 2017, 44, 67–78. [Google Scholar] [CrossRef]
- Lyu, Y.; Xie, J.; Meng, X.; Wang, X. Digital economy and institutional dynamics: Striving for equitable public service in a digitally transformed era. Front. Public Health 2024, 12, 1330044. [Google Scholar] [CrossRef] [PubMed]
- King, S.; Cotterill, S. Transformational government? The role of information technology in delivering citizen-centric local public services. Local Gov. Stud. 2007, 33, 333–354. [Google Scholar] [CrossRef]
- Liu, W.; Tang, W.; Kang, Y. Research on the Integrated Development of Digital economy and Rural Society under the background of Common Prosperity. Front. Bus. Econ. Manag. 2023, 7, 199–204. [Google Scholar] [CrossRef]
- Zhou, L.; Zhang, S.; Zhou, C.; Yuan, S.; Jiang, H.; Wang, Y. The impact of the digital economy on high-quality agricultural development——Based on the regulatory effects of financial development. PLoS ONE 2024, 19, e0293538. [Google Scholar] [CrossRef]
- Yang, M.; An, Q.; Zheng, L. The Spatial Effect of Digital Economy Enabling Common Prosperity—An Empirical Study of the Yellow River Basin. System 2024, 12, 500. [Google Scholar] [CrossRef]
- Liu, C.; Yan, M.; Zhang, M. Digital Economy, Green Innovation and Urban-Rural Income Gap—Analysis Based on Prefecture-Level City Panel Data of China. J. Adv. Comput. Intell. Intell. Inform. 2024, 28, 845–853. [Google Scholar] [CrossRef]
- Wang, Y.Z.; Zhang, Z.T. Digital development and rural financial inclusion: Evidence from China. Res. Int. Bus. Financ. 2025, 73, 102637. [Google Scholar] [CrossRef]
- Wang, Z.; Liu, X.; Qin, Y.; Zhang, Y. How Rural Digitization Promote Coordinated Urban–Rural Development: Evidence from a Quasi-Natural Experiment in China. Agriculture 2024, 14, 2323. [Google Scholar] [CrossRef]
- Guan, H.; Guo, B.; Zhang, J. Study on the impact of the digital economy on the upgrading of industrial structures—Empirical analysis based on cities in China. Sustainability 2022, 14, 11378. [Google Scholar] [CrossRef]
- Li, Y.; Wang, X.; Zhu, Q.; Zhao, H. Assessing the spatial and temporal differences in the impacts of factor allocation and urbanization on urban–rural income disparity in China, 2004–2010. Habitat Int. 2014, 42, 76–82. [Google Scholar] [CrossRef]
- Im, D.K. The legitimation of inequality: Psychosocial dispositions, education, and attitudes toward income inequality in China. Sociol. Perspect. 2014, 57, 506–525. [Google Scholar] [CrossRef]
- Stein, E.W. The Digital Transformation of Agriculture: Industry 4.0 Advances in Hydroponic Vertical Farms. Digit. Transf. Soc. 2024, 7, 65. [Google Scholar]
- Barrett, C.B.; Reardon, T.; Swinnen, J.; Zilberman, D. Agri-food value chain revolutions in low-and middle-income countries. J. Econ. Lit. 2022, 60, 1316–1377. [Google Scholar] [CrossRef]
- Matthews, R.; Pendakur, R.; Young, N. Social capital, labour markets, and job-finding in urban and rural regions: Comparing paths to employment in prosperous cities and stressed rural communities in Canada. Sociol. Rev. 2009, 57, 306–330. [Google Scholar] [CrossRef]
- Kiviaho, A.; Toivonen, S. Forces impacting the real estate market environment in shrinking cities: Possible drivers of future development. Eur. Plan. Stud. 2023, 31, 189–211. [Google Scholar] [CrossRef]
- Sicular, T.; Ximing, Y.; Gustafsson, B.; Shi, L. The urban–rural income gap and inequality in China. Rev. Income Wealth 2007, 53, 93–126. [Google Scholar] [CrossRef]
- Deng, X.; Guo, M.; Liu, Y. Digital economy development and the urban-rural income gap: Evidence from Chinese cities. PLoS ONE 2023, 18, e0280225. [Google Scholar] [CrossRef] [PubMed]
- Xu, E.; Xiao, Z.; Wang, Z. Has the Pilot Project of Innovative Cities Increased Economic Growth? An Empirical Study Based on Chinese Cities. Reg. Sci. Environ. Econ. 2024, 1, 31–45. [Google Scholar] [CrossRef]
- Wang, J.; Wang, B.; Dong, K.; Dong, X. How does the digital economy improve high-quality energy development? The case of China. Technol. Forecast. Soc. Change 2022, 184, 121960. [Google Scholar] [CrossRef]
- Oloyede, A.A.; Faruk, N.; Noma, N.; Tebepah, E.; Nwaulune, A.K. Measuring the impact of the digital economy in developing countries: A systematic review and meta-analysis. Heliyon 2023, 9, e17654. [Google Scholar] [CrossRef]
- Wu, Y.; Wu, Y.; Guerrero, J.M.; Vasquez, J.C. A comprehensive overview of framework for developing sustainable energy internet: From things-based energy network to services-based management system. Renew. Sustain. Energy Rev. 2021, 150, 111409. [Google Scholar] [CrossRef]
- Chengoden, R.; Victor, N.; Huynh-The, T.; Yenduri, G.; Jhaveri, R.H.; Alazab, M.; Bhattacharya, S.; Hegde, P.; Maddikunta, P.K.; Gadekallu, T.R. Metaverse for healthcare: A survey on potential applications, challenges and future directions. IEEE Access 2023, 11, 12765–12795. [Google Scholar] [CrossRef]
- Lin, B.; Zhang, A. Digital finance, regional innovation environment and renewable energy technology innovation: Threshold effects. Renew. Energy 2024, 223, 120036. [Google Scholar] [CrossRef]
- Bernard, J.; Steinführer, A.; Klärner, A.; Keim-Klärner, S. Regional opportunity structures: A research agenda to link spatial and social inequalities in rural areas. Renew. Energy 2023, 47, 103–123. [Google Scholar]
- Gao, C.; Wang, Q. Does digital finance aggravate bank competition? Evidence from China. Res. Int. Bus. Financ. 2023, 66, 102041. [Google Scholar] [CrossRef]
- Zhang, Y.; Khan, S.U.; Swallow, B.; Liu, W.; Zhao, M. Coupling coordination analysis of China’s water resources utilization efficiency and economic development level. J. Clean. Prod. 2022, 373, 133874. [Google Scholar] [CrossRef]
- Tähtinen, L.; Toivonen, S.; Rashidfarokhi, A. Evading danger: The crisis impact framework for real estate. Int. J. Strateg. Prop. Manag. 2023, 27, 332–350. [Google Scholar] [CrossRef]
- Rahman, E.A.; Hamzah, F.M.; Latif, M.T.; Azid, A. Forecasting PM2.5 in Malaysia using a hybrid model. Int. J. Strateg. Prop. Manag. 2023, 23, 230006. [Google Scholar]
- Brand, A.; Drewes, E. Spatial targeting and economic development corridors. In Contemporary South Africa and the Political Economy of Regional Development; Routledge: London, UK, 2025; Volume 131. [Google Scholar]
- Lu, Y.; Zhang, J.; Mao, J.; Gao, S. Land financialization and debt expansion: Evidence from city–county mergers in China. Cities 2024, 146, 104679. [Google Scholar] [CrossRef]
- Heifetz, I.; Jaffe, P.G. Exploring the impact of industrialization on social mobility in rural com-munities: Towards inclusive and sustainable economic transformation. Law Econ. 2023, 17, 218–236. [Google Scholar] [CrossRef]
- Venkadavarahan, M.; Joji, M.S.; Marisamynathan, S. Development of spatial econometric models for estimating the bicycle sharing trip activity. Sustain. Cities Soc. 2023, 98, 104861. [Google Scholar] [CrossRef]
- Elhorst, J.P.; Lacombe, D.J.; Piras, G. On model specification and parameter space definitions in higher order spatial econometric models. Reg. Sci. Urban Econ. 2012, 42, 211–220. [Google Scholar] [CrossRef]
- Russell, A.D.; Tran, N.; Staub-French, S. Searching for value: Construction strategy exploration and linear planning. Constr. Manag. Econ. 2014, 32, 520–547. [Google Scholar] [CrossRef]
- Ge, H.; Tang, L.; Zhou, X.; Tang, D.; Boamah, V. Research on the effect of rural inclusive financial ecological environment on rural household income in China. Int. J. Environ. Res. Public Health 2022, 19, 2486. [Google Scholar] [CrossRef]
- Qiu, Z.; Chen, Y.; Han, H.; Wang, T. Research on Digital Technology to Promote Low-Carbon Transformation of Manufacturing Industries Under the Perspective of Green Credit: An Evolutionary Game Theory Approach. Sustainability 2024, 16, 11203. [Google Scholar] [CrossRef]
- Zhou, M.; Guo, F. Mechanism and spatial spillover effect of digital economy on common prosperity in the Yellow River Basin of China. Sci. Rep. 2024, 14, 23086. [Google Scholar] [CrossRef]
- Chen, L.; Zhang, Y. Does the development of the digital economy promote common prosperity?—Analysis based on 284 cities in China. Sustainability 2023, 15, 4688. [Google Scholar] [CrossRef]
- Prebisch, R. Capitalismo Periférico: Crisis y Transformación; Fondo de Cultura Económica: Mexico City, Mexico, 1981. [Google Scholar]
- Schumpeter, J.A. The Theory of Economic Development: An Inquiry into Profits, Capital, Credit, Interest, and the Business Cycle; Transaction Publishers: Piscataway, NJ, USA, 2017. [Google Scholar]
Disclaimer/Publisher’s Note: The statements, opinions and data contained in all publications are solely those of the individual author(s) and contributor(s) and not of MDPI and/or the editor(s). MDPI and/or the editor(s) disclaim responsibility for any injury to people or property resulting from any ideas, methods, instructions or products referred to in the content. |
© 2025 by the authors. Licensee MDPI, Basel, Switzerland. This article is an open access article distributed under the terms and conditions of the Creative Commons Attribution (CC BY) license (https://creativecommons.org/licenses/by/4.0/).