1. Introduction
Coal is a fundamental energy source and a crucial industrial raw resource [
1]. The coal mining process produces a large amount of dust. This poses a major risk to both the safety of mine operations and health of workers [
2]. The rate of pneumoconiosis acquisition among miners has increased in conjunction with the mechanization of mine production capacity and output growth [
3]. Furthermore, the frequency of dust explosion accidents has increased [
4]. Currently, coal seam water injection and dust spraying are the most widely adopted and effective dust control measures in mining operations. These methods reduce dust generation and decrease the amount of dust in the air by wetting the coal body [
5,
6]. Therefore, the wettability of coal dust is an important factor affecting the effectiveness of dust control [
7]. Water was originally employed as the medium for coal seam water injection and dust spraying. However, owing to the high surface tension of water and the hydrophobic characteristics of most coals, dust management has been ineffective [
8]. In addition, the current dust reduction technology will seriously pollute the underground water environment, which is not conducive to the sustainable development of the mine. To resolve these problems, the wettability of coal dust is generally improved by adding biochemical reagents to water [
9,
10], magnetizing water [
11], or charging water [
12]. Enhancing the wettability of the solution and decreasing the hydrophobicity of coal are the two primary goals of this research [
2,
5]. Many studies have been conducted on improving the wettability of solutions, and the results have been remarkable. In terms of reducing the hydrophobicity of coal, Zhang, Lin, Ni, Zheng, Wang, and Han et al. proposed methods to modify and moisturize coal by using surface-active ionic liquid [
13], acetone solution [
14], sodium chloride/sodium dodecyl sulfate complex solution [
15], acid fracturing fluid [
16], liquid CO
2–water cycle [
17], and compound reagent and liquid nitrogen freeze–thaw cycle combination, respectively [
18]. However, considering the effectiveness, economics, environmental protection, and other factors, a coal dust modification and wetting method that can be widely applied has not been developed.
Plasma is a macroscopically electrically neutral ionized gas composed of electrons, positive and negative ions, free radicals, ground- or excited-state molecules, and electromagnetic radiation quanta (photons). Using plasma-generating equipment, PAW can be created by discharging plasma onto the surface of water or underwater [
19,
20]. PAW contains numerous active groups and is highly reactive. It is widely used in food sterilization, material modification, environmental protection, biomedicine, and other fields [
21,
22]. PAW can break the chain groups on the substrate surface after infiltration, form free radicals and polar groups, and increase the free-energy and infiltration of the substrate surface [
23]. Additionally, it can remove the granular pollutants on the surface of the matrix through etching, alter the specific area and roughness of the matrix, and further affect the wettability of the matrix [
24].
Considering the significant advantages of a high chemical activity, zero pollution, and a simple preparation process for PAW, this paper proposes the generation of PAW using a dielectric blocking discharge device and injecting it into a coal seam. By utilizing the high chemical activity of PAW, the coal structure can be altered, the hydrophilicity of coal can be enhanced, and dust generation can be reduced. Additionally, coal dust modified and wetted by PAW is more likely to be trapped by ordinary spray water after being dispersed into the mine air, thus improving the dust control effect in both active and passive dust reduction. PAW also has a good bactericidal effect on the water environment underground in coal mines, making it a sustainable disaster management technology with high economic value.
The wettability of coal dust refers to the adhesion capability of a liquid on its surface when the liquid comes into contact with it. This is one of the basic properties of coal dust [
25]. From the perspective of thermodynamics and surface physicochemistry, wetting is the result of a decrease in free energy at the solid–liquid interface. From a mechanical perspective, wetting is the result of the attraction between the solid and liquid being higher than the repulsion force [
7]. Wettability is closely related to the organic and inorganic components of coal dust, surface functional groups, surface roughness, and pore structure [
26,
27,
28]. Macro-characterization methods for wettability include contact angle measurements, sedimentation tests, capillary rise tests, and droplet penetration tests. Contact angle measurement is a direct measurement method that can more directly reflect the wettability [
29]. The internal process of coal dust wettability modification can be examined from a micro perspective using the surface roughness and pore structure. This is currently a widely used wettability analysis approach [
16,
30,
31,
32]. Thus, to understand the modification effect of PAW on coal dust and reveal its internal mechanism, PAW was generated using a device designed and developed in-house. Then, coal dust was treated using PAW. The modification effect of PAW was determined from a macroscopic perspective using coal dust contact angle experiments. The mechanism by which PAW alters the hydrophobic properties of coal dust was revealed from the perspective of surface morphology and pore size structure using scanning electron microscopy (SEM) and specific surface area and pore size analysis (BET) experiments.
Since PAW is the first coal mine dust reduction technology proposed by the authors, the optimal effect and working principle of this technology are not yet clear. The research objective of this paper is to accurately reveal the dust reduction effect and mechanism of PAW, and on this basis determine the optimal operating parameters for coals with different degrees of metamorphism so as to achieve the best dust reduction effect with minimum energy consumption. The research results provide a theoretical basis for the application of this new dust reduction technology.
2. PAW Generator and Its Working Principle
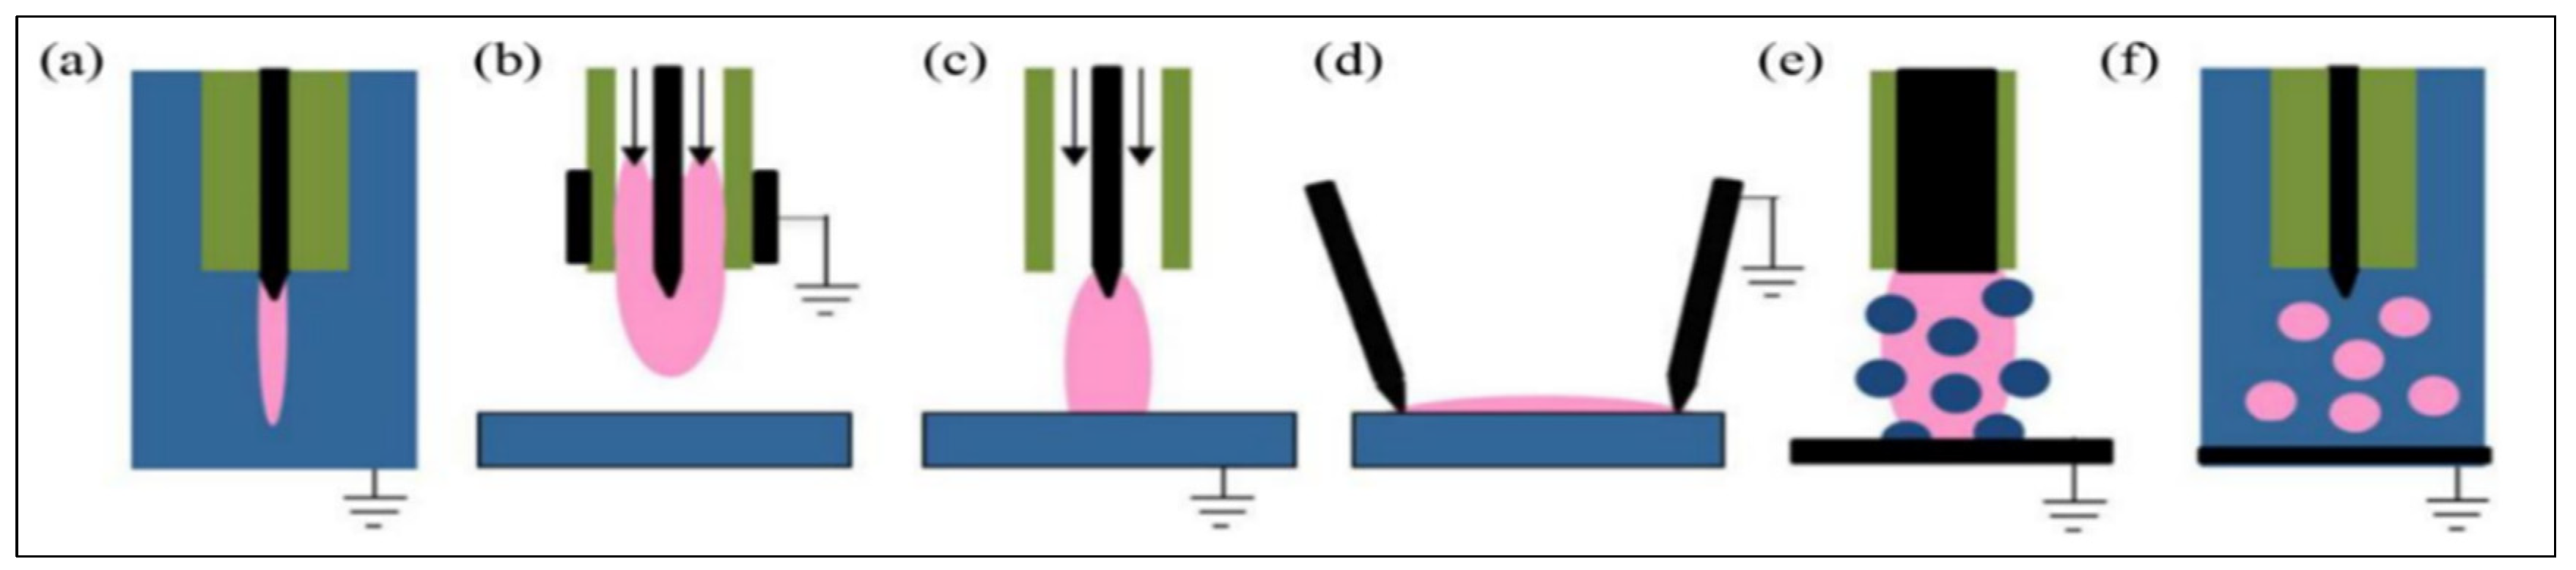
The interaction between atmospheric pressure, low-temperature discharge plasma, and liquids is a key research direction in the application of plasma science. Complex physical and chemical processes occur when plasma interacts directly or indirectly with liquids. Numerous high-energy electrons, excited-state particles, heavy ions, ultraviolet light, thermal effects, electromagnetic effects, and a profusion of reactive nitrogen and oxygen species are generated. Discharges used in plasma–liquid interactions can be classified into three categories: direct liquid-phase discharges, gas-phase plasmas producing reactivity in the liquid, and multi-phase plasmas.
Figure 1 shows the typical discharges used in plasma–liquid interactions [
33]. The liquid-phase discharge process is shown in
Figure 1a. The gas-phase discharges above the liquid surface include various forms such as a plasma jet without direct contact with the liquid (
Figure 1b), gas-phase plasma with a liquid electrode (
Figure 1c), and surface discharge (
Figure 1d). Multi-phase discharges mainly include gas-phase plasma with a dispersed liquid phase (aerosols) (
Figure 1e) and discharges in bubbles (
Figure 1f). The interaction between the plasma and liquid is a complex physicochemical process. During the plasma discharge, numerous reactive chemical substances are generated (
Figure 2). The majority of these compounds are reactive oxygen substances (ROSs) and active nitrogenous substances (RNSs), such as H
2O
2, ozone, hydroxyl radicals, superoxide anions, ONOO
−, NO
2−, and NO
3−. Furthermore, both types and concentrations of reactive substances are related to factors such as the gas composition and liquid properties used for preparing PAW. The production of reactive chemicals exerts a significant influence on indicators such as the redox potential and pH of PAW. Consequently, it can significantly affect the physicochemical characteristics of coal dust.
In this study, PAW was generated using a coaxial dual dielectric barrier discharge (DBD) reactor powered by a pulsed alternating current (AC) high-voltage power supply. Subsequently, the coal samples were treated with PAW, and the relevant experiments were conducted. The PAW generation system shown in
Figure 3 is based on a coaxial DBD reactor driven by a pulsed AC high-voltage power source. The three main subsystems of the equipment are the electrical diagnostic system, the coaxial dual dielectric barrier PAW treatment system, and the high-voltage power supply system. The output voltage of the experimental power supply ranged from 0 to 30 kV. The frequency of the sine wave was 8–20 kHz. The sine wave was modulated using a pulse controller. The output voltage of the voltage regulator is AC 0–250 V. The adjustable frequency range of the pulse controller is 1–1000 Hz, and the adjustable pulse duty cycle range is 1–99%.
(1) High-voltage power supply system: The system is mainly composed of a CTP-2000KP high-voltage power supply, a TDGC2-1 voltage regulator, and a PC-07 digital pulse modulator. A high-voltage AC power supply is the energy supply unit used to realize dielectric barrier discharge. It is composed of a power circuit and control circuit. The power circuit adopts an AC–DC–AC circuit structure. It mainly includes a pulse width modulation (PWM) rectifier circuit, a DC voltage regulating circuit, a high-frequency inverter circuit, an LC filter circuit, and a high-frequency boost circuit. A high-voltage AC power supply was configured to receive a single-phase 220 V AC input. Initially, the input underwent single-phase PWM thyristor rectification. This yielded a stable 400 V direct current (DC) voltage. Simultaneously, the power grid ensured a unity power factor. The 400 V DC voltage was then passed through a DC–DC voltage-regulating circuit after this rectification procedure. Consequently, a controlled DC voltage between 100 V and 400 V was produced. A full-bridge high-frequency inverter circuit received this controlled DC voltage and transformed it into an AC. A high-frequency, low-voltage, sinusoidal AC with a frequency of 20,000 Hz was generated after it was passed through an LC filter circuit. Finally, a high-frequency, high-voltage transformer was used to scale up this 20,000 Hz AC. The output of this transformer was a high-frequency high-voltage AC in the range of 5000–20,000 V. It was then employed to excite the low-temperature plasma.
(2) Coaxial dual dielectric barrier PAW generation system: This system is composed of a water tank, a water pump, a fan, and a water treatment reactor. To achieve this effect, the liquid to be treated travels through the plasma discharge area.
Figure 4 illustrates the basic structure. A vertical connection was established using an externally connected high-voltage line at the center of the upper portion of the dual-sleeve structure. A water inlet and two gas inlets were positioned strategically on the exterior of the upper structure. Polytetrafluoroethylene insulation sleeves, flow-equalizing sleeves, and flow-guiding sleeves were arranged sequentially from the outer layer to the inner layer. The flow sleeve was constructed from 304 stainless steel. Upon entering the water inlet, the tap water overflows through the guiding sleeve and enters the equalizing sleeve, where a consistent layer of water is formed. Different gaseous atmospheres can be introduced because of the two gas inlets. With a discharge gap of 150 mm, a discharge zone developed between the inner walls of the outer and inner quartz tubes. The treated liquid was then pumped into the water inlet. It created a steady and consistent flow as it passed through the flow-equalizing sleeve, discharged through the flow-equalizing orifice, traveled through the discharge area, and finally left the water outlet. The samples were stored for subsequent use after collection.
(3) Electrical diagnosis system.
An electrical diagnostic system was employed to monitor the applied pulsed voltage and discharge current during bubble discharge. The pulsed voltage was measured using a high-voltage probe (Tektronix P6015A, Nanjing, China, 1000×, 100 MΩ). The discharge current was measured with a current probe (Tektronix TDS5054B, Nanjing, China, 500 MHz). The pulsed voltage and discharge current signals were displayed and stored on a digital oscilloscope (Tektronix TDS5054B, 500 MHz). The output power of the power supply directly determined the ionization intensity. In the experimental system used in this study, the Lissajous figure method was adopted to determine the power output of the power supply. Its measurement principle is as follows. When discharge occurs,
measures the charge quantity
transferred by the discharge. Then, the current flowing through the circuit is as follows:
where
is the current in the discharge circuit, and
is the voltage across the measuring capacitor
.
is directly proportional to the charge quantity
of the measuring capacitor. Consequently, the discharge power is as follows:
where
is the discharge power,
is the power supply output voltage,
is the period, and the output frequency is
.
and
are added to the oscilloscope’s X-Y axis and can be obtained on a closed curve (a
Lissajous graph). The area of the closed curve is directly proportional to
. Let the oscilloscope’s X-axis sensitivity be
volts per cell, Y-axis sensitivity be
volts per cell, divider’s variable ratio be
, and area enclosed by the Lissajous graph be
. The discharge power is given as follows by Equation (2):
3. Experiments on Altering the Wettability of Coal Dust by PAW
3.1. Coal Samples
For the experiment, five coal samples from China with different degrees of metamorphism were selected. These included long-flame coal (CY) from Madoutou Coal Mine, gas coal (QM) from Baode Coal Mine, coking coal (JM) from Xiqu Coal Mine, meager coal (PM) from Wangjialing Coal Mine, and meager lean coal (PS) from Jingfang Coal Mine. The degree of metamorphism followed the order CY < QM < JM < PM < PS. Proximate and ultimate analyses of the experimental coal samples were performed using a DGFY-6000S automatic proximate analyzer and a vario macro cube elemental analyzer.
3.2. Experimental Scheme
(1) Coal sample preparation: Five types of coal samples with varying levels of metamorphism were selected from Shanxi, China: CY, QM, JM, PM, and PS. To create coal powder with a mesh size less than 200 mesh (0.074 mm), the coal samples were crushed and sieved.
(2) Preparation and physicochemical property analysis of PAW: The PAW generator was connected. The output voltage, frequency, power, and duty cycle were adjusted to 10.59 kV, 200 Hz, 269 W, and 50%, respectively, using a voltage regulator. According to Equation (3), the discharge power of the PAW generator was calculated as 288 W. A coaxial dual dielectric barrier reactor was filled with 1 L of tap water for circulation treatment. The duration of the treatment was recorded. The ionization intensity was determined based on the ionization time. The ionization time was set to 0 s, 270 s, 630 s, 900 s, 1260 s, 1530 s, and 1890 s. Seven types of PAW with ionization intensities of 0 kJ/L, 61.56 kJ/L, 143.64 kJ/L, 205.20 kJ/L, 287.28 kJ/L, 348.84 kJ/L, and 430.92 kJ/L were prepared. The hydrogen peroxide (H2O2), nitrate (NO3−), and nitrite (NO2−) contents and the oxidation-reduction potential (ORP) of PAW with different ionization intensities were analyzed using a Cary 60 ultraviolet spectrophotometer and an ST218 ORP detector.
(3) Contact angle experiment of coal dust after PAW treatment: The five distinct coal specimens characterized by varying levels of metamorphism were subjected to immersion in seven types of PAW featuring ionization intensities, namely, 0 kJ/L, 61.56 kJ/L, 143.64 kJ/L, 205.20 kJ/L, 287.28 kJ/L, 348.84 kJ/L, and 430.92 kJ/L. This procedure yielded 35 distinct experimental combinations. A 24 h period was allotted for the immersion procedure. The moist coal samples were removed and permitted to air-dry for a full day. The contact angle coal flakes were prepared using a YP-15 flake press with a coal powder mass of 250 mg, pressure of 20 MPa, and flake pressing time of 2 min. The contact angles of the coal samples after PAW treatment were measured using an SDC-350 integral tilt contact angle measuring instrument. The dried coal sheet was placed on the working table of the contact angle measuring instrument. The positions of the working table and syringe were adjusted to make the syringe and coal sheet appear clearly in the fixed position of the computer screen. Immediately before the liquid droplet dripped, the continuous shooting function of the software was activated to capture the instant when the droplet contacted the coal slice. The contact angle variation patterns of coal samples treated with PAW at varying ionization strengths were then ascertained.
(4) SEM of coal dust after PAW treatment: Ten combinations were produced by soaking the five varieties of pulverized coal indicated above (each with varying degrees of metamorphism) in two types of PAW with ionization intensities of 0 kJ/L and 205.20 kJ/L, respectively. The soaking procedure continued for a day. Subsequently, the wet coal samples were dried for 24 h at 30 °C in a vacuum drying oven. The surface morphology of coal dust was examined using a TESCAN MIRA LMS-type scanning electron microscope. Trace amounts of coal dust were selected from CY, QM, JM, PM, and PS. The coal dust samples were adhered uniformly to the copper plates using a conductive adhesive. The coal dust was then exposed to a 45 s gold-spraying treatment using an Oxford Quorum SC7620 sputter coater. The surface morphology of the coal dust was imaged using an SEM at an acceleration voltage of 3 kV. Thus, the evolution law of the meso-morphology of coal dust in coal samples after treatment with varying PAW ionization intensities was obtained. To minimize random shooting errors, multiple positions were selected randomly for scanning electron microscope shooting in each group of experiments. The magnifications for each shooting position were 2000×, 5000×, and 20,000×, respectively.
(5) Experiments on specific surface area and pore size of coal dust after PAW treatment: The above 5 types of coal powders with varying levels of metamorphism were soaked in 7 types of PAWs with ionization intensities of 0 kJ/L, 61.56 kJ/L, 143.64 kJ/L, 205.20 kJ/L, 287.28 kJ/L, 348.84 kJ/L, and 430.92 kJ/L (in total 35 combinations). The soaking time was set to 24 h. The soaked coal samples were then dried for 24 h in a vacuum drying oven with the temperature set at 30 °C. A Vc-Sorb 2800TP specific surface area and pore size analyzer (Beijing Jinaipu Technology Co., Ltd., Beijing, China) was used to perform the experiment. To remove the gas adsorbed on the coal dust surface, the experiment was primarily conducted in two steps. First, the coal dust was pretreated using heating and vacuum degassing techniques. Second, the low-temperature liquid nitrogen adsorption/desorption isotherm was determined. The experimental methods for high- and low-rank coals differ. Among these, for low-rank coals (the CY and QM samples), the degassing temperature was set at 110–120 °C, and the degassing time was 12 h. For high-rank coals (the JM, PM, and PS samples), the degassing temperature was set at 150 °C and the degassing time was 12 h. The entire testing process was controlled automatically by a computer. The values of parameters such as the specific surface area, pore volume, and pore size distribution of the experimental samples were obtained.
Figure 5 shows the entire experimental flow.
4. Results and Discussion
4.1. Physicochemical Properties of PAW
Figure 6 shows the variation of H
2O
2, NO
3−, and NO
2− in PAW with the ionization time. During the ionization process, a significant number of reactive chemicals including H
2O
2, NO
3−, and NO
2− are produced in water. With the extension of the ionization time, the concentration of H
2O
2 first increases and then decreases; that of NO
2− first increases, then decreases, and then increases again; and that of NO
3− increases continuously and conforms to a linear relationship with time (expressed as
y = 7.91231 + 0.17863x).
Figure 7 presents the analysis of the variation law of the redox potential of PAW during the ionization process and its stability. With the increase in ionization time, the ORP value continued to increase and conformed to the linear relationship
y = −77.26622 + 0.17282x with time, and the ORP value transformed gradually from a negative value to a positive one when the ionization time ranged from 270 to 630 s. After the ionization was terminated, the ORP value began to decrease gradually, but at a very slow rate.
All the compounds in an aqueous solution exhibit macroscopic oxidation-reduction characteristics, which are reflected in the ORP values. Stronger oxidizing properties are indicated by higher ORP values, whereas stronger reducing properties are indicated by lower ones. A positive ORP value indicates that the solution exhibits oxidizing properties, whereas a negative one indicates that the solution exhibits reducing properties. It is evident from the results shown in
Figure 6 and
Figure 7 that the oxidizing capability of PAW increased gradually after ionization. The variation in the concentration was largely consistent with the shift in ORP value. This indicates a significant impact on the physicochemical properties of PAW. The experimental equipment produced PAW rapidly, and the produced PAW exhibited exceptional stability. These experimental results provide a strong theoretical foundation for the use of PAW to alter coal seam wettability.
4.2. Effect of PAW on Coal Contact Angle
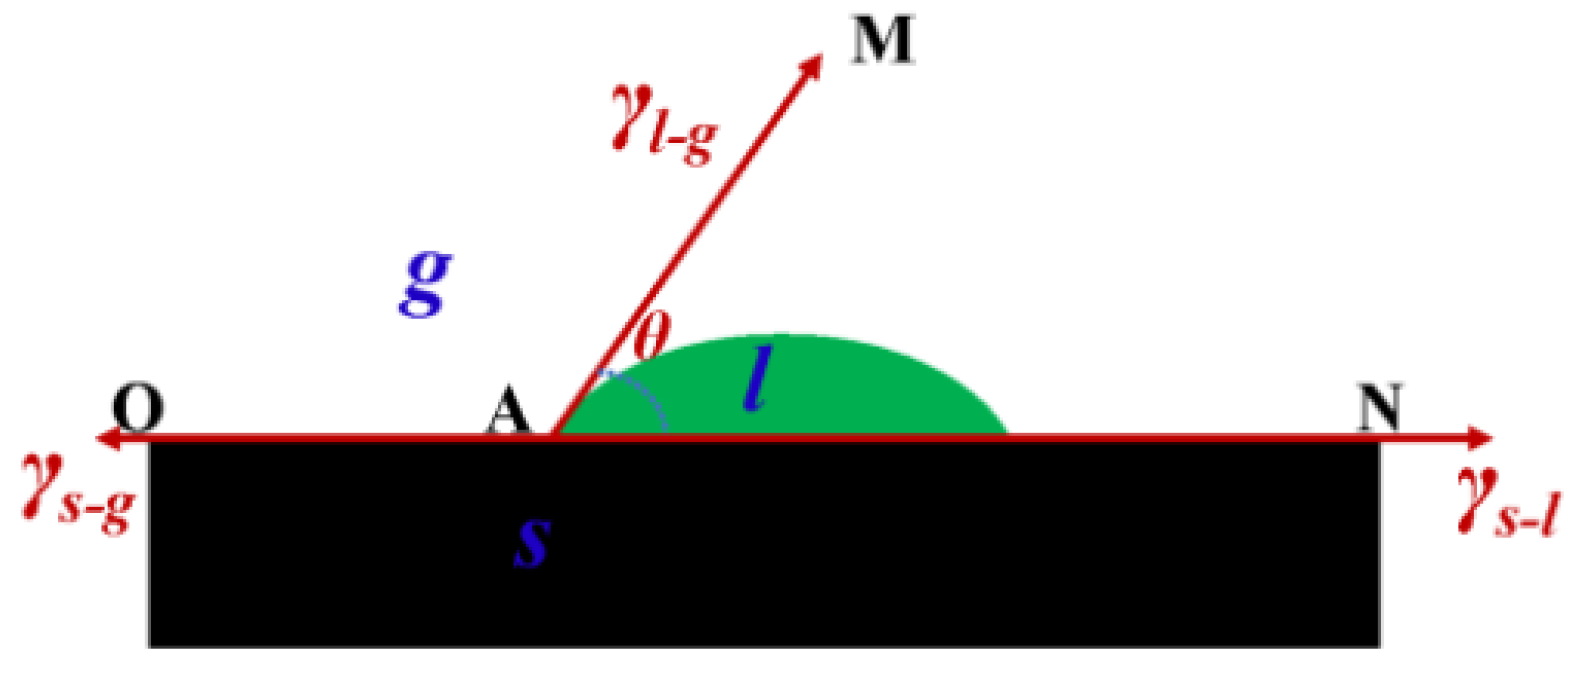
An important factor influencing the impact of dust suppression is wettability. The contact angle on the coal surface can be measured to straightforwardly ascertain the wettability of the coal [
29]. The magnitude of the contact angle is related to the solid–liquid, gas–liquid, and the gas–solid interfacial tensions in the system. At the intersection point of the gas–liquid–solid three-phase, a tangent line to the gas–liquid interface is drawn.
Figure 8 shows the schematic diagram of contact angle. The angle θ between this tangent line and the solid–liquid boundary line is the contact angle. The smaller the contact angle, the better the wettability of the coal dust. The calculation formula for the contact angle is
. In the formula,
represents the gas–solid interfacial tension,
N;
represents the solid–liquid interfacial tension,
N; and
represents the gas–liquid interfacial tension,
N. According to the magnitude of θ, the wetting of coal dust can be determined as follows:
, cos
= 1,
= 0° indicates complete wetting;
, 0 < cos
< 1,
< 90° indicates wetting; and
, cos
< 0, 90° <
θ < 180° indicates non-wetting.
Figure 9 shows the physical diagrams of the contact angle for the five coal samples with varying metamorphic levels after seven distinct strength PAW treatments.
Figure 10 and
Figure 11 present the correlation analysis of the contact angle with the industrial and elemental components of coal with varying metamorphic levels.
Figure 12 shows the variation rule of the contact angle of five coal samples with varying metamorphic levels after seven distinct strength PAW treatments.
In conjunction with
Table 1 and
Figure 10, it is evident that when the metamorphic level increased, the contact angle of the coal samples generally exhibited an increasing trend and their wettability increased progressively. The main reason for this is that with an increase in the degree of metamorphism, the proportion of hydrophobic macromolecular structures in the coal increases gradually. However, the contact angle of the PS sample with the highest degree of metamorphism was not the maximum value. This was mainly because of the higher mineral ash content in PS, which played a role in improving the wetting effect. Therefore, the wettability of coal is closely related to the degree of coal metamorphism and has an important relationship with its corresponding coal-forming environment [
34]. Without the PS, a linear relationship existed between the contact angle and the dry ash-free volatile matter: V
daf y = 133.37646 − 1.70954x. Furthermore, the index correlation
y = 0.02098 × exp(x/9.81679) + 63.85603 existed with the fixed carbon FC
d of the air-dried base. In all the metamorphic-grade experimental coal samples, a linear relationship existed between the contact angle and C content:
y = −56.55234 + 1.815x. The above results reveal a strong correlation between C contents in the elemental analysis. Furthermore, the relationship between these is not affected by variations in coal ash and other factors.
Figure 12 shows that following PAW treatments of varying intensities, the contact angles of the coal samples with varying metamorphic levels varied considerably. PAW has the dual impact of increasing and decreasing the contact angles in addition to the PS samples. The minimum values of the contact angle for CY, QM, JM, PM, and PS appeared at PAW intensities of 0 kJ/L, 143.64 kJ/L, 287.28 kJ/L, 143.64 kJ/L, 348.84 kJ/L, and 205.20 kJ/L, respectively. These corresponded to maximum decreases of 17.2%, 29.1%, 23.6%, 33.8%, and 43.1%, respectively. PAW significantly increased the wettability of coal dust. Different levels of metamorphism in coal samples resulted in varying optimum ionization intensities. The impact of PAW on improving the wettability of coal dust increased with the metamorphic degree.
4.3. Effect of PAW on the Surface Morphology of Coal Dust
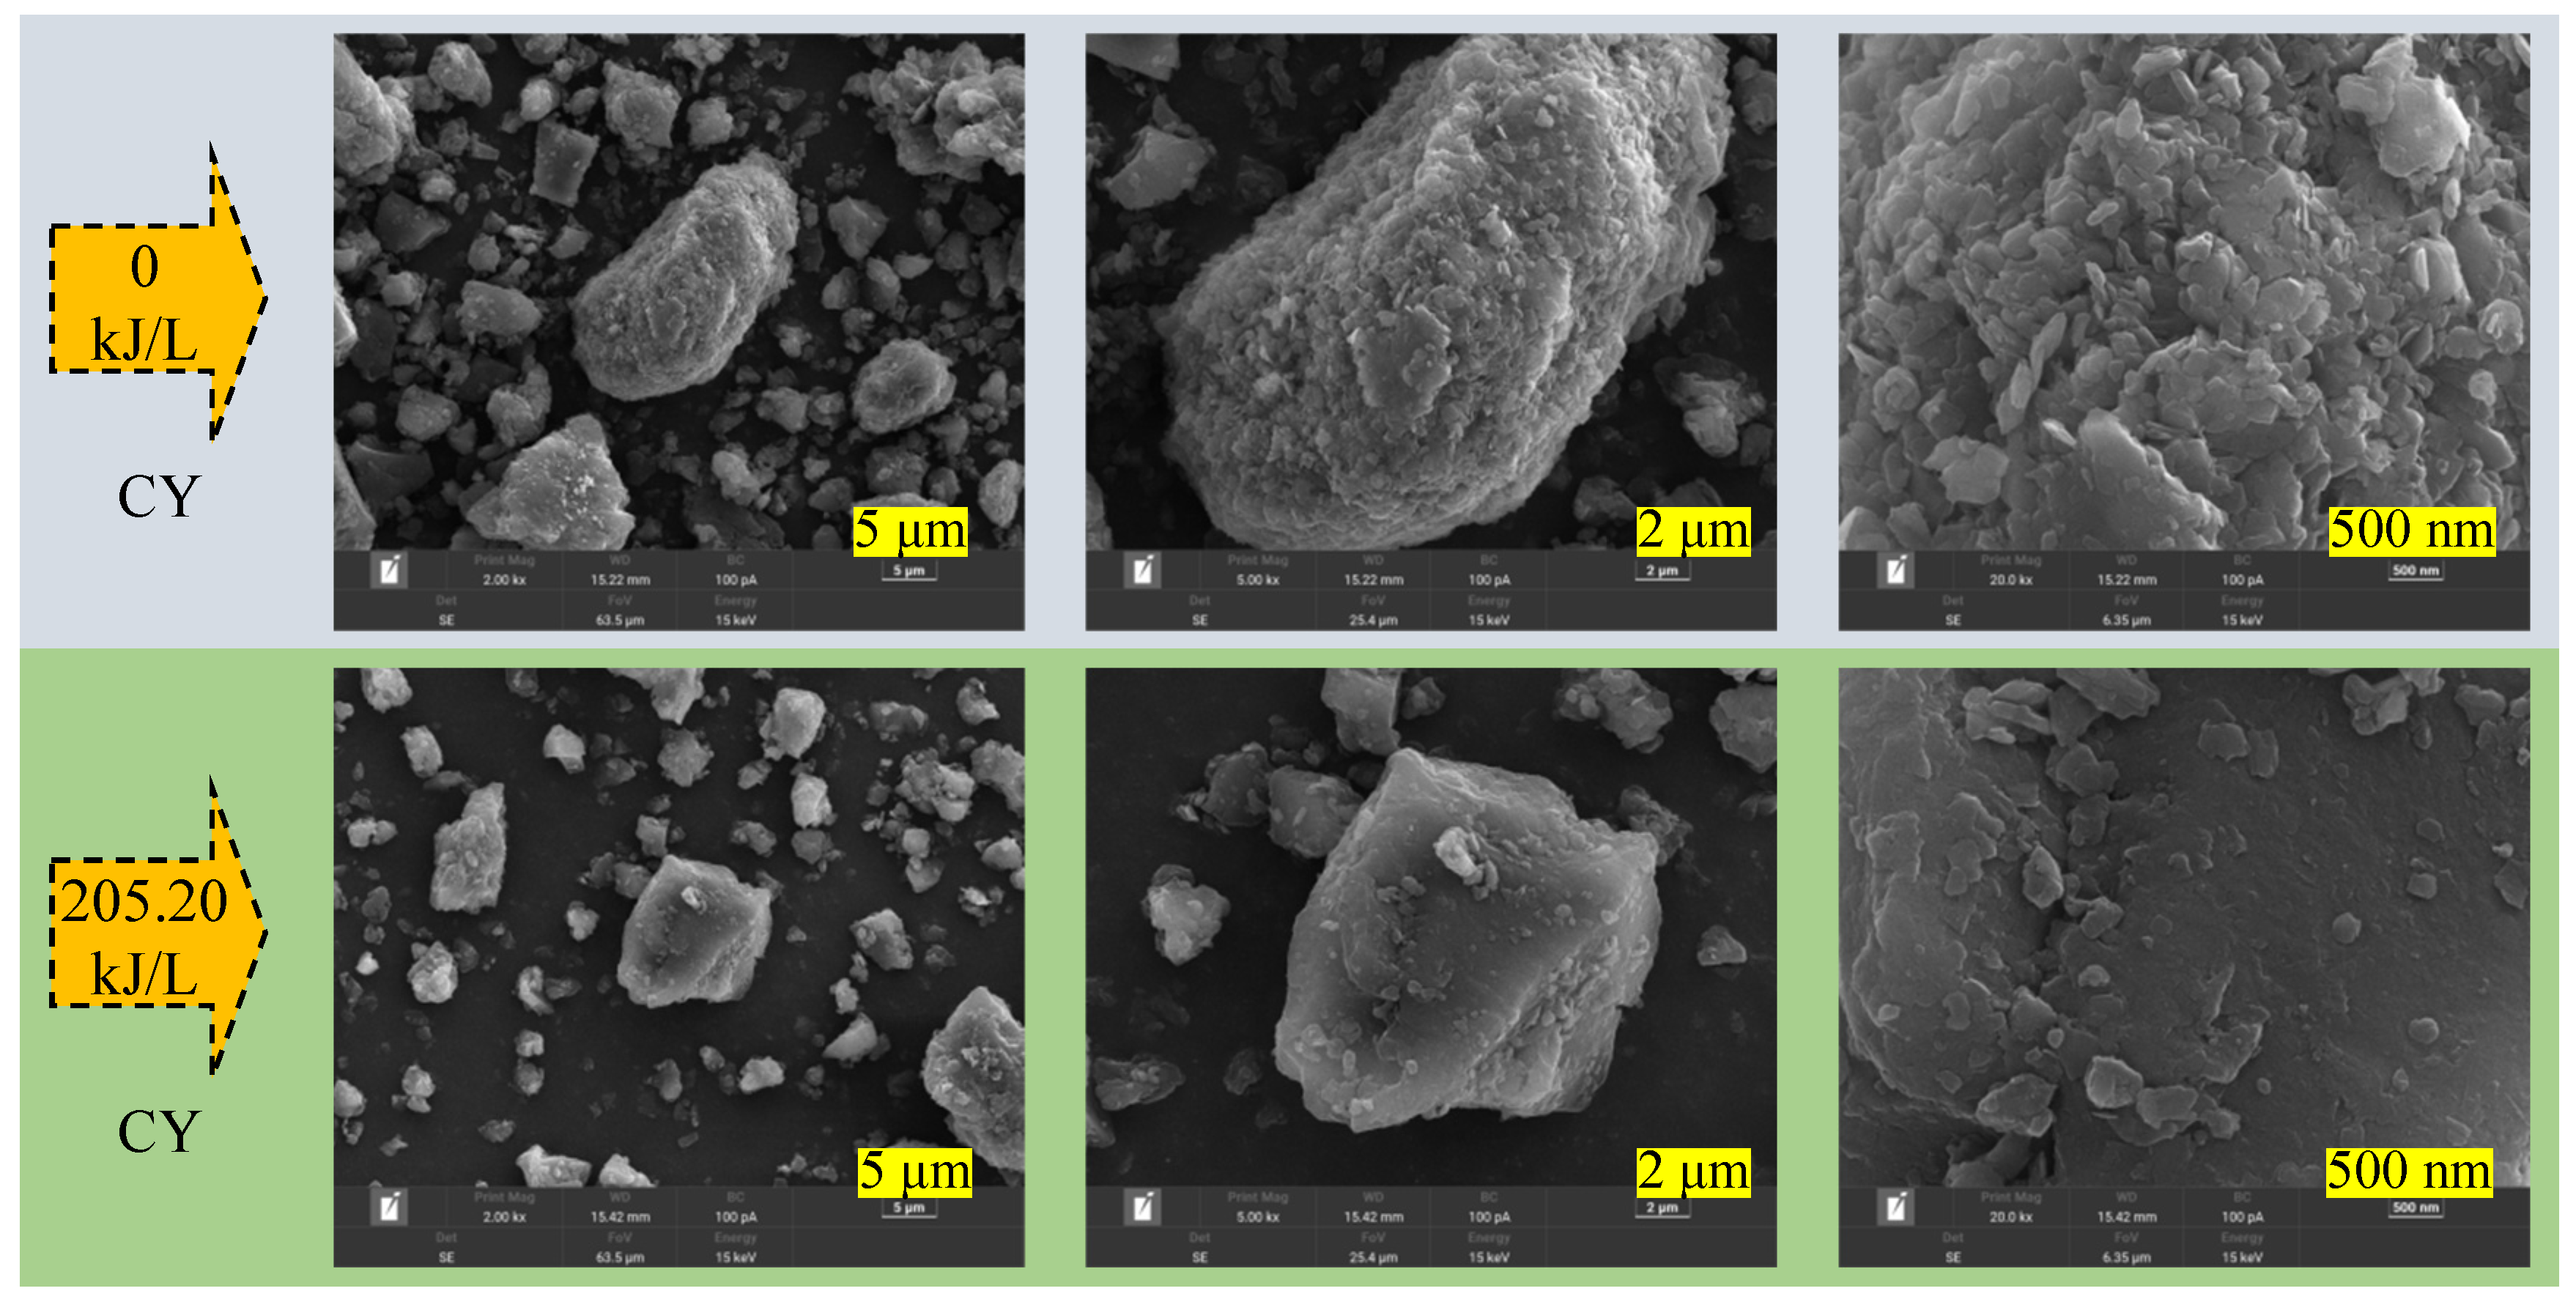
SEM tests were performed on the coal samples of CY, QM, JM, PM, and PS both before and after PAW treatment, in accordance with the experimental plan mentioned previously. For each sample, three images at different magnifications (2000×, 5000×, and 20,000×) were scanned according to the actual situation, and the surface morphology of the coal samples was observed and analyzed. The results are shown in
Figure 13,
Figure 14,
Figure 15,
Figure 16 and
Figure 17, respectively.
The scanning results show that the coal samples with varying metamorphic levels had distinct surface morphologies. The photographs (2000×) show that the particle size of CY and QM dust was relatively dispersed under the same crushing conditions. The edges and corners of the coal dust particles were comparatively rounded, and particles of various sizes were placed alternately. However, a higher percentage of large-sized coal dust particles existed in the JM, PM, and PS dust samples, and their particle sizes were more concentrated. The roundness of the surface of the coal dust particles decreased, and apparent adhesion structures were observed among multiple coal dust particles. Focusing on the scanning position of a single coal dust particle, the magnified image shows that the surfaces of the CY, QM, and PS dust particles were relatively smooth, whereas those of the JM and PM dust particles had longitudinal and transverse grooves. The internal pore and fissure morphologies of the coal dust particles were obtained by magnifying individual coal dust particles 20,000×. The surfaces of the JM and PM dust particles appeared to be rougher than those of the other coal samples. Furthermore, a large number of interlaced microfissures and pores with complex fissure assemblage morphology existed. Meanwhile, the surfaces of the CY, QM, and PS dust particles were relatively flatter, and the distributions of microfissures and pores were relatively fewer.
The surface morphology of coal dust with five degrees of metamorphism (CY, QM, JM, PM, and PS) varied significantly after PAW treatment with an intensity of 205.20 kJ/L. For the group of coal dust particles, the particle sizes of the five metamorphic grades of coal dust (CY, QM, JM, PM, and PS) became more dispersed after PAW treatment. The degree of adhesion between the particle sizes reduced. This indicated that PAW succeeded in significantly breaking the interparticle bonding. For individual coal dust particles, the surfaces of the five metamorphic levels of coal dust (CY, QM, JM, PM, and PS) became relatively flat from the original non-uniform morphology after the PAW treatment. After the clean water treatment, the surfaces of coal dust with five levels of metamorphism showed a non-uniform three-dimensional spatial distribution. Meanwhile, the PAW treatment caused the surfaces of coal dust with different degrees of metamorphism to show an approximate two-dimensional planar distribution. The pore structure of a single coal dust particle may be broken completely by PAW. The damaged coal body can rapidly obstruct the initial primary, exogenous, metamorphic, and mineral pores. Following the PAW treatment, the surface fissures of the individual coal dust particles became visible. This was because the smooth surface of the particles revealed fissures, whereas the concave–convex shape of the particles obscured their distribution on the surface prior to treatment. The variations in the surface morphology of coal dust after PAW treatment can explain the main reason for the decrease in the contact angle of coal dust. That is, PAW smoothens the coal dust and improves its wettability.
4.4. Effect of PAW on the Adsorption Isotherm of Low-Pressure N2 Gas in Coal Dust
In this section, the impact of PAW on the pore structure of coal dust is examined quantitatively using physical adsorption analysis. This is because SEM can only qualitatively reveal the morphological properties of the coal dust surface. An adsorption isotherm describes the relationship between the adsorbate and pressure in a system at equilibrium and constant temperature. The resulting curve is also known as adsorption isotherm. The nitrogen adsorption process from the coal samples falls under the category of physical adsorption, which is distinguished by a higher rate of adsorption than chemical adsorption.
In 1940, Brunauer, Deming, Deming, and Teller divided adsorption isotherms into five classes called BDDT classifications (Brunauer adsorption isotherms) based on previous studies [
35]. In 1985, the International Union of Pure and Applied Chemistry (IUPAC) classified the adsorption isotherms of porous materials into six categories [
36]. Subsequently, in the most recent IUPAC specification in 2015 [
37], the types of adsorption isotherms were added with two sub-branches from the initial six categories. That is, there are eight types of adsorption isotherms in the most recent specification. These are mainly refined for the types of micropores and mesopores, which are shown in
Figure 18.
The low-pressure N
2 (77 K) adsorption isotherms of five coal samples with five levels of metamorphism (CY, QM, JM, PM, and PS) after seven PAW treatments with ionization intensities of 0 kJ/L, 61.56 kJ/L, 143.64 kJ/L, 205.20 kJ/L, 287.28 kJ/L, 348.84 kJ/L, and 430.92 kJ/L are shown in
Figure 19. The adsorption isotherms of the coal samples and the IUPAC classification criteria reveal that the adsorption isotherms of coal could be regarded as class IV(a) [
37]. After the PAW treatment, the N
2 adsorption of the coal samples varied dramatically. This indirectly indicated that PAW altered the pore structure properties of coal dust. The next section presents a quantitative analysis of the impact of PAW on the specific surface area, pore size, and pore volume of coal dust.
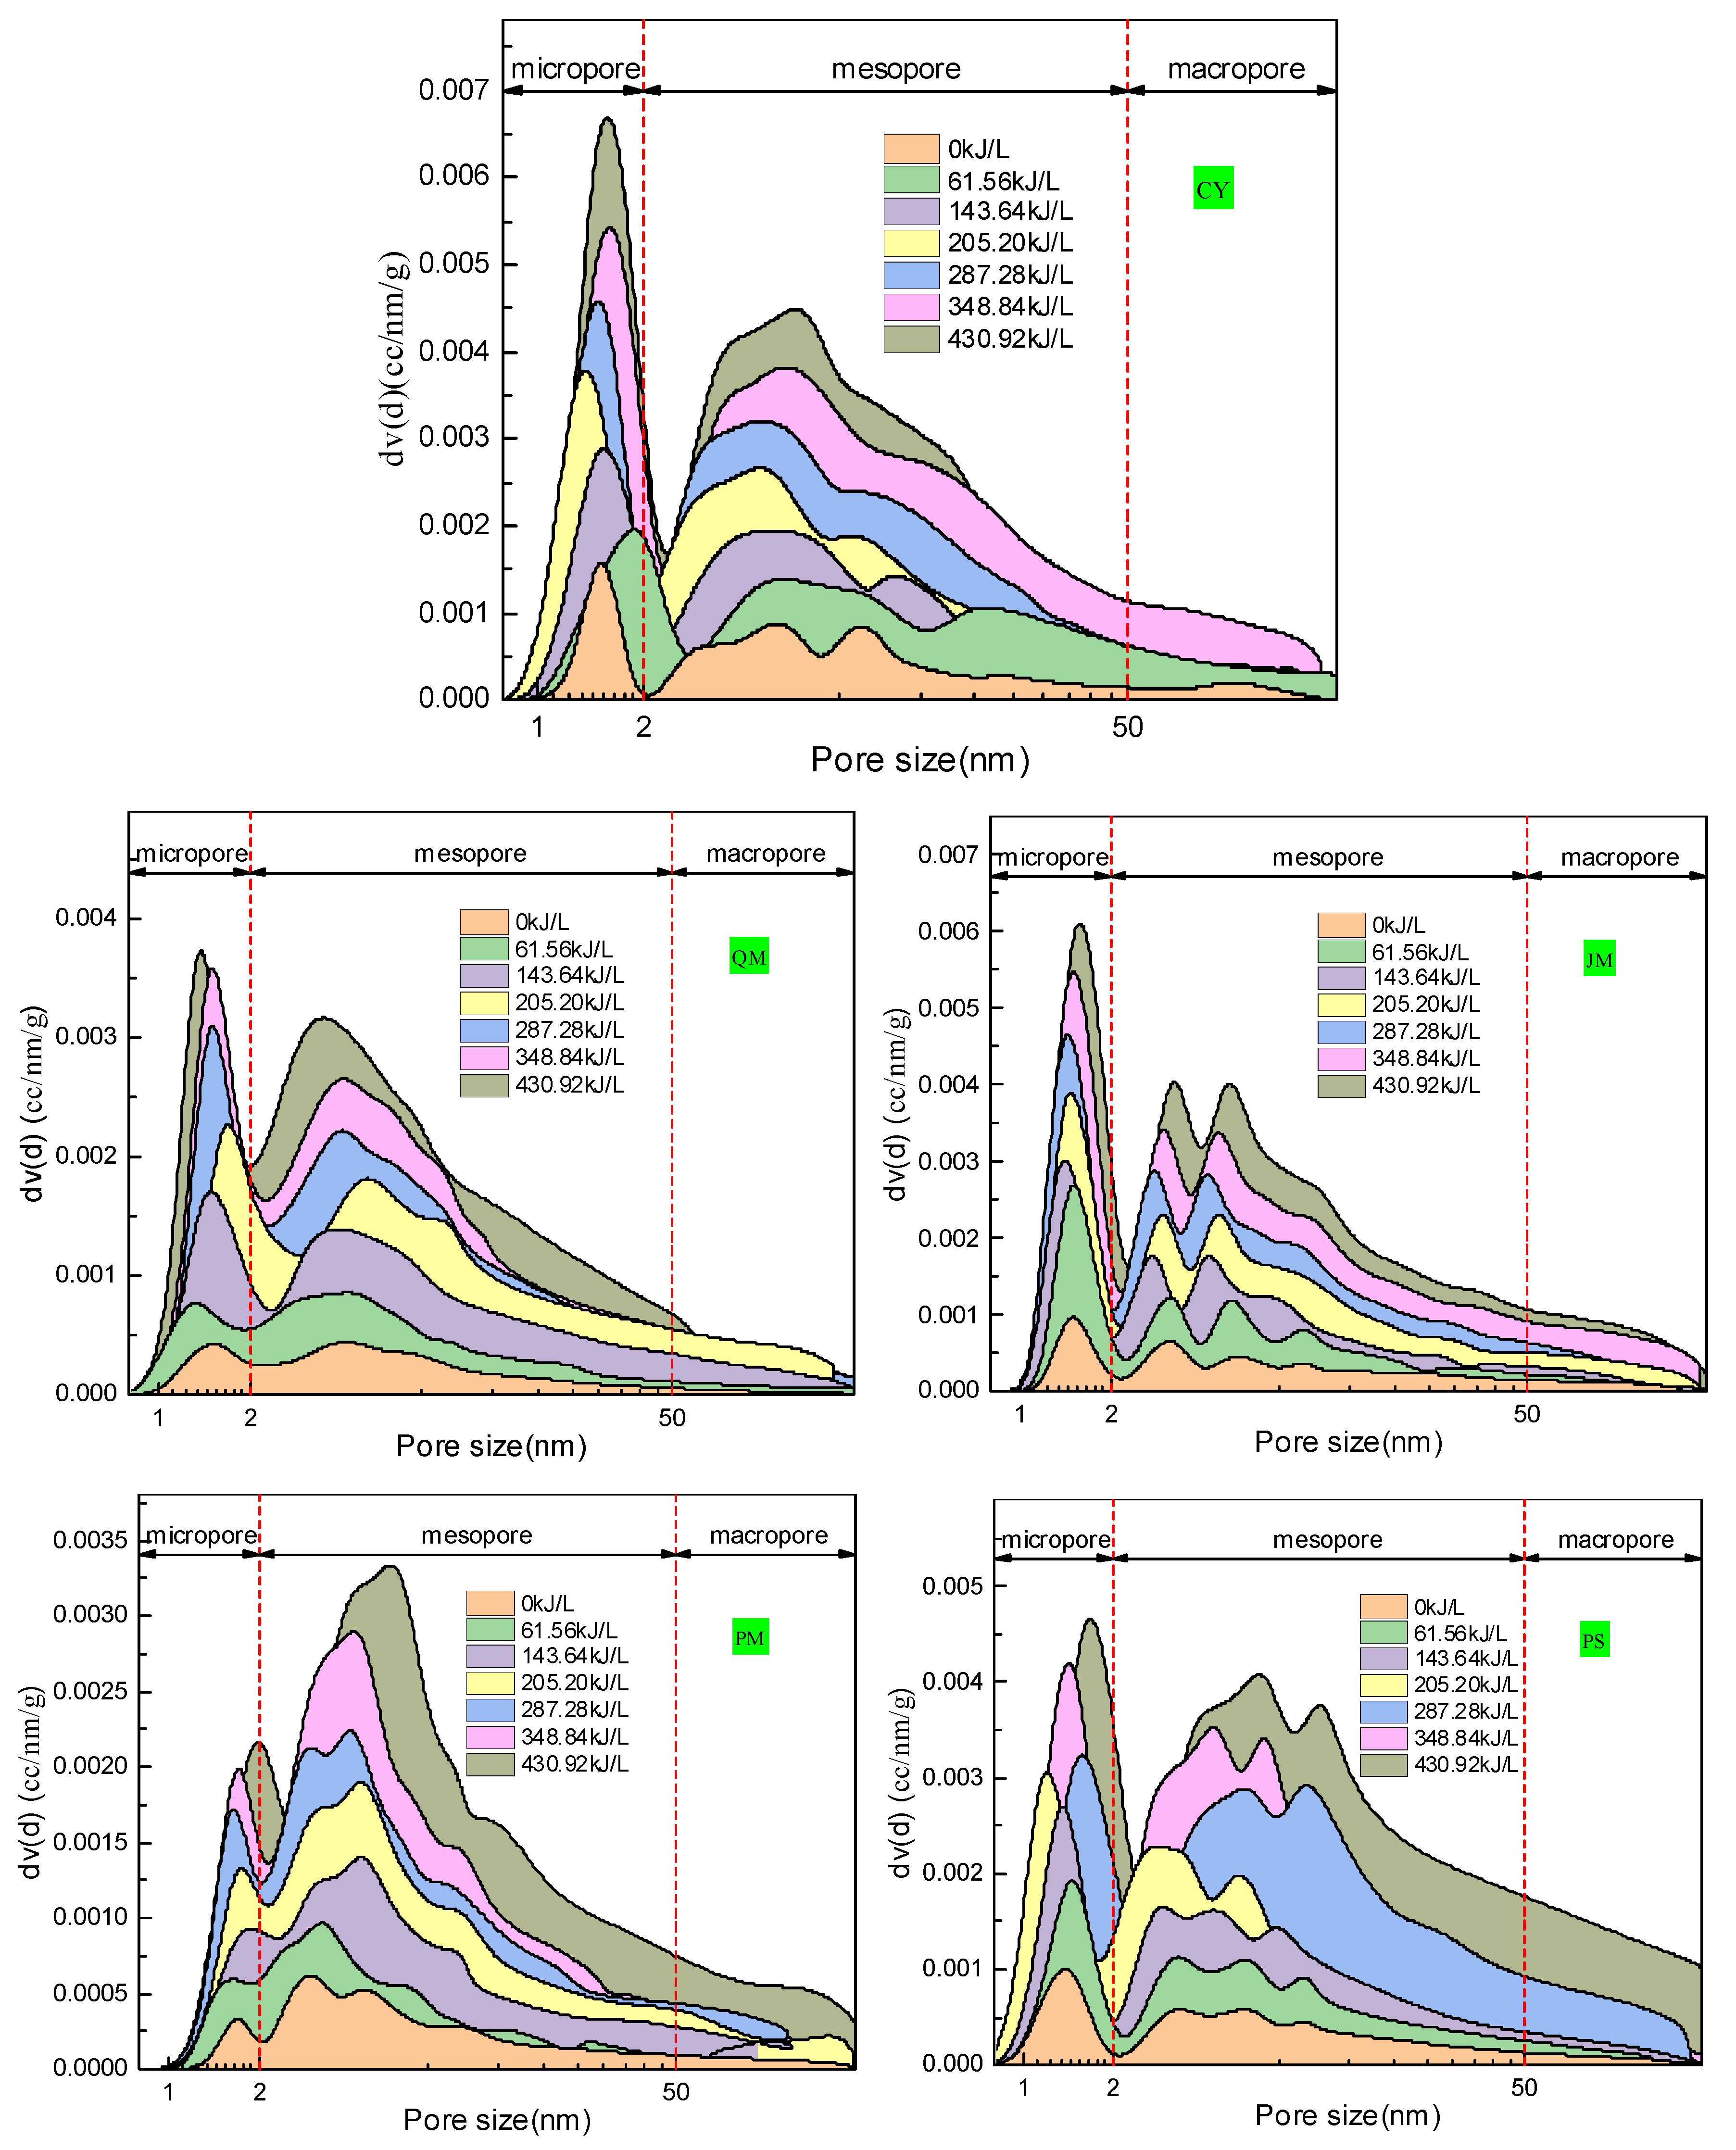
4.5. Effect of PAW on Pore Diameter of Coal
Based on the adsorption isotherm results and using the DFT and Barrett–Joyner–Halenda (BJH) methods, the pore-size distribution characteristics of the coal sample were obtained (
Figure 20). Micropores were analyzed using the DFT method; mesopores of 2–10 nm and 10–50 nm were analyzed using the DFT and BJH methods, respectively; and macropores above 50 nm were analyzed using the BJH method. The pore size distribution curves demonstrate that each coal sample’s pore size distribution has multiple peaks and that the peak shape characteristics of the various coal samples differ significantly from one another. This indicates that the coal has a highly complex pore structure.
As shown in
Figure 20, within the micropore range, a “single peak” exists between 1 and 2 nm in the CY, QM, JM, PM, and PS metamorphic samples. When unaffected by PAW (clear water treatment), the peaks of CY, JM, and PS are steeper, whereas those of QM and PM are more moderate. This indicates that the pore size distributions of CY, JM, and PS were more centralized between 1 and 2 nm, whereas those of QM and PM were more dispersed. After PAW treatment with varying intensities, the pore size distribution curves in the microporous range are still “single-peak.” The peaks increase gradually with the increase in ionization intensity, and the regularity is strong. The peaks of the coal dusts with varying levels of metamorphism are stringently positively correlated with the ionization intensity. As the ionization intensity increases, the position of the single peak in the microporous range shifts significantly, and the size of the maximum peak corresponding to the pore size shows an overall positive correlation with the PAW intensity. The aforementioned phenomena show that PAW can alter the microporous volume of coal dust with varying degrees of transformation. However, it does not affect the general trend of the pore size distribution. Within the mesoporous range, multiple peaks were observed for the coal samples with varying levels of metamorphism. Among these, JM and PS showed a highly significant “three peak” feature. Meanwhile, CY, QM, and PM also displayed a “three peak” contour. However, the peaks were not sufficiently prominent and overall “single peak” still dominated.
After treatment with varying PAW intensities, the peak structure of the pore size distribution curve in the mesoporous range did not vary significantly. However, as the ionization intensity increased, the peak gradually increased and exhibited a strong regularity. The peak values of coal dust with different degrees of metamorphism are positively correlated with the ionization intensity range. The location of each peak within the mesoporous range varies significantly as the ionization intensity increases. The size of the pores that correspond to the highest peak has a positive correlation with the PAW intensity. The aforementioned phenomena indicate that although PAW cannot alter the general trend of the pore size distribution, it can considerably alter the mesoporous volume of coal dust with varying degrees of transformation. There was no perceptible peak structure in coal dust with varying degrees of metamorphism in the 50–200 nm range. This indicates that the macropores in this range were not the primary concentrated region of the coal dust pore size. Although PAW can alter the peak areas of various pore diameters, it can also alter the pore structure in the 50–200 nm range.
To better understand the impact of PAW on the distribution of coal pore sizes, the results of the low-pressure N
2 (77 K) adsorption method were summarized and analyzed. The resulting coal samples with micro- and macropores after treatment with different strengths of PAW were obtained (
Table 2) in conjunction with the mesopore and macroporous pore volumes of the coal samples after PAW treatment with different intensities. The coal sample pore size distribution curve can intuitively reflect the distribution trend of different pore sizes and volumes of coal with different degrees of metamorphism after treatment with different PAW strengths. However, it is infeasible to quantify.
As shown in
Table 2, significant variations were observed in the micropores, mesopores, and macropores of coal with different degrees of metamorphism after treatment with PAW of varying strengths. The effect of PAW on the pore volume of coal micropores, mesopores, and macropores was significant, although with significant differences. Moreover, the relationship between the effect and the ionization intensity was not stringently linear.
Although
Table 2 can accurately reflect the modification effect of PAW on coal micropores, mesopores, and macropores, it is difficult to directly reflect the impact of pore size variations on coal dust wettability. Given that the wettability of coal dust is influenced by multiple factors such as micropores, mesopores, and macropores, these factors should be analyzed further quantitatively to determine the modification effect of PAW on the wettability of coals with different degrees of metamorphism.
4.6. Effect of PAW on Specific Surface Area of Coal
The specific surface area distribution is a crucial indicator of the extent of pore development.
Figure 21 displays the specific surface area distribution curves of the coal samples following PAW treatment with varying strengths, based on the pore size distribution analysis. As shown in
Figure 21, within the micropore range, a “single peak” exists between 1 and 2 nm for the CY, QM, JM, PM, and PS metamorphic samples. After PAW treatment with varying intensities, the specific surface area distribution curves in the microporous range remain “single peak.” With the increase in ionization intensity, the peaks gradually increase with strong regularity, and the peaks of coal dusts with varying levels of metamorphism are stringently positively correlated with the ionization intensity. With an increase in ionization intensity, the single peak position in the range of micropores shifts significantly. Overall, the pore size corresponding to the maximum peak is positively correlated with the PAW intensity. This demonstrates that although PAW can alter the specific surface area of coal dust to varying degrees, it does not affect the general pattern of the distribution of the specific surface area across pore sizes. Within the mesoporous range, except for JM showing an evident “double peak,” the peak positions of the other coal samples are relatively concentrated. This is significantly different from the pore size distribution of the coal samples in
Figure 20.
The peak values of coal dust with varying degrees of metamorphism are strongly positively correlated with the ionization intensity range, and the peak structure of the mesoporous-range specific surface area distribution curve does not vary significantly after PAW treatment of varying intensities. However, the peak value increases gradually and shows strong regularity as the ionization intensity increases. The location of each peak within the mesoporous range varies significantly as the ionization intensity increases. The size of the pores that correspond to the highest peak is positively correlated with the PAW intensity. According to the aforementioned phenomenon, PAW can significantly alter the mesoporous specific surface area of coal dust with different degrees of transformation. However, it cannot alter the overall trend of the specific surface area distribution. For the 50–200 nm macropores, no discernible peak structure is observed for coal dust with varying levels of metamorphism. This indicates that the macropores in this range were not the main concentration area of the coal dust specific surface area. PAW cannot alter the specific surface area distribution structure within the range of 50–200 nm. However, it can alter the peak area of different pore sizes.
The specific surface area distribution curve of the coal samples directly reflects the distribution trend of the specific surface areas of different pore sizes after PAW treatment with different intensities. However, it cannot be quantified. The results of the coal specific surface area based on the low-pressure N
2 (77 K) adsorption method were compiled and examined to determine the effect of PAW on the distribution of the specific surface area of coal. The variation patterns of micropores, mesopores, macropores, and BET specific surface area of coal samples treated with different strengths of PAW were obtained, as shown in
Table 3. The table reveals significant variations in the micropores, mesopores, and macropores of coal with different degrees of metamorphism after treatment with PAW of varying strengths.
The specific surface areas of the coal samples were dominated by mesopores, followed by macropores and micropores. In particular, the range of micropores obtained based on low-pressure N2 (77 K) adsorption is between 1 and 2 nm. Therefore, the fact that both the peak area of the micropore pore size and specific surface area distribution of coal samples are smaller than those of mesopores may be a result of the measurable pore size range. The effect of PAW on the specific surface areas of coal micropores, mesopores, and macropores was significant, although with considerable differences. The relationship between the effect and ionization intensity was not stringently linear. The specific surface area of macropores in coals with varying turnout levels was most significantly affected by PAW. The specific surface areas of wettability and coal dust generally correlate well. The common consensus is that wettability decreases with an increase in the specific surface area.
Although
Table 3 accurately reflects the modification effect of PAW on coal micropores, mesopores, macropores, and BET specific surface area, it is difficult for an individual quantitative index to directly reflect the influence of specific surface area variation on coal dust wettability. Further quantitative multifactorial analyses were conducted to ascertain the modification effect of PAW on wettability in terms of the specific surface area alteration. This was because coal dust wettability is influenced by a combination of microporous, mesoporous, macroporous, and BET specific surface area factors.
4.7. Effect of PAW on Fractal Dimension of Coal
Fractal theory was first formally proposed and formulated by Mandelbrot in 1975. It was subsequently developed to investigate the properties and uses of fractals [
38,
39,
40]. According to earlier research, the fractal theory can be applied to quantitatively characterize the surface roughness and pore architecture of porous media such as shale and coal. Additionally, it can clarify how the pore surface, pore volume, and gas storage capacity relate to one another [
41,
42]. The highly effective multifractal approach is better equipped to describe the features of the pore size distribution. At present, the Frenkel–Halsey–Hill (FHH) model is utilized frequently by scholars worldwide to calculate the fractal dimension of coal [
43]. The relationship between the pore adsorption, relative equilibrium pressure, and fractal dimension, as determined by low-pressure N
2 (87 K) adsorption, is given by Formula (4). Under relatively high coverage conditions, the interface is controlled by the liquid–gas surface tension. This causes the interface to be farther from the surface, thereby reducing the interface area. In such cases, Formula (5), which is as follows, is used to calculate the fractal dimension [
44,
45,
46,
47]:
where
P is the equilibrium pressure of adsorption, MPa;
P0 is the saturated vapor pressure of adsorption, MPa;
V is the molecular adsorption capacity, mL/g;
Vm is the monolayer adsorption capacity and can be calculated based on the BET theory, mL/g; the constant is dimensionless;
A is the fractal dimension factor; and
DF is the fractal dimension.
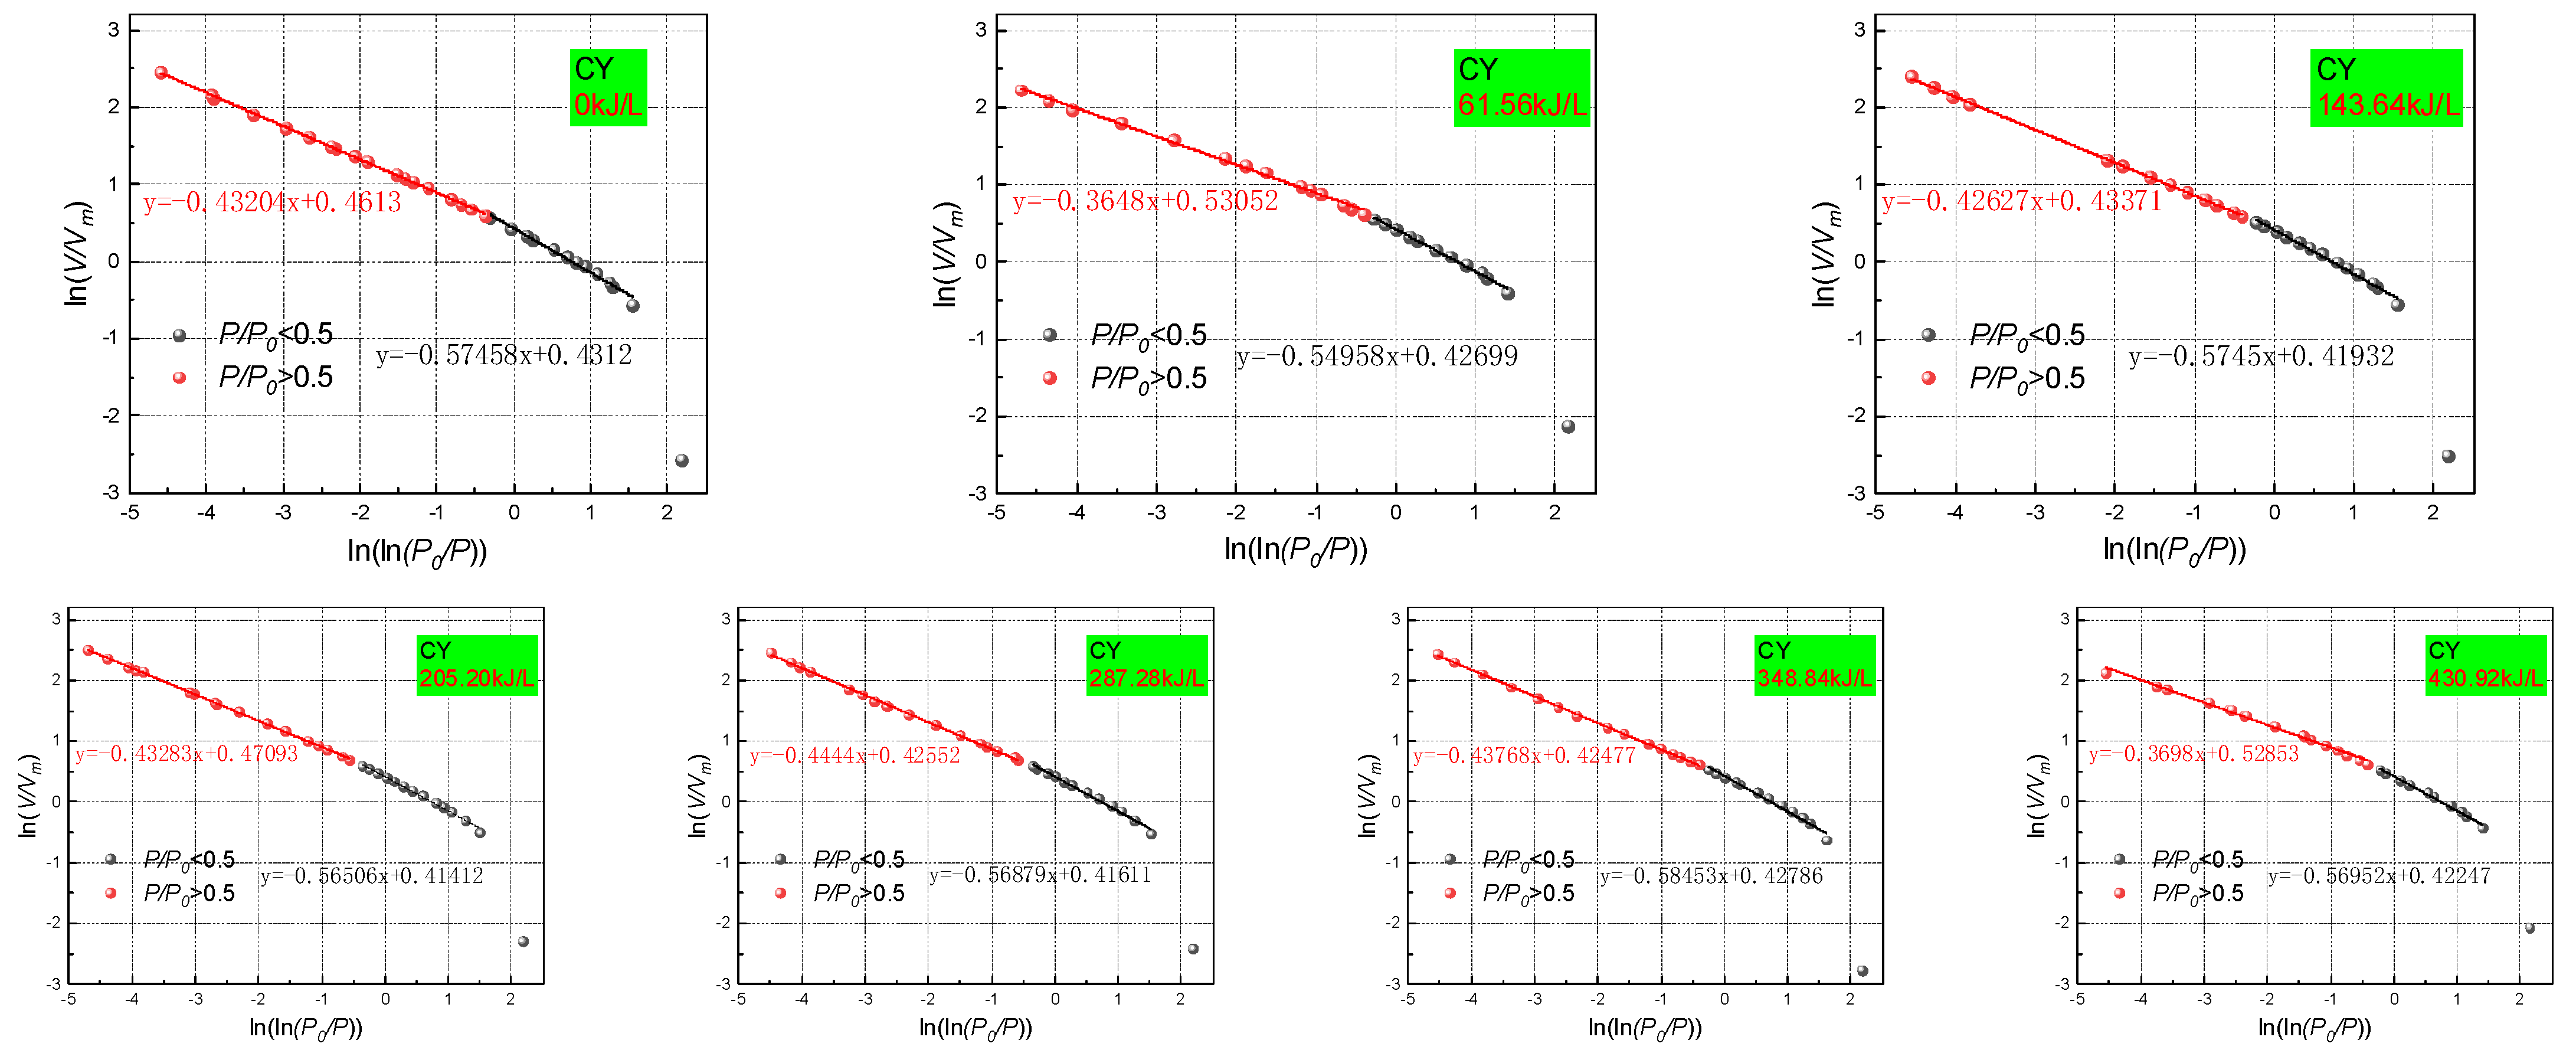
According to the fitting of the adsorption data by Yanbin Yao using the FHH model [
47], it is considered that when
P/P0 < 0.5, the surface fractal dimension
DF1 is calculated by the FHH model. A smaller result indicates that the surface of the pores is flatter and smoother. When
P/P0 > 0.5, the spatial fractal dimension
DF2 is calculated. Here, a larger result indicates a higher roughness and more complex pore space. In this study,
P/P0 = 0.5 was selected as the cut-off point. Moreover, the fractal dimension based on the low-pressure N
2 (87 K) adsorption experiment was determined by Formulas (4) and (5). The fractal dimension analysis process of a coal sample treated with varying PAW intensities are shown in
Figure 22 in accordance with the FHH fractal model calculation process, and the specific values are listed in
Table 4.
Table 4 shows that the fractal dimension processing results of coal samples treated with varying PAW intensities are essentially in line with the observations of earlier studies and are highly credible. PAW has a certain effect on both fractal dimensions
DF1 and
DF2 of coals with different degrees of metamorphism. However, there are significant differences, and the relationship between the effect and the ionization intensity is not stringently linear.
The pores in porous rock media generally have a fractal dimension of two–three. The pore surface becomes smooth and the roughness decreases as the fractal dimension approaches two. The pore surface becomes rough and the pore structure becomes complex as the fractal dimension approaches three. According to Mahnake and Mögeld, the fractal dimension
DF1 represents the surface fractal dimension of a material, whereas
DF2 represents the fractal dimension of the material’s pore structure. The larger
DF1 is, the more non-uniformly the coal surface grows. The larger
DF2 is, the more complex the pore structure of the coal body is [
48]. A good correlation was observed between the fractal dimension of coal dust and its wettability. Although
Table 4 accurately shows the modification effect of PAW on the fractal dimensions
DF1 and
DF2 of coal, it is difficult to directly reflect the impact of variations in
DF1 and
DF2 on the wettability of coal dust. Further quantitative multifactorial analyses would be conducted to ascertain the modifying effect of PAW on wettability in terms of fractal dimension variation. This is because coal dust wettability is influenced by various elements.
4.8. Correlation Between Pore Structure Characteristics and Wetting Capability of Coal
Using SPSS 2020 data analysis software, the correlation between the pore structure features and contact angle was analyzed both qualitatively and quantitatively to elucidate the process by which PAW alters the contact angle of coal samples. In the analysis, the wetting contact angle of the coal sample was considered to be the dependent variable Y. Meanwhile, the micropore volume, mesopore volume, macropore volume, micropore specific surface area, mesopore specific surface area, macropore specific surface area, BET specific surface area,
DF2, and
DF1 of the coal sample were considered to be the independent variables X
1, X
2, X
3, X
4, X
5, X
6, X
7, X
8, and X
9 (as shown in
Table 5). The results of the correlation analyses are presented in
Table 6,
Table 7,
Table 8,
Table 9 and
Table 10.
As shown in
Table 6, with an increase in the ionization intensity of PAW, the contact angle of CY and the mesoporous pore volume X
2 were significantly negatively correlated at the 0.01 level (bilateral). Meanwhile, the correlations with the other independent variables were lower. These phenomena indicate that PAW modified the contact angle of CY by altering the magnitude of its mesoporous pore volume. In particular, a larger mesoporous pore volume corresponds to a smaller contact angle, thereby enhancing the wettability of coal.
As shown in
Table 7, with an increase in the ionization intensity of PAW, the contact angle of QM exhibited a significant negative correlation with the microporous pore volume X
1 at the 0.05 level (bilateral), significant positive correlation with the mesoporous pore volume X
2 at the 0.05 level (bilateral), and significant negative correlation with the microporous specific surface area X
4 at the 0.05 level (bilateral). However, the correlations with the other independent variables were lower. These phenomena indicate that the contact angle of QM is modulated by PAW modifying the dimensions of its microporous pore volume, mesoporous pore volume, and microporous specific surface area. More precisely, an increase in the microporous pore volume and specific surface area, coupled with a decrease in the mesoporous pore volume, corresponds to a reduction in the contact angle, thereby enhancing the wettability of coal dust.
As shown in
Table 8, as the PAW ionization intensity increased, the correlation between the JM contact angle and all the independent variables of the pore characteristics became low. This phenomenon indicated that the effect of PAW on the contact angle of JM cannot be analyzed quantitatively based on variations in pore characteristics.
According to
Table 9, with an increase in the PAW ionization intensity, the correlation between all the independent variables of the PM contact angle and pore characteristics became low. This phenomenon indicates that the effect of PAW on the contact angle of PM cannot be analyzed quantitatively based on variations in pore characteristics.
As shown in
Table 10, with an increase in the PAW ionization intensity, the contact angle of PS was significantly and positively correlated with the macroporous specific surface area X
6 at the 0.01 level (bilateral) and poorly correlated with the other independent variables. This phenomenon indicates that PAW alters the contact angle of PS by modifying the size of its macroporous specific surface area; the smaller the macroporous specific surface area, the smaller the corresponding contact angle and the stronger the coal dust wettability.
Based on the correlation analysis results in
Table 6,
Table 7,
Table 8,
Table 9 and
Table 10, linear regression analyses were performed on the contact angles and the significantly correlated functional groups of the coal samples treated with varying strengths of PAW.
Table 11 presents the regression analyses results. The table shows that the contact angle Y and pore structure features X of the coal samples treated with varying PAW intensities have a linear connection. It is feasible to establish a direct correlation between the two and explain how PAW alters the wettability of coal dust through variations in pore structure properties.
5. Conclusions
(1) After the PAW treatment, there were significant variations in the surface morphology of coal dust with five distinct levels of metamorphism. For the coal dust particle group, after the PAW treatment the particle sizes of the CY, QM, JM, PM, and PS dust became more dispersed and the degree of adhesion between the particle sizes decreased. PAW can significantly disrupt the adhesion between the particles. For a single coal dust particle, after PAW treatment the surfaces of the CY, QM, JM, PM, and PS dust became relatively flat from the original non-uniform shape. The PAW treatment can transform the three-dimensional spatial distribution of a non-uniform coal dust surface into a nearly two-dimensional planar distribution. The pore structure of a single coal dust particle can be destroyed completely by PAW. The destroyed coal body can rapidly and completely obstruct the original primary, exogenous, metamorphic, and mineral pores.
(2) The wettability of coal is comprehensively affected by pore structure parameters. The pore volume, the specific surface area, and the fractal dimension of different pore size ranges (micropore, mesoporous, and macropore) all affect the wettability through different mechanisms. After PAW treatment, coal pore structure indexes, including micropore volume, mesoporous volume, macropore volume, micropore specific surface area, mesoporous specific surface area, macropore specific surface area, BET specific surface area, and fractal dimension, have changed significantly. Furthermore, the effect of PAW with different ionization intensities on the pore structure of coals with different degrees of metamorphism is significantly different. There is a certain linear relationship between the contact angle and specific parameters of coal pore structure characteristics. The variation in pore structure characteristics can be used to explain the basic mechanism of PAW to change the wettability of coal.
(3) Since PAW can change the surface morphology and internal pore structure characteristics of coal, the application of PAW dust reduction technology should focus on increasing the contact surface and contact time between PAW and coal, which can be realized by PAW injection in a coal seam and PAW spraying on a roadway in a field application. For coal with different degrees of deterioration, it is necessary to determine the best PAW ionization parameters in advance on the ground so as to achieve the best dust reduction effect with minimal energy consumption underground in the coal mine.


