
Promoting a Sustainability Culture in the Liquor Industry: Competition or Cooperation?


Abstract
1. Introduction
- (i)
- How would the correlation coefficient of a sustainability culture and liquor product affect the promotion level of a sustainability culture?
- (ii)
- How would the initial disparity in sustainability cultures between the two firms affect the promotion level of a sustainability culture?
- (iii)
- Under what conditions should liquor firms adopt a cooperative promotion strategy of a sustainability culture?
2. Literature Review
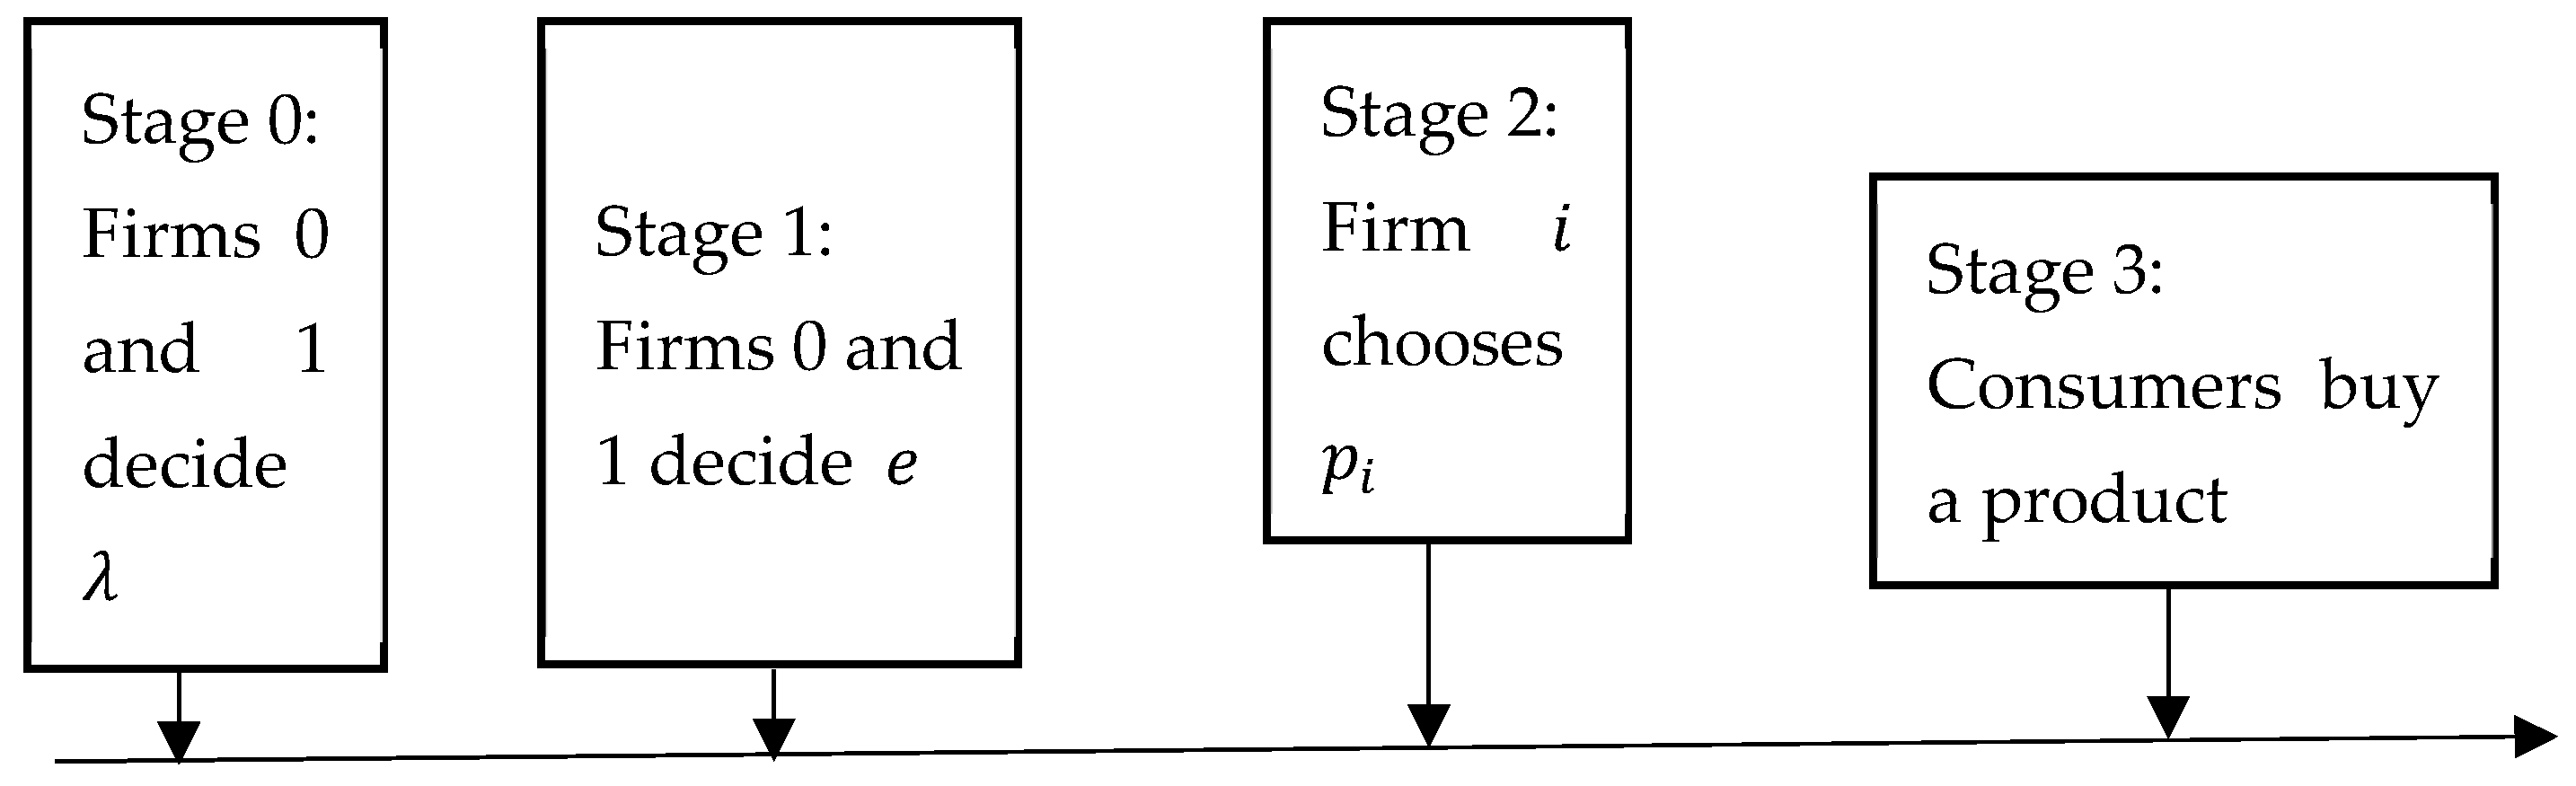
3. Model Description
4. Model Analysis and Results
4.1. The Competitive Promotion Strategy of a Sustainability Culture
4.2. The Cooperative Promotion Strategy of a Sustainability Culture
5. Sensitivity Analyses of
6. Numerical Study
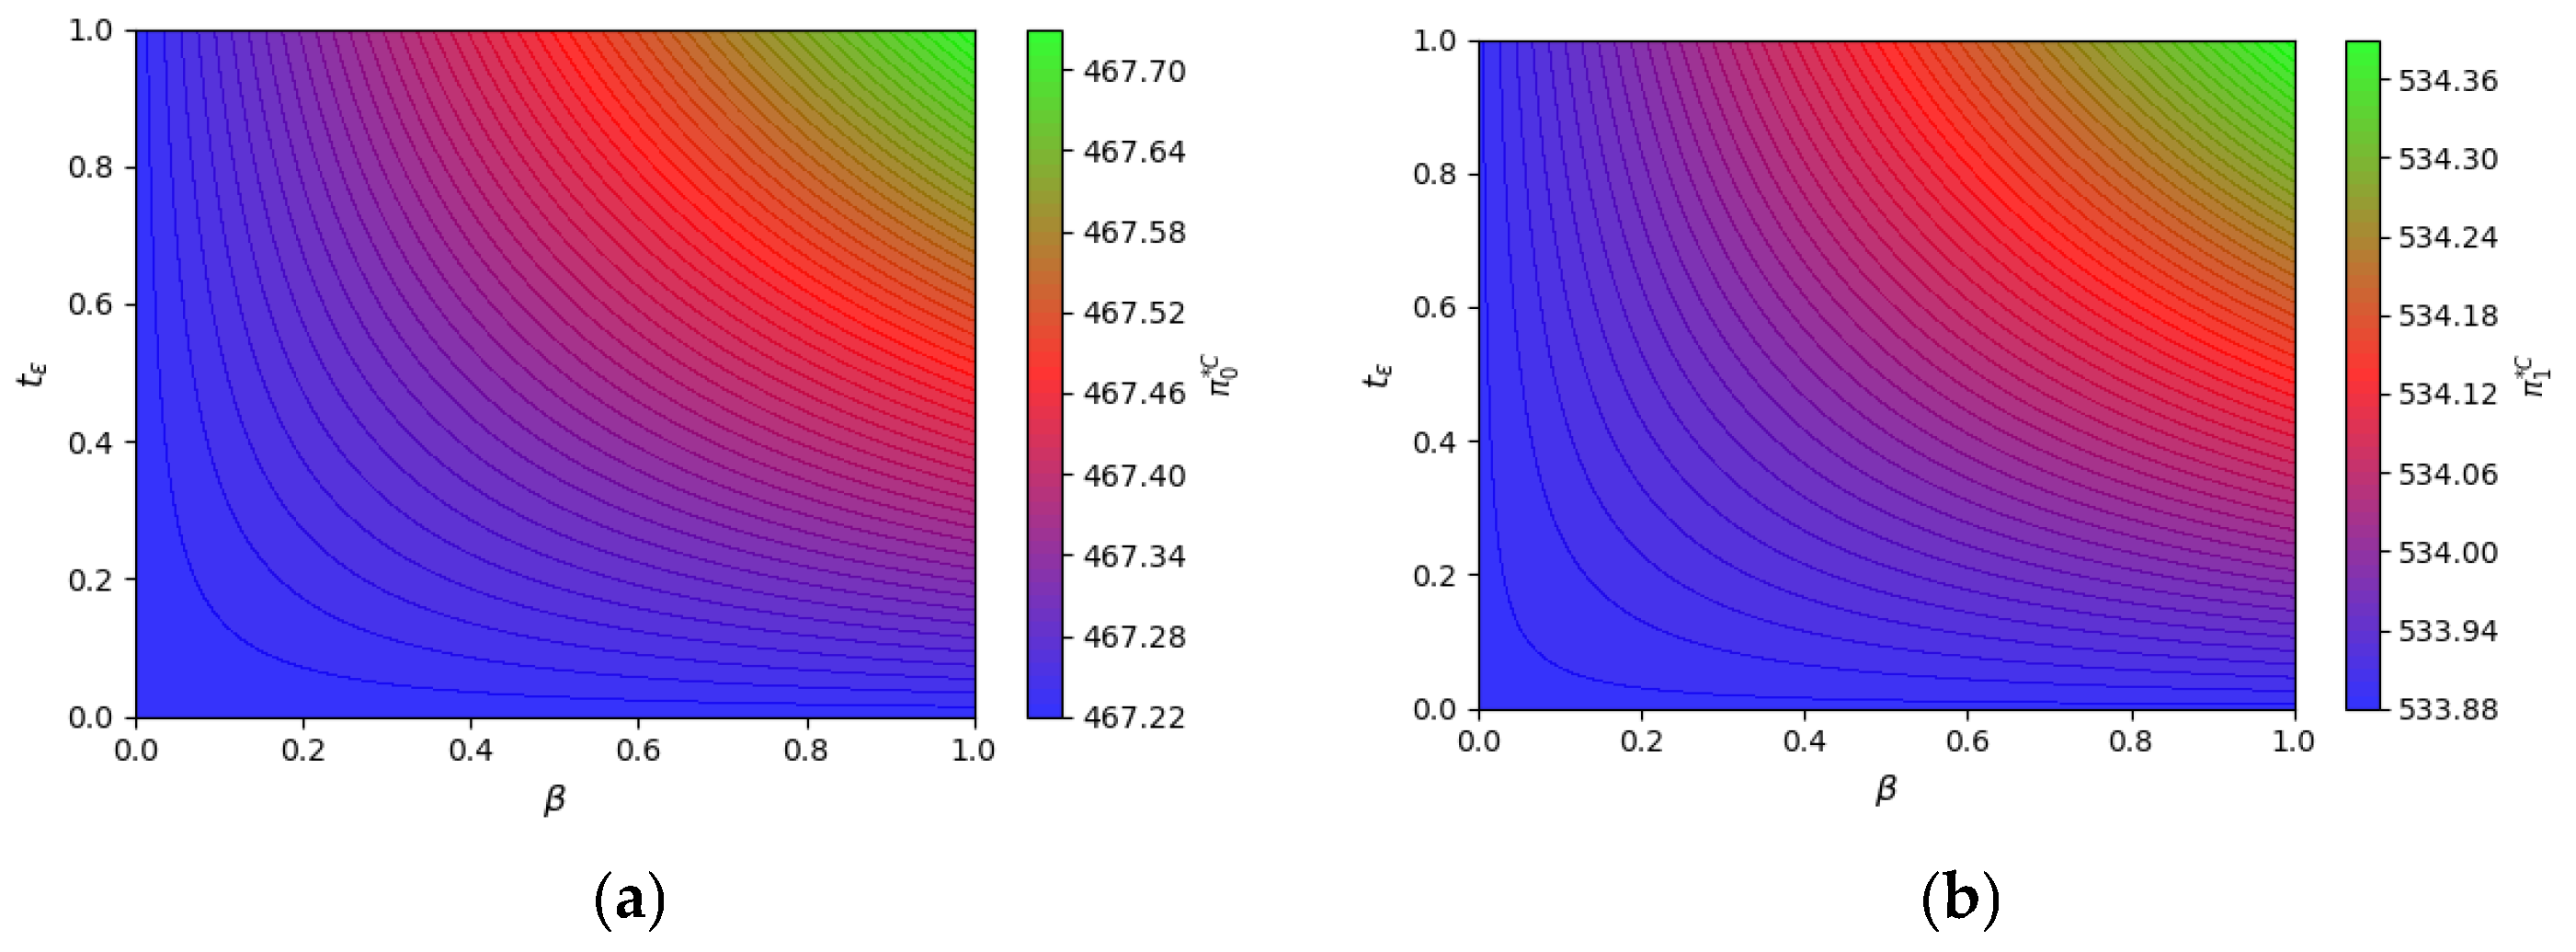
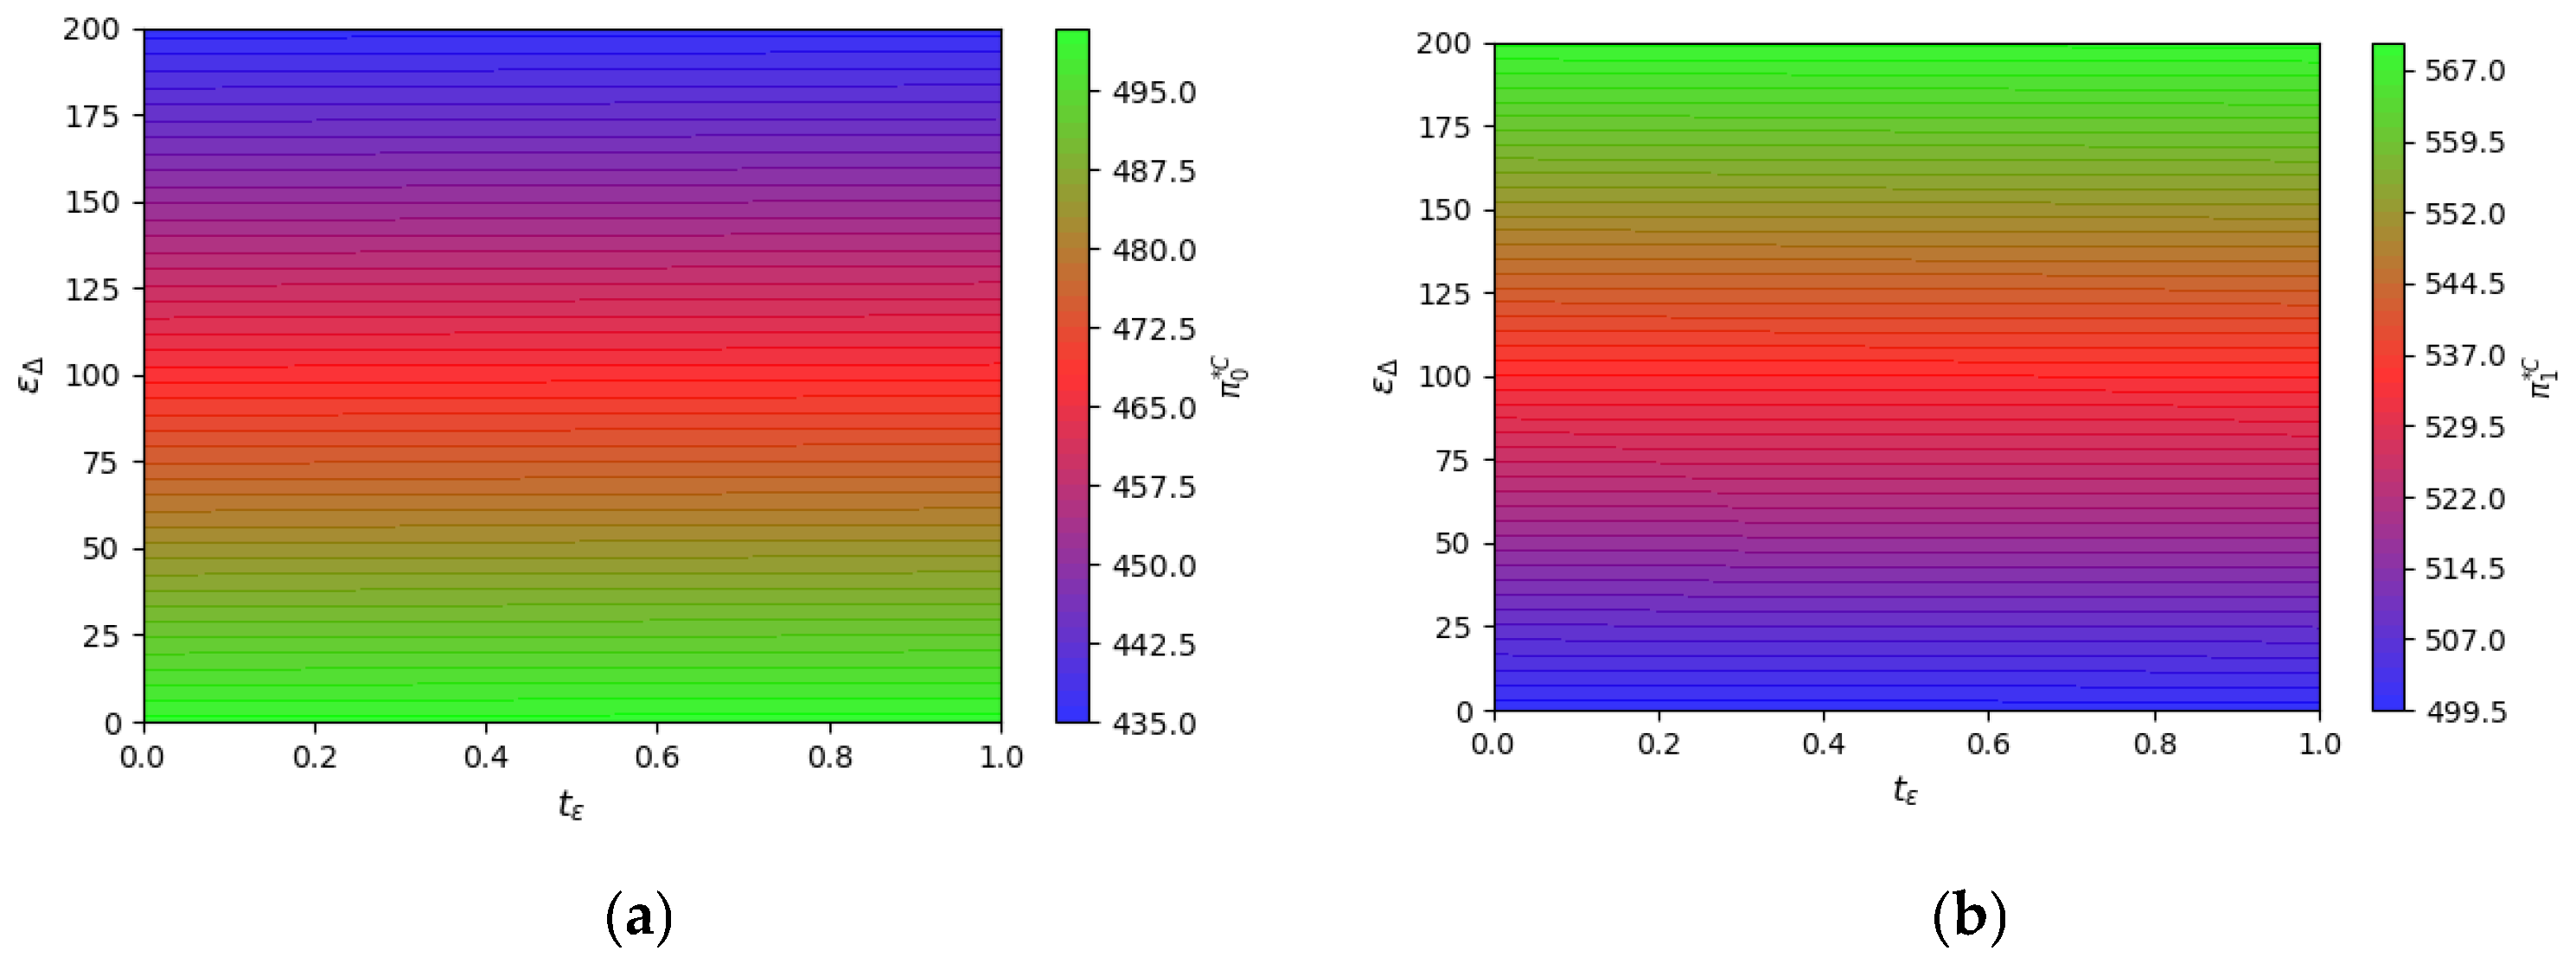
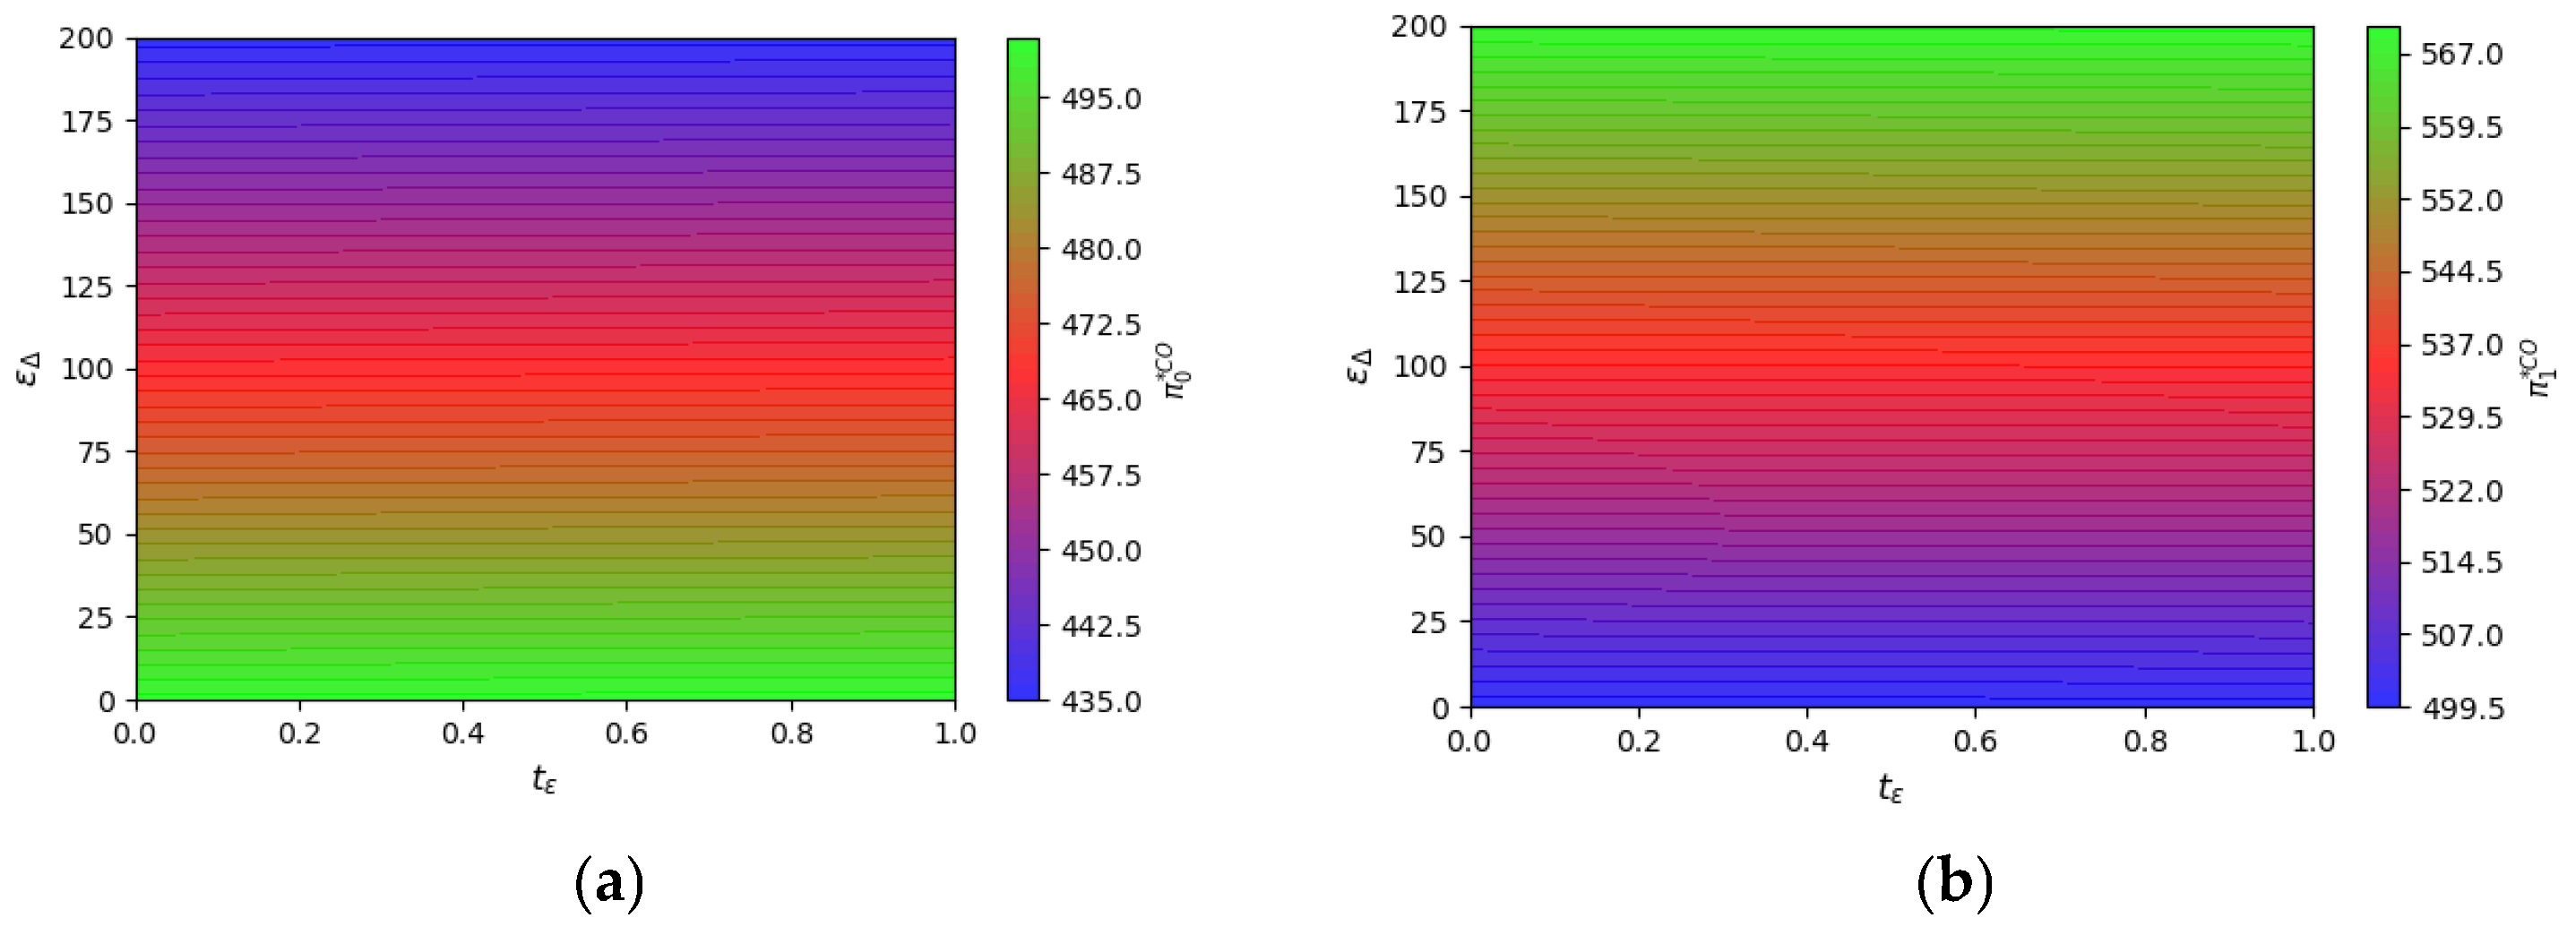
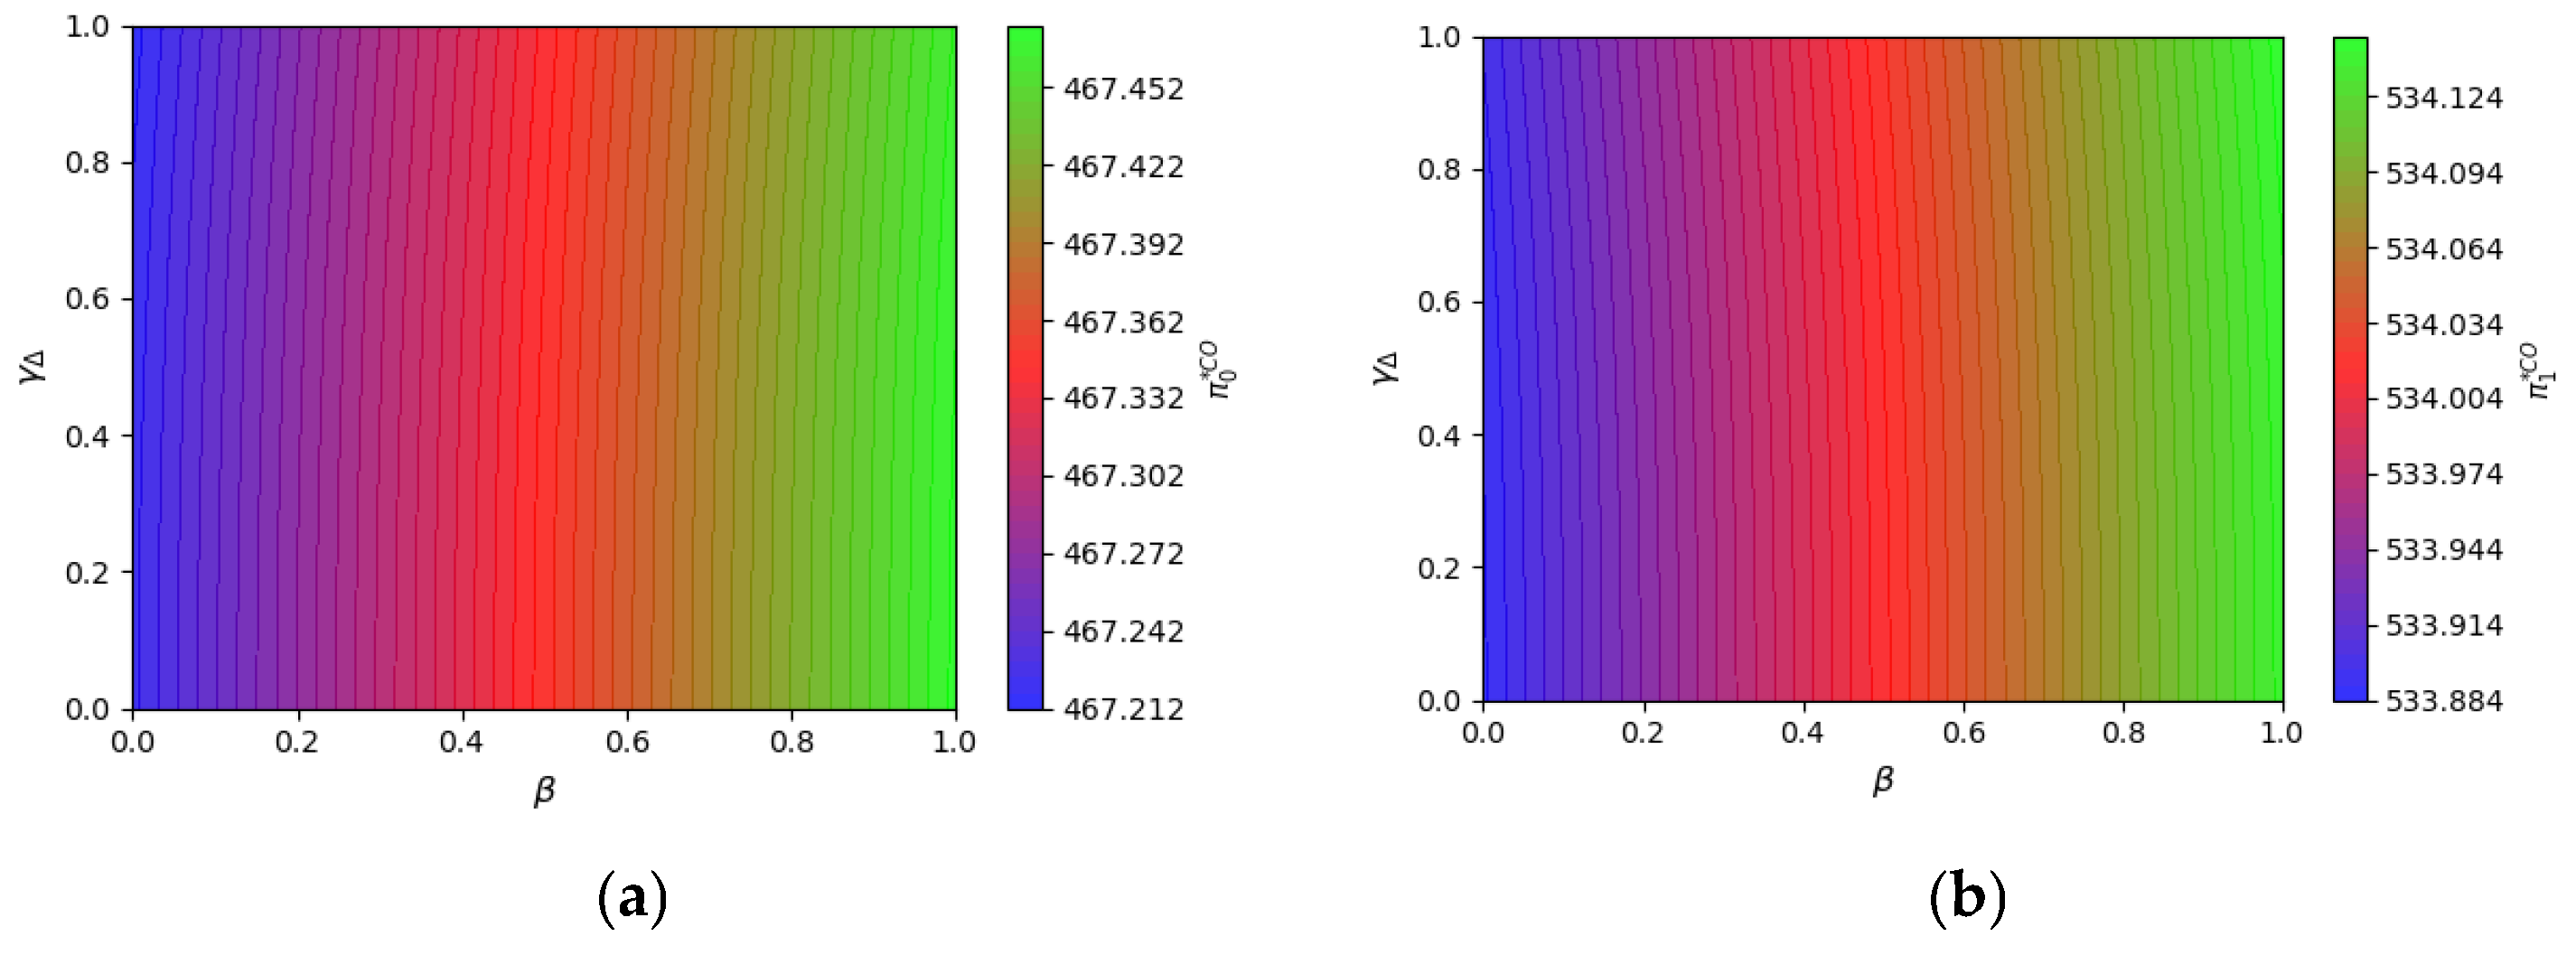
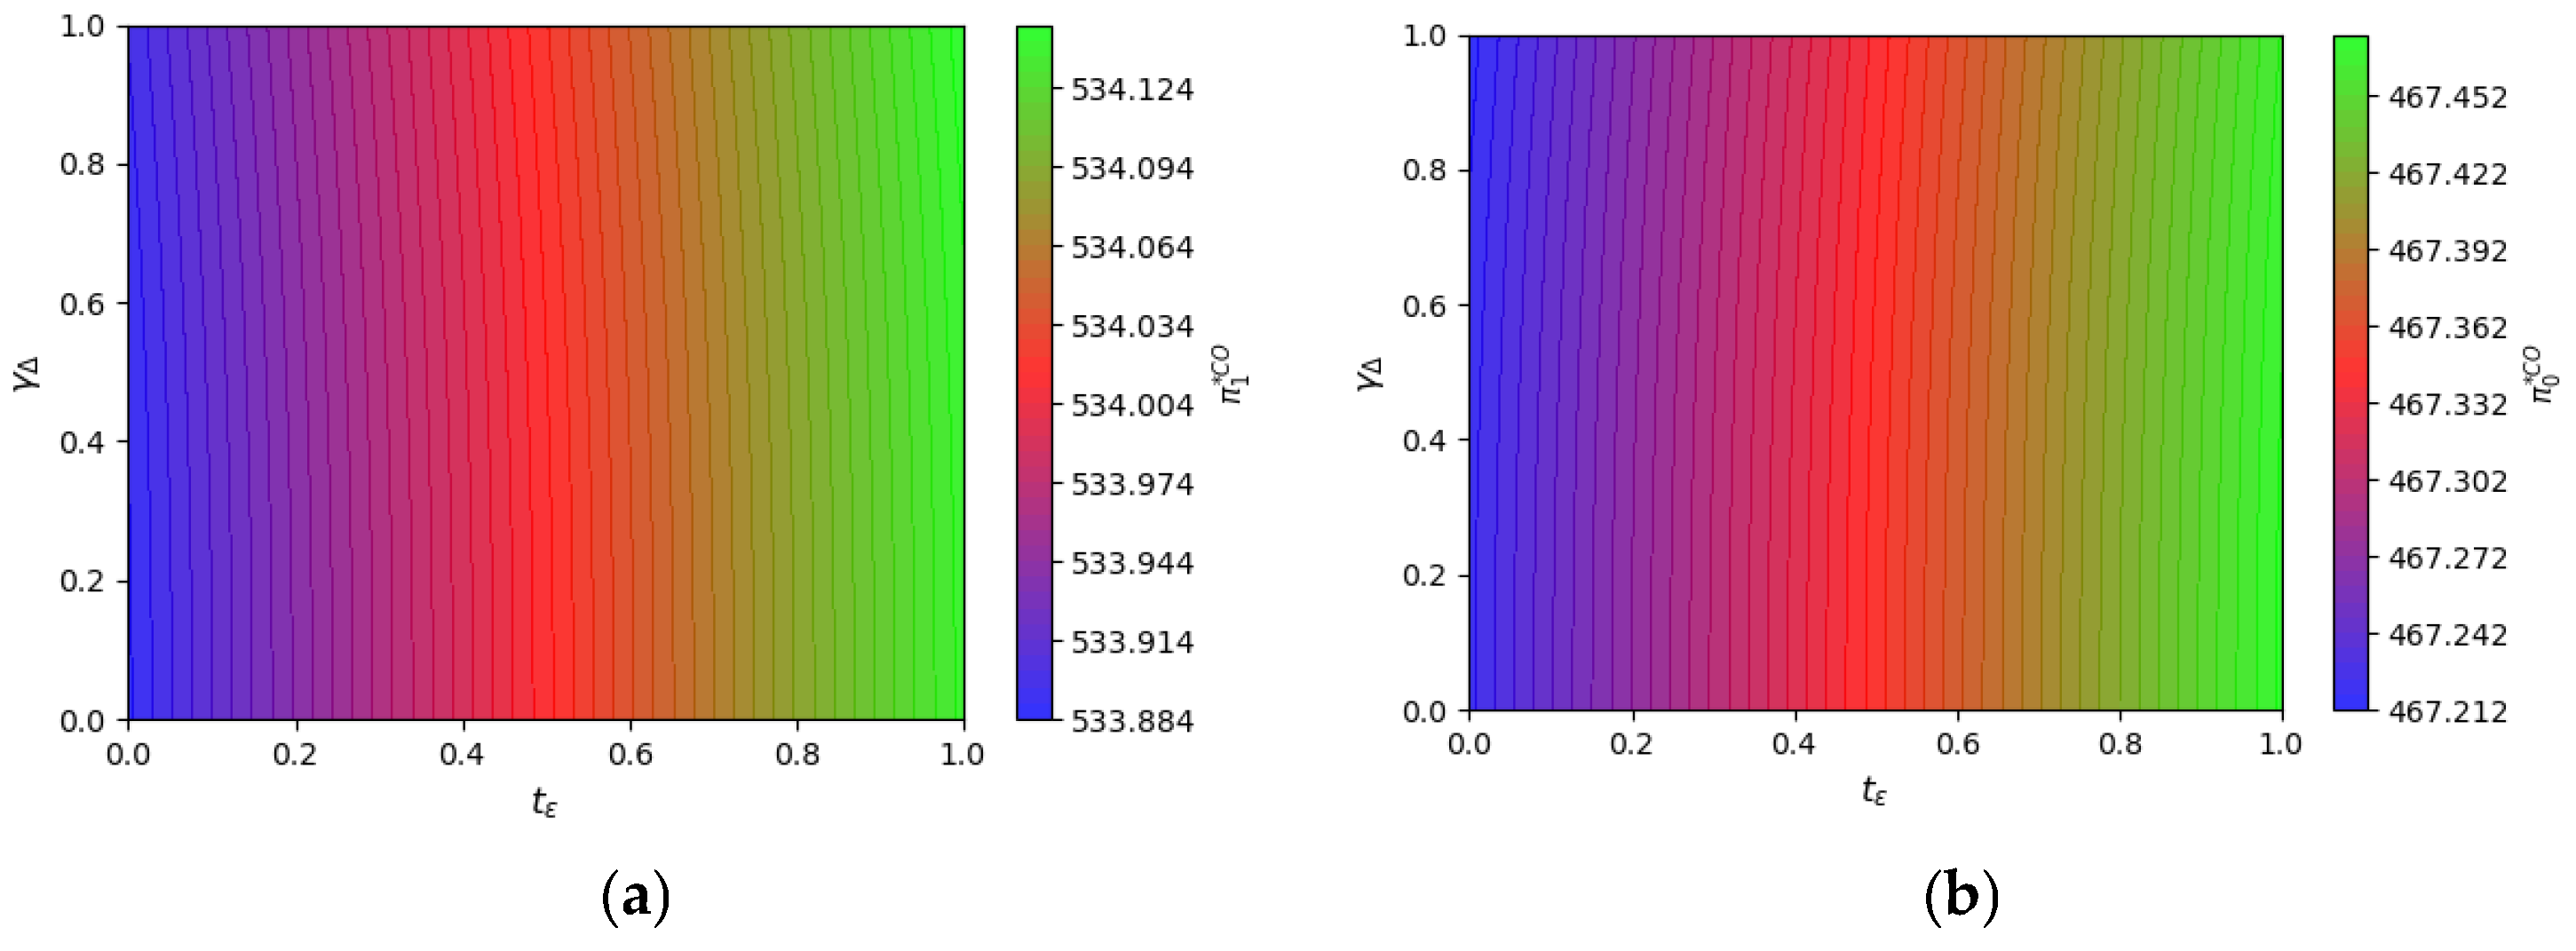
6.1. The Impact of and on Operating Profits
- (1)
- The case of adopting the competitive promotion strategy of a sustainability culture.
- (2)
- The case of adopting the cooperative promotion strategy of a sustainability culture
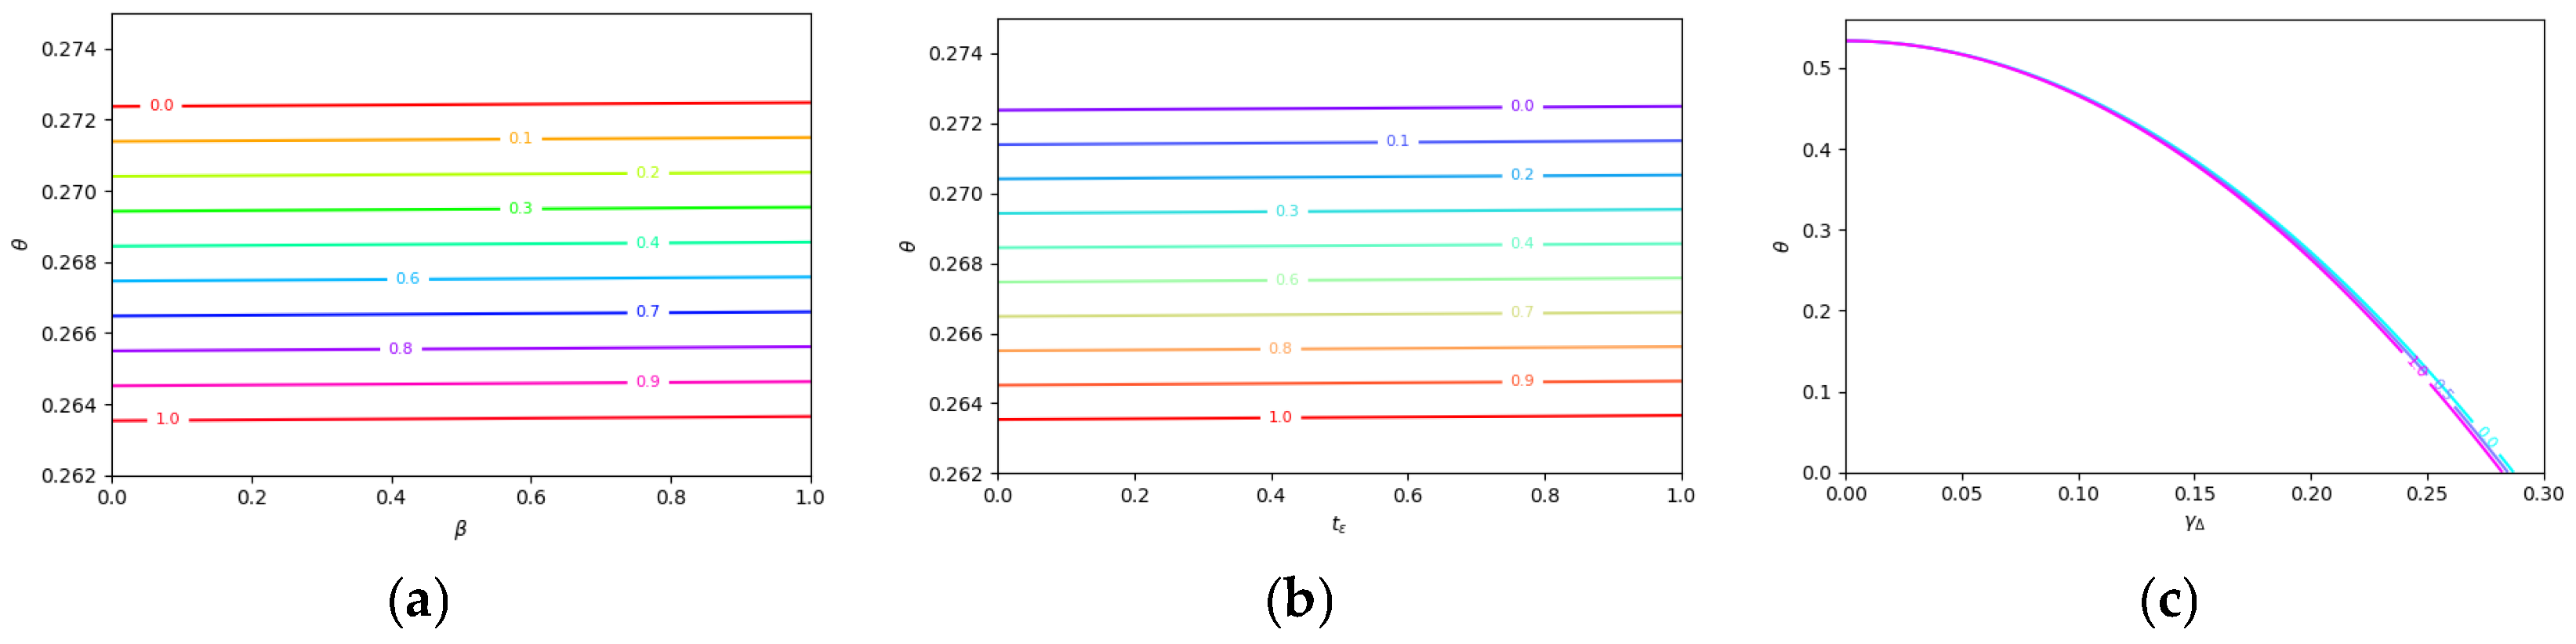
6.2. The Impact of on Cost-Sharing Proportion
7. Conclusions
7.1. Main Results
7.2. Managerial Implication
7.3. Future Research
Author Contributions
Funding
Institutional Review Board Statement
Informed Consent Statement
Data Availability Statement
Acknowledgments
Conflicts of Interest
Appendix A
References
- Lu, T.R.; Li, D.S.Y. China Liquor Industry ESG Development Report (2023). Available online: https://mp.weixin.qq.com/s?__biz=MjM5ODM1MDI1Mg==&mid=2652511389&idx=2&sn=45c398336fd270dfd7be5eb703420b84&chksm=bc63e74767670fb5ffd0887bcca522db94e5ea85927ca51683a17942718608bb91e9aed6b9c3&scene=27 (accessed on 1 April 2025).
- Barnett, S.B.L.; Coe, N.B.; Harris, J.R.; Basu, A. Washington’s privatization of liquor: Effects on household alcohol purchases from Initiative 1183. Addiction 2020, 115, 681–689. [Google Scholar] [CrossRef] [PubMed]
- Caitouyan. 2024 Baijiu Industry Market Size. Available online: https://caifuhao.eastmoney.com/news/20250125210705110071260 (accessed on 1 April 2025).
- Wenming, J.Y. Qingxiang Trillion-Dollar Breakthrough: The Category Revival Reshapes the New “Three-Legged” Structure of Baijiu, and the Final Speculation on Aroma Types. Available online: https://baijiahao.baidu.com/s?id=1825936738715713871&wfr=spider&for=pc (accessed on 1 April 2025).
- Yuan, J.S.G.C. Top Ten Bestselling Single Baijiu Products in China for 2024 Revealed: Moutai Holds the Throne, New Forces Emerge. Available online: https://baijiahao.baidu.com/s?id=1827911388117255908&wfr=spider&for=pc (accessed on 1 April 2025).
- Wang, Z.H.; Xiong, A.Y.; Yu, Y.G.; Zheng, Q. Electrochemical esterification in distilled liquor via gold catalysis and its application for enhancing ester aroma of low-alcohol liquor. Curr. Res. Food Sci. 2022, 5, 1769–1776. [Google Scholar] [CrossRef] [PubMed]
- Bennett, A.W.; Loose, S.M. User-Centered Development of an Online Dashboard Tool for Economic Sustainability for Small and Medium Enterprises. Sustainability 2024, 16, 557. [Google Scholar] [CrossRef]
- Di Chiara, V.; Battistella, A.; Boatto, V.; Furlan, S.; Giavi, L.; Liggieri, S.; Paiola, A.; Pomarici, E.; Stefanucci, S. Collaborative Approach for Achieving Ambitious Sustainability Goals: The Prosecco Sustainability Project. Sustainability 2024, 16, 583. [Google Scholar] [CrossRef]
- Ingrassia, M.; Altamore, L.; Bellia, C.; Lo Grasso, G.; Silva, P.; Bacarella, S.; Columba, P.; Chironi, S. Visitor’s Motivational Framework and Wine Routes’ Contribution to Sustainable Agriculture and Tourism. Sustainability 2022, 14, 12082. [Google Scholar] [CrossRef]
- Marques, A.; Teixeira, C.A. Vine and Wine Sustainability in a Cooperative Ecosystem-A Review. Agronomy 2023, 13, 2644. [Google Scholar] [CrossRef]
- Olmsted, K.; Rauchway, E. A New Deal for Wine. J. Policy Hist. 2024, 36, 260–280. [Google Scholar] [CrossRef]
- Red Star News. Hongxing ESG Research Institute Estabilshed, Focusing on the Construction of Liquor Sustainability System. Available online: https://baijiahao.baidu.com/s?id=1820145197205831643&wfr=spider&for=pc (accessed on 1 April 2025).
- Liang, Q.; Ma, K.W.; Liu, W.H. The role of farmer cooperatives in promoting environmentally sustainable agricultural development in China: A review. Ann. Public Coop. Econ. 2023, 94, 741–759. [Google Scholar] [CrossRef]
- Nugent, P. Sour grapes and sweet harmony: Historicizing collective action problems in the South African wine industry. J. Wine Econ. 2023, 18, 332–340. [Google Scholar] [CrossRef]
- Nishiyama, Y. Wine quality and pricing in the global wine export market: The case of Chilean wines. Appl. Econ. Lett. 2023, 30, 986–990. [Google Scholar] [CrossRef]
- Kalogiannidis, S.; Karafolas, S.; Chatzitheodoridis, F. The Key Role of Cooperatives in Sustainable Agriculture and Agrifood Security: Evidence from Greece. Sustainability 2024, 16, 7202. [Google Scholar] [CrossRef]
- Deng, Y.; Picone, G. An empirical analysis of entry and location decisions by bars and liquor stores. Empir. Econ. 2019, 57, 1751–1782. [Google Scholar] [CrossRef]
- Lanzalonga, F.; Oppioli, M.; Calandra, D.; Secinaro, S. The impact of ESG performance on intangible assets and intellectual capital in the food and beverage industry. Manag. Decis. 2025, 63, 423–442. [Google Scholar] [CrossRef]
- Tang, Y.L.; Wang, X.Y.; Hao, W. Recent decline in Chinese alcohol production and consumption: Potential contributing factors and the role of globally recommended measures. Addiction 2025. early access. [Google Scholar] [CrossRef]
- Aghion, P.; Cai, J.; Dewatripont, M.; Du, L.S.; Harrison, A.; Legros, P. Industrial Policy and Competition. Am. Econ. J.-Macroecon. 2015, 7, 1–32. [Google Scholar] [CrossRef]
- Zhang, C.X.; Chen, C.C.; Gou, L.; Hsu, Y.T. Bans on eating and drinking: What do investors think? Int. Rev. Econ. Financ. 2024, 96, 103633. [Google Scholar] [CrossRef]
- Fu, Y.H.; Viera, G. Drinking and feasting are perceived as facilitating cooperation. Behav. Brain Sci. 2023, 46, 39–40. [Google Scholar] [CrossRef]
- Farazi, M.S.; Chiambaretto, P.; Fernandez, A.S.; Gopalakrishnan, S. Unbundling the impact of current and future competition on cooperation in coopetition projects for innovation. Res. Policy 2024, 53, 105017. [Google Scholar] [CrossRef]
- Krieweth, C.; Guragata-Balasa, P.; Greven, A.; Brettel, M. The role of top management teams’ functional background diversity in firms’ coopetitive behavior. Ind. Mark. Manag. 2024, 117, 275–287. [Google Scholar] [CrossRef]
- Bahar, V.S.; Nenonen, S.; Starr, R.G. Coopetition with platforms: Balancing the interplay of cooperation and competition in hospitality. Tour. Manag. 2022, 88, 104417. [Google Scholar] [CrossRef]
- Maguire, J.S.; Lim, M. Lafite in China. J. Macromark. 2015, 35, 229–242. [Google Scholar] [CrossRef]
- Arnould, E.J.; Thompson, C.J. Consumer Culture Theory (CCT): Twenty Years of Research. J. Consum. Res. 2005, 31, 868–882. [Google Scholar] [CrossRef]
- Agnoli, L.; Outreville, J.F. Wine Consumption and Culture: A Cross-Country Analysis. Appl. Econ. Perspect. Policy 2021, 43, 1101–1124. [Google Scholar] [CrossRef]
- Butler, J.; Fehr, D. The causal effect of cultural identity on cooperation. J. Econ. Behav. Organ. 2024, 221, 134–147. [Google Scholar] [CrossRef]
- Gunnthorsdottir, A.; Thorsteinsson, P.; Olafsson, S.P. Reciprocity or Community? Different Cultural Pathways to Cooperation and Welfare. Cross-Cult. Res. 2023, 57, 391–428. [Google Scholar] [CrossRef]
- Spadaro, G.; Graf, C.; Jin, S.X.; Arai, S.; Inoue, Y.; Lieberman, E.; Rinderu, M.I.; Yuan, M.L.; Van Lissa, C.J.; Balliet, D. Cross-Cultural Variation in Cooperation: A Meta-Analysis. J. Personal. Soc. Psychol. 2022, 123, 1024–1088. [Google Scholar] [CrossRef]
- Koska, O.A. Sourcing product quality for foreign market entry. Rev. World Econ. 2020, 156, 669–702. [Google Scholar] [CrossRef]
- Wang, C.A.; Wang, X.Y. Why do airlines prefer multi-hub networks? Transp. Res. Part E-Logist. Transp. Rev. 2019, 124, 56–74. [Google Scholar] [CrossRef]
- Hydock, C.; Wathieu, L. Not Just about Price: How Benefit Focus Determines Consumers’ Retailer Pricing Strategy Preference. J. Consum. Res. 2023, 50, 447–467. [Google Scholar] [CrossRef]
- Blazy, R.; Blum, M. Horizontal and vertical differentiation in comic art auctions. Econ. Inq. 2022, 60, 1382–1415. [Google Scholar] [CrossRef]
- Sánchez-Pérez, M.; Illescas-Manzano, M.D.; Martínez-Puertas, S. You’re the Only One, or Simply the Best. Hotels differentiation, competition, agglomeration, and pricing. Int. J. Hosp. Manag. 2020, 85, 102362. [Google Scholar] [CrossRef]
- Liu, Y.F.; Li, M.Q.; Feng, H.Y.; Feng, N. Technological cooperation or competition? optimal strategies of incumbent and entrant in ICT markets. Omega-Int. J. Manag. Sci. 2024, 125, 103037. [Google Scholar] [CrossRef]
- Liu, L.H.; Wang, X.H.; Zeng, C.H. Endogenous Horizontal Product Differentiation in a Mixed Duopoly. Rev. Ind. Organ. 2020, 56, 435–462. [Google Scholar] [CrossRef]
- Podstawski, R.; Wesolowska, E.; Choszcz, D. Trends in alcohol drinking among university students at the Polish University of Warmia and Mazury in Olsztyn. Nord. Stud. Alcohol Drugs 2017, 34, 430–441. [Google Scholar] [CrossRef] [PubMed]
- Nguyen, Q.; Kim, H.T. The Ripple Effect of Managerial Behavior: Exploring Post-experimental Impact of Leading by Example on Small Firms’ Cooperation and Performance. Eval. Rev. 2024, 49, 270–303. [Google Scholar] [CrossRef]
- Dorrough, A.R.; Froehlich, L.; Eriksson, K. Cooperation in the cross-national context. Curr. Opin. Psychol. 2022, 44, 281–285. [Google Scholar] [CrossRef]
- Hoffmann, W.; Lavie, D.; Reuer, J.J.; Shipilov, A. The interplay of competition and cooperation. Strateg. Manag. J. 2018, 39, 3033–3052. [Google Scholar] [CrossRef]
- Hou, L.; Geng, S.D.; Kong, W.J. Competition and Cooperation in Ride-Sharing Platforms: A Game Theoretic Analysis of C2C and B2C Aggregation Strategies. Sustainability 2025, 17, 398. [Google Scholar] [CrossRef]
- Lai, X.X.; Wang, N.M.; Jiang, B.; Jia, T. Choosing Recovery Strategies for Waste Electronics: How Product Modularity Influences Cooperation and Competition. Sustainability 2024, 16, 9035. [Google Scholar] [CrossRef]
- Ouyang, X.; Liu, Z.Q.; Gui, C.L. The interactive effects of intragroup cooperation and competition: Toward a perspective of paradox. Manag. Decis. 2023, 61, 655–672. [Google Scholar] [CrossRef]
- Guo, Y.; Bai, C.G.; Lev, B. Independence or cooperation? Evaluating emission reduction strategies in non-competitive and competitive environments. J. Oper. Res. Soc. 2025, 76, 659–676. [Google Scholar] [CrossRef]
- Yao, X.S.; Shao, Z.Q.; Wang, Z.; Zhu, Z.; Chen, Z.X.; Wu, Q.Y. Policy incentives and market mechanisms dual-driven framework for new energy vehicles promotion. Energy Policy 2025, 199, 114530. [Google Scholar] [CrossRef]
- Colombo, S.; Graziano, C.; Pignataro, A. Personalized pricing with imperfect customer recognition. Inf. Econ. Policy 2025, 70, 101129. [Google Scholar] [CrossRef]
- Zhou, C.; Bai, D.Y.; Li, T.S.; Yu, J. Personalized recommendation, behavior-based pricing, or both? Examining privacy concerns from a cost perspective. Omega-Int. J. Manag. Sci. 2025, 133, 103223. [Google Scholar] [CrossRef]
- Foster, S.; Trapp, G.; Hooper, P.; Oddy, W.H.; Wood, L.; Knuiman, M. Liquor landscapes: Does access to alcohol outlets influence alcohol consumption in young adults? Health Place 2017, 45, 17–23. [Google Scholar] [CrossRef]
- Faye, B.; Meral, H. Blend the wine tourism into the local tourism system to cultivate youthful tastes. J. Destin. Mark. Manag. 2025, 36, 101000. [Google Scholar] [CrossRef]
- Golombek, R.; Hoel, M.; Kverndokk, S.; Ninfole, S.; Rosendahl, K.E. Competition for carbon storage. J. Environ. Econ. Manag. 2025, 130, 103128. [Google Scholar] [CrossRef]
- Yoo, S.C.; Fan, H.; Piscarac, D.; Puentes, S.T. Advertising Together for Our K-Pop Idol: The Roles of Trust, Loyalty, and Perceived Value in K-Pop Crowdfunding for Outdoor Advertising. J. Theor. Appl. Electron. Commer. Res. 2025, 20, 44. [Google Scholar] [CrossRef]
- Cao, K.Y.; Yin, H.R.; Wang, J. Introducing robot or not? Decisions of competing hotels. Int. J. Hosp. Manag. 2025, 126, 104034. [Google Scholar] [CrossRef]
- Houba, H.; Motchenkova, E.; Wang, H. Endogenous personalized pricing in the Hotelling model. Econ. Lett. 2023, 225, 111037. [Google Scholar] [CrossRef]
- Kim, S.H.; Hahn, J.H. On the profitability of interfirm bundling in oligopolies. J. Econ. Manag. Strategy 2022, 31, 657–673. [Google Scholar] [CrossRef]
- Alvarez-Albelo, C.D.; Martínez-González, J.A. Should bundling agreements between rival firms involve persuasive advertising differentiation? J. Econ. 2025, 144, 247–268. [Google Scholar] [CrossRef]
- Fay, S.; Gheibi, S. The Effect of Probabilistic Selling on Channel Dynamics in Supply Chains. MSom-Manuf. Serv. Oper. Manag. 2024, 26, 407–795. [Google Scholar] [CrossRef]
- Yan, L.; Zhang, Y.X.; Mei, S.E.; Zhong, W.J. Personalized pricing with persuasive advertising and the value of consumer information: A duopoly framework. Electron. Commer. Res. 2024, 24, 1533–1562. [Google Scholar] [CrossRef]
- Pepall, L.; Richards, D. Targeted advertising, concentration, and consumer welfare. Inf. Econ. Policy 2025, 70, 101128. [Google Scholar] [CrossRef]
- Deng, H.X.; Yang, S.G.; Jin, L.Y. Too assertive to recommend: The effect of assertive tone on referral behavior. J. Retail. 2025, 101, 40–54. [Google Scholar] [CrossRef]
- Gan, M.R.; Liu, C.Y.N.; Hall, C.M.; Zhu, C.Z.G.; Koupaei, S.N. Can short video promote festival marketing? Empirical evidence from Macau. Asia Pac. J. Mark. Logist. 2025. early access. [Google Scholar] [CrossRef]
- Li, J.Y.; Fu, Y.; Wu, Y. Advertising and Corporate Green Innovation: From the Perspective of Greenwashing. Sustainability 2024, 16, 10488. [Google Scholar] [CrossRef]
- Gao, G.X.; Li, X.D.; Bai, Z.; Wang, J.H.; Jiang, H. Financing a Low-Carbon Supply Chain Through Online Peer-to-Peer Lending. Ieee Trans. Eng. Manag. 2024, 71, 5044–5056. [Google Scholar] [CrossRef]
- Pereda, B.; Caluda-Perdue, N.; Levy, S.; Zhang, L.L.N.; Colder, C.R. Age of onset of adolescent alcohol use with parental permission and its impact on drinking and alcohol-harms in young adulthood: A longitudinal study. Addict. Behav. 2025, 164, 108271. [Google Scholar] [CrossRef]
- Gartzou-Katsouyanni, K. How can public policies facilitate local cooperation? insights from the EU’s wine policy. New Political Econ. 2024, 29, 597–615. [Google Scholar] [CrossRef]
- Crick, J.M.; Crick, D. Coopetition and family-owned wine producers. J. Bus. Res. 2021, 135, 319–336. [Google Scholar] [CrossRef]
- Landazuri-Tveteraas, U.; Asche, F.; Straume, H.M. Dynamics of Buyer-Seller Relations in Norwegian Wine Imports. J. Wine Econ. 2021, 16, 68–85. [Google Scholar] [CrossRef]
- Yang, F.M. Little but Sustainable: Wine, Drinking Culture, and Negotiation of Value in Taiwan. Sustainability 2023, 15, 7008. [Google Scholar] [CrossRef]
- Martínez-Falcó, J.; Marco-Lajara, B.; Zaragoza-Sáez, P.; Sánchez-García, E. The effect of organizational ambidexterity on sustainable performance: A structural equation analysis applied to the Spanish wine industry. Agribusiness 2024, 40, 773–803. [Google Scholar] [CrossRef]
- Van Limbergen, D.; Komar, P. Making wine in earthenware vessels: A comparative approach to Roman vinification. Antiquity 2024, 98, 85–101. [Google Scholar] [CrossRef]
- Jiang, R.H.; Lin, G.C. The drunkard’s intention lies not on the wine: Reinterpreting culture-led urban redevelopment in China amidst profound regime changes. Environ. Plan. A-Econ. Space 2025. early access. [Google Scholar] [CrossRef]


| Symbol | Description |
|---|---|
| Consumers’ preference for different liquor products, where | |
| Consumers’ preference for different liquor sustainability cultures, where | |
| The mismatch cost between the products purchased by consumers and their preferences. | |
| The mismatch cost between liquor sustainable cultures and consumer preferences. | |
| The basic utility that a consumer obtained from liquor product . | |
| The correlation coefficient of liquor product and sustainability culture. | |
| The initial sustainable cultural utility of consuming liquor product . | |
| The initial disparity in sustainability cultures between the two firms. | |
| The promotion level of a sustainability culture. | |
| The cost coefficient of a sustainability culture promotion. | |
| The selling price of liquor product . | |
| The demand of liquor product . | |
| The cost-sharing proportion for a sustainability culture promotion. | |
| The firm ’s profit. | |
| , the total profit of two firms. | |
| The conversion rates of a common sustainability culture. | |
| The disparity in conversion rates of a common sustainability culture. | |
| Consumer’s utility. |
| Positive | Non-Positive | ||
|---|---|---|---|
| εΔ | Small | −(+) | +(−) |
| Big | +(−) | +(−) | |
Disclaimer/Publisher’s Note: The statements, opinions and data contained in all publications are solely those of the individual author(s) and contributor(s) and not of MDPI and/or the editor(s). MDPI and/or the editor(s) disclaim responsibility for any injury to people or property resulting from any ideas, methods, instructions or products referred to in the content. |
© 2025 by the authors. Licensee MDPI, Basel, Switzerland. This article is an open access article distributed under the terms and conditions of the Creative Commons Attribution (CC BY) license (https://creativecommons.org/licenses/by/4.0/).
Share and Cite
Qiu, Y.; Ye, F.; Wang, Z. Promoting a Sustainability Culture in the Liquor Industry: Competition or Cooperation? Sustainability 2025, 17, 3638. https://doi.org/10.3390/su17083638
Qiu Y, Ye F, Wang Z. Promoting a Sustainability Culture in the Liquor Industry: Competition or Cooperation? Sustainability. 2025; 17(8):3638. https://doi.org/10.3390/su17083638
Chicago/Turabian StyleQiu, Yao, Fei Ye, and Zhengkai Wang. 2025. "Promoting a Sustainability Culture in the Liquor Industry: Competition or Cooperation?" Sustainability 17, no. 8: 3638. https://doi.org/10.3390/su17083638
APA StyleQiu, Y., Ye, F., & Wang, Z. (2025). Promoting a Sustainability Culture in the Liquor Industry: Competition or Cooperation? Sustainability, 17(8), 3638. https://doi.org/10.3390/su17083638