

The Evaluation of Corporate Sustainability Strategies in Italy: Challenges and Opportunity of Recycled Packaging


Abstract
1. Introduction
- RQ1—What is the impact of public incentives on Italian enterprises using recycled materials?
- RQ2—What are the characteristics of the firms involved in the paradigm shift towards sustainable packaging allowing them to benefit from the public incentives?
2. Literature Review
2.1. Recycled Materials
2.2. Industrial Symbiosis
2.3. Innovative Solutions
3. Materials and Methods
- A medium-sized company has up to 250 employees, a turnover of up to 50 million euros, and a balance sheet total of up to 43 million euros;
- A small business has up to 50 employees and a turnover or balance sheet total of up to 10 million euros;
- A micro business has up to ten employees and a turnover or balance sheet total of up to 2 million euros.
4. Results
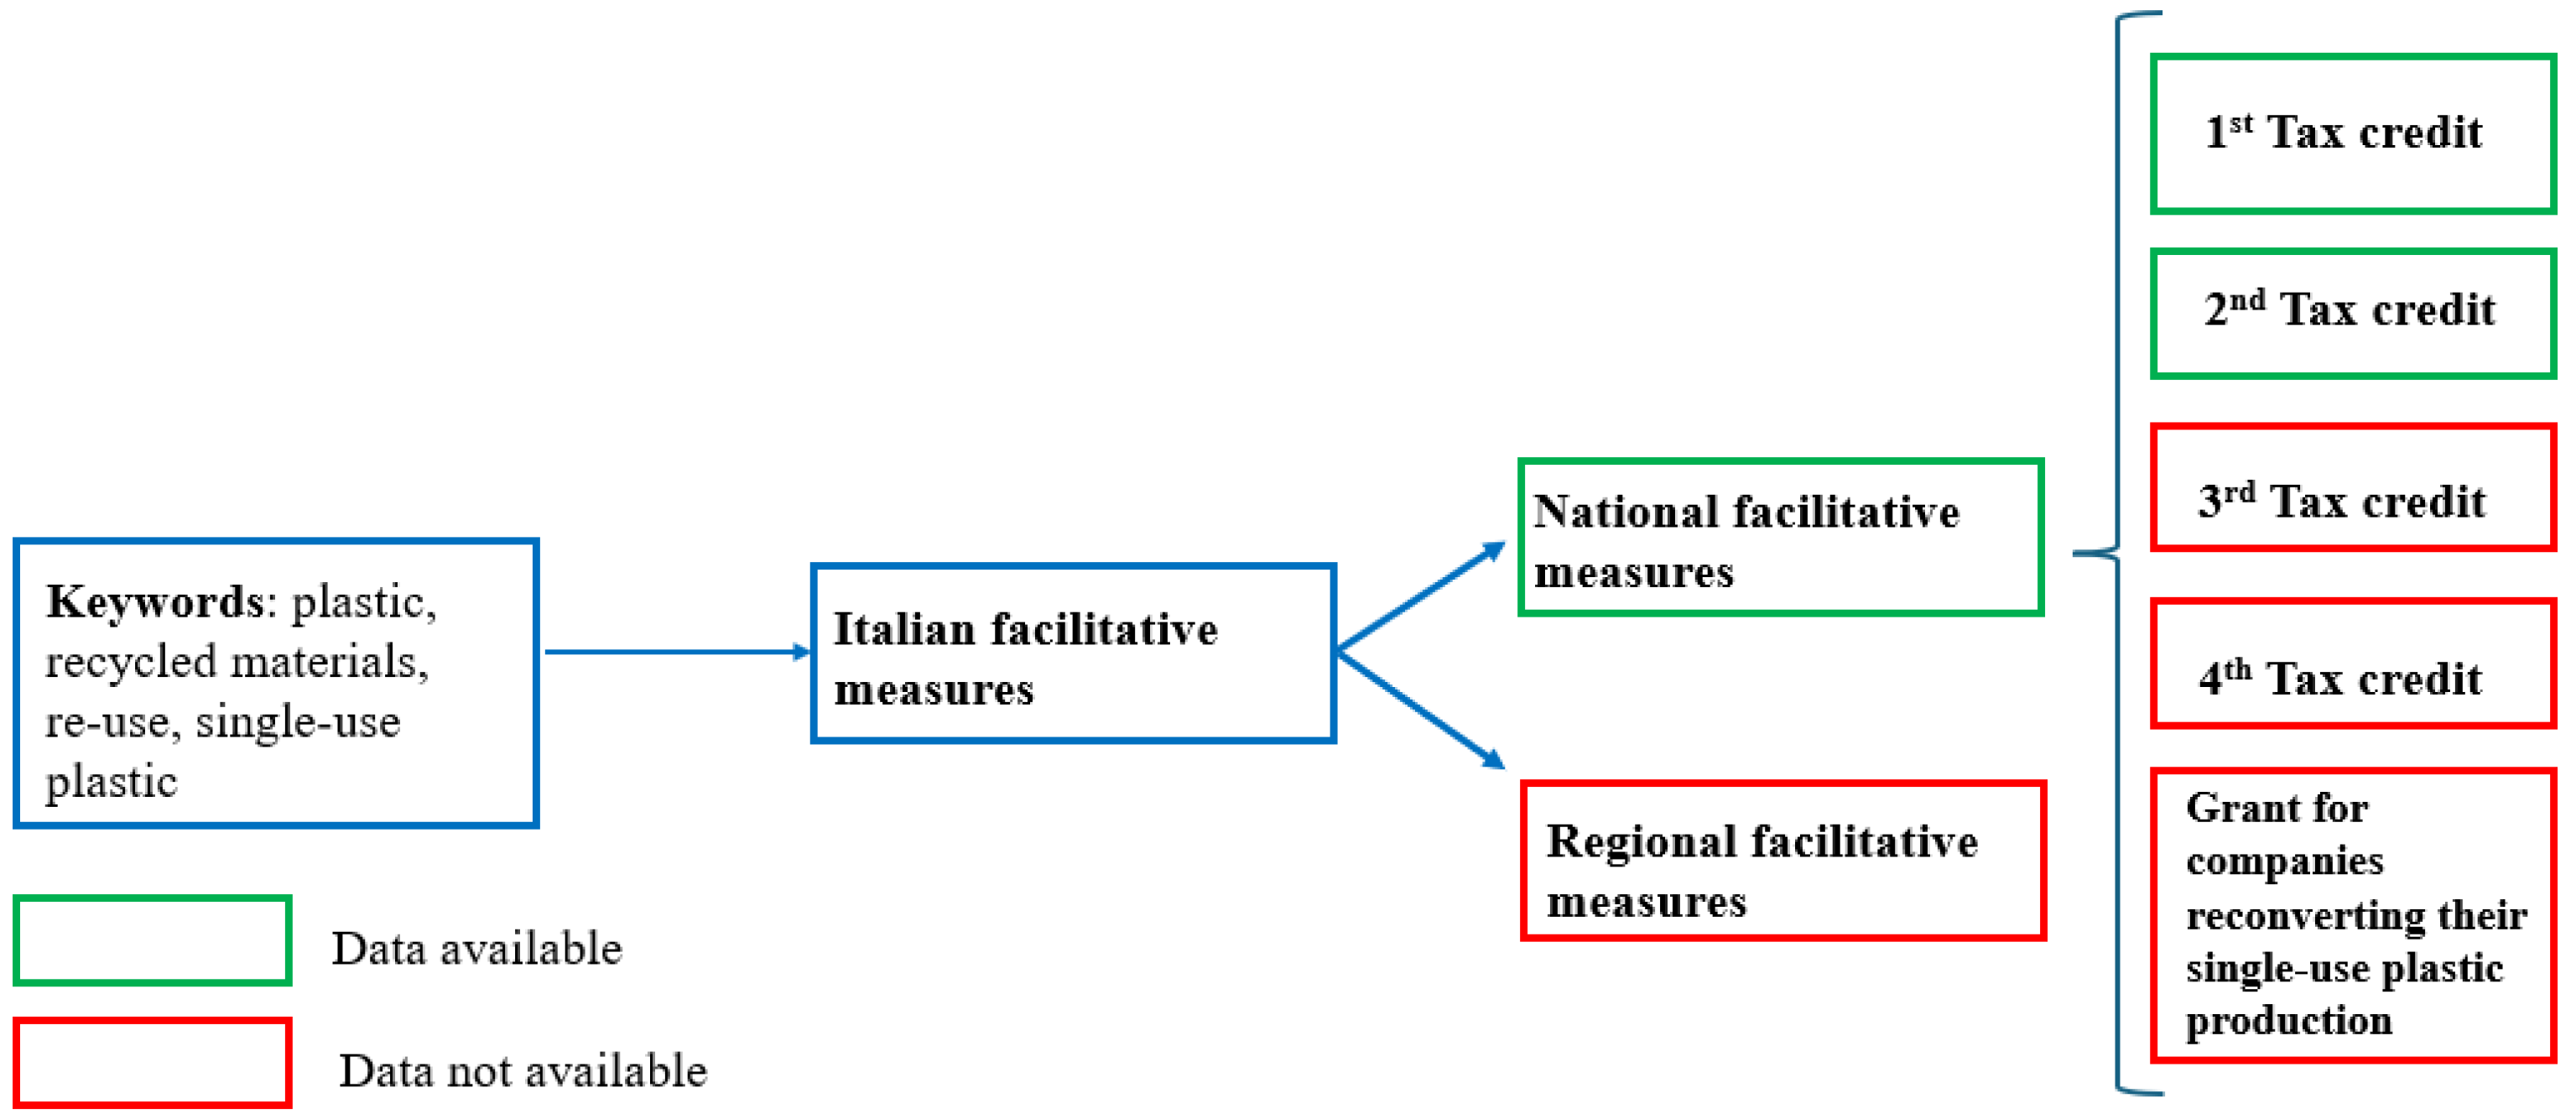
- i.
- A tax credit whose maximum value is 10,000 euros, equal to 25% of eligible purchases in 2020 regarding: semi-finished and finished products made by recycling of waste or compost arising from the treatment of organic fraction of waste.
- ii.
- A tax credit whose maximum value is 40,000 euros (20,000 euros per year), equal to 36% of purchases in 2019 and 2020 regarding products made by recycled plastics, packaging containing recycled paper, plastic, or aluminium materials, as well as biodegradable packaging.
- iii.
- A tax credit, whose maximum value is 10,000 euros, equal to 20% of purchases in 2022, 2023 and 2024 regarding products different from single-use plastic products- e.g., cotton bud sticks, cutlery, plates, straws, stirrers, balloons, sticks for balloons, food containers, cups for beverages, beverage containers—either reusable alternatives or those made from biodegradable or compostable materials.
- iv.
- The second tax credit was additionally refinanced to cover purchases made in 2023 and 2024.
- v.
- Grants for companies reconverting their single-use plastic production, whose maximum value can be 300,000 euros per enterprise and is equal to 40% of consultancy expenditures to modify the productive cycle, and 80% of purchases of machinery, equipment, and licenses.
5. Discussion
Policy and Managerial Implications
6. Conclusions
Author Contributions
Funding
Institutional Review Board Statement
Informed Consent Statement
Data Availability Statement
Conflicts of Interest
Abbreviations
| CE | Circular economy |
| EC | European Commission |
| EPR | Extended Producer Responsibility |
| GHG | Greenhouse gas |
| IS | Industrial symbiosis |
| Mt | Million tons |
| NSAR | National State Aids Register |
| NISP | National Industrial Symbiosis Programme |
| SDG | Sustainable Development Goals |
| SUP | Single-use plastics |
| UN | United Nations |
Appendix A

| Topic | Normative | Explanation | Applicable Legislation |
|---|---|---|---|
| Plastic | Directive 1994/62/EC | not available | |
| (2015)/720/EU | Has the purpose to decrease the usage of lightweight plastic carrier bags. | Art. 9 bis of the Law 3 August 2017, n. 123 | |
| (2018)/852/EU | Establishes long-term targets: 65% of total packaging waste to be recycled by 2025 and 70% by 2030. | Legislative Decree 3 September 2020, n. 116 | |
| 2019/904/EU | Forbids the single-use plastic products in the presence of alternatives and introduces the polluter-pays principle. | Legislative Decree 8 November 2021, n. 196 | |
| 2025/40/EU | Aims to make all packaging recyclable or reusable by 2030. | Not yet implemented | |
| The Missing Link an EU Action Plan for the Circular Economy (CE) | COM (2015) 614 final | Promotes the reuse and the extension of products’ life, the reduction of wastes, and the increase of resource efficiency. | National Strategy for the Circular Economy |
| Waste Framework Directive (WFD) | Directive 2008/98/EC 2018/851/EU 2018/852/EU | This new framework establishes a waste management order (prevention, preparation for reuse, recycling, energy recovery, landfill), defines waste as a resource, and establishes binding targets for municipal waste (re-use and recycling to at least 55% of total weight by 2025, 60% by 2030, and 65% by 2035). | Legislative Decree. 3 December 2010, n. 205 Legislative Decree 3 September 2020, n. 116 |
| 1st Tax Credit | 2nd Tax Credit | 3rd Tax Credit | 4th Tax Credit | Grants for Companies Modifying their Single-Use Plastic Production | |
|---|---|---|---|---|---|
| Normative Reference | Article 26-ter, paragraph 1 decree law n. 34/2019 | Article 1, paragraphs 73–77, law 145/2018 | Article 4, paragraph 7, legislative decree 196/2021 | Article 1, paragraph 686–690, law n. 197/2022 | Article 4, paragraph 1 and 8, legislative decree 196/2021 |
| Financial Resources (€) | 10,000,000 | 12,000,000 | 9,000,000 | 10,000,000 | 30,000,000 |
| Eligible Facilitation | Tax credit equal to 25% of eligible expenditures. The maximum amount is 10,000 euros | Tax credit equal to 36% of eligible expenditures. The maximum amount is 20,000 euros for year. | Tax credit equal to 20% of eligible expenditures. The maximum amount is 10,000 euros for year. | Tax credit equal to 36% of eligible expenditures. The maximum amount is 20,000 euros for year | The grant can be equal to: 40% of expenses for design services for cycle modification; 80% of expenses for the purchase of machinery, plant, equipment and components, of computer programs and licenses. The maximum amount is 300,000 euros. |
| Expenditure to be reported | Purchases in 2020 regarding: | Purchases in 2019 and 2020 regarding: | Purchases in 2022, 2023 and 2024 regarding: | Purchases in 2023 and 2024 regarding: | All expenses to support companies producing single-use plastic products to modify their production cycles |
| Semi-finished and finished products of which at least 75% of their composition derives from the recycling of waste or scrap; compost arising from the treatment of organic fraction of waste. | Packaging produced with at least 30% of recycled plastic; biodegradable and compostable packaging (made up of plastic, paper, wood); packaging produced with at least 70% of recycled paper; packaging made up with at least 50% recycled aluminum. | Different products than single use plastic products (e. g. cotton bud sticks, cutlery, plates, straws and stirrers, balloons and sticks for balloons, food containers, cups for beverages, beverage containers) | Packaging produced with at least 30% of recycled plastic, biodegradable and compostable packaging (made up of plastic, paper, wood) packaging produced with at least 70% of recycled paper; packaging made up with at least 60% recycled aluminum; packaging made up with at least 100% recycled glass. | ||
| Number of subsidies granted | 1,084,602.69 | 8,508,249.84 | not available | not available | not available |
| Number of financed projects | 144 | 484 | not available | not available | not available |
| Average facilitation granted | 7532 | 17,579 | not available | not available | not available |
| Used financial resources | 11% | 71% | not available | not available | not available |
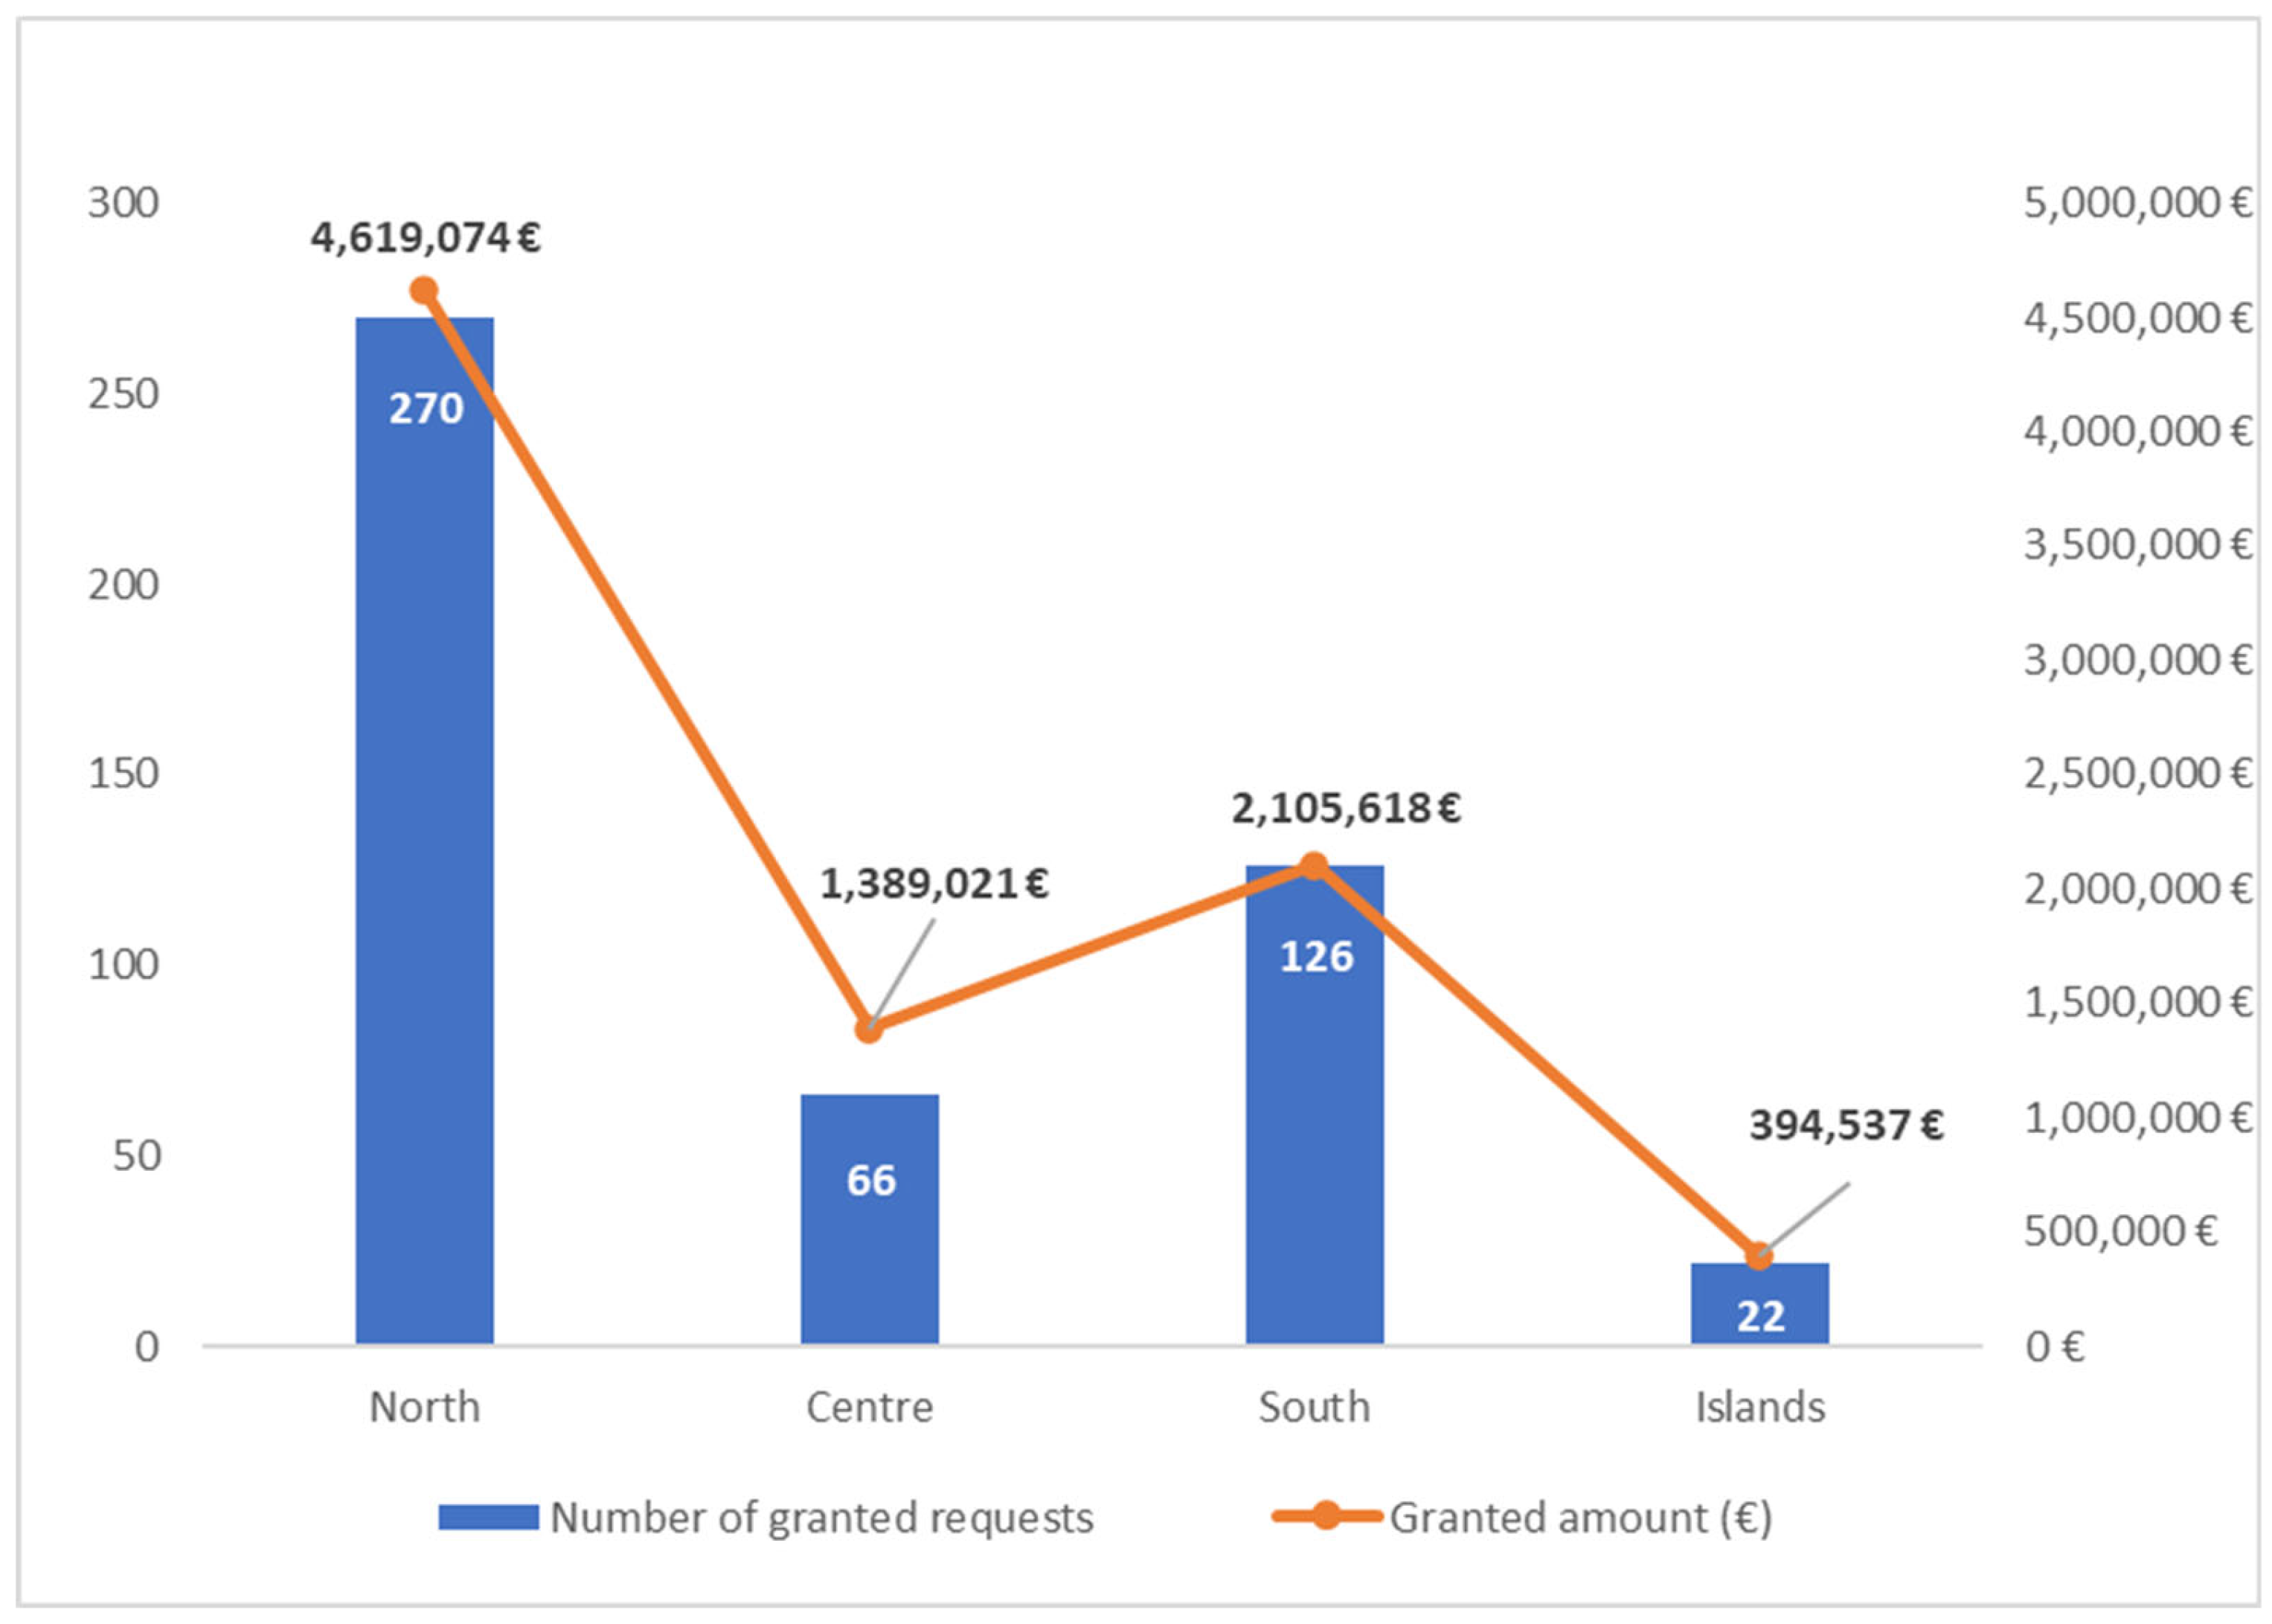
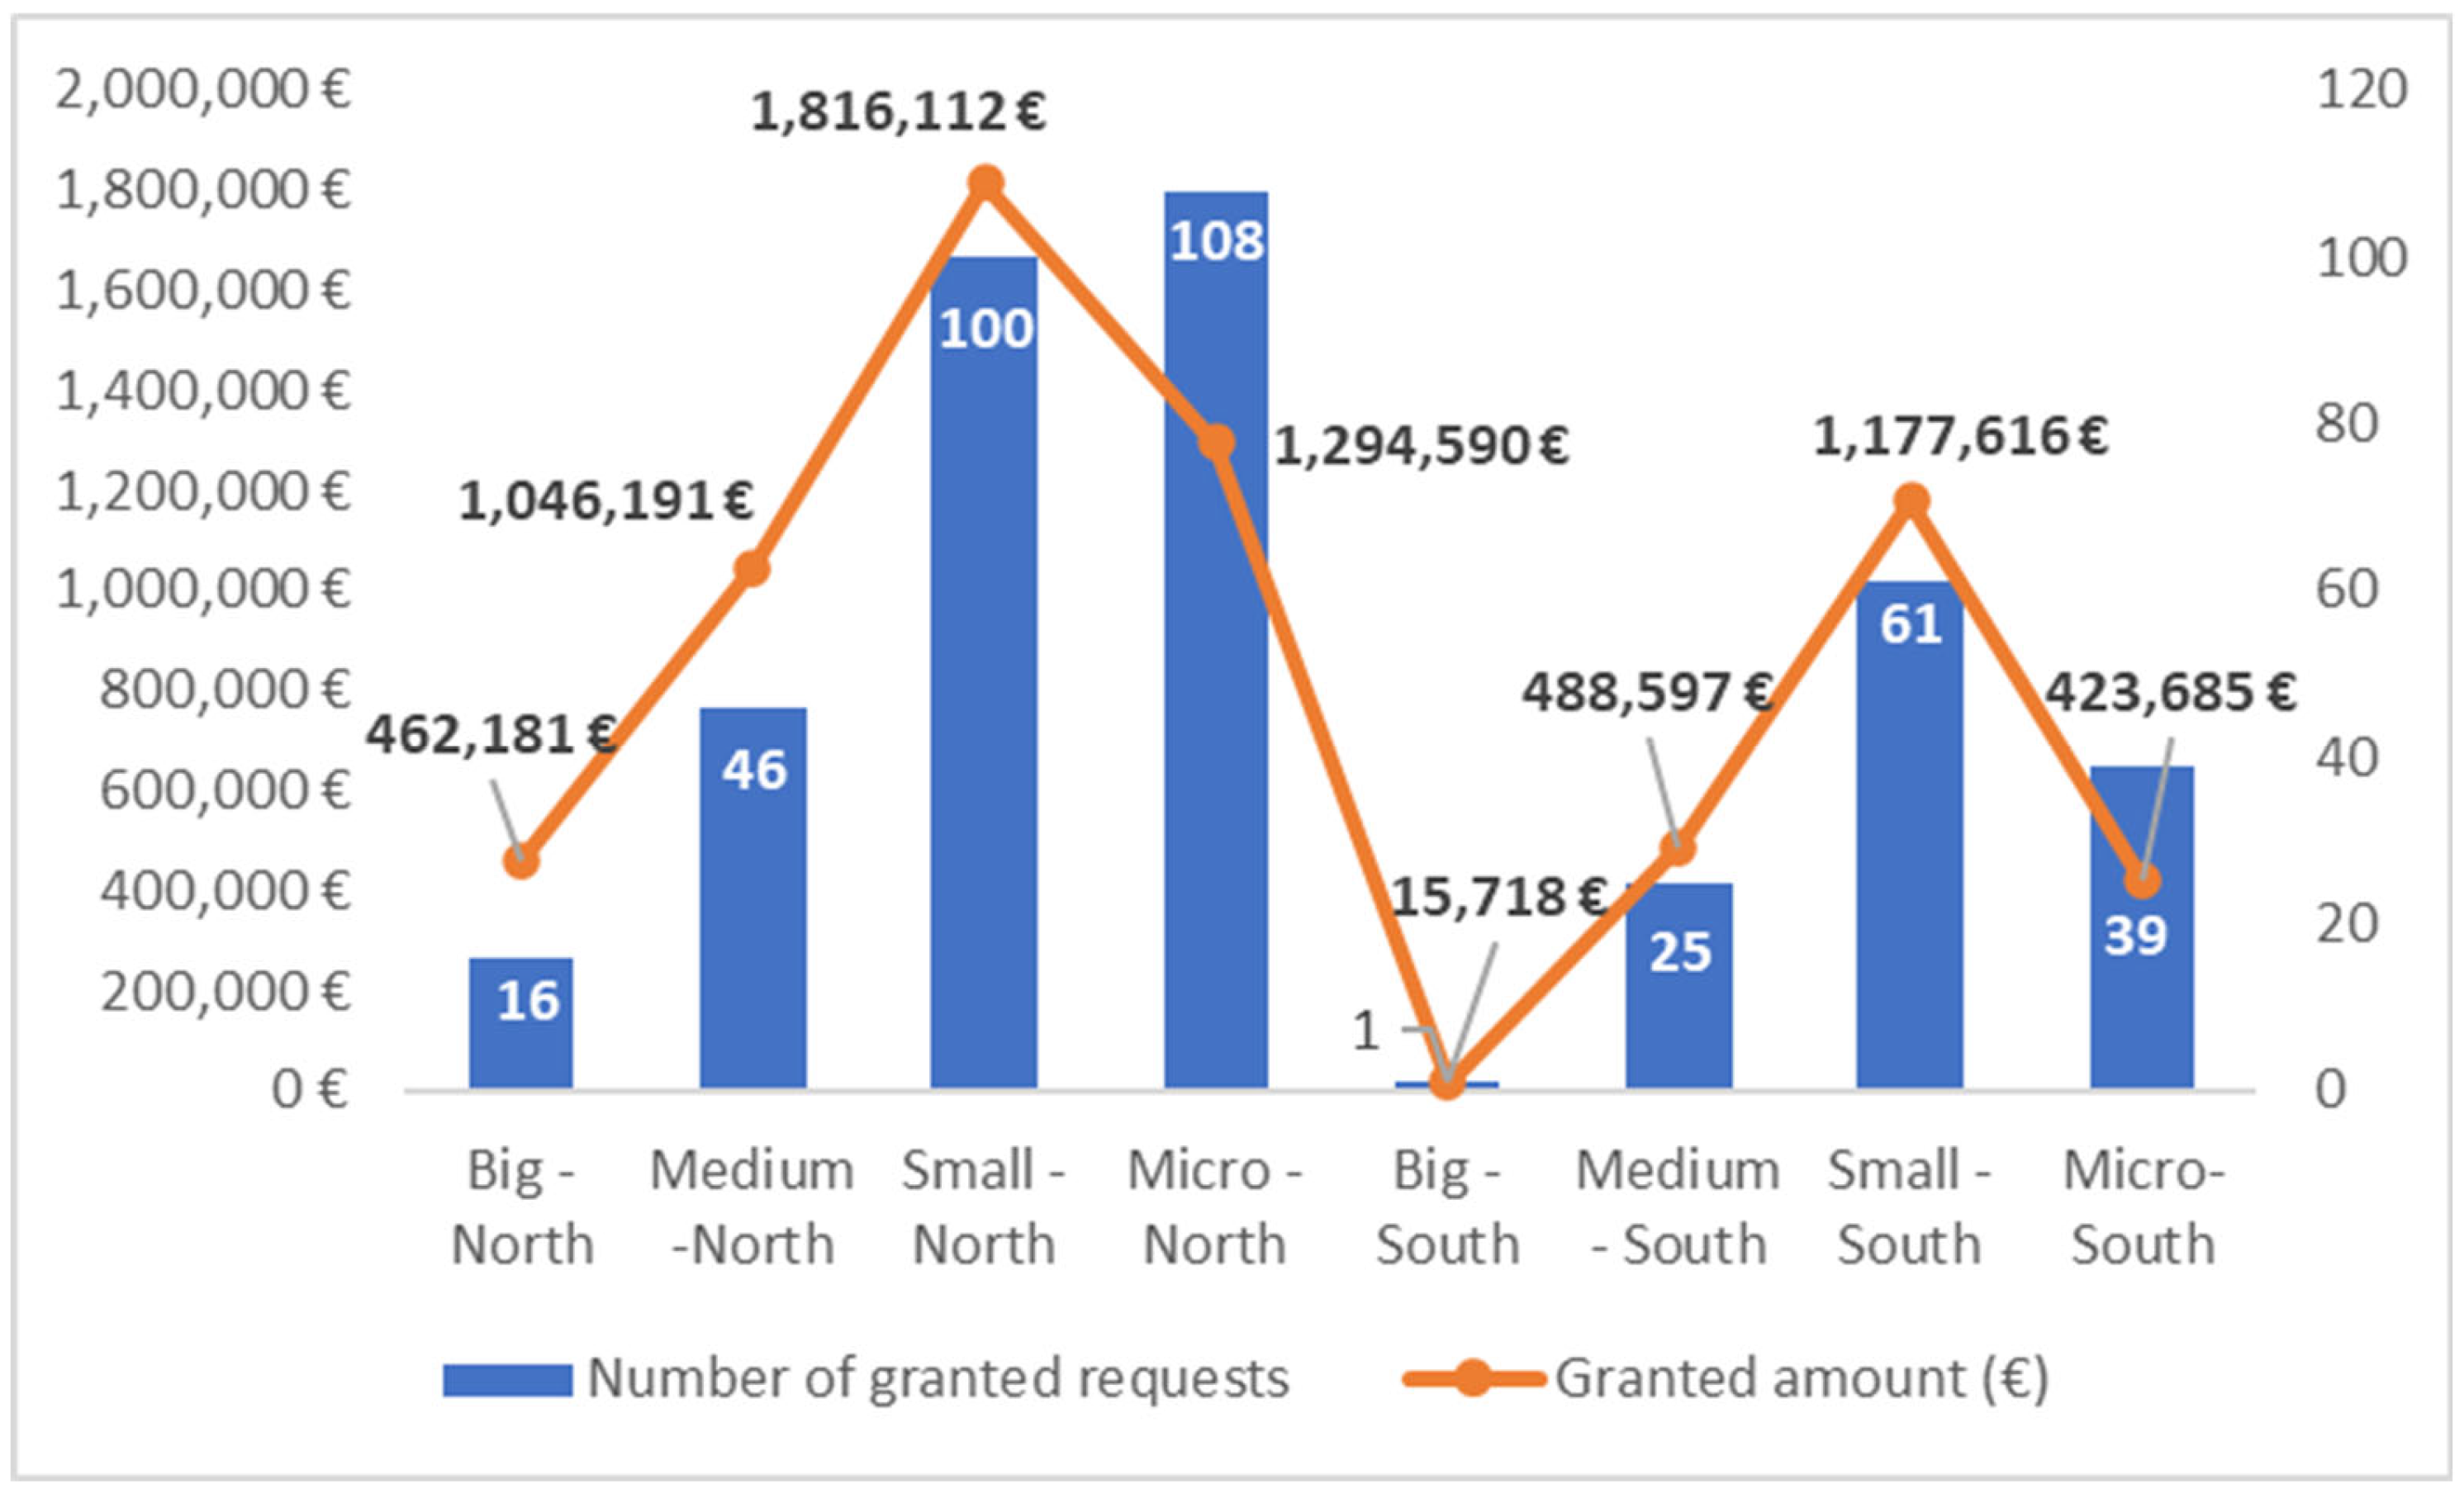
| Enterprise Localization and Dimension | Number of Granted Requests | Granted Amount (€) | Average Granted Amount (€) |
|---|---|---|---|
| North | 270 | 4,619,074 | 17,108 |
| Big | 16 | 462,181 | 28,886 |
| Medium | 46 | 1,046,191 | 22,743 |
| Small | 100 | 1,816,112 | 18,161 |
| Micro | 108 | 1,294,590 | 11,987 |
| Centre | 66 | 1,389,021 | 21,046 |
| Big | 7 | 221,403 | 31,629 |
| Medium | 14 | 400,103 | 28,579 |
| Small | 26 | 644,496 | 24,788 |
| Micro | 19 | 123,019 | 6475 |
| South | 126 | 2,105,618 | 16,711 |
| Big | 1 | 15,718 | 15,718 |
| Medium | 25 | 488,597 | 19,544 |
| Small | 61 | 1,177,616 | 19,305 |
| Micro | 39 | 423,685 | 10,864 |
| Islands | 22 | 394,537 | 17,934 |
| Big | 1 | 40,000 | 40,000 |
| Medium | 4 | 116,197 | 29,049 |
| Small | 5 | 107,497 | 21,499 |
| Micro | 12 | 130,843 | 10,904 |
| Total | 484 | 8,508,250 | 17,579 |
| Sectors | Beneficiaries | Tot. Granted Aids (€) | % Beneficiaries for Sector |
|---|---|---|---|
| Agriculture | 208 | 3,356,926 | 0.02% |
| Wholesale Trade | 85 | 1,748,730 | 0.02% |
| Food Industries | 31 | 715,317 | 0.06% |
| Food Service Activities | 30 | 580,363 | 0.01% |
| Plastic Manufacturing | 21 | 475,687 | 0.22% |
| Retail Trade | 17 | 101,739 | 0.00% |
| Mineral Products Manuf, | 15 | 402,325 | 0.09% |
| Metal Products Manuf. | 11 | 174,994 | 0.02% |
| Chemicals Manufacturing | 9 | 117,910 | 0.21% |
| Paper Manufacturing | 7 | 215,936 | 0.21% |
| Waste Collection | 6 | 138,035 | 0.08% |
| Furniture Manufacturing | 5 | 174,176 | 0.03% |
| Household Equipment | 5 | 116,073 | 0.06% |
| Total | 450 | 8,318,211 | 0.02% |
References
- Ritchie, H.; Samborska, V.; Roser, M. “Plastic Pollution” Published online at OurWorldInData.org. 2023. Available online: https://ourworldindata.org/plastic-pollution (accessed on 9 November 2024).
- Nayanathara Thathsarani Pilapitiya, P.G.C.; Ratnayake, A.S. The world of plastic waste: A review. Clean. Mater. 2024, 11, 100220. [Google Scholar] [CrossRef]
- Foschi, E.; Bonoli, A. The Commitment of Packaging Industry in the Framework of the European Strategy for Plastics in a Circular Economy. Adm. Sci. 2019, 9, 18. [Google Scholar] [CrossRef]
- Ellen MacArthur Foundation and McKinsey & Company. The New Plastics Economy: Rethinking the Future of Plastics; Ellen MacArthur Foundation and McKinsey & Company: Cowes, UK, 2016. [Google Scholar]
- PLASTICEUROPE. Plastic—The Facts 2024. Brussels: Plastics Europe. 2024. Available online: https://plasticseurope.org/knowledge-hub/plastics-the-fast-facts-2024/ (accessed on 28 January 2025).
- ISPRA. Rapporto Rifiuti Urbani. 2024. Available online: https://www.isprambiente.gov.it/files2024/pubblicazioni/rapporti/rapportorifiutiurbani_ed-2024_n406_versione_integrale.pdf (accessed on 28 January 2025).
- UNEP. Pollution and Marine Litter. UNEP, 2024. Available online: https://www.unep.org/topics/ocean-seas-and-coasts/ecosystem-degradation-pollution/plastic-pollution-and-marine-litter-0 (accessed on 7 August 2024).
- Zu Castell-Rüdenhausen, M.; Almasi, A.; Vanderreydt, I. Non-packaging plastics in Europe. European Topic Centre on Circular Economy and Resource Use. 2022. Available online: https://www.eionet.europa.eu/etcs/etc-ce/products/etc-ce-products/etc-ce-report-2022-7-non-packaging-plastics-in-europe (accessed on 8 November 2024).
- Foschi, E.; Zanni, S.; Bonoli, A. Combining eco-design and LCA as decision-making process to prevent plastics in packaging application. Sustainability 2020, 12, 9738. [Google Scholar] [CrossRef]
- OECD. Overview and policy highlights. In Global Plastics Outlook: Economic Drivers, Environmental Impacts and Policy Options; OECD Publishing: Paris, France, 2022. [Google Scholar] [CrossRef]
- De Weerdt, L.; Compernolle, T.; Hagspiel, V.; Kort, P.; Oliveira, C. Stepwise Investment in Circular Plastics Under the Presence of Policy Uncertainty. Environ. Resour. Econ. 2022, 83, 413–443. [Google Scholar] [CrossRef]
- Confederation of European Paper Industries (Cepi). Monitoring Report 2023. Available online: https://www.cepi.org/wp-content/uploads/2024/09/Key-Statistics-2023-FINAL-2.pdf (accessed on 14 April 2025).
- Luo, J.; Pan, Z.; Zhang, S. Greening the economy: Techniques and regulations to promote natural resource efficiency. Resour. Policy 2024, 90, 104686. [Google Scholar] [CrossRef]
- Karplus, V.J.; Zhang, J.; Zhao, J. Navigating and Evaluating the Labyrinth of Environmental Regulation in China. Rev. Environ. Econ. Policy 2021, 15, 300–322. [Google Scholar] [CrossRef]
- Chen, N.; Qin, X.; Zhong, S. Economic and carbon emission assessment of compostable plastics as a substitute for petrochemical plastics: A case study in Yunnan Province. Environ. Dev. Sustain. Scopus. 2024, 1–24. [Google Scholar] [CrossRef]
- Santos, A.D.M.; Sant’Anna, Â.M.O. Industry 4.0 Technologies for Sustainability within Small and Medium Enterprises: A Systematic Literature Review and Future Directions. J. Clean. Prod. 2024, 467, 143023. [Google Scholar] [CrossRef]
- Yan, Z.; Yu, Y.; Du, K.; Zhang, N. How does environmental regulation promote green technology innovation? Evidence from China’s total emission control policy. Ecol. Econ. 2024, 219, 108137. [Google Scholar] [CrossRef]
- Domenech, T.; Bleischwitz, R.; Doranova, A.; Panayotopoulos, D.; Roman, L. Mapping Industrial Symbiosis Development in Europe typologies of networks, characteristics, performance and contribution to the Circular Economy. Resour. Conserv. Recycl. 2019, 141, 76–98. [Google Scholar] [CrossRef]
- Rizos, V.; Behrens, A.; Van Der Gaast, W.; Hofman, E.; Ioannou, A.; Kafyeke, T.; Flamos, A.; Rinaldi, R.; Papadelis, S.; Hirschnitz-Garbers, M.; et al. Implementation of Circular Economy Business Models by Small and Medium-Sized Enterprises (SMEs): Barriers and Enablers. Sustainability 2016, 8, 1212. [Google Scholar] [CrossRef]
- Demirel, P.; Danisman, G.O. Eco-Innovation and Firm Growth in the Circular Economy: Evidence from European Small- and Medium-Sized Enterprises. Bus. Strategy Environ. 2019, 28, 1608–1618. [Google Scholar] [CrossRef]
- Losa, R. Public policies on circular economy: A systematic review. Ecol. Econ. 2025, 228, 108452. [Google Scholar] [CrossRef]
- Xian, M. Impact of Inclusive Growth. Environmental Policy Incentives. Fintech and Globalization on Environmental Sustainability in G20 Countries. Sustainability 2024, 17, 50. [Google Scholar] [CrossRef]
- Nguyen, T.P.; Duong, T.T.-T. Asymmetric Effects of Fiscal Policy and Foreign Direct Investment Inflows on CO2 Emissions—An Application of Nonlinear ARDL. Sustainability 2025, 17, 2503. [Google Scholar] [CrossRef]
- Tchorzewska, K.B. A Lost Opportunity? Environmental Investment Tax Incentive and Energy Efficient Technologies. Environ. Resour. Econ. 2024, 87, 3301–3333. [Google Scholar] [CrossRef]
- Abiola, B.A.; Visser, M.; Daniels, R.C. Addressing plastic bags consumption crises through store monetary and non-monetary interventions in South Africa. Front. Sustain. 2022, 3, 968886. [Google Scholar] [CrossRef]
- Agovino, M.; Cerciello, M.; Musella, G.; Garofalo, A. European waste management regulations and the transition towards circular economy. A shift-and-share analysis. J. Environ. Manag. 2024, 354, 120423. [Google Scholar] [CrossRef]
- Ghisellini, P.; Cialani, C.; Ulgiati, S. A review on circular economy: The expected transition to a balanced interplay of environmental and economic systems. J. Clean. Prod. 2016, 114, 11–32. [Google Scholar] [CrossRef]
- Parris Denise, L.; McInnis-Bowers, C.V. Social Entrepreneurship Questioning the Status Quo: Waste as a Resource. J. Econ. Issues 2014, 48, 359–366. [Google Scholar] [CrossRef]
- Rodrigues, I.A.P.T.; Alves, R.V.; Guimarães, M.J.O.C.; Gomes, T.S.; Pacheco, E.B.A.V. Assessment of plastic lumber production in Brazil as a substitute for natural wood. Environ. Dev. Sustain. 2022, 24, 9705–9730. [Google Scholar] [CrossRef]
- Zhao, Y.; Peng, B.; Elahi, E.; Wan, A. Does the extended producer responsibility system promote the green technological innovation of enterprises? An empirical study based on the difference-in-differences model. J. Clean. Prod. 2021, 319, 128631. [Google Scholar] [CrossRef]
- Alev, I.; Agrawal, V.V.; Atasu, A. Extended Producer Responsibility for Durable Products. Manuf. Serv. Oper. Manag. 2020, 22, 364–382. [Google Scholar] [CrossRef]
- Sun, L.; Li, H.; Dong, L.; Fang, K.; Ren, J.; Geng, Y.; Fujii, M.; Zhang, W.; Zhang, N.; Liu, Z. Eco-Benefits Assessment on Urban Industrial Symbiosis Based on Material Flows Analysis and Emergy Evaluation Approach: A Case of Liuzhou City, China. Resour. Conserv. Recycl. 2017, 119, 78–88. [Google Scholar] [CrossRef]
- Evans, S.; Benedetti, M.; Holgado Granados, M. Library of Industrial Symbiosis Case Studies and Linked Exchanges; Apollo-University of Cambridge Repository: Cambridge, UK, 2017. [Google Scholar] [CrossRef]
- Jamwal, A.; Agrawal, R.; Sharma, M. Challenges and opportunities for manufacturing SMEs in adopting industry 4.0 technologies for achieving sustainability: Empirical evidence from an emerging economy. Oper. Manag. Res. 2023, 1–26. [Google Scholar] [CrossRef]
- Bag, S.; Pretorius, J.H.C. Relationships between Industry 4.0. Sustainable Manufacturing and Circular Economy: Proposal of a Research Framework. Int. J. Organ. Anal. 2022, 30, 864–898. [Google Scholar] [CrossRef]
- Arroyabe, M.F.; Arranz, C.F.A.; De Arroyabe, J.C.F. The integration of circular economy and digital transformation as a catalyst for small and medium enterprise innovation. Bus. Strategy Environ. 2024, 33, 7162–7181. [Google Scholar] [CrossRef]
- Findik, D.; Tirgil, A.; Özbuğday, F.C. Industry 4.0 as an enabler of circular economy practices: Evidence from European SMEs. J. Clean. Prod. 2023, 410, 137281. [Google Scholar] [CrossRef]
- ISTAT. Registro Statico Delle Imprese Attive. 2022. Available online: https://www.istat.it/storage/ASI/2022/capitoli/C14.pdf (accessed on 28 November 2024).
- Muise, I.; Adams, M.; Côté, R.; Price, G.W. Attitudes to the recovery and recycling of agricultural plastics waste: A case study of Nova Scotia, Canada. Resour. Conserv. Recycl. 2016, 109, 137–145. [Google Scholar] [CrossRef]
- Geueke, B.; Groh, K.; Muncke, J. Food packaging in the circular economy: Overview of chemical safety aspects for commonly used materials. J. Clean. Prod. 2018, 193, 491–505. [Google Scholar] [CrossRef]
- Kondala, M.; Nudurupati, S.S.; Pappu, R.P. The challenges in adoption of circular economy in SMEs—A research agenda and way forward. Benchmarking Int. J. 2023, 31, 1667–1699. [Google Scholar] [CrossRef]
- Anguiano-Santos, C.; Rodríguez-Entrena, M. Sustainability reporting in focus: Analysing Spanish transposition of the Non-Financial Reporting European Directive in the agri-food sector. Agric. Food Econ. 2024, 12, 10. [Google Scholar] [CrossRef]
- Lámfalusi, I.; Hámori, J.; Rózsa, A.; Hegyi, J.; Kacz, K.; Miklósné Varga, A.; Troján, S.; Gombkötő, N. Evaluation of sustainability reporting of the food industry in Hungary from an EU taxonomy perspective. Qual. Quant. 2024, 58, 4479–4504. [Google Scholar] [CrossRef]
- Wagenhofer, A. Sustainability Reporting: A Financial Reporting Perspective. Account. Eur. 2024, 21, 1–13. [Google Scholar] [CrossRef]
- Rizzo, L.; Secomandi, R. Pay as You Throw Threshold Tariff: Evidence on the Incentive to Recycle. BE J. Econ. Anal. Policy 2024, 24, 361–395. [Google Scholar] [CrossRef]
- Shih, H.C.; Lai, Y.T.; Yang, H.Y.; Ma, H.W. Development of Secondary Material Competition Modelling for Evaluation of Incentive Policies on Plastic Waste. J. Clean. Prod. 2024, 434, 140195. [Google Scholar] [CrossRef]
- Maitre-Ekern, E. Re-Thinking Producer Responsibility for a Sustainable Circular Economy from Extended Producer Responsibility to Pre-Market Producer Responsibility. J. Clean. Prod. 2021, 286, 125454. [Google Scholar] [CrossRef]
- Ng, T.-H.; Lim, Y.-S.; Lim, Y.-Z.; Chan, K.-H.; Lye, C.-T. Is economic policy uncertainty detrimental to sustainability? Evidence from Asian countries. Environ. Dev. Sustain. 2023, 26, 20885–20908. [Google Scholar] [CrossRef]
- Ahmed, Z.; Cary, M.; Shahbaz, M.; Vo, X.V. Asymmetric nexus between economic policy uncertainty, renewable energy technology budgets, and environmental sustainability: Evidence from the United States. J. Clean. Prod. 2021, 313, 127723. [Google Scholar] [CrossRef]

Disclaimer/Publisher’s Note: The statements, opinions and data contained in all publications are solely those of the individual author(s) and contributor(s) and not of MDPI and/or the editor(s). MDPI and/or the editor(s) disclaim responsibility for any injury to people or property resulting from any ideas, methods, instructions or products referred to in the content. |
© 2025 by the authors. Licensee MDPI, Basel, Switzerland. This article is an open access article distributed under the terms and conditions of the Creative Commons Attribution (CC BY) license (https://creativecommons.org/licenses/by/4.0/).
Share and Cite
D’Ascenzo, F.; Vinci, G.; Cancer, G.; Ruggeri, M.; Savastano, M. The Evaluation of Corporate Sustainability Strategies in Italy: Challenges and Opportunity of Recycled Packaging. Sustainability 2025, 17, 3608. https://doi.org/10.3390/su17083608
D’Ascenzo F, Vinci G, Cancer G, Ruggeri M, Savastano M. The Evaluation of Corporate Sustainability Strategies in Italy: Challenges and Opportunity of Recycled Packaging. Sustainability. 2025; 17(8):3608. https://doi.org/10.3390/su17083608
Chicago/Turabian StyleD’Ascenzo, Fabrizio, Giuliana Vinci, Giulia Cancer, Marco Ruggeri, and Marco Savastano. 2025. "The Evaluation of Corporate Sustainability Strategies in Italy: Challenges and Opportunity of Recycled Packaging" Sustainability 17, no. 8: 3608. https://doi.org/10.3390/su17083608
APA StyleD’Ascenzo, F., Vinci, G., Cancer, G., Ruggeri, M., & Savastano, M. (2025). The Evaluation of Corporate Sustainability Strategies in Italy: Challenges and Opportunity of Recycled Packaging. Sustainability, 17(8), 3608. https://doi.org/10.3390/su17083608