Article

Assessment of Landslide Susceptibility Based on ReliefF Feature Weight Fusion: A Case Study of Wenxian County, Longnan City

by
Zhijun Wang
* and
Chenxi Zhao
*
School of Energy and Power Engineering, Lanzhou University of Technology, Lanzhou 730050, China
*
Authors to whom correspondence should be addressed.
Sustainability 2025, 17(8), 3536; https://doi.org/10.3390/su17083536
Submission received: 3 March 2025 / Revised: 10 April 2025 / Accepted: 12 April 2025 / Published: 15 April 2025

Abstract

:
The Longnan mountainous area, characterized by its complex geological structure and fragile geological environment, is one of the four major regions in China prone to geological disasters. Previous studies have employed traditional evaluation methods to assess landslide susceptibility in the Longnan mountainous area. However, these traditional methods are often subjective, and their accuracy and efficiency are difficult to guarantee. This study, supported by GIS technology, focuses on Wen County in Longnan City, a region frequently affected by landslide disasters. Based on 260 collected landslide disaster points, the study combines the ReliefF model to evaluate and zone landslide susceptibility in Wen County, Longnan City, based on feature contribution values. The lithology and rainfall factors have significant impacts on geological disasters, respectively. Areas along rivers and roads, with loose soil, heavy rainfall, steep slopes, and dense vegetation, are more prone to landslide disasters due to the combined effects of natural factors and human activities. This study also uses the receiver operating characteristic (ROC) curve to validate the accuracy of the evaluation results. The area under the curve (AUC) for the ReliefF feature fusion method is 0.853, which is higher than the 0.838 obtained from the information value method. The ReliefF method demonstrates excellent performance in landslide susceptibility evaluation, offering better predictive capability at a lower computational cost, thus achieving a balance between accuracy and efficiency. This approach can provide valuable references for rapid decision-making by relevant geological disaster prevention and management departments.

1. Introduction

Landslides are recognized as one of the most destructive types of geological hazards globally, causing severe casualties and economic losses across diverse regions [1]. According to statistical estimates, these disasters annually incur economic losses amounting to billions of US dollars and result in thousands of casualties worldwide [2]. Such hazards not only directly threaten human lives and property but may also trigger secondary disasters, including dammed lake outbursts and transportation disruptions, thereby exacerbating socio-economic losses through cascading effects. Among geological disasters, landslides account for the largest proportion and result in the highest direct socio-economic losses [3]. China’s complex topography and numerous mountainous regions make landslide issues particularly prominent [4,5], especially in Longnan City, Gansu Province, where the geological structure is intricate and the geological environment is fragile. Longnan City is recognized as one of the four major regions in China prone to geological disasters. Since 1949, landslides, collapses, and debris flows in Wen County, Longnan City, have caused 91 deaths, 93 injuries, the destruction of 11,094 houses and caves, and cumulative direct economic losses of 229.59978 million CNY [6], posing a significant threat to the safety of local residents’ lives and property. However, the influencing factors of landslide disasters vary across different regions [7]. In-depth exploration of the causes, impacts, and prevention measures of landslides, as well as susceptibility zoning evaluation at a regional scale, is of great significance for disaster prevention and control, enhancing disaster response capabilities, and minimizing losses [8].
In terms of susceptibility zoning assessment, early research on natural disaster prediction primarily relied on manual surveys [9,10]. With the application of GIS technology in geological disaster prediction research, methods such as the Analytic Hierarchy Process (AHP) [10] and expert scoring have been combined to facilitate landslide prediction. Xu Chong et al. [11] established a susceptibility zoning assessment for the Wenchuan area based on GIS and AHP, achieving an area under the ROC curve (AUC) of 79.656%, indicating acceptable accuracy and good zoning results. However, AHP is highly subjective [12]. With the increasing completeness of landslide disaster databases, objective analysis methods such as the information value method and entropy method have become widely used in susceptibility assessment. Mandal S P et al. [13] used GIS-based “information value” and “frequency ratio” methods for landslide probability analysis, achieving AUC values of 0.88 and 0.84, respectively, significantly improving prediction accuracy compared to subjective analysis methods [14]. However, as the data scales increase, the computational cost of the information value method also rises, leading to reduced efficiency in large-scale applications [15,16]. While these methods significantly enhance objectivity, their practical application may be constrained by computational complexity and specific data requirements, for example, CRITIC’s dependence on large sample sizes. In contrast, the Relief-F algorithm achieves an optimal balance between efficiency and accuracy with moderate sample sizes (n ≈ 200–500) through feature weight fusion, rendering it more appropriate for the data conditions of our study area.
Currently, machine learning models such as Logistic Regression [9,17], Support Vector Machine (SVM) [18], Decision Tree, Random Forest [19], and Artificial Neural Networks (ANN) have been widely applied in landslide prediction due to their high prediction accuracy [20]. These models can accurately identify data trends and patterns, revealing the influence of various evaluation factors on landslide development. However, the high hardware requirements and computational power needed for machine learning models increase their operational costs [21]. Therefore, exploring evaluation methods that balance accuracy and efficiency is a current focus in landslide prediction research. The ReliefF algorithm [22], known for its simplicity and high computational accuracy, has been widely used in short text classification [23] and fault diagnosis [24], but its application in geological disaster prediction is rarely reported. Multi-Criteria Decision-Making (MCDM) methods have recently demonstrated remarkable advantages in landslide susceptibility assessment, particularly in reducing subjective bias through mathematical optimization. For instance, DEMATEL effectively identifies key predisposing factors by quantifying factor interactions through causal networks [25]. CRITIC objectively assigns weights based on statistical correlations between indicators, thereby eliminating the subjectivity inherent in expert scoring methods [26]. SMART simplifies decision-making processes through standardized thresholds, making it particularly suitable for data-scarce regions [27].
Therefore, this paper takes Wenxian County in Longnan City, Gansu Province, as the study area, based on existing research on mountain landslides, collapses, and debris flows, as well as the team’s preliminary research [28,29] and long-term field surveys. Given that government departments often use ArcGIS software in practical applications, this paper establishes a landslide susceptibility assessment index system based on GIS technology and ReliefF feature weight fusion [30] for disaster susceptibility assessment. The information value method, AHP, and ReliefF feature weight fusion model are compared to achieve high-precision assessment results while reducing computational costs and improving efficiency. This evaluation method and its results are more suitable for providing references for relevant geological disaster prevention and management departments in making quick decisions and have significant theoretical and practical implications for rapid disaster response.

2. Study Area and Data Sources

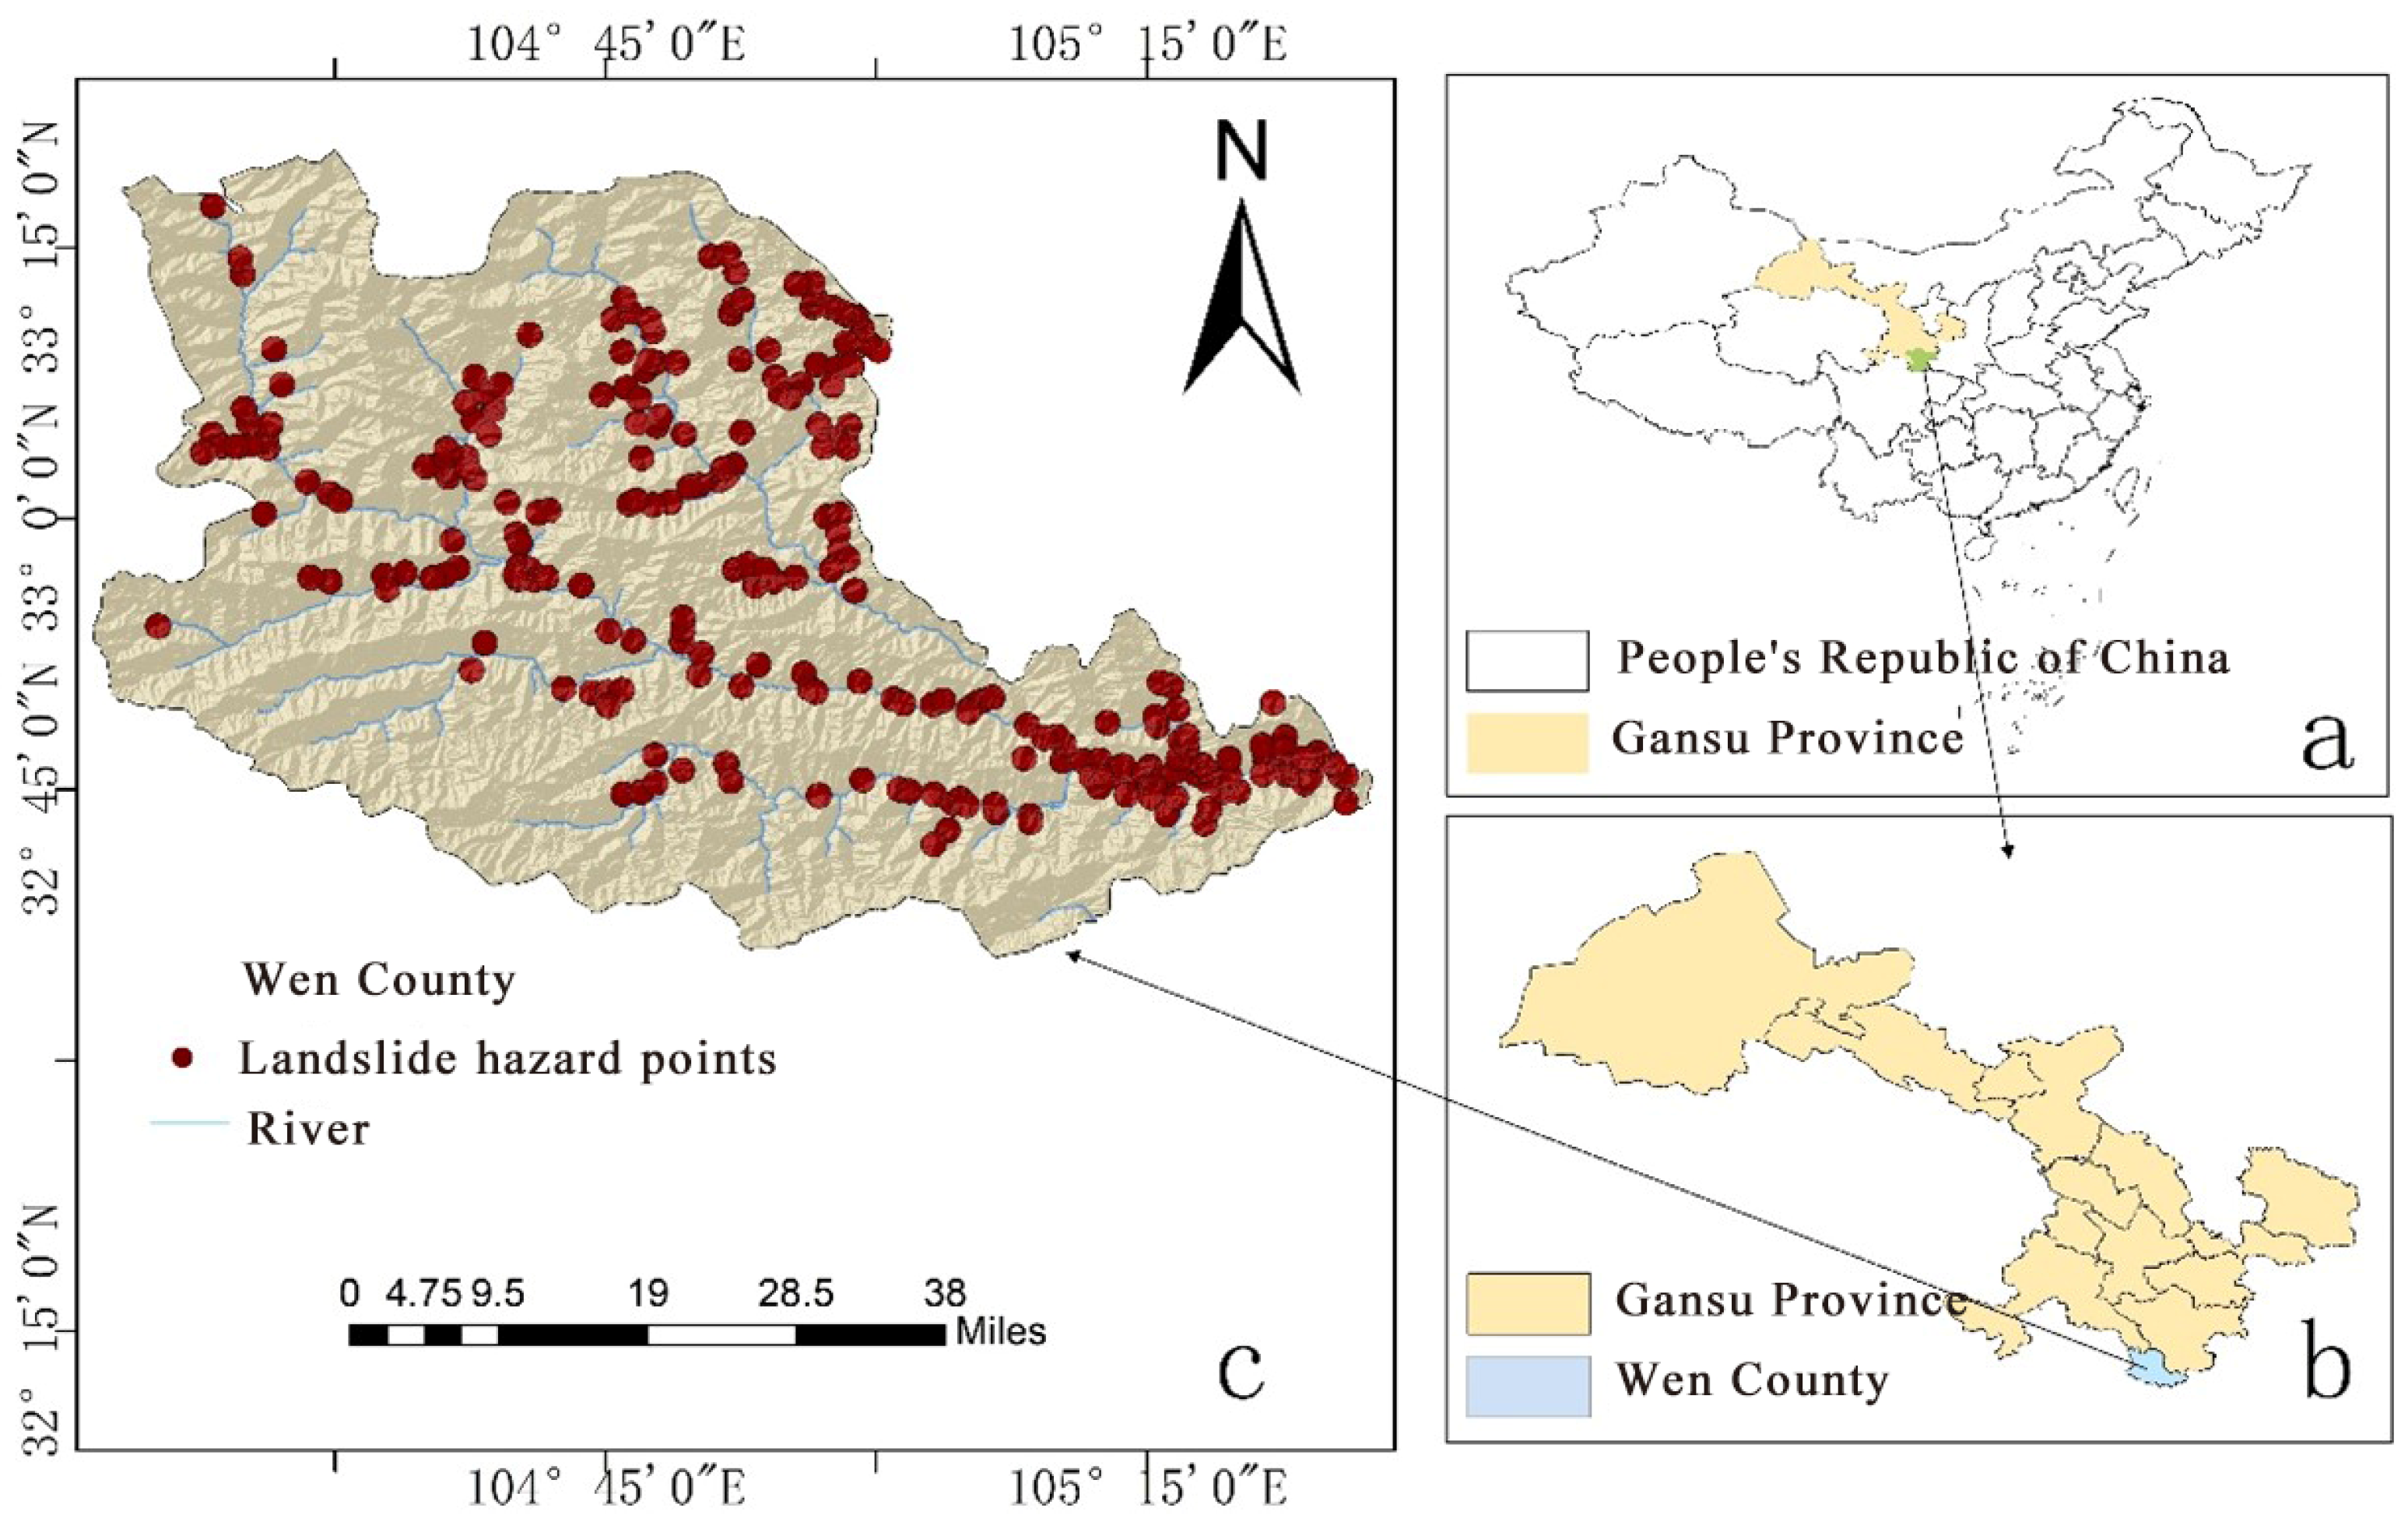
2.1. Overview of the Study Area

Wen County is located in the southern part of Gansu Province, at the junction of Gansu, Sichuan, and Shaanxi Provinces. Its geographical coordinates range from 104°16′16″ to 105°27′29″ E and 32°35′43″ to 33°20′36″ N. The county spans 217 km from east to west and approximately 156 km from north to south, covering a total area of 4994 km2, as shown in Figure 1. The study area is characterized by intense topographic relief and frequent geological disasters. Situated in the inland hinterland, the region falls within a warm, temperate, humid climate zone, with pronounced vertical climatic variations. The area experiences distinct seasons, with dry winters and springs and rainy summers and autumns. Human engineering activities in Wen County are predominantly concentrated in the valleys of the Bailong River, Baishui River, and their tributaries. Over time, the long-term development of fractures and rock fragmentation in the Longnan mountainous area, coupled with frequent heavy rainfall and intensified human engineering activities in recent years, has led to the frequent occurrence of geological disasters such as collapses, landslides, and debris flows. These disasters are driven by both natural factors and human activities, making the region one of the four major debris flow-prone areas in China and one of the most ecologically fragile regions in the upper reaches of the Yangtze River [31].

2.2. Mountain Hazard Inventory

To investigate the characteristics and impacts of landslide disasters, this study acquired data on 260 landslide disaster points in Wenxian County from the National Cryosphere Desert Data Center. The geohazard inventory is presented in Table 1 and Figure 1c, with the dataset compiled at a scale of 1:50,000. These records include historical landslides dating back to 2012 and earlier, with each point validated through field surveys and high-resolution satellite imagery to ensure spatial accuracy. Data quality was further verified by cross-referencing with local geological hazard reports and eliminating duplicate or ambiguous records. The original data in shapefile (vector) format were standardized to WGS84 coordinates and 30-m grid resolution in ArcGIS 10.7 to ensure compatibility with other geospatial layers of evaluation factors. Through systematic organization, attribute normalization, and spatial clustering analysis, the research team integrated these data with long-term field investigations. This comprehensive catalog not only documents landslide distribution but also correlates each event with key evaluation factors, establishing a robust foundation for mechanistic analysis and susceptibility modeling.

2.3. Data Preparation

This paper uses ArcGIS 10.7 and SPSS 27.0 for data visualization analysis and Python 3.10 for model solving. The data used include landslide disaster point data, rainfall data, road and water system data, 30-m resolution DEM data, land cover data, and stratum lithology data, as shown in Table 2. ArcGIS 10.7, DEM data were used to generate elevation, slope, aspect, and roughness data; road and water system data were used to calculate road distance and river distance data using Euclidean distance. This study, based on global meteorological station rainfall points, applied a semivariogram-optimized Ordinary Kriging interpolation method to construct the mean annual precipitation isohyet map of the study area [32].

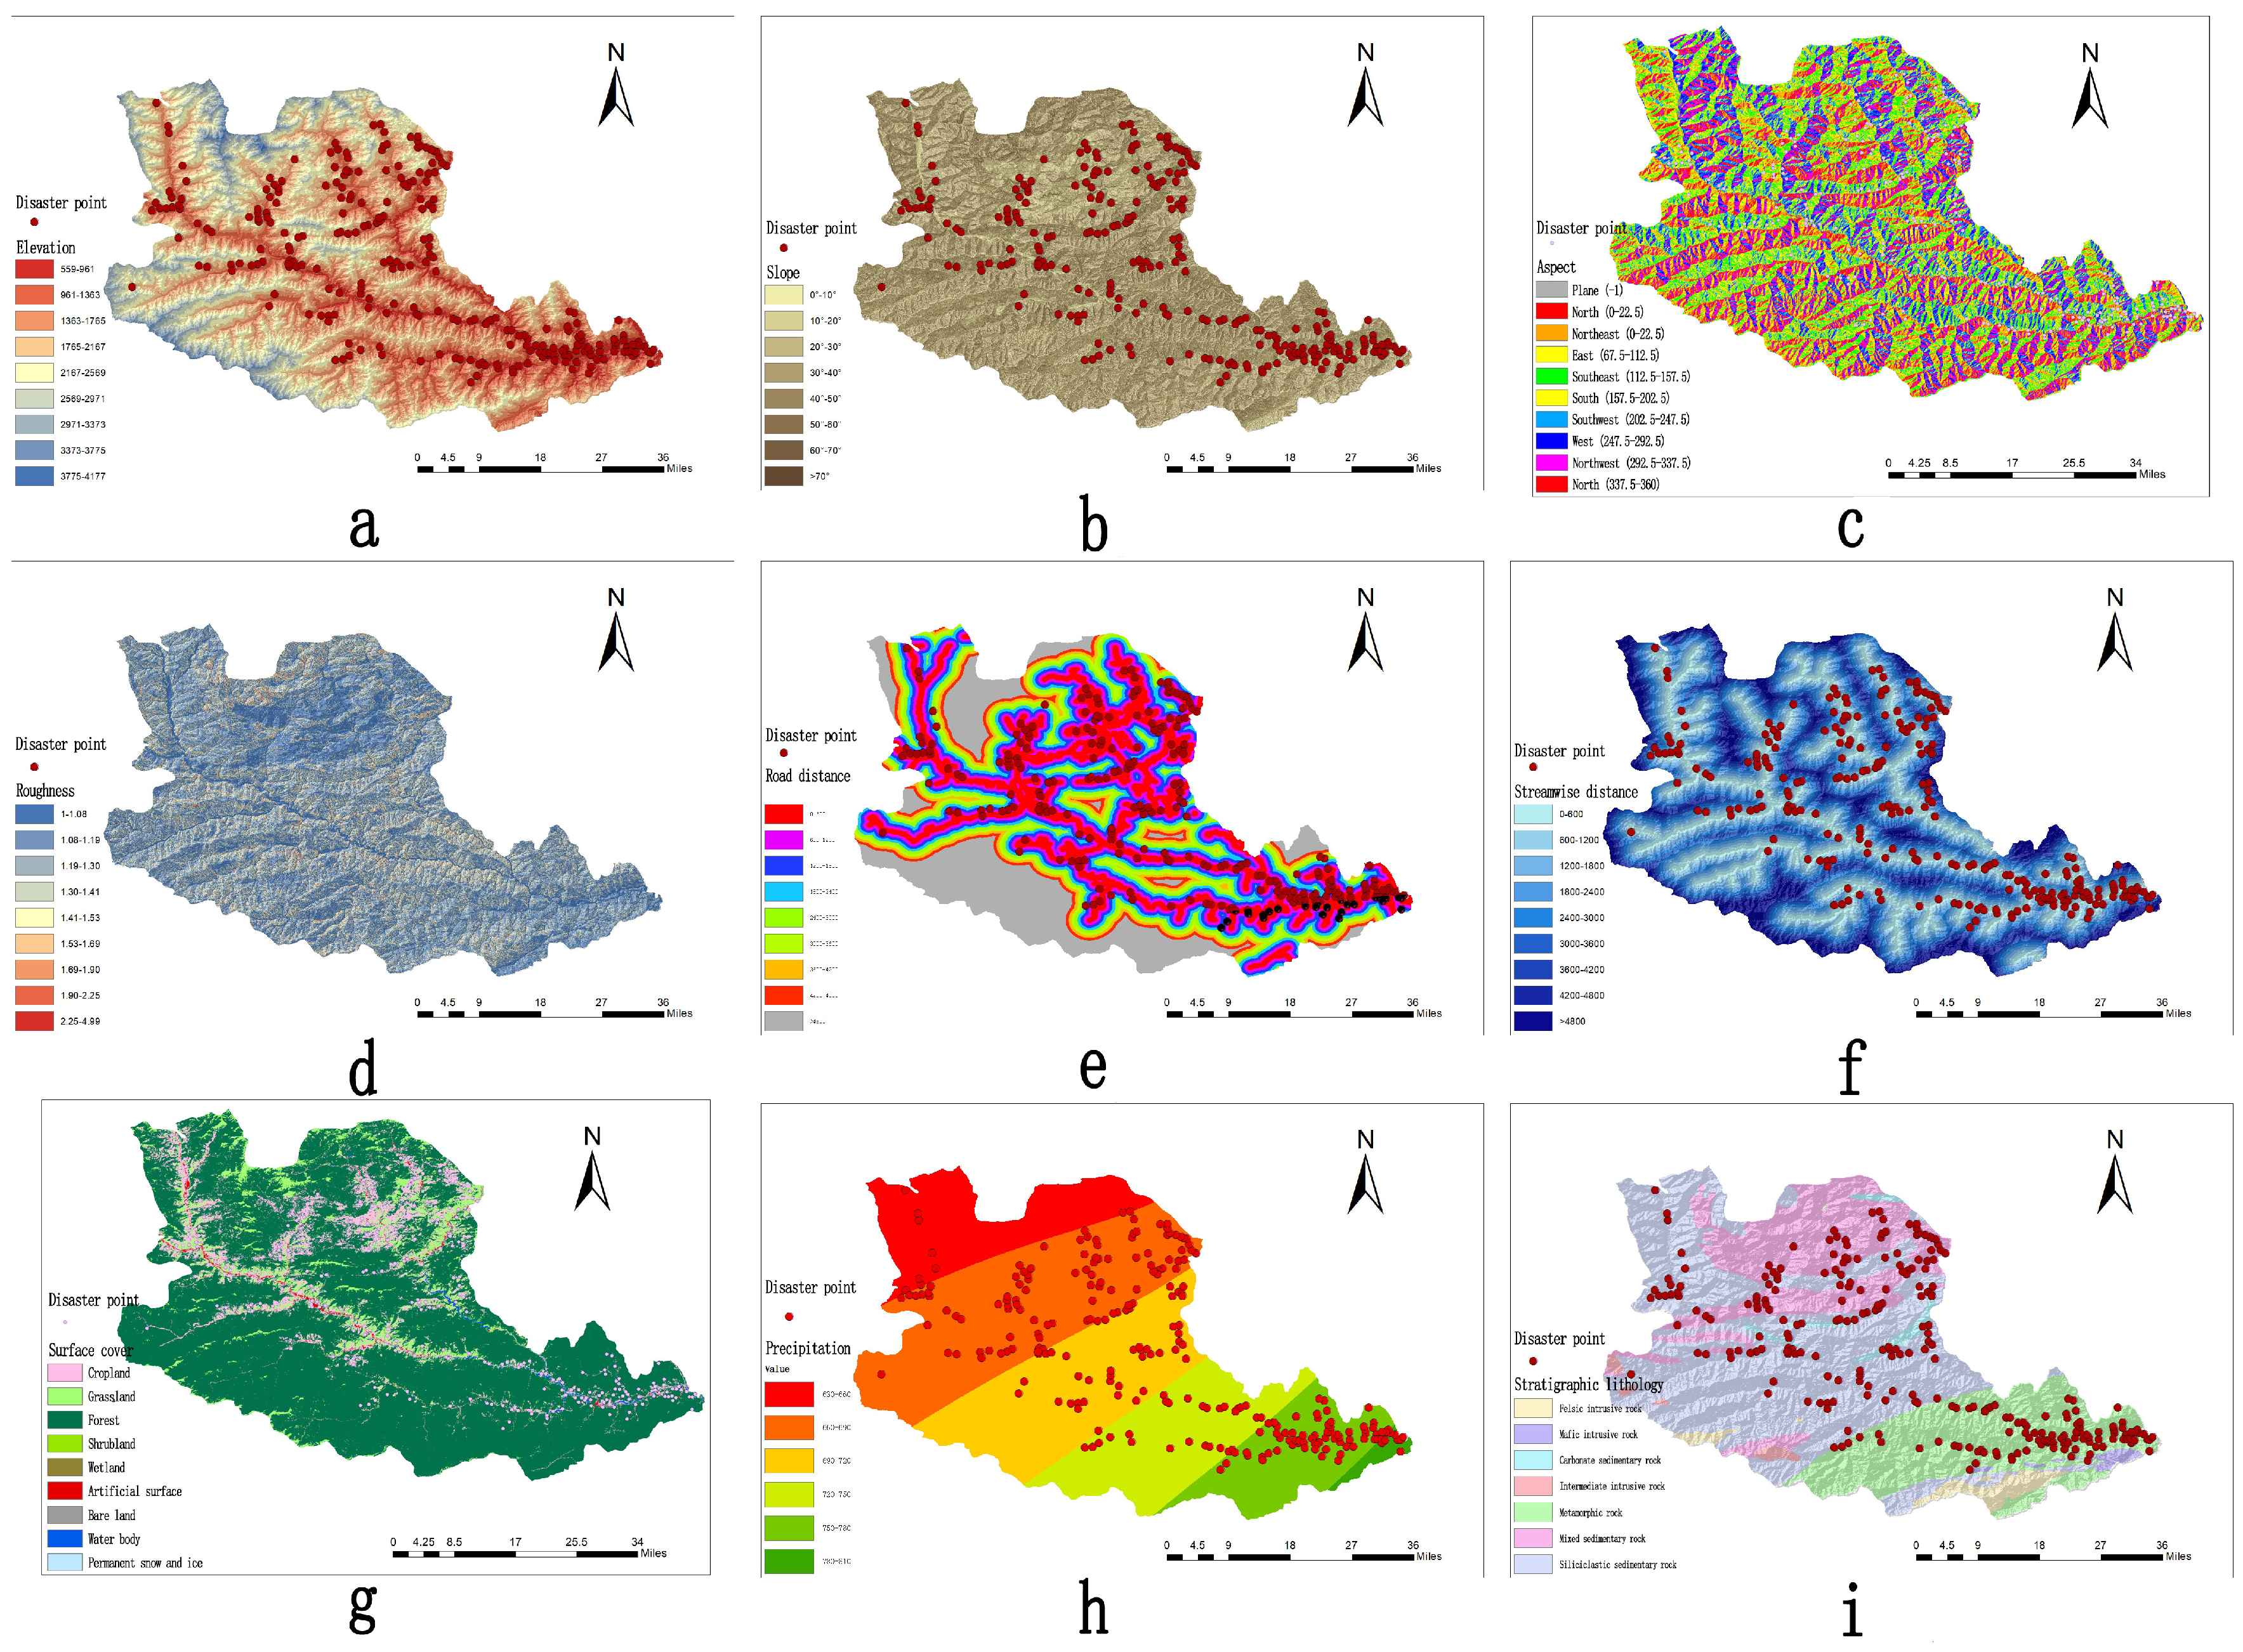
2.4. Selection of Evaluation Factors
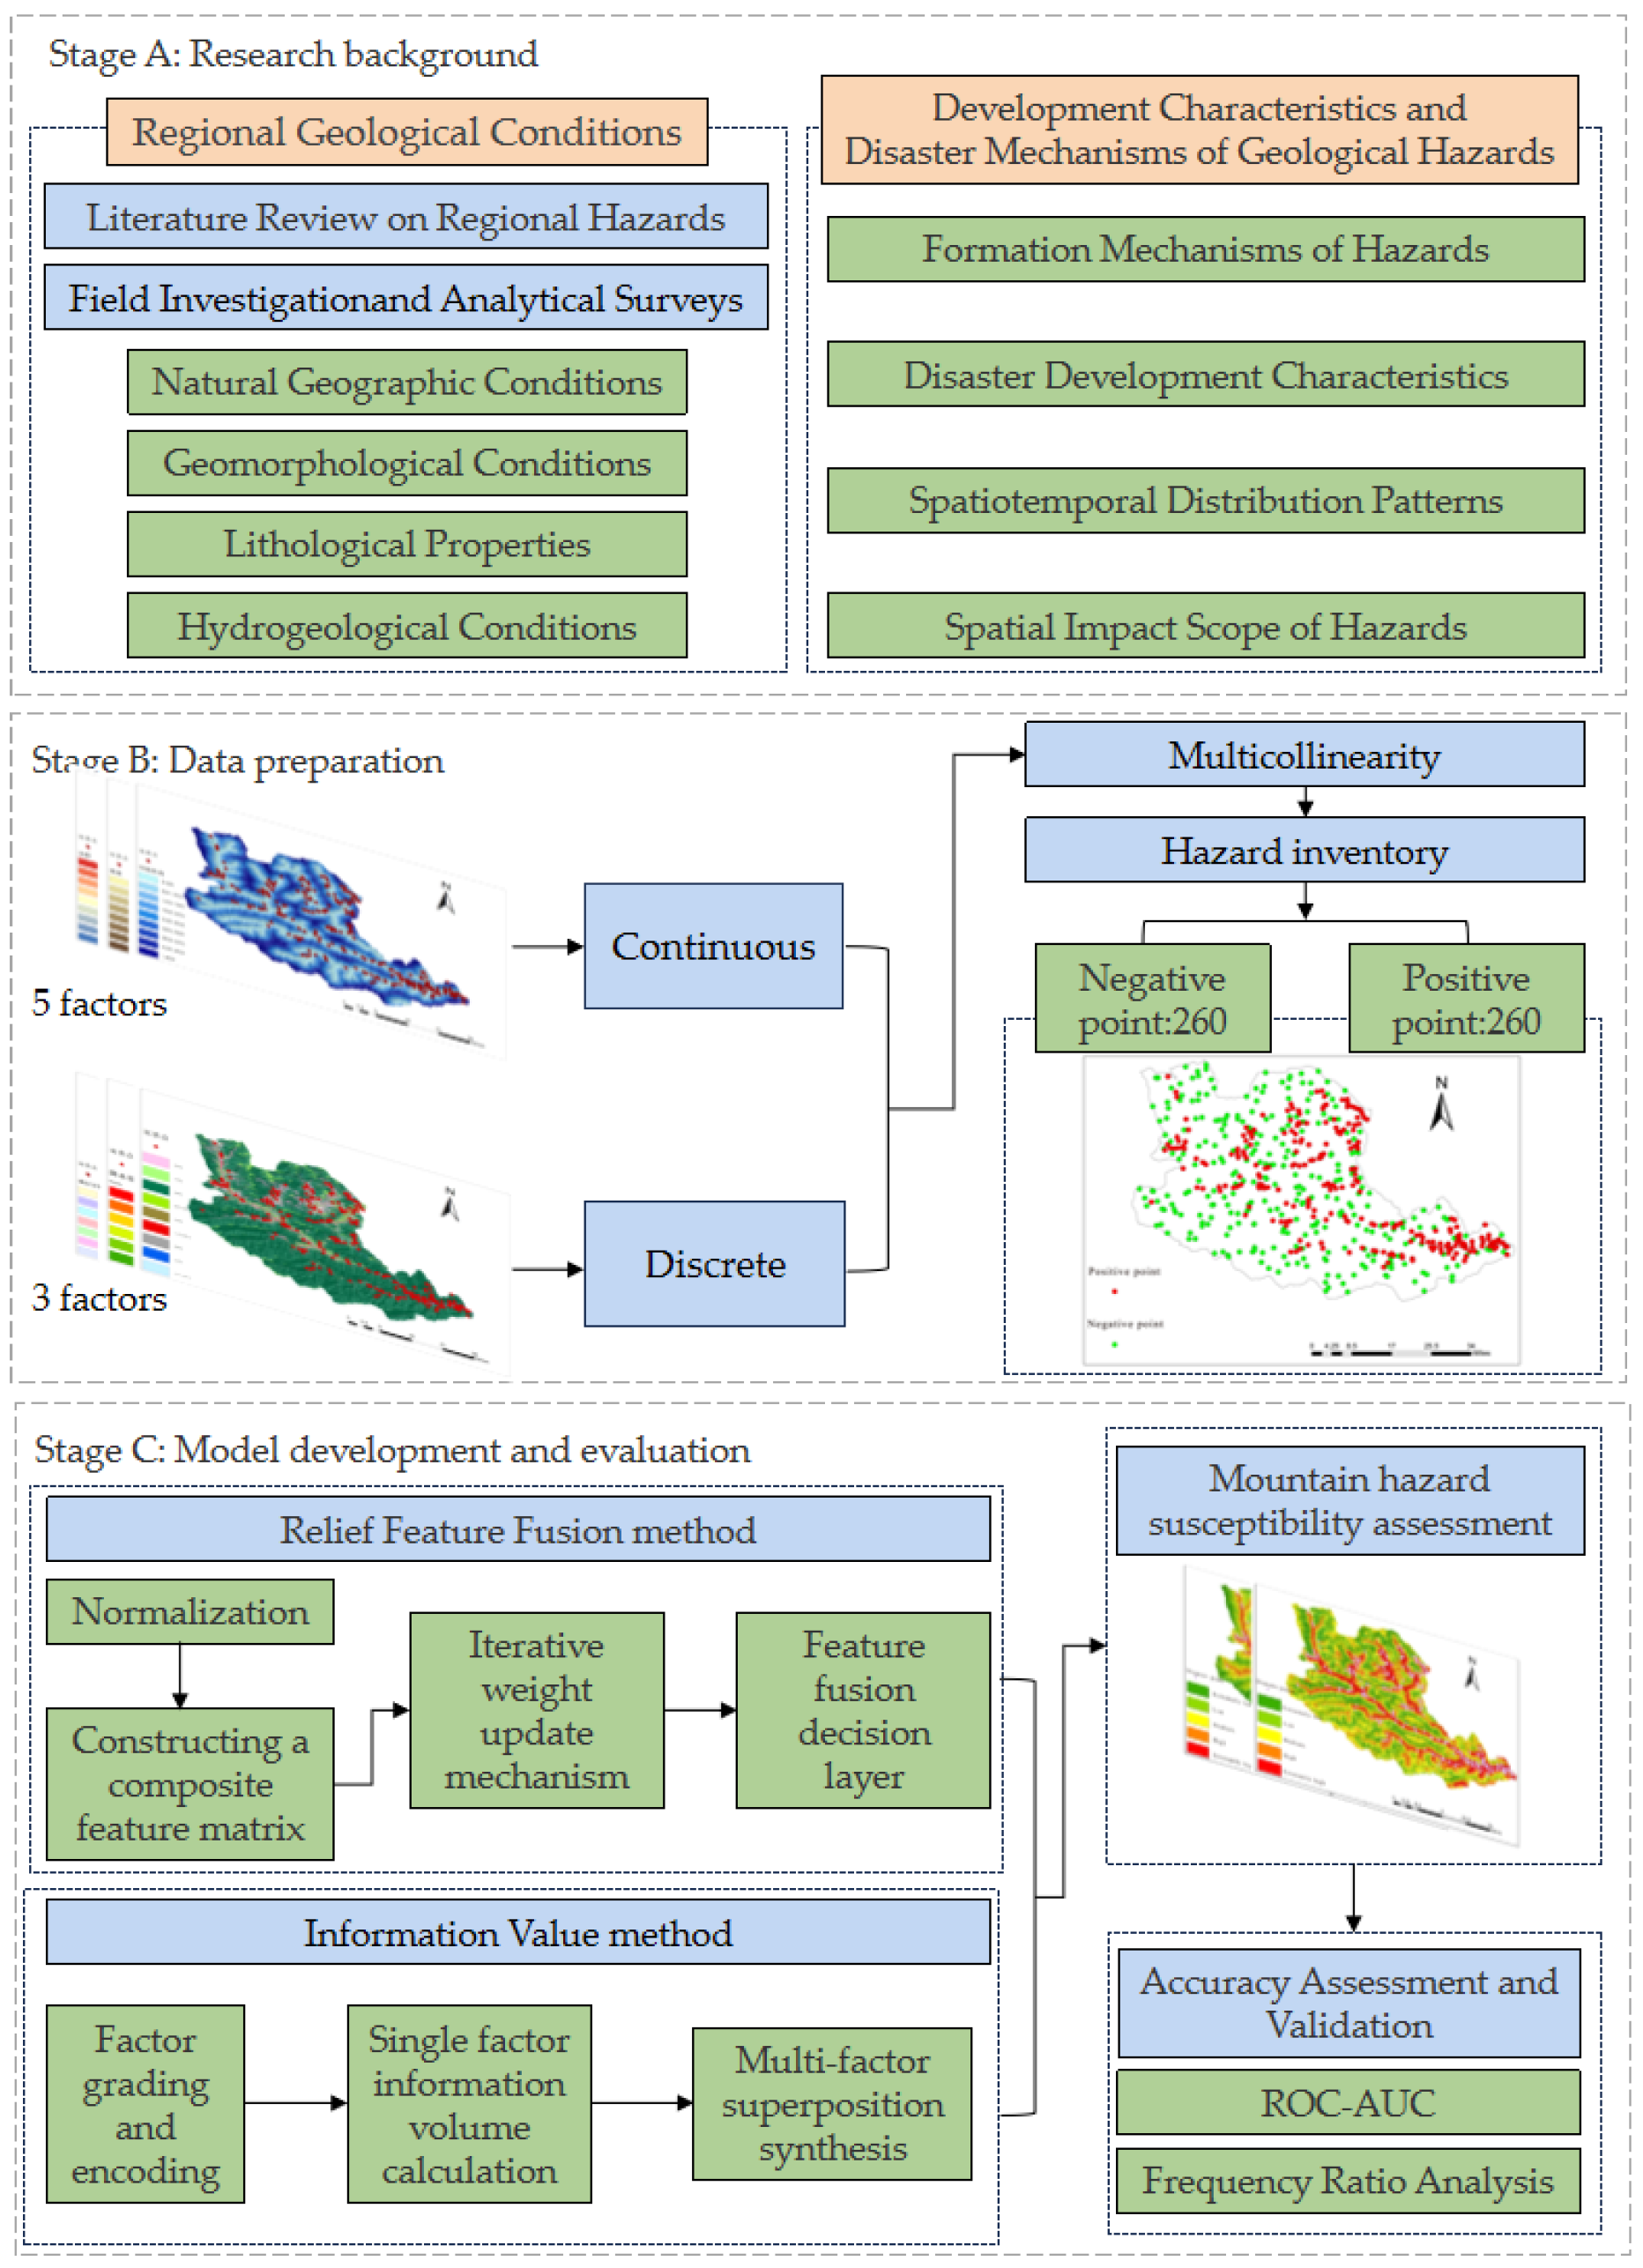
This study integrated methodologies from literature analyses, field investigations, and geospatial technologies to systematically develop a multi-dimensional evaluation system encompassing topography, geology, climate, and anthropogenic activities. During the initial phase, the research team conducted a comprehensive review of domestic and international studies on landslide formation mechanisms, susceptibility assessment methods, and regional comparisons. By contrasting landslide characteristics between arid and humid regions, it was identified that humid areas exhibit a higher propensity for shallow landslides due to concentrated precipitation and active surface runoff, whereas arid regions are prone to deep-seated landslides triggered by intensive physical weathering of rock–soil masses and sparse vegetation cover, often exacerbated by engineering disturbances. These comparative insights provide critical references for understanding the unique geohazard mechanisms within the Longnan mountainous region under its distinctive geographical setting. As shown in Figure 2, each evaluation factor was overlaid and statistically analyzed with disaster points. Based on the obtained data, a 30 × 30-m grid unit was selected as the evaluation unit, resulting in a total of 5,685,653 grid units [33].
This paper selected four evaluation factors from the topographic and structural aspects: elevation, slope, aspect, and roughness, as shown in Figure 2a–d. As shown in Table 3, the results indicate that the area with an elevation of 1765–2167 m accounts for the largest proportion (24.67%), with 33 disaster points. The interval of 1363–1765 m has the most disaster points (81), accounting for 23.38% of the area (Figure 2a). Most geological disasters occur on slopes of 20–30° and 30–40°, with 72 and 70 disaster points, respectively, and area proportions of 28.30% and 32.05% (Figure 2b). The southwest aspect has the most disaster points (47), accounting for 11.72% of the area (Figure 2c). The roughness interval of 1–1.08 has the most disaster points (92), accounting for 23.92% of the area (Figure 2d).
The development of landslides is controlled by both internal and external dynamic environments. External dynamic factors are often the direct cause of landslide disasters. This paper selected four evaluation factors as external dynamic geological environment factors: road distance, river distance, land cover type, and rainfall, as shown in Figure 2e–h. The results show that, when the road distance is within 4800 m, most disaster points are concentrated in the 0–600-m interval, with the impact decreasing as the distance increases (Figure 2e). Most disaster points are distributed within 0–600 m of water systems, with 100 disaster points, accounting for 16.03% of the area (Figure 2f). Analysis of land cover factors and disaster distribution shows that forests are the most frequent areas for disaster points, with 130 disaster points, accounting for 79.02% of the area (Figure 2g). The rainfall interval of 660–690 mm has the most disaster points (99), accounting for 30.88% of the area (Figure 2h).
The stratum lithology and engineering geological rock groups in the region are closely related to the development and formation of landslides and debris flows. The lithology of the strata determines or influences the characteristics of geological disasters. As shown in Figure 2i, this paper selected stratum lithology as the ninth evaluation factor. Most disaster points are located in metamorphic and siliceous clastic sedimentary rocks, with 89 and 81 disaster points, respectively, and area proportions of 22.19% and 49.48% (Table 3).

3. Research Methods

The research process is divided into three sequential stages to ensure systematic and logical progression (as shown in Figure 3). The first stage (Stage A) focuses on comprehensively establishing the research background. This includes analyzing regional geological conditions, conducting a literature review, and performing field investigations. Detailed examinations cover natural geographic environments, geomorphological characteristics, lithological properties, and hydrogeological conditions. Building on this foundation, the study further explores the developmental characteristics and mechanisms of geological hazards, such as hazard formation mechanisms, spatiotemporal distribution patterns, and spatial impact ranges. The second stage (Stage B) involves data preparation, including the screening and visualization of eight key evaluation factors. Continuous and discrete data types are distinguished to provide high-quality input for model construction. The third stage (Stage C) centers on model development and evaluation, employing a dual-path approach: the Relief Feature Fusion method and the information value method. The former optimizes feature representation through constructing a composite feature matrix, iterative weight updates, and feature fusion decision layers. The latter conducts comprehensive hazard risk assessments based on factor grading and encoding, single-factor information volume calculations, and multi-factor superposition synthesis. Finally, model accuracy is validated using ROC AUC and frequency ratio analysis to ensure result reliability.
The ReliefF quantitative analysis method is a feature selection method based on sample data. Its core idea is to evaluate the importance of features by comparing the impact of different features on sample distance, thereby selecting the most valuable feature subset [34]. The core algorithm of this method is based on a random sampling nearest neighbor search algorithm, which determines feature weights by comparing the feature value differences between target samples and their nearest neighbor samples. In this process, the distance between samples is used as the basis for weight allocation, meaning that features with similar feature values in similar samples contribute more to the feature selection process.

3.1. Data Processing

To avoid overfitting caused by high correlation between evaluation factors when using the ReliefF algorithm to calculate feature weights, this paper uses the Pearson correlation coefficient method to analyze the correlation of the nine factors in the study area.
As shown in Figure 4, the correlation analysis reveals that the correlation coefficient between slope and roughness is 0.92, indicating high correlation. Therefore, this paper excludes the roughness factor [35] and selects eight evaluation factors: elevation, slope, aspect, road distance, river distance, stratum lithology, land cover, and rainfall for landslide susceptibility assessment in the study area. Based on ArcGIS 10.7, a 500-m buffer zone was established around landslide disaster points, and the study area was clipped and converted to points, resulting in 5,528,012 negative data points. The multi-value extraction to point tool in ArcGIS 10.7 was used to assign the evaluation factor raster data to negative data points and disaster point data [36]. Python 3.10 was used to merge positive data (disaster point data) and negative data, remove null values, and normalize discrete and continuous data [5].

3.2. ReliefF Algorithm

The ReliefF algorithm is an extension of the Relief algorithm and can handle multi-class problems. Its core is the weight concept, which calculates the weight of a feature based on its correlation with class labels. The specific steps of the ReliefF algorithm are as follows:
(1)
Given a sample set K and a feature set F. Initialize the number of iterations m and the number of neighboring samples k.
(2)
Randomly select a sample R from the sample set. Select k nearest neighbors from the samples of the same class as R , denoted as H j , and select k nearest neighbors from the samples of different classes from R , denoted as M j ( C ) . Repeat the process until the number of iterations reaches m .
(3)
Calculate the importance value W ( A ) .
W ( A i ) = W ( A i 1 ) c l a s s ( R ) j = 1 k d i f f ( A , R , H j ) m k + C c l a s s ( R ) p ( C ) 1 p ( c l a s s ( R ) ) j = 1 k d i f f ( A , R , M j ( C ) ) m k
where A represents the feature; i represents the iteration number; W ( A i ) represents the updated importance score of a specific predisposing factor after the i-th iteration. W ( A i - 1 ) is the feature’s importance score from the previous iteration, serving as the baseline for iterative optimization. c l a s s ( R ) is the category assigned to the randomly selected training sample R. d i f f ( A , R , H j ) represents the distance between R and H j under A, determined by the difference between inter-class and intra-class distances, and a higher value indicates a stronger distinguishing ability of A for the samples [23].
(4)
Repeat step (3) N times (number of features) and output the importance vector W. The feature weight corresponding to A is
Q ( A ) = W ( A ) n = 1 N W ( A )

4. Results

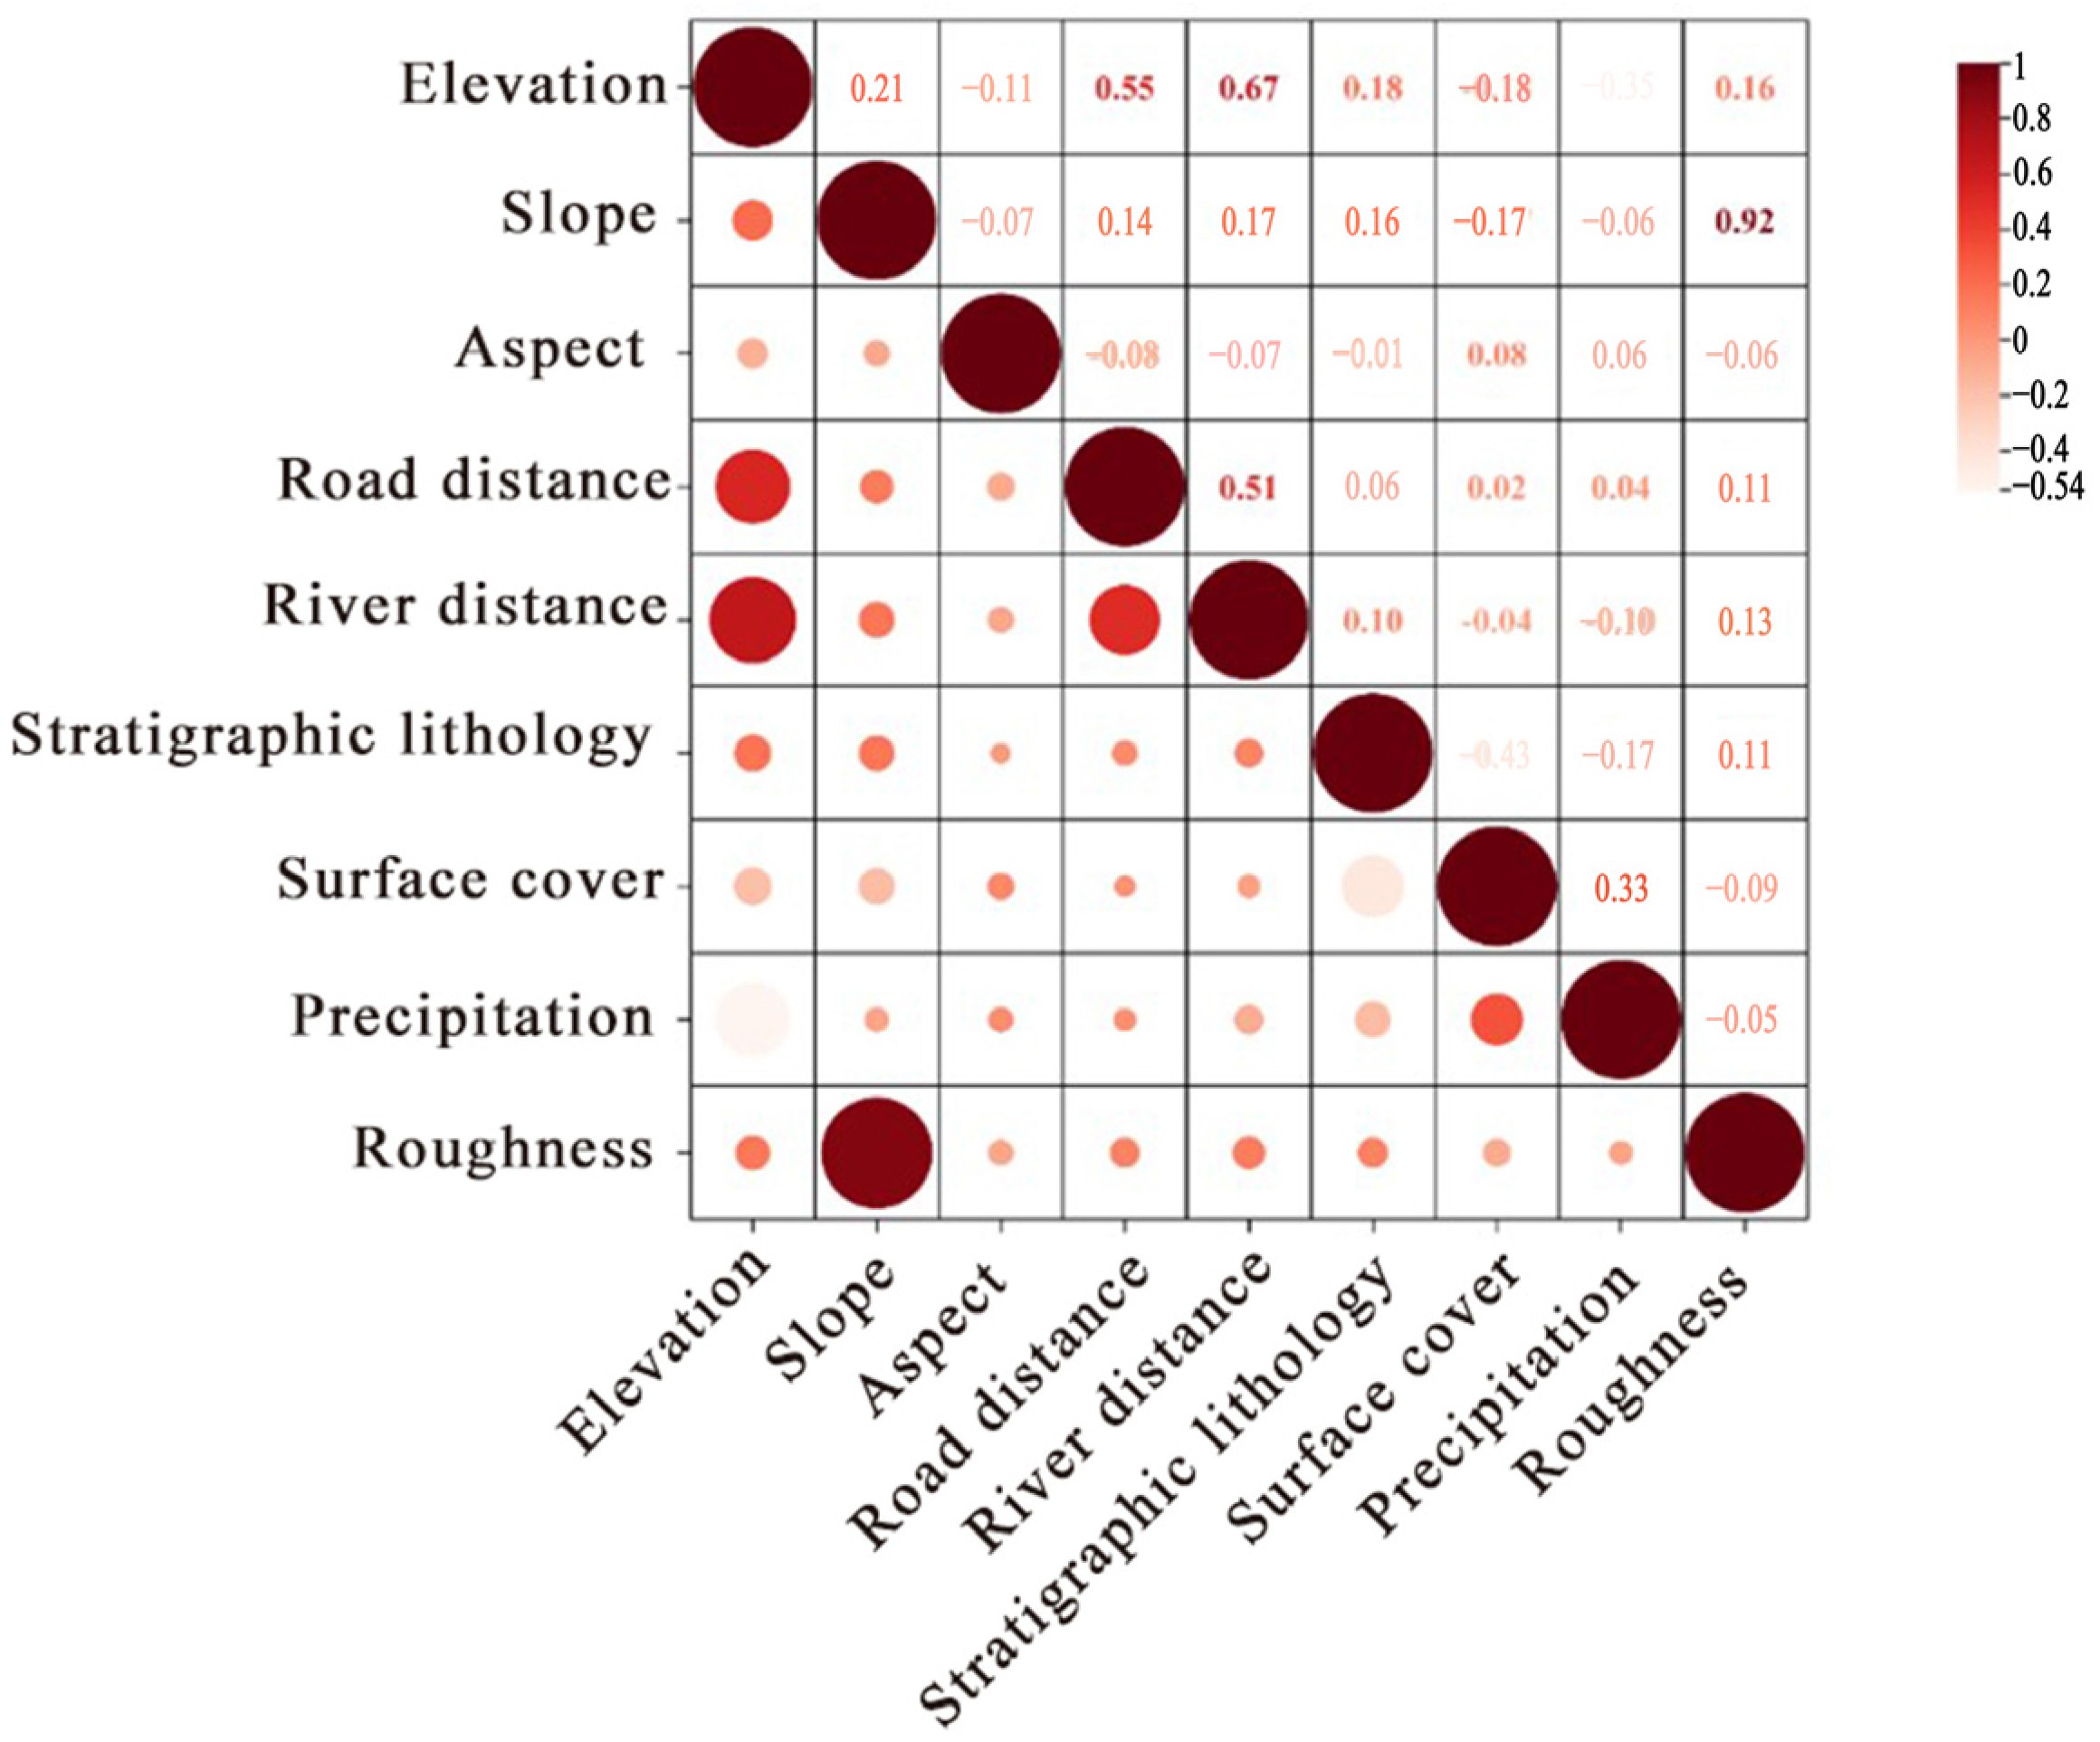
4.1. Importance of Influencing Factors

This paper uses the ReliefF algorithm to evaluate the relative importance of each indicator and assign weights to each evaluation factor [6]. As shown in Figure 5 and Table 4, this paper implements the algorithm using Python 3.10 based on the ReliefF model, calculating the contribution of eight evaluation factors to geological disasters in the study area and normalizing the contribution values.

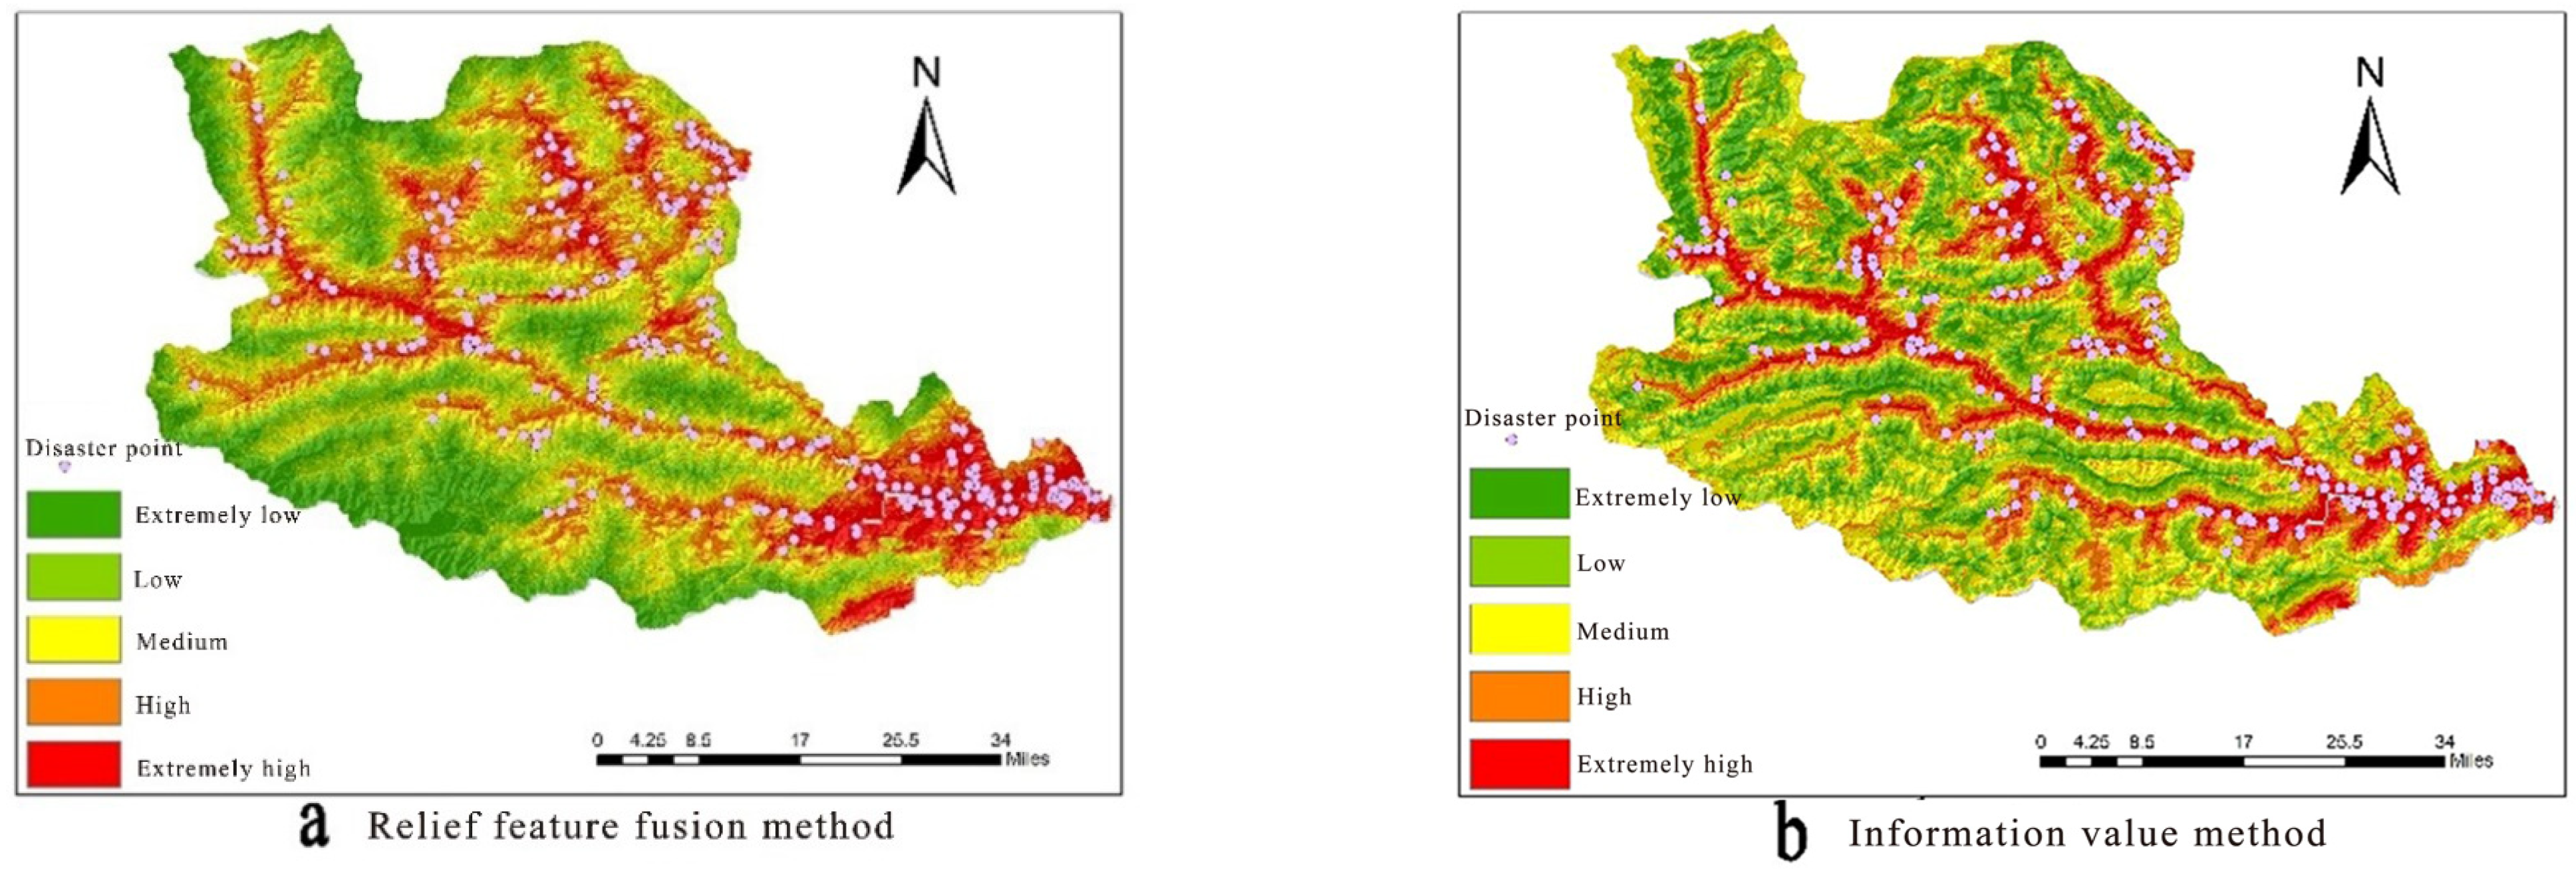
4.2. Landslide Susceptibility Mapping

Based on the weight values calculated by the ReliefF method, the spatial analysis overlay calculation function of ArcGIS 10.7 was used to overlay the evaluation factor rasters with their corresponding weights, resulting in a comprehensive index (B) based on GIS and the ReliefF feature fusion method (1.25–6.890000343). The natural breaks classification method in ArcGIS 10.7 was used to reclassify the comprehensive index, and the landslide susceptibility values were graded by overlaying the evaluation factor information values. The higher the B value, the higher the landslide susceptibility. The landslide susceptibility in Wenxian County was divided into five zones, and the final evaluation results were obtained. The evaluation results were spatially joined with disaster points, and the area and disaster point statistics of the evaluation result zones were obtained. As shown in Figure 6a and Figure 7, the extremely high susceptibility zone (5.098470824–6.890000343) covers an area of 610.32 km2, accounting for 11.93% of the county’s area, with 127 disaster points. The extremely low (1.25–3.174235411), low (3.174235412–3.815647215), medium (3.815647216–4.412823722), and high (4.412823723–5.098470823) susceptibility zones cover areas of 667.72 km2, 1235.21 km2, 1403.62 km2, and 1200.21 km2, accounting for 13.05%, 24.14%, 27.43%, and 23.45% of the county’s area, respectively, with 96, 27, 3, and 0 disaster points.

5. Discussion

This paper collected 260 historical landslide points in Wenxian County and conducted statistical analysis. However, it must be acknowledged that this paper has certain limitations. In terms of data collection, although landslide disaster point data were obtained from the National Cryosphere Desert Data Center, the completeness of the dataset still needs improvement due to the dynamic nature of disasters, especially the lack of recent geological disaster event information due to untimely updates. In terms of research methods, this paper calculated the contribution values of each evaluation factor based on the ReliefF method and integrated the results with ArcGIS 10.7 software for zoning assessment in Wenxian County. The results show that the extremely high and high susceptibility zones in the Longnan mountainous region are mainly distributed along the Bailong River and its tributaries, with high rainfall, low elevation, and dense vegetation. These areas have frequent human activities, and the poor soil and severe water loss in the northwest region make vegetation roots underdeveloped and prone to collapse, leading to slope movement. Therefore, under the dual driving forces of natural factors and human activities, landslide disasters are frequent in Wenxian County. The evaluation results of this paper are consistent with the research results of Li Yimin et al. [16] and the team’s related research [28,29] and are in line with the actual distribution of landslide disasters, proving the accuracy of the landslide susceptibility zoning results in this paper and the reliability of the ReliefF feature weight fusion algorithm proposed in this paper.
Previous studies have used traditional AHP methods to analyze landslide susceptibility in the Longnan mountainous region [37,38] but have not used the ROC curve for model accuracy testing. The core of AHP in determining weights lies in expert judgment and opinions [39]. In contrast, the ReliefF feature weight fusion method is a data-driven model that uses Python 3.10 to calculate large amounts of data and determine weights by calculating the contribution of features to classification performance, avoiding the strong subjectivity in traditional weight assignment and reducing the impact of human intervention [40,41]. This paper further selects the information value method, which is also an objective evaluation method and has been widely used in landslide susceptibility assessment [16,42], to evaluate the susceptibility of the study area. As shown in Figure 6b, the information value method evaluation model was used to calculate the information value of each layer, which was imported into ArcGIS 10.7, and the overlay calculation function was used to assign secondary values to each evaluation factor, resulting in the comprehensive index value (B) of landslide susceptibility in Wenxian County based on the information value method (−11.63122463–8.981705666). The natural breaks classification method was used to reclassify the evaluation results, and the landslide susceptibility in Wenxian County was divided into five zones [15], as shown in Figure 6b. The extremely high susceptibility zone (2.191563921–8.981705666) covers an area of 643.37 km2, accounting for 12.57% of the county’s area. The extremely low (−11.63122463–−5.487763053), low (−5.487763052–−2.820207368), medium (−2.820207367–−0.395156744), and high (−0.395156744–2.19156392) susceptibility zones cover areas of 584.24 km2, 1309.93 km2, 1497.31 km2, and 1082.24 km2, accounting for 11.42%, 25.60%, 29.26%, and 21.15% of the county’s area, respectively.
To further evaluate the practicality of the model, this paper compares the accuracy indicators. The ROC curve and frequency ratio model were used to compare the evaluation results of the two objective evaluation models. According to the standards released by Swets [43], an AUC value of 0.7–0.8 indicates good model prediction ability. As shown in Table 5 and Figure 7, the AUC value of the information value method in this paper is 0.838, and the AUC value calculated by the ReliefF model and GIS fusion method is 0.853, indicating good prediction accuracy in landslide susceptibility assessment. When the frequency ratio exceeds 1, the higher the frequency ratio, the greater the possibility of disaster occurrence [14].
According to the frequency ratio statistical results of the two methods (Table 5 and Figure 8), the information value model’s landslide susceptibility zoning map has 121 disaster points in the extremely high susceptibility zone, accounting for 47.83% of the total disaster points, while the ReliefF model’s landslide susceptibility zoning map has 127 disaster points in the extremely high susceptibility zone, accounting for 50.20% of the total disaster points. The ReliefF feature fusion method has six more disaster points in the extremely high susceptibility zone than the information value method, but the area is 33.04 km2 smaller.
Combining the specific topographical and geological characteristics of the study area, the performance differences between the AUC value and frequency ratio in dealing with complex terrain and various geological conditions are notable. The study area of Wenxian County is characterized by intense topographic relief, frequent geological disasters, and complex geological structures, making it a typical region with high susceptibility to landslides. In such complex terrain and geological conditions, the AUC value provides a comprehensive measure of model performance by considering both the true positive rate and the false positive rate. The higher AUC value of the ReliefF feature fusion method (0.853) compared to the information value method (0.838) indicates that the former has a better overall predictive capability. On the other hand, the frequency ratio focuses on the relative frequency of landslide occurrences in different susceptibility zones. The higher frequency ratio in the extremely high susceptibility zone of the ReliefF model (4.21) compared to the information value model (3.8) suggests that the ReliefF method is more effective in identifying high-risk areas. This is particularly important in complex terrain where landslides are influenced by multiple factors such as steep slopes, heavy rainfall, and loose soil. The ReliefF method’s ability to capture these nuances makes it a more suitable choice for landslide susceptibility assessment in regions with complex geological and topographical conditions.
Based on the ROC curve and frequency ratio comparison results, the evaluation accuracy of the ReliefF feature fusion method is higher than that of the information value method. The information value method requires manual processing of large amounts of data and complex feature calculations during the calculation process, and the operation of importing the calculation results into ArcGIS 10.7 is also more complex, requiring a secondary assignment of each evaluation factor [9], which also leads to higher computational costs. The ReliefF feature fusion method uses a feature weighting mechanism and only requires the primary assignment of the evaluation factors, which can reduce computational complexity while maintaining higher prediction accuracy, making it more efficient and practical for large-scale data applications [22]. In the process of using machine learning models to predict landslide susceptibility, the system must have sufficient memory to support the workload and the ability to handle sudden load increases. Memory overload can also cause service interruptions [44]. This paper only uses a computer with an i7 12700H processor, 3.30 GHz frequency, and 16 GB memory to complete the landslide susceptibility assessment based on the ReliefF feature fusion method. Therefore, although machine learning models have obvious advantages in accuracy, their high computational requirements may limit their application in practice, while the ReliefF feature fusion method has the advantages of low cost and high efficiency in practical applications.
It is undeniable that the research method used in this paper still has some shortcomings in terms of advancement. However, compared to the performance of the information value method and traditional methods used in previous studies in the Longnan mountainous region [45], considering the accuracy requirements and computational costs, the ReliefF feature fusion method is a faster and better landslide disaster assessment method, achieving higher prediction accuracy than the information value method at lower computational costs, making it suitable for use in situations with limited computational resources.

6. Limitations and Future Perspectives

(1)
The spatiotemporal representativeness of hazard samples remains limited. Although this study utilized 260 historical landslide points with balanced positive/negative sampling through buffer zone randomization, the sample distribution was constrained by field survey resolution, potentially omitting concealed landslides or low-frequency events, which may compromise model generalizability.
(2)
Improved machine learning models based on the ReliefF algorithm will be attempted to capture more information in the feature space and handle more complex feature relationships and large-scale data while reducing the model scale, improving the overall performance and response speed of the classification model, and saving computational costs while improving prediction accuracy.
(3)
Future research should integrate dynamic factors such as seasonal precipitation variations and long-term climate trends into susceptibility modeling. This advancement will enable time-dependent risk assessments and improve early warning systems under climate change.
(4)
While our study incorporates “human activities” as a composite factor quantified through road density and land use types, localized activities such as quarries and mining were not explicitly modeled due to data resolution limitations. Future research should integrate high-resolution InSAR monitoring to capture subsidence effects from subsurface activities, along with field-measured drainage parameters, as these could refine susceptibility predictions in engineered slopes.
This will provide more powerful tools for landslide disaster risk assessment and help achieve more accurate disaster warning and risk management.

7. Conclusions

This paper takes Wenxian County in Longnan City as a typical study area, based on the team’s previous field surveys and data from 260 landslide disaster points, uses GIS technology, selects eight evaluation factors to establish a landslide susceptibility assessment index system, and completes the susceptibility zoning assessment of Wenxian County in Longnan City based on ReliefF feature weight fusion. The conclusions are as follows:
(1)
This paper selects eight evaluation factors, including stratum lithology, rainfall, elevation, aspect, slope, road distance, river distance, and land cover, to construct a landslide disaster risk assessment system. Using GIS technology, the eight evaluation indicators are quantified and graded. The extremely high and high-risk areas are mainly distributed along rivers and roads, with loose soil, high rainfall, low elevation, and dense vegetation, accounting for 66.51% of the total area. The dual driving forces of natural factors and human activities are the main factors inducing landslide disasters in Wenxian County.
(2)
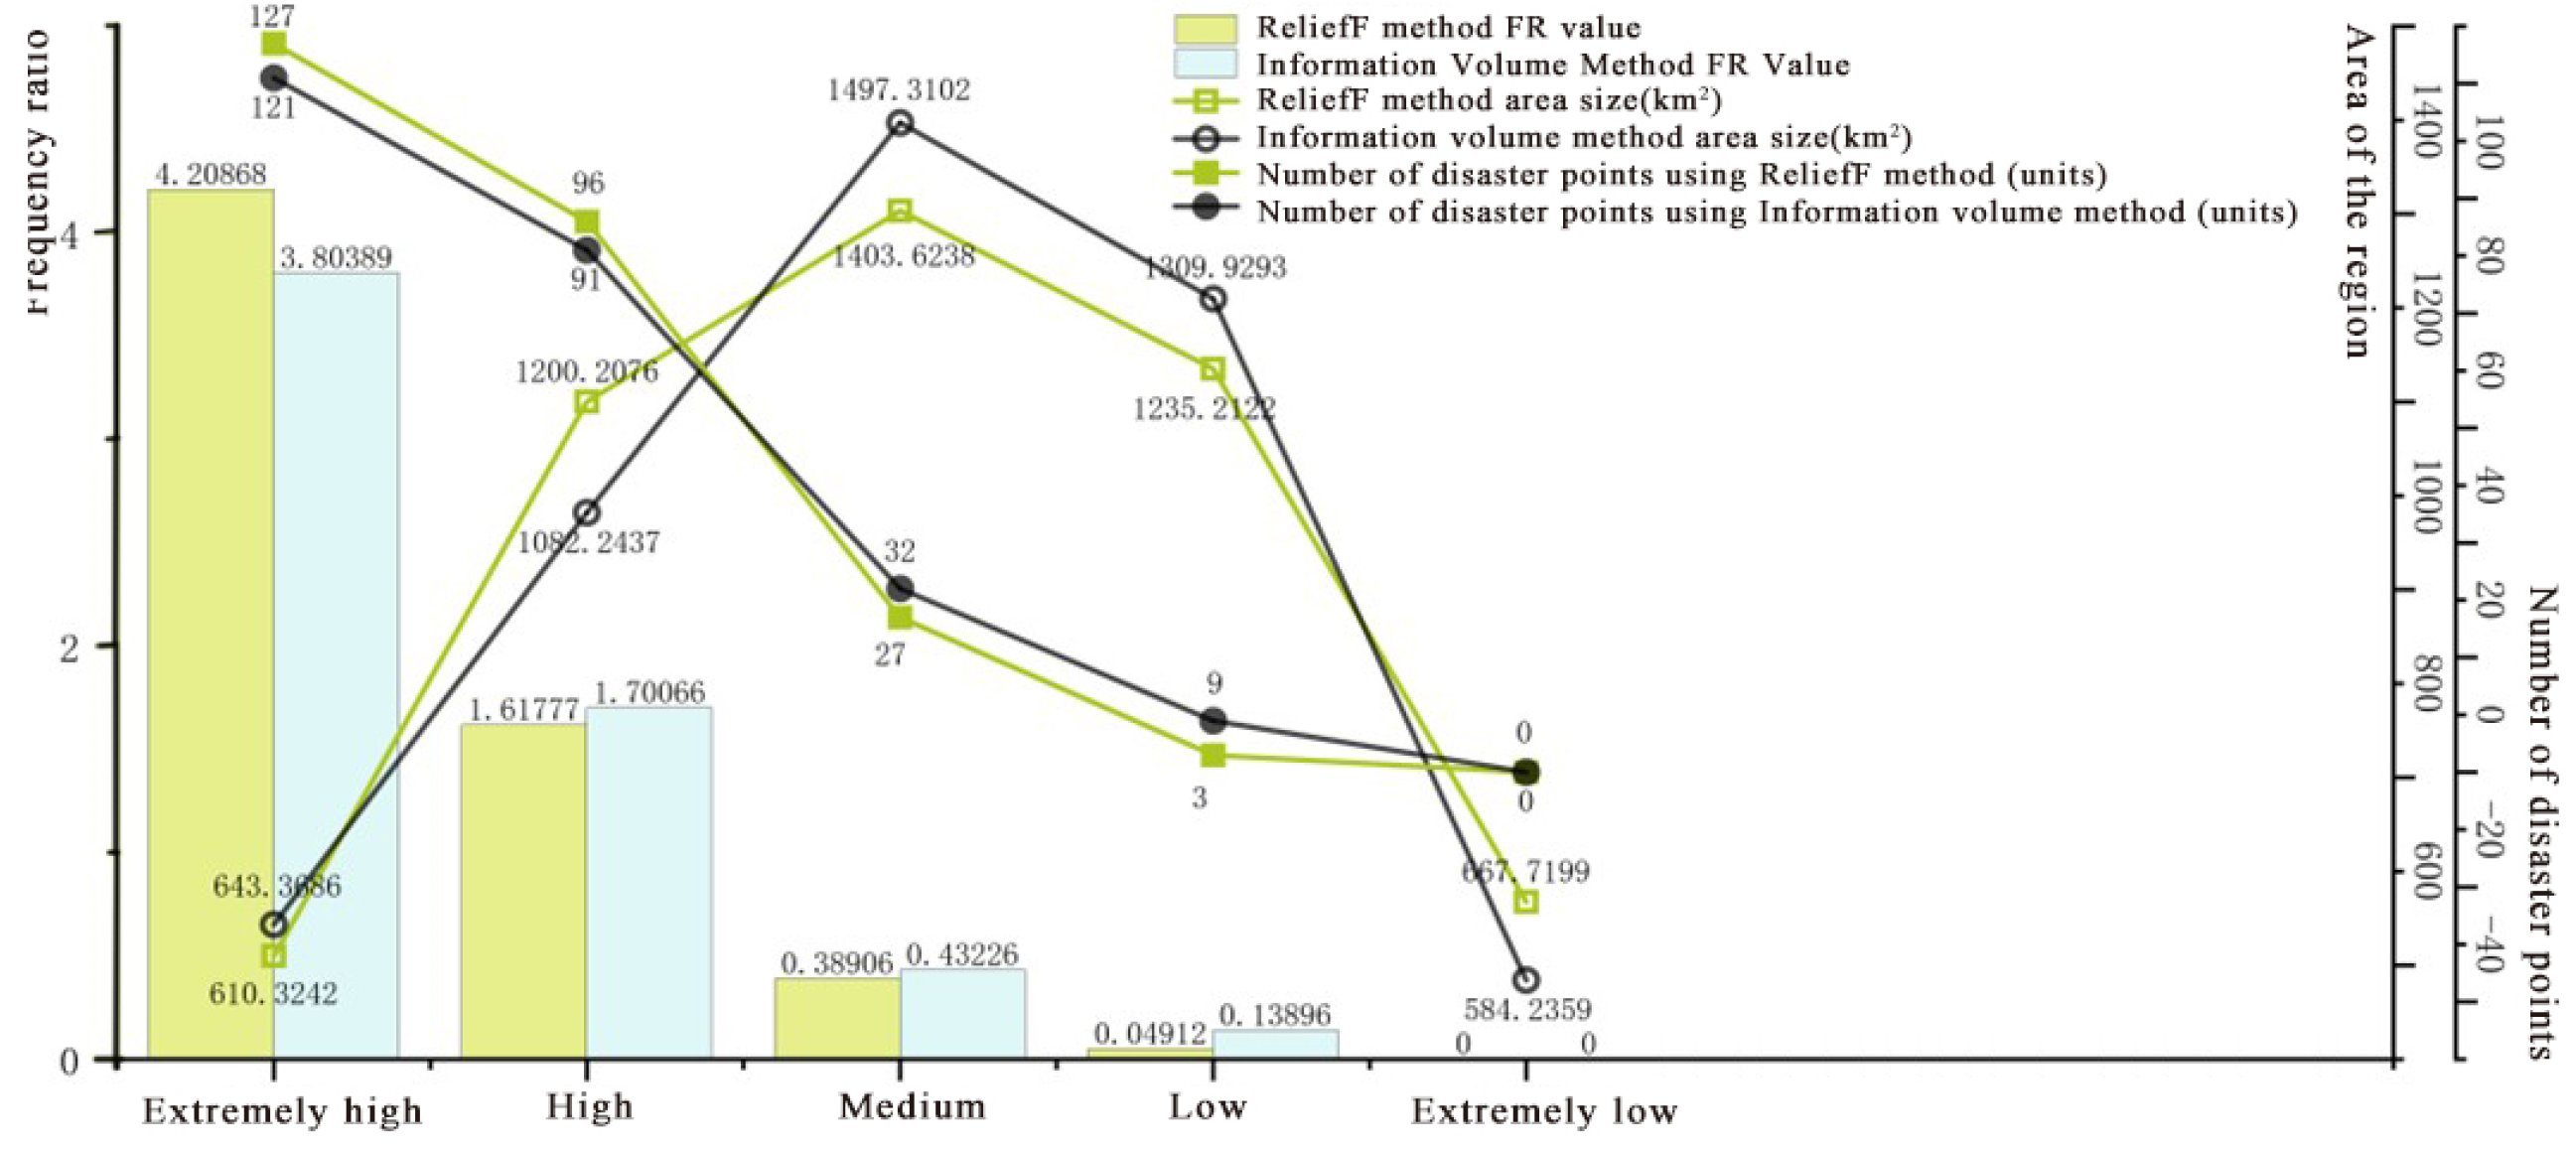
This paper uses the ROC curve and frequency ratio to test the accuracy of the evaluation results and compares them with the evaluation results of the information value method. The AUC value of the ReliefF feature weight fusion method is 0.853, higher than the AUC value of 0.838 for the information value method, indicating good evaluation results. The extremely high susceptibility zone in the landslide susceptibility zoning map drawn by the ReliefF model (4.21) is larger than that drawn by the information value model (3.8), indicating higher prediction accuracy of the ReliefF method.
(3)
Computational cost is a crucial consideration in method selection. The cumbersome operation of the information value method limits its application in large-scale datasets, while machine learning methods have high computational costs and high computing power requirements, limiting their practical application in the industry. In contrast, the ReliefF feature fusion method has lower computational costs and better prediction accuracy, achieving a balance between accuracy and efficiency, making it more suitable for practical application scenarios that require processing large amounts of data.

Author Contributions

Conceptualization: Z.W. and C.Z.; methodology: Z.W.; software: C.Z.; validation: Z.W. and C.Z.; formal analysis: Z.W.; investigation: C.Z.; resources: Z.W.; data curation: C.Z.; writing—original draft preparation: C.Z.; writing—review and editing: Z.W.; visualization: C.Z.; supervision: Z.W.; project administration: Z.W.; funding acquisition: Z.W. All authors have read and agreed to the published version of the manuscript.

Funding

This study was supported by the National Natural Science Foundation of China (Grant No. 42167043 and 51269009). This work was supported by the Key Research and Development Program of Gansu Province (Grant No. 20YF8ND141).

Institutional Review Board Statement

Not applicable.

Informed Consent Statement

Not applicable.

Data Availability Statement

The data presented in this study are available within the article, as detailed in the Section 2.3.

Acknowledgments

We would also like to sincerely thank the editors and reviewers for their valuable comments and suggestions, which have significantly improved the quality of this manuscript.

Conflicts of Interest

The authors declare no conflicts of interest.

References

  1. Wang, Y.; Tang, H.; Huang, J.; Wen, T.; Ma, J.; Zhang, J. A comparative study of different machine learning methods for reservoir landslide displacement prediction. Eng. Geol. 2022, 298, 106544. [Google Scholar] [CrossRef]
  2. Salciarini, D.; Fanelli, G.; Tamagnini, C. A probabilistic model for rainfall—Induced shallow landslide prediction at the regional scale. Landslides 2017, 14, 1731–1746. [Google Scholar] [CrossRef]
  3. Lan, H.X.; Zhou, C.H.; Wang, L.J.; Zhang, H.Y.; Li, R.H. Landslide hazard spatial analysis and prediction using GIS in the Xiaojiang watershed, Yunnan, China. Eng. Geol. 2004, 76, 109–128. [Google Scholar] [CrossRef]
  4. Zhou, H.; Mu, C.; Yang, B.; Huang, G.; Hong, J. Evaluating Landslide Hazard in Western Sichuan: Integrating Rainfall and Geospatial Factors Using a Coupled Information Value–Geographic Logistic Regression Model. Sustainability 2025, 17, 1485. [Google Scholar] [CrossRef]
  5. Huan, Y.; Song, L.; Khan, U.; Zhang, B. Stacking ensemble of machine learning methods for landslide susceptibility mapping in Zhangjiajie City, Hunan Province, China. Environ. Earth Sci. 2023, 82, 1–15. [Google Scholar] [CrossRef]
  6. Timmerman, P. Vulnerability, Resilience and the Collapse of Society. A Review of Models and Possible Climatic Applications. Environmental Monograph 1; Institute for Environmental Studies, University of Toronto: Toronto, ON, Canada, 1981. [Google Scholar]
  7. Bui, D.T.; Pradhan, B. Multi-scale convolutional neural networks (CNNs) for landslide susceptibility mapping using Sentinel-2 remote sensing imagery. Geomat. Nat. Hazards Risk 2024, 15, 1–20. [Google Scholar] [CrossRef]
  8. Du, G.-L.; Zhang, Y.-S.; Iqbal, J.; Yang, Z.-H.; Yao, X. Landslide susceptibility mapping using an integrated model of information value method and logistic regression in the Bailongjiang watershed, Gansu Province, China. J. Mt. Sci. 2017, 14, 249–268. [Google Scholar] [CrossRef]
  9. Xiaodong, W.; Yuan, L.; Jingbao, F. GIS-based assessment of geological disaster susceptibility in the water source area of the Bailongjiang Water Diversion Project. South North Water Transf. Water Sci. Technol. 2022, 20, 1231–1239. [Google Scholar]
  10. Yuan, Q.; Yong, L.; Yang, Z.; Zhen, X.U.; Miao, F.A. GIS-based hazard analysis of landslides and debris flows in Lanzhou. J. Glaciol. Geocryol. 2012, 34, 96–104. [Google Scholar]
  11. Xu, C.; Dai, F.; Yao, X.; Chen, J.; Tu, X.; Sun, Y.; Wang, Z. GIS-based landslide susceptibility assessment using AHP in Wenchuan earthquake area. Chin. J. Rock Mech. Eng. 2009, 28, 3978–3985. [Google Scholar]
  12. Wang, J.; Liang, F.; Peng, X.; Shi, W.; Yan, K.; Jiang, X. Research on the evaluation method of single collapse hazard range based on GIS technology. J. Eng. Geol. 2023, 31, 188–198. [Google Scholar]
  13. Mandal, S.P.; Chakrabarty, A.; Maity, P. Comparative evaluation of information value and frequency ratio in landslide susceptibility analysis along national highways of Sikkim Himalaya. Spat. Inf. Res. 2018, 26, 127–141. [Google Scholar] [CrossRef]
  14. Zhang, Q.K.; Ling, S.X.; Li, X.N.; Sun, C.W.; Xu, J.X.; Huang, T. Comparative study of rapid assessment models for landslide susceptibility in Jiuzhaigou County. Chin. J. Rock Mech. Eng. 2020, 39, 1595–1610. [Google Scholar]
  15. Chen, L.; Li, L.; Wu, F.; Xu, Y. GIS-based assessment of geological disaster susceptibility in Beiliu City using information value method. Earth Environ. 2020, 48, 471–479. [Google Scholar]
  16. Li, Y.; Yuan, J.; Jiang, D.; Wang, D.; Liu, X. GIS-based landslide risk assessment in the high mountain canyon area of southwest China—A case study of Lushui City, Nujiang Prefecture. J. Northwest Norm. Univ. (Nat. Sci. Ed.) 2021, 57, 94–102. [Google Scholar]
  17. Huang, F.M.; Yin, K.L.; Jiang, S.H.; Huang, J.; Cao, Z. Landslide susceptibility assessment based on cluster analysis and support vector machine. Chin. J. Rock Mech. Eng. 2018, 37, 156–167. [Google Scholar]
  18. Li, Z.; Du, J.; Xu, W. Vulnerability assessment of direct economic losses in rainfall-landslide disaster chains based on machine learning. J. Catastrophol. 2022, 37, 220–224. [Google Scholar]
  19. Goetz, J.N.; Brenning, A.; Petschko, H.; Leopold, P. Evaluating machine learning and statistical prediction techniques for landslide susceptibility modeling. Comput. Geosci. 2015, 81, 1–11. [Google Scholar] [CrossRef]
  20. Zhao, X.; Chen, W. Optimization of computational intelligence models for landslide susceptibility evaluation. Remote Sens. 2020, 12, 2180. [Google Scholar] [CrossRef]
  21. Reyes, O.; Morell, C.; Ventura, S. Scalable extensions of the ReliefF algorithm for weighting and selecting features on the multi-label learning context. Neurocomputing 2015, 161, 168–182. [Google Scholar] [CrossRef]
  22. Yang, C.; Shao, D.; Yang, Z. A multi-feature fusion model for Chinese short text classification. J. Chin. Comput. Syst. 2020, 41, 1421–1426. [Google Scholar]
  23. Wang, H.; Wang, P.; Deng, S.; Li, H. Improved Relief Weight Feature Selection Algorithm Based on Relief and Mutual Information. Information 2021, 12, 228. [Google Scholar] [CrossRef]
  24. Wang, Z.; Li, R.; Tuo, W. Study on the sudden start-up mode of debris flow based on historical observation data—A case study of the Bailong River Basin in the Longnan mountainous region. J. Catastrophol. 2019, 34, 140–144. [Google Scholar]
  25. Zhang, Y.; Li, X.; Chen, G. Landslide susceptibility assessment using DEMATEL-based analytic network process in Loess Plateau. Geomorphology 2021, 382, 107697. [Google Scholar] [CrossRef]
  26. Kumar, R.; Anbalagan, R.; Kumar, V. Objective landslide susceptibility assessment using CRITIC-weighted information value method in Himalayan terrain. Nat. Hazards 2022, 112, 541–570. [Google Scholar]
  27. Lee, S.; Park, I. Regional-scale landslide susceptibility mapping using SMART decision rules with limited inventory data: A case study from Central Asia. Environ. Earth Sci. 2023, 82, 215. [Google Scholar] [CrossRef]
  28. Wang, Z.; Chen, Z.; Ma, K.; Zhang, Z. Machine-Learning-Based Hybrid Modeling for Geological Hazard Susceptibility Assessment in Wudou District, Bailong River Basin, China. GeoHazards 2023, 4, 157–182. [Google Scholar] [CrossRef]
  29. Zhang, Z.; Liu, Z.; Qin, R.; Li, G.; Wen, G.; He, W. Real-time detection of laser shock peening protective layer burn-through based on ReliefF feature weight fusion. Spectrosc. Spectr. Anal. 2023, 43, 2437–2445. [Google Scholar]
  30. Wang, A.; Zhang, Y.; Liu, W.; Meng, X.; Li, Y.; Su, X. Development characteristics of landslides in the active fault zone of Wenxian County, northeastern margin of the Tibetan Plateau. J. Nat. Disasters 2023, 32, 239–250. [Google Scholar]
  31. Chen, W.; Li, Y. GIS-based evaluation of landslide susceptibility using hybrid computational intelligence models. Catena 2020, 195, 104777. [Google Scholar] [CrossRef]
  32. Cui, Y. Research on Landslide Susceptibility Assessment Methods Based on Different Evaluation Units: A Case Study of Luonan County, Shaanxi Province; Xi’an University of Science and Technology: Xi’an, China, 2021. [Google Scholar]
  33. Liu, Y.; Xu, S.; Liu, C.; Ma, Y. Landslide Susceptibility Assessment Considering Multi-Method Integrated Feature Selection and Negative Sample Optimization. Bull. Surv. Mapp. 2024, 74–79. [Google Scholar] [CrossRef]
  34. Mu, K.; Xie, W.; Liu, Q.; Yan, M.; Yang, H.; Li, J.; Huang, Y.; Zhu, R. Landslide susceptibility assessment based on LR-RF model—A case study of Yaozhou District, Tongchuan City. J. Catastrophol. 2022, 37, 212–218. [Google Scholar]
  35. Wang, S.; Huang, Y. Spatial spillover effects and driving factors of urban carbon emission intensity in China. Acta Geogr. Sin. 2019, 74, 1131–1148. [Google Scholar]
  36. Li, J.; Yang, H.; Bai, S.; Wang, J. Landslide sensitivity mapping and land use analysis in the Beiyu River Basin, Longnan mountainous region. In Innovative Theories and Methods of Risk Analysis and Crisis Response—Proceedings of the Fifth Annual Conference of the Risk Analysis Committee of the China Disaster Prevention Association; School of Geographical Sciences, Nanjing Normal University; Key Laboratory of Virtual Geographic Environment, Ministry of Education, Nanjing Normal University: Nanjing, China, 2012; p. 4. [Google Scholar]
  37. Liu, J. Research on the Group Occurrence Law and Mechanism of Large Landslides in the Longnan Mountainous Region; Lanzhou University: Lanzhou, China, 2020. [Google Scholar] [CrossRef]
  38. Achour, Y.; Boumezbeur, A.; Hadji, R.; Chouabbi, A.; Cavaleiro, V.; Bendaoud, E.A. Landslide susceptibility mapping using analytic hierarchy process and information value methods along a highway road section in Constantine, Algeria. Arab. J. Geosci. 2017, 10, 1–16. [Google Scholar] [CrossRef]
  39. Sun, R.; Wang, C.D.; Xia, Z.B.; Gao, W. Risk assessment of geological disasters in Fei County based on AHP-information value method. Environ. Sci. Technol. 2015, 38, 430–435. [Google Scholar]
  40. Xu, C. Automatic extraction and reliability test of earthquake landslide information based on maximum likelihood method. Chin. J. Geol. Hazard Control 2013, 24, 19–25. [Google Scholar] [CrossRef]
  41. Li, W.; Wang, X. Application and comparison of frequency ratio and information value models in landslide susceptibility assessment in loess gully region. J. Nat. Disasters 2020, 29, 213–220. [Google Scholar]
  42. Swets, J.A. Measuring the Accuracy of Diagnostic Systems. Science 1988, 240, 1285–1293. [Google Scholar] [CrossRef]
  43. Jiang, T.; Zhang, Q.; Hou, R.; Chai, L.; Mckee, S.A.; Jia, Z.; Sun, N. Understanding the behavior of in-memory computing workloads. In Proceedings of the Workload Characterization (IISWC), 2014 IEEE International Symposium on IEEE, Raleigh, NC, USA, 26–28 October 2014; pp. 22–30. [Google Scholar]
  44. Wang, J.; Zang, M.; Xu, C.; Liu, T.; Huang, Y. Landslide susceptibility assessment of the 2022 Luding earthquake based on AHP-ROC curve area coupling algorithm. J. Eng. Geol. 2024, 32, 1696–1711. [Google Scholar] [CrossRef]
  45. Xu, C. Panoramic review and comparative analysis of landslides triggered by the 2008 Wenchuan and 2013 Lushan earthquakes. Safety 2024, 45, 25–38. [Google Scholar] [CrossRef]
Figure 1. (c) Geographical location of the study area. (a) Location of study area in China. (b) Location of the study area in Gansu Province, China.
Sustainability 17 03536 g001
Figure 2. Evaluation factor classification map. (a) Elevation map, (b) SLope map, (c) Aspect map, (d) Roughness map, (e) Road distance map, (f) River distance map, (g) Surface cover map, (h) Precipitation map, (i) Stratigraphic lithology map.
Sustainability 17 03536 g002
Figure 3. Flow chart.
Sustainability 17 03536 g003
Figure 4. Pearson correlation coefficient analysis matrix.
Sustainability 17 03536 g004
Figure 5. Contribution value radar chart.
Sustainability 17 03536 g005
Figure 6. Susceptibility evaluation map.
Sustainability 17 03536 g006
Figure 7. ROC curve.
Sustainability 17 03536 g007
Figure 8. Frequency ratio.
Sustainability 17 03536 g008
Table 1. Geohazard inventory of Wenxian County, China.
RegionLandslideRegionLandslideRegionLandslideRegionLandslide
Bikou Town16Zhongmiao Town41Tielou Tibetan Ethnic Township7Shifang Town1
Sheshu Township13Jianshan Township10Baoziba Town17Linjiang Town14
Liujiaping Township7Danbao Town7Fanba Town17Koutouba Township14
Chengguan Town15Shangde Town11Shijiba Town15Tianchi Town6
Yulei Township16Qiaotou Town13Liping Town9Zhongzhai Town4
Table 2. Data sources.
Data NameData Source
DEMGeospatial Data Cloud (https://www.gscloud.cn/search)
Disaster PointsNational Cryosphere Desert Data Center (http://www.ncdc.ac.cn/portal/)
Land CoverBig Earth Data Science Engineering Data Sharing Service System (https://data.casearth.cn/)
RainfallNational Oceanic and Atmospheric Administration (https://www.noaa.gov/)
Stratum LithologyGeological Cloud (https://geocloud.cgs.gov.cn/)
Roads, Water SystemsNational Geographic Information Resource Directory Service System (http://www.webmap.cn/)
Table 3. Evaluation factor classification table.
Evaluation FactorClassificationDisaster PointsPixels in RegionArea Proportion
Elevation559–96170330,1615.74%
961–136374869,04415.12%
1363–1765811,343,67623.38%
1765–2167331,418,29324.67%
2167–25692959,76816.70%
2567–29710514,6038.95%
2971–33730232,9894.05%
3373–3775074,1721.29%
3775–4177054520.09%
Slope0–10°34255,6864.46%
10–20°42827,21114.43%
20–30°721,622,55228.30%
30–40°701,837,95432.05%
40–50°32968,52616.89%
50–60°9206,6473.60%
60–70°115,4380.27%
>70°02070.00%
AspectFlat (−1)087260.15%
North (0–22.5)10341,4925.95%
Northeast (22.5–67.5)31749,02013.06%
East (67.5–112.5)41725,79412.66%
Southeast (112.5–157.5)31828,00414.44%
South (157.5–202.5)38731,07912.75%
Southwest (202.5–247.5)47671,86111.72%
West (247.5–292.5)27617,19610.76%
Northwest (292.5–337.5)24722,57312.60%
North (337.5–360)11339,0745.91%
Roughness1–1.08921,371,87523.92%
1.08–1.19781,885,94832.89%
1.19–1.30431,240,87521.64%
1.30–1.4129646,51511.27%
1.41–1.538326,0135.69%
1.53–1.695168,3892.94%
1.69–1.91468,8201.20%
1.91–2.25121,5040.38%
2.25–4.99042820.07%
River Distance0–600100921,25416.03%
600–120071828,52814.41%
1200–180044786,39713.68%
1800–240019740,98412.89%
2400–300013662,00511.52%
3000–36008591,41110.29%
3600–42001479,9788.35%
4200–48002337,1605.87%
>48002400,4806.97%
Road Distance0–6001701,257,92321.88%
600–120064813,91414.16%
1200–180015678,10811.80%
1800–24006572,4419.96%
2400–30004459,9978.00%
3000–36001346,4956.03%
3600–42000267,2324.65%
4200–48000218,3643.80%
>480001,133,72319.72%
Stratigraphic LithologyAcidic Plutonic Rock4157,6822.77%
Basic Plutonic Rock147,5390.83%
Carbonate Sedimentary Rock11102,3361.80%
Intermediate Plutonic Rock048,1200.84%
Metamorphic Rock891,263,62322.19%
Mixed Sedimentary Rock671,258,32022.09%
Siliceous Clastic Sedimentary Rock812,818,19249.48%
Surface CoverCultivated Land67623,75610.85%
Grassland44521,2429.07%
Forest1304,541,93879.02%
Shrubland0180.00%
Wetland06510.01%
Artificial Surface936,1000.63%
Bare Land013340.02%
Water Body1023,1270.40%
Permanent Snow and Ice0160.00%
Rainfall630–66010875,26215.23%
660–690991,774,84330.88%
690–720461,340,94123.33%
720–75028980,33317.05%
750–78068706,96912.30%
780–810969,8491.22%
Table 4. Evaluation factor contribution values.
Evaluation FactorStratigraphic
Lithology
PrecipitationElevationAspectSlopeRoad DistanceRiver DistanceSurface Cover
Contribution Value0.750.570.40.290.250.230.20.19
Weight Value0.260.20.140.10.090.080.070.07
Table 5. Evaluation model comparison.
Evaluation ModelData Driven ModelWeight AssignmentOperation ProcessProcessing TimeData Volume SizeAUC ValueFrequency Ratio
Very LowLowMediumHighVery High
ReliefF MethodYesYesSimpleShortMedium0.8530.000.050.391.624.21
Information Quantity MethodYesNoComplexLongLarge0.8380.000.140.431.703.80
Analytic Hierarchy ProcessNoYesSimpleShortSmall\\\\\\
Disclaimer/Publisher’s Note: The statements, opinions and data contained in all publications are solely those of the individual author(s) and contributor(s) and not of MDPI and/or the editor(s). MDPI and/or the editor(s) disclaim responsibility for any injury to people or property resulting from any ideas, methods, instructions or products referred to in the content.

