Article

Building Sustainable Global Marketing Channels: Exploring the Role of Inter-Organizational Trust and Performance Metrics in the Age of Industry 4.0

1
Marketing Department, Thompson Rivers University, Kamloops, BC V2C 0C8, Canada
2
Alliance Manchester Business School, University of Manchester, Manchester M15 6PB, UK
3
LSBU Business School, London South Bank University, London SE1 0AA, UK
*
Author to whom correspondence should be addressed.
Sustainability 2025, 17(8), 3524; https://doi.org/10.3390/su17083524
Submission received: 28 February 2025 / Revised: 28 March 2025 / Accepted: 31 March 2025 / Published: 15 April 2025

Abstract

:
This research explores the interaction between inter-organizational trust, marketing channels, and market and financial performance (FP) in establishing sustainable global marketing channels using Industry 4.0 technologies. It is conducted within the relational exchange theory (RET) framework and transaction cost economics (TCE). The sample (N = 131) was collected through the marketing research firm Centiment. PLS-SEM and Necessary Condition Analysis (NCA) were utilized as statistical methods. All hypotheses except the relationship between marketing channel operational performance and FP were accepted. This research highlights the vital role of inter-organizational trust in enhancing operational efficiency, profitability, and sustainability. It finds that trust fosters collaboration in global distribution channels, improving performance across multiple dimensions. Specifically, trust positively impacts marketing channel operations, boosting market performance. Nevertheless, all exogenous constructs were essential—“must-have” conditions for the endogenous FP construct. Applying the novel NCA is distinctive, primarily as it demonstrates that the relationship between marketing channel operational performance and FP is a necessary “must-have” condition, despite the insignificant path coefficient between the constructs. This is a crucial finding, as further investment in marketing channel operational performance and other antecedents of FP may be futile if the necessary conditions have not been met.

1. Introduction

The fourth industrial revolution, Industry 4.0, has garnered global attention in research and practice [1,2]. It was first characterized by the rise in artificial intelligence (AI) and the Internet of Things (IoT), where data serves as the new currency, enabling business processes and models to thrive, particularly in global contexts [3]. Various definitions of Industry 4.0 can be found in the literature. According to Schwab [3], Industry 4.0 represents the shift from physical to virtual lives, driven by Internet-based collaborative technologies [4,5]. Other researchers describe Industry 4.0 as a novel concept that presents numerous opportunities to enhance the management of global marketing channels and sustainability [2,6]. Industry 4.0 technologies extend beyond 5G high-speed Internet, Zoom, and Microsoft Teams teleconferencing solutions; they also encompass augmented and virtual reality tools, cloud computing (CC), smart manufacturing, and collaborative applications such as GitHub and SharePoint [7]. Thus, after reviewing various definitions, Industry 4.0 can be articulated as the technical and organizational digitization and transformation involving the integration of digital value chains along with new business models, intelligent products, and communication. Industry 4.0 technology adoption has been shown to enhance company sustainability due to the efficiency improvements it creates [8]. This topic warrants further investigation, as empirical research indicates that firms leveraging digital solutions and technologies in marketing channels—such as big data, IoT, machine learning, and augmented reality—can enhance firm performance and boost operational efficiency [9].
A digital ecosystem facilitating communication and interaction between individuals and companies through data exchange processes is a foundational component of this digital evolution [10]. Previous research has shown that inter-organizational trust is a key element in successful business transactions, making it essential to cultivate this trust within a business ecosystem using digital technologies [11,12].
Existing research highlights the need to investigate the relationships among these constructs and their respective impacts on financial performance (FP). Existing research has been limited in examining the interplay between inter-organizational trust and various performance metrics when developing sustainable global marketing channels using Industry 4.0 technologies. This study addresses this significant research gap by examining the interplay between inter-organizational trust, marketing channel operations, and market performance (MP) about FP. Previous studies indicate that these constructs are crucial for assessing their interaction with Industry 4.0 technologies [13,14]. Additionally, the theoretical foundation of this research is grounded in relational exchange theory (RET) and transaction cost economics (TCE) [15], particularly when exploring the influence of inter-organizational trust on channel and firm performance. It is noteworthy that the RET emphasizes over-reliance on subjective trust and, thus, may ignore the need for contracts, and that cultural differences may affect the effectiveness of trust and commitment [16]. In contrast, TCE focuses on contracts and institutions and ignores social relations and trust [17]. Therefore, it is justifiable that both of these theories/approaches be present in this research.

2. Literature Review

Customers’ growing demand for customized products and communication has led to the emergence of Industry 4.0 [18]. This phenomenon is prompting changes in global marketing strategies and initiatives to adapt them to align with current market trends, including improvements in sustainability [19,20]. Employing Industry 4.0 technologies influences consumer behaviours, decision-making processes, and brand interactions across various channels [18]. Numerous studies have established a connection between innovation and overall business performance [21,22].

2.1. Industry 4.0 and Sustainability in Global Marketing Channels

An increasing number of scholarly research studies link the application of the Industry 4.0 paradigm to sustainability [23]. Numerous studies investigate how digital technologies influence sustainability and environmental and economic performance [24,25,26]. The prevailing view is that the use of Industry 4.0 technologies has a positive effect on sustainable development [27]. Additionally, other researchers have established that following innovative green supply chain practices—such as waste management, efficient energy use, and carbon footprint reduction—positively impacts companies’ environmental and financial performance [28,29]. Based on a quantitative study of manufacturing firms in Pakistan, companies supported by Industry 4.0 have enhanced their environmental and economic performance by implementing green practices in marketing, manufacturing, and distribution channels [30]. Furthermore, this advancement in digital technologies seems to support the evolution of an eco-friendly supply chain by effectively controlling and monitoring waste, energy consumption, and overproduction [27]. Thus, the following section discusses the development of marketing channel operations during Industry 4.0.

2.2. Marketing Channel Operational Performance

Coordinating and integrating marketing and supply chain functions is essential to ensure product delivery that meets consumer demands based on current market needs [31]. Previous research indicates that companies closely monitoring supply chain management alongside marketing channel functions tend to outperform those seeking to leverage each function independently [32]. Several challenges impede the advancement of marketing channels’ operational performance, including the high costs of adopting new technologies and the lack of expertise needed to select the right technology for facilitating the digital integration of marketing and supply chain channels [33]. For example, a study of U.S. brands revealed that Walmart enhanced its operational efficiency by concentrating on delivering customer value. This was accomplished by implementing digital tags on forklifts, shelves, and cases of promoted items, which improved tracking of both high- and low-selling products based on consumer choices [33]. As discussed in the following section, such advancements in marketing channel operations appear positively related to customer satisfaction and overall marketing performance.

2.3. Market Performance (MP)

MP is typically assessed using various measures, including market share, sales, customer satisfaction, and loyalty [34,35]. As confirmed by the authors [36], a study conducted in the U.S. revealed a positive direct relationship between product customization and customer satisfaction [37]. Customers are aware of ongoing technological developments that lead them to expect and demand high-quality customized products [38,39]. Industry 4.0 technologies may positively influence MP and help satisfy the demand for high-quality products [39,40]. Research conducted among manufacturing companies examined the effectiveness of implementing Industry 4.0 technologies on product customization, customer loyalty, and MP [41]. The study indicated that applying Industry 4.0 technologies positively affects product customization and MP. The innovative application of Industry 4.0 technologies enhances the marketing channel operational performance of marketing channels and MP while supporting internal sustainability initiatives. Supporting this, a study conducted among distributors found that customer-focused innovative capabilities positively impacted MP [42], such as the ability to launch new products and services quickly. Creating leaner and more efficient production and service capabilities via Industry 4.0 has enhanced environmental sustainability because of the efficiencies it creates within organizations [8]. Based on this discussion, the following hypothesis is proposed.
H1. 
Marketing channel operational performance positively and significantly impacts market performance when aiming to build sustainable global marketing channels with Industry 4.0 technologies.

2.4. Inter-Organizational Trust

Relational exchange theory (RET) does not explicitly address the impact of inter-organizational trust on MP [43,44]. However, research indicates that inter-organizational collaboration can foster radical innovation, especially with partners with expertise in specific areas [14]. In previous studies, trust has gained some attention within inter-organizational collaboration [45]. Inter-organizational trust is generally defined as one company’s confidence in another, depending on each other for services, particularly during risky times [46]. As a result, inter-organizational trust can be beneficial for sharing resources and knowledge, thus facilitating the development of innovative products [13,47].
Typically, inter-organizational trust is assessed through credibility, integrity, and dependability [48,49]. An analysis of partner relationships in new technology-based firms indicates that technology-driven companies foster inter-organizational trust and knowledge sharing effectively [46]. Some researchers argue that inter-organizational trust can positively influence marketing channel operations by promoting collaboration among channel members and enhancing planning and problem-solving [50]. Other studies have identified a positive correlation between inter-organizational trust and satisfaction, which enhances overall channel performance [51]. Inter-organizational trust is also positively affected by the sustainability of the entities with which a focal firm interacts [52]. Research on mobile phone suppliers and retailers in China reveals that perceptions of inter-organizational trust can impact the performance of operational channels, such as those involving retailers and suppliers [53]. Drawing on relational exchange theory (RET), it is clear that the parties engaged in an exchange recognize that the benefits derived from this interaction exceed those that could be gained independently, primarily because the theory emphasizes the entire relationship and its history rather than a single transaction [54]. RET posits that inter-firm interactions are vital for achieving competitive advantages and provide access to diverse assets and competencies that create added value throughout the operational channel [55]. Consequently, this research proposes the following hypothesis.
H2. 
Inter-organizational trust positively impacts marketing channel operational performance when aiming to build sustainable global marketing channels with Industry 4.0 technologies.
Furthermore, inter-organizational trust can impact market performance (MP). A study conducted on firms in the Czech Republic revealed that inter-organizational trust positively influences perceived market performance, mediated by its beneficial effects on relationships with suppliers. In this context, perceived performance refers to customer satisfaction and their perceptions of product quality [56]. Other researchers have suggested that inter-organizational trust with suppliers can enhance these suppliers’ ability to adapt to changing market demands [57,58]. Findings from a study involving Spanish firms indicated that inter-organizational trust positively affects market responsiveness and innovation [45]. However, there is a lack of research exploring the impact of inter-organizational trust on MP. One study was conducted within the framework of relationship economics theory (RET), focusing on business-to-customer (B2C) relationships rather than business-to-business (B2B) [59]. Nonetheless, this study did not investigate the relationship between inter-organizational trust and MP. In line with RET, this study aims to examine the effect of inter-organizational trust on MP. Therefore, this research presents the following hypothesis:
H3. 
Inter-organizational trust positively impacts market performance when aiming to build sustainable global marketing channels with Industry 4.0 technologies.
As argued by the RET, a potential benefit of inter-organizational trust is that fostering collaborative relationships between suppliers and buyers reduces monitoring and transactional costs [60]. The RET suggests that supply chain integration can mitigate risks by lowering transaction costs and promoting greater trust and cooperation between trading partners [61]. Researchers assert that supply chain integration among partners is crucial for enhancing financial performance (FP). It involves economic behaviours such as system alignment, information sharing, collaborative investments, and sustained inter-firm social interactions among trading partners [62,63]. Furthermore, drawing on the theory of transaction cost economics (TCE), it can be argued that partnerships founded on mutual trust can decrease transaction costs by relying less on formal contracts and governance mechanisms [64]. For instance, inter-organizational trust may allow business partners to lean less on contractual agreements, leading to greater economic value for all participants in the operational channel [65]. A recent study found that integrating innovative supply chain assets from different partners involved in inter-organizational relationships can reduce costs [15].
Additionally, some researchers argue that trust is crucial for establishing governance mechanisms related to knowledge sharing and for promoting product innovation within exchange relationships. Furthermore, trust is essential in managing international channel relationships and enhancing local market competencies [13,47]. A recent study on information and communication technology companies in Hungary revealed that inter-organizational trust can positively impact performance [14]. Consequently, this study presents the following hypothesis:
H4. 
Inter-organizational trust positively impacts financial performance when aiming to build sustainable global marketing channels using Industry 4.0 technologies.

2.5. Financial Performance (FP)

Research has investigated the potential impact of Industry 4.0 technologies on financial performance (FP) [66,67]. Previous studies have assessed FP through sales, profits, and earnings per share metrics [68]. These studies have established a direct link between adopting Industry 4.0 technologies, providing personalized products, and increasing demand for those products, leading to an overall improvement in FP [42]. This relationship may be illustrated by the effect of marketing practices (MP) and marketing channel operations on FP. MP is critical in translating innovation into positive financial results [21,22]. A study of manufacturing and service firms in Turkey suggests that a company’s MP may positively correlate with its FP [69]. Therefore, MP is an essential concept to examine. As a result, this research proposes the following hypothesis.
H5. 
Market performance positively impacts financial performance when aiming to build sustainable global marketing channels with Industry 4.0 technologies.
Previous research indicates that marketing channel performance may be a key driver of positive financial performance (FP). This notion is supported by the belief that innovative and effective channel operations enhance customer satisfaction through improved products and services, potentially leading to better FP [70]. Other scholars argue that robust and capable channel operations can influence FP, enabling firms to adapt to ever-evolving customer needs quickly [71,72]. Prior studies conclude that managers expecting marketing channel operations to enhance FP should prioritize supply chain performance and cultivate strong relationships among channel partners [73,74]. Consequently, this study proposes the hypothesis below.
H6. 
Marketing channel operational performance positively impacts financial performance when aiming to build sustainable global marketing channels with Industry 4.0 technologies.

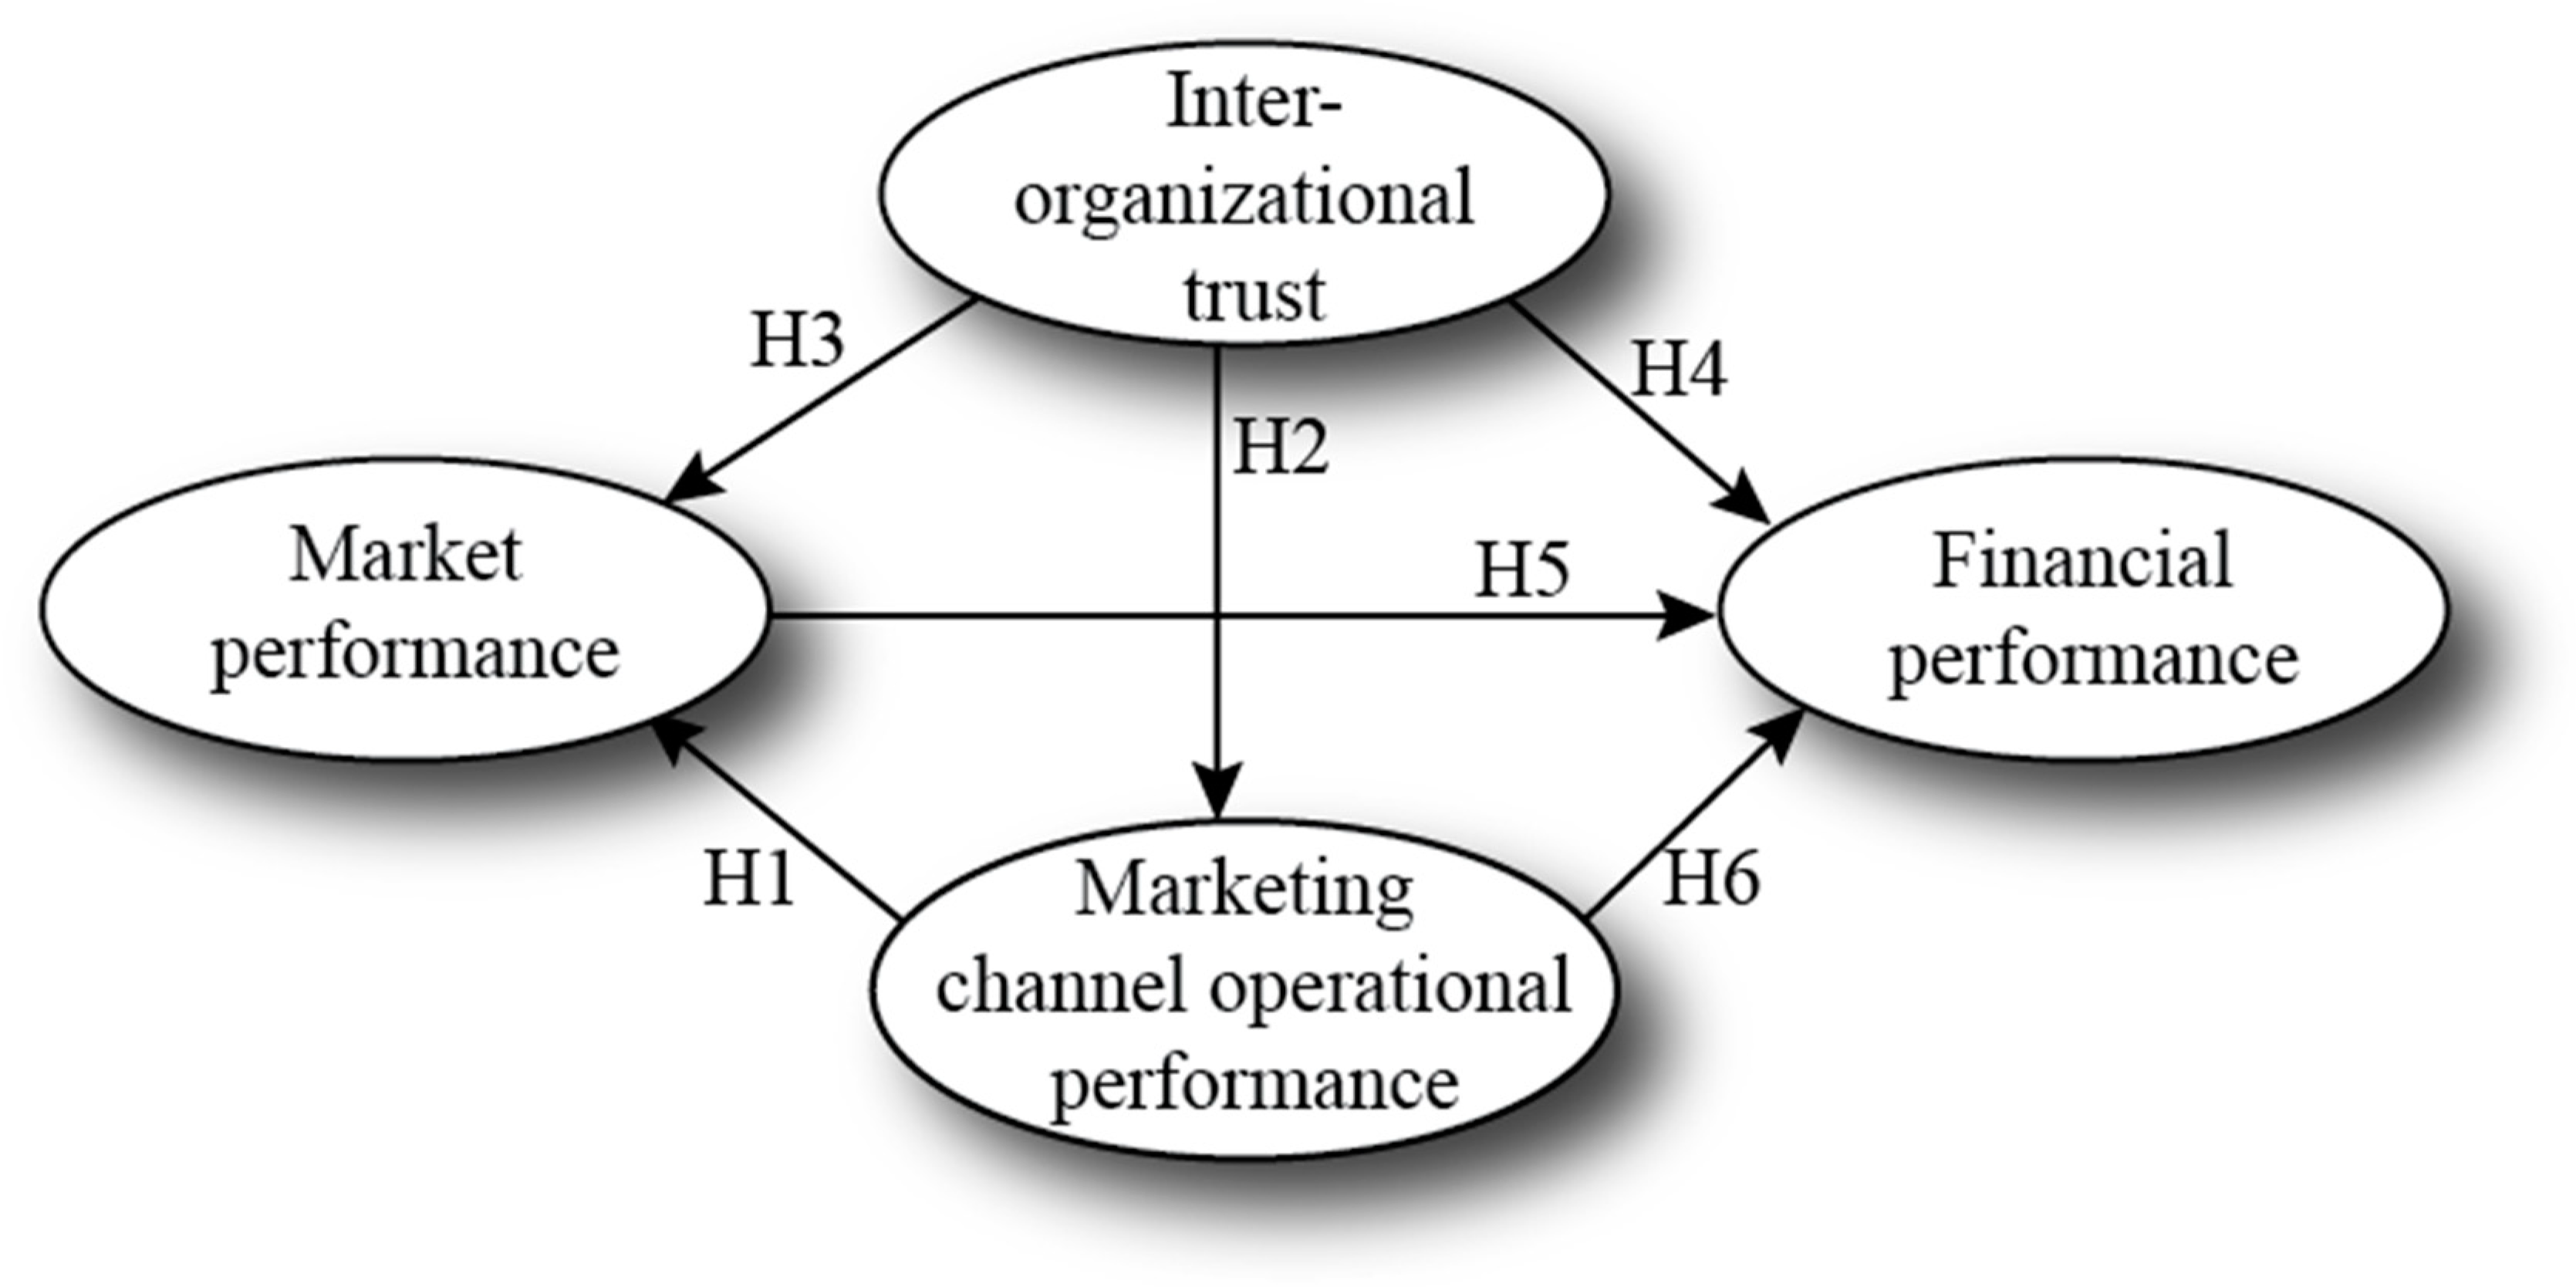
2.6. Structural Model

The structural model was created based on the literature review (Figure 1) and illustrates the research hypotheses.

3. Methodology

3.1. Sample and Respondent Characteristics

The sampling frame was developed in collaboration with the marketing research firm Centiment. During winter 2024, 944 responses were collected across Canada and the U.S., ensuring all participants were at least 18. Respondents received financial compensation according to Centiment’s policies. At the beginning of the survey, qualification questions were used to confirm that participants met specific criteria. First, only individuals employed by global or international companies (i.e., not just domestic ones) were eligible. Second, participants needed to be involved in marketing, related fields, or operations, excluding areas such as human resources, finance, and accounting. Third, participants had to work in firms with at least 400 employees, as smaller companies have been slower to adopt Industry 4.0 technologies [75]. Finally, the respondents’ companies needed to be at least in the limited deployment phase of Industry 4.0 technologies, as outlined in Table 1. The final sample consisted of 131 responses, aligning with findings from a recent BDO report [76], which indicates that only about 5% of companies are implementing or have implemented Industry 4.0 technologies. It is also noteworthy that the sample sizes can often be small, particularly in B-to-B research. This point receives particular emphasis in this research, as the number of companies employing Industry 4.0 technologies is still limited. Adhering to the minimum sample size requirements (see section “Checking and preparation of data”) ensures the results of a statistical method, such as PLS-SEM, have adequate statistical power. The statistical power of the sample of this research, which has three predictors for the endogenous constructs, shows an observed R² of 0.606 (see section “Assessment of the structural model”), a probability level of 0.05, and a sample size of 131, resulting in a power of 1.00, which is considered excellent [77].

3.2. Measurement and Questionnaire Development

The researchers developed a survey questionnaire using a Likert scale (1 = completely disagree, 5 = completely agree or equivalent) using items adapted from the existing literature to collect data regarding the key constructs (Table 2).

3.3. Method of Statistical Analysis

The model was analyzed using PLS-SEM. Two alternatives for structural equation modelling are available: partial least squares (PLS-SEM) and covariance-based (CB-SEM). The measurement concepts and objectives differ between these options [82]. In the covariance-based approach, constructs are represented through factors, whereas in PLS-SEM, they are represented by components [82,83]. Furthermore, PLS-SEM includes several integrated statistical procedures not available in CB-SEM. One example is the Necessary Condition Analysis (NCA), and since NCA will be employed in this research, PLS-SEM was chosen. To support this decision, it is essential to note that the goal is to predict the target construct (FP) and identify key driver constructs. Current recommendations for evaluating the quality of the PLS-SEM measurement and structural models were followed [84].
NCA is a relatively new analysis technique recently integrated into SmartPLS, version 4.1.1.1. This research employed NCA, an excellent tool because it can discern the degree of a necessary condition that must be fulfilled to achieve a specific result in the target construct. By utilizing NCA, it is possible to envision the necessary level of inter-organizational trust and market performance needed to attain a certain level of FP [85].
The NCA aims to identify which constructs are considered “necessary” (necessity logic) and which attributes are deemed “sufficient” (sufficiency logic) for the endogenous construct of FP [86,87]. The required steps for conducting the NCA were based on the guidelines established in the current research. These steps include describing the research goals and relevant theories, preparing and examining the data, conducting routine PLS-SEM analysis, assessing the reliability and validity of the measurement model, transmitting the latent variable scores to the dataset in unstandardized form, executing the NCA, evaluating the structural model, and clarifying the data [85]. The table in Appendix A was used to elucidate the results.

4. Data Analysis

4.1. Background Data

Table 3 illustrates the sample population. The participants came from various industries, including finance and insurance, information and cultural industries, education services, manufacturing, construction, and real estate. The respondents originated from the manufacturing sector (44.7%), the wholesale and retail trades (19.2%), and construction (7.5%). Moreover, they came from information technology, mining, health care, transportation and warehousing, and real estate sectors.

4.2. Preparation and Checking of Data

In this phase, the adequacy of the sample size, data distribution, presence of outliers, and scales’ measurement level/coding are assessed [85]. Cochran’s rule for continuous data were utilized to establish the acceptability of the sample size [88]. This determination resulted in a required sample size of 61, given an alpha level of 0.25 in each tail at 1.96, an anticipated standard deviation on a 5-point scale of 1.0, and a standard margin of error of 0.25. To assess the sufficiency of the sample size when employing PLS-SEM, a sample size of 69 was necessary when the significance level was set at 5%, with the path coefficient level being at least 0.21 [82]. Therefore, the sample size was deemed adequate.
Regarding data distribution, using NCA or PLS-SEM does not depend on distributional assumptions. However, highly skewed data may inflate standard errors during statistical significance testing with bootstrap analysis, potentially reducing statistical power [85]. To assess skewness (the balance of distribution) and kurtosis (the peakedness), the data were analyzed using SPSS (v.26) (Table 4). The existing literature indicates that the most frequently used critical values for skewness and kurtosis are 2.58 (at the 0.01 level of significance) and 1.96 (at the 0.05 level of significance), with higher values reflecting greater kurtosis and skewness in the data. Normality tests are typically conducted using the Kolmogorov–Smirnov and Shapiro–Wilk tests. Both tests indicate significance (Table 4) for all variables, suggesting a non-normal data distribution. Given that the data analysis revealed minimal skewness and kurtosis and indicated non-normality, the data may have exhibited reduced statistical power. For correlations between the variables, please see the Supplementary Materials.
The literature suggests using Mahalanobis distance in multivariate analysis to assess outliers in the data. This method detects abnormal combinations in the dataset under scrutiny [89,90]. This analysis revealed two outliers in the dataset, which were subsequently removed from the dataset. Finally, scales were measured and coded using metric or quasi-metric Likert scales with theoretically expected relationships. This completes preparing and checking the PLS-SEM and NCA data stage.

4.3. Evaluation of the Reliability and Validity of the Measurement Model

The first step at this stage was to assess the individual scales to measure the relevant constructs. The evaluation of the measurement model begins by evaluating the reliability of the indicators. A bias-corrected and accelerated bootstrapping analysis was performed to determine the significance of the indicator variables. The literature indicates that if indicator loadings exceed the value of 0.70, they should be retained, while indicators with loadings between 0.40 and 0.70 should be considered for removal. Since the loadings for the variables TRU2, TRU3, and TRU4 were below 0.40 and insignificant, they were excluded from further analysis. All other loadings surpassed the value of 0.70.
The next step in appraising the measurement model is evaluating the internal consistency reliability (see Table 2). The existing literature views Cronbach’s alpha as a conservative measure of reliability. In contrast, composite reliability (with a target range between 0.70 and 0.95) often overestimates internal consistency reliability. Therefore, the actual reliability lies between these criteria, with Cronbach’s alpha representing the lower limit and composite reliability serving as the upper limit for internal consistency reliability [82]. Regarding convergent validity, typically assessed using average variance extracted (AVE) values, the threshold level of 0.50 must be exceeded (see Table 2).
Next, the discriminant validity was evaluated (Table 5), indicating how much a construct differs from other constructs. This has thus far been carried out using Fornell and Larcker’s assessment. The current literature suggests using the Heterotrait-Monotrait (HTMT) correlations, which illustrate the ratio between trait and within-trait correlations [82]. Research has shown that HTMT values should not exceed 0.90 [91]. The latent variable scores were incorporated into the dataset in preparation for the NCA.

4.4. Assessment of the Structural Model

When evaluating the structural model, collinearity, which indicates a correlation among the exogenous predictors, must first be assessed. Collinearity is typically measured using variance inflation factors (VIF). All VIF values in the structural model were below 3, signalling a lack of collinearity [92].
Following the assessment of collinearity, analyses for predictive validity and relevance were conducted, typically using the R2 and Stone–Geisser Q2 values [93,94]. Research has indicated that R2 values of 0.67, 0.33, and 0.19 are considered substantial, average, and weak, respectively. The R2 and adjusted R2 values for the endogenous construct of FP were 0.606 and 0.596, respectively [95]. Recent studies have also established strength criteria for Stone–Geisser Q2 values, indicating that values above 0.25 and 0.50 represent medium and large predictive relevance in the PLS-SEM model [96]. The PLSpredict analysis revealed a Q2 value of 0.975 (Table 6). Moreover, the root mean square error (RMSE) and mean absolute error (MAE) values from the PLS-SEM predictions are lower than those of the linear model (LM) for most indicators. Thus, the research model demonstrates medium to high predictive relevance and power [85].
The final stage in evaluating the structural model involves analyzing the path coefficients (see Table 7). It is crucial to emphasize that reporting statistical significance alone is insufficient [97]; effect size must also be included, as it may represent the most significant finding [98,99]. Furthermore, with a sufficiently large sample size, statistical tests can detect significant differences that may lack practical relevance. In contrast, effect sizes are independent of sample size, making them consistent across various studies [82]. According to Hair et al. [82], effect sizes of 0.02, 0.15, and 0.35 indicate the exogenous construct’s small, medium, and large effects, respectively (see Table 7). The results suggest that all relationships are significant except for the effect of marketing channel operational performance on FP.
Finally, the analysis results regarding the specific indirect effects are shown in Table 8. Notably, the specific indirect effect of inter-organizational trust through marketing channel operational performance on FP is insignificant. However, the marketing channel’s operational performance influences FP through MP.

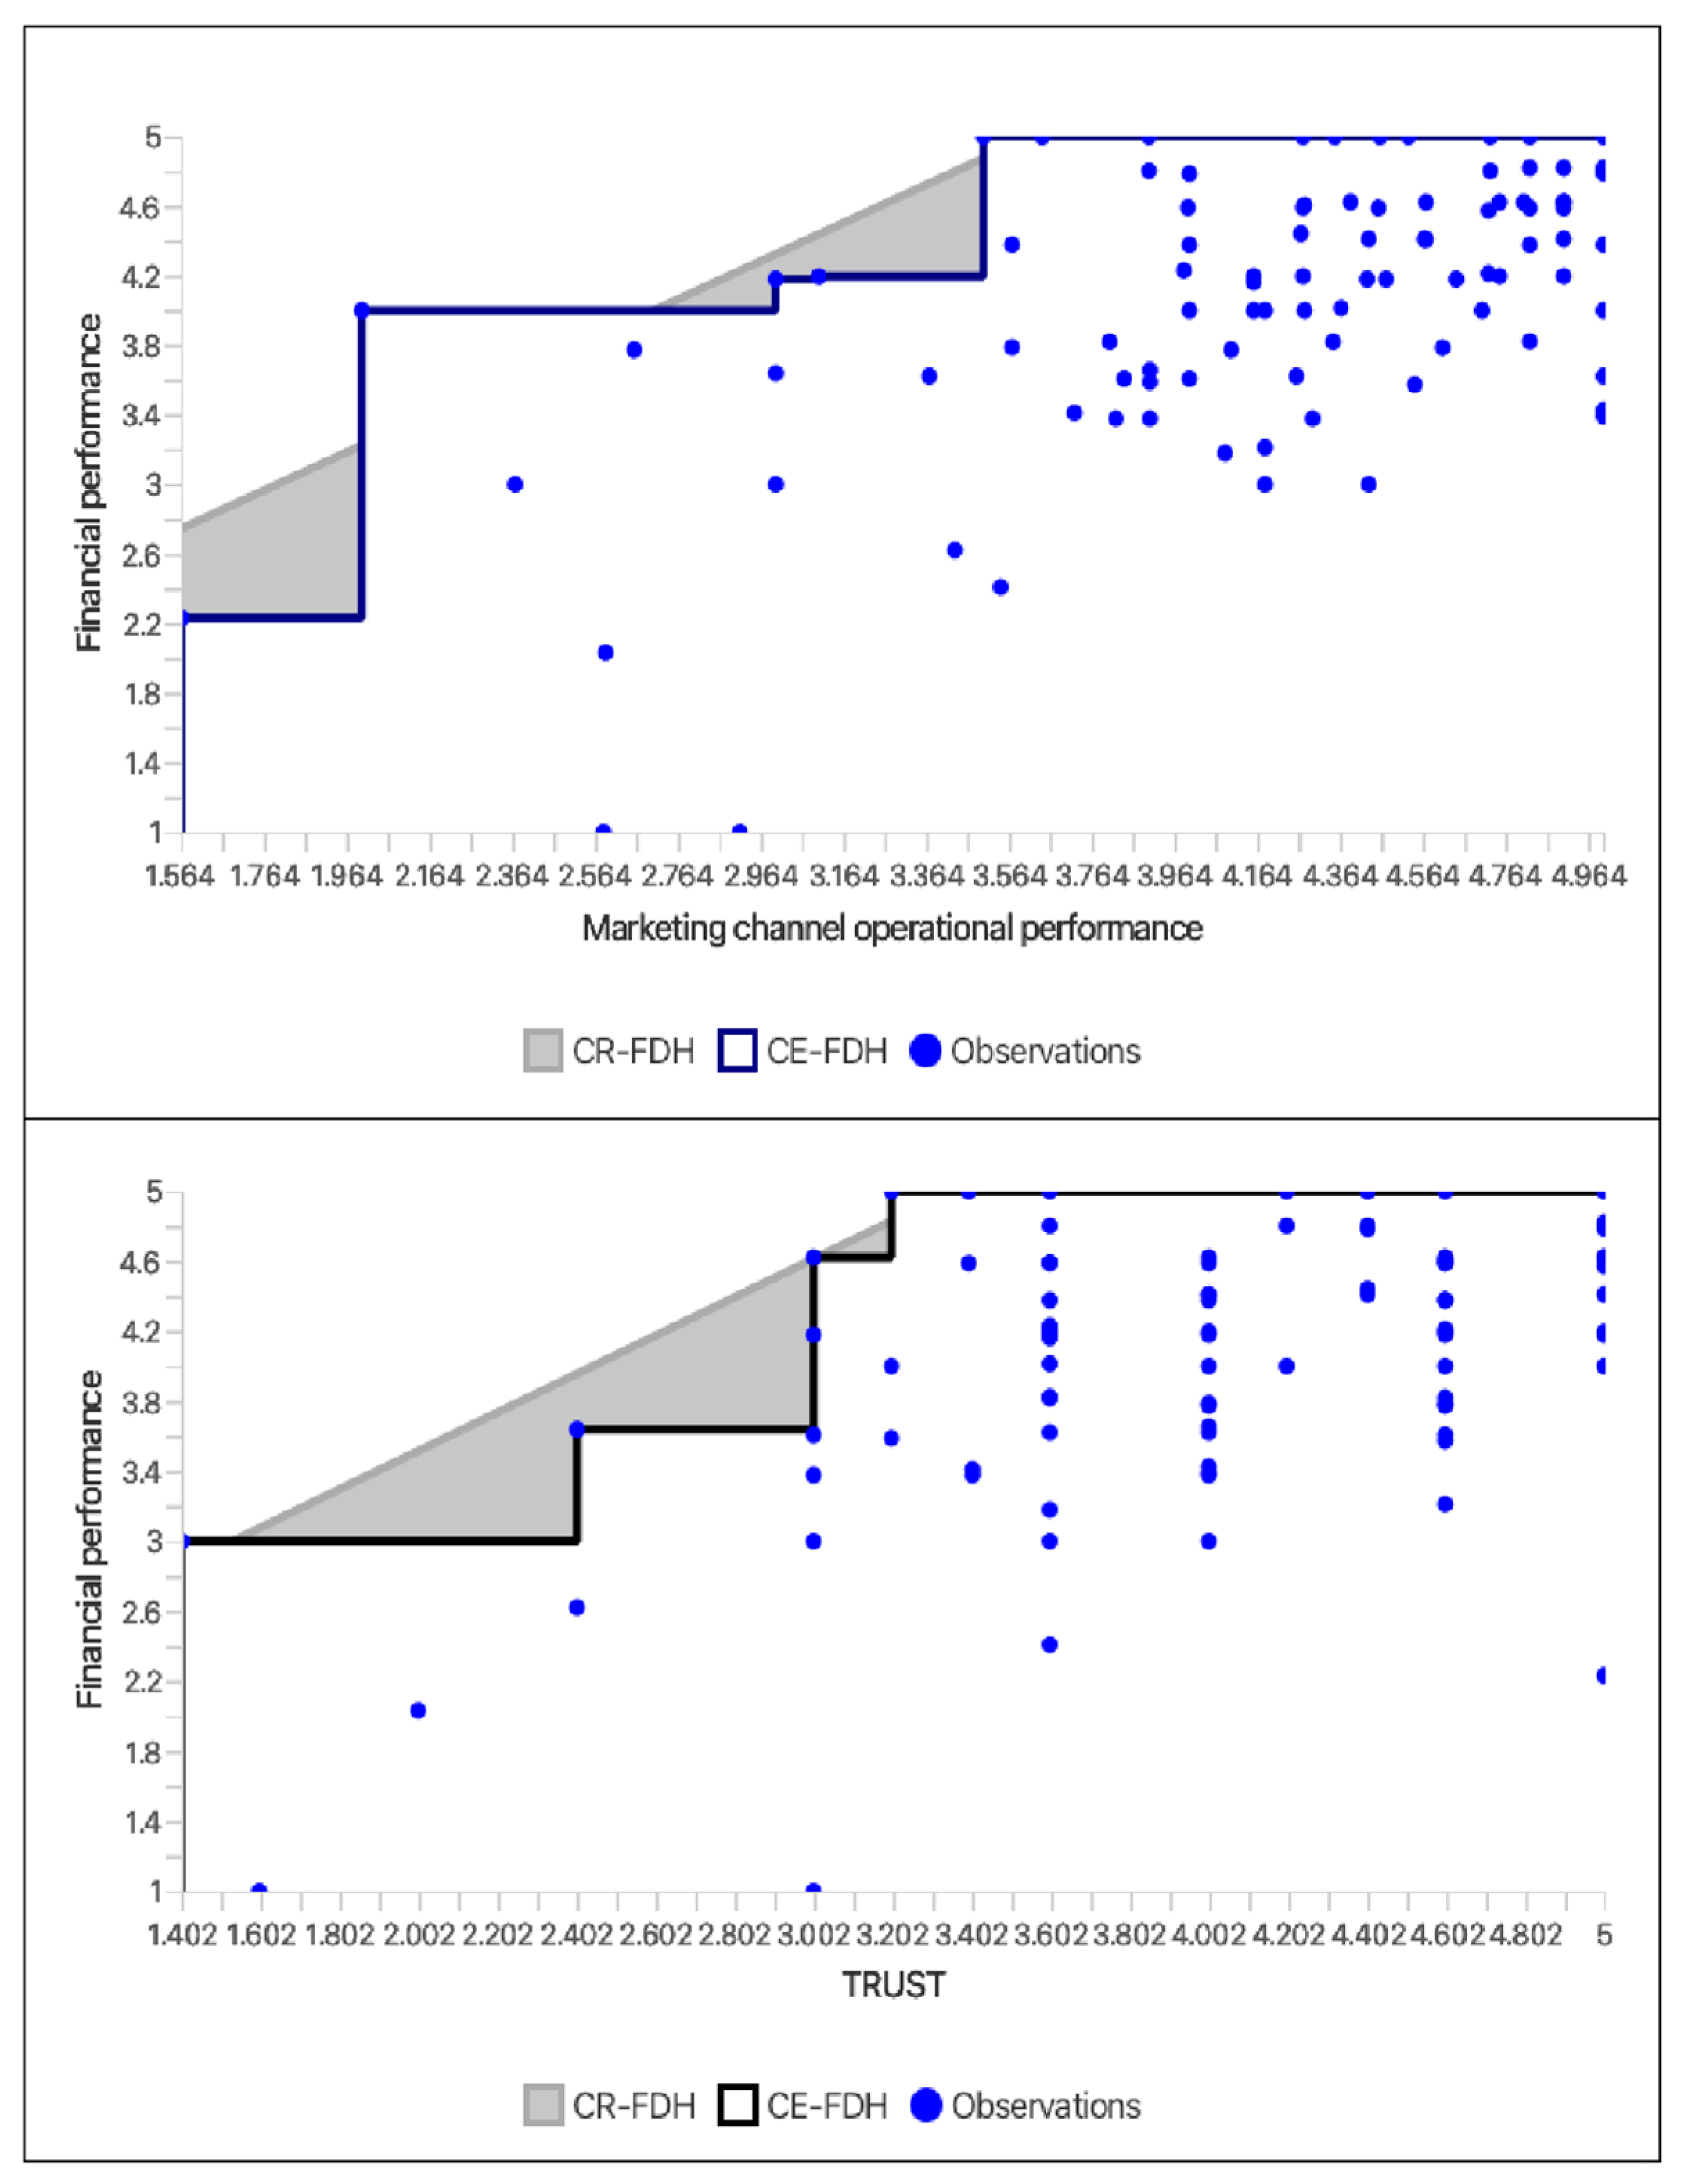
4.5. Necessary Condition Analysis (NCA)

Beyond examining the significance of path coefficients, NCA provides a comprehensive view of how various exogenous constructs influence endogenous constructs. This relationship can be illustrated through scatter plots comparing exogenous and endogenous constructs, which may reveal necessary conditions [85]. For example, certain levels of marketing channel operational performance, MP, and inter-organizational trust could be crucial for achieving a specific level of FP. Therefore, NCA assists researchers in identifying which endogenous constructs are necessary and the extent to which each exogenous construct must be present to achieve a particular level of the endogenous construct [87].
The scatter plot diagrams typically display two upward-sloping lines, known as the ceiling development-free disposal hull (CE-FDH) and the ceiling regression-free disposal hull (CR-FDH) (see Appendix B). The main difference lies in the fact that the CR-FDH is a direct line that passes through the stepwise CE-FDH line. This indicates that a larger area in the top-left corner signifies a more significant constraint of the endogenous constructs on FP [85]. Furthermore, this can be illustrated with a bottleneck table. Table 9 outlines two essential conditions for achieving an 80% level of FP (4.2): for example, a marketing channel operational performance of at least 3.50 and inter-organizational trust of at least 3.00. In this study’s sample, 60 observations (45.8%) met both threshold levels, underscoring a substantial need for improvement to attain high (80%) FP (see Appendix B).
The key indicators of NCA effectiveness are ceiling accuracy and necessary effect size. Ceiling accuracy represents the percentage of observations that fall on or below the ceiling line, calculated by dividing these observations by the total number and multiplying by 100. Comparing this accuracy to a benchmark value, such as 95%, aids in assessing the quality of the solution [85,86]. The necessary effect size, d, and its statistical significance indicate whether a construct is essential. The value of d is determined by dividing the “empty” space (the ceiling zone) by the total range of observations [85].
The effect sizes and their significance are illustrated in Table 10. Previous research has labelled 0 < d < 0.1 as a small effect, 0.1 ≤ d < 0.3 as a medium effect, 0.3 ≤ d < 0.5 as a large effect, and d ≥ 0.5 as a very large effect.

4.6. Interpretation of the Results

The analysis results indicate that settings 1 and 3 are supported in Table 8 alongside the theoretical foundations. Notably, the research also specifies the necessity for a medium effect to qualify as a necessary condition. Based on the results in Table 10, the findings of the NCA are summarized in Table 11 [100].

5. Discussion

The primary objective of this study was to explore the interaction between inter-organizational trust, marketing channel operational performance, and market performance when utilizing Industry 4.0 technologies within the framework of global sustainable distribution channels. Initially, the study revealed that inter-organizational trust positively affects marketing channel operational performance (H2), positively impacting market performance (H1). This conclusion is supported by the literature, indicating that technological advancements in marketing channels are closely associated with a swift response to consumer demands, enhancing the company’s performance [32,33].
The significance of the path coefficients to market, marketing channel operations, FP, and substantial total effect sizes underscores the critical role of inter-organizational trust (H2, H3, and H4). Furthermore, the indirect effects of inter-organizational trust on FP (0.391) and MP (0.250) are also significant, reinforcing the essential role of inter-organizational trust and the necessity of all constructs in the model (Table 7). Previous research supports these findings, indicating that inter-organizational trust within Industry 4.0 practices enhances overall functional ability, market responsiveness, and product innovation [45]. Moreover, digital trust has influenced both realized and potential technology absorption capacity [101,102], which mediates FP through innovation capacity [102].
This research also demonstrated a positive and significant impact of inter-organizational trust (H4) and marketing performance (H5) on financial performance (FP). However, the relationship between marketing channel operational performance and FP was found to be insignificant (H6). Nonetheless, the findings specify the critical levels of marketing channel operational performance that are necessary conditions (3.5) to achieve a relevant level of FP (80%). It is important to note that increasing the marketing channel operational performance to a higher level does not further enhance FP. This is a vital discovery since additional investments in this and other factors influencing FP may be impractical if the necessary conditions are not addressed. Only when all relevant bottlenecks are resolved will additional resources improve FP [85].
Results indicated that marketing channel operational performance in MP and marketing channels positively impacted FP, which aligns with previous research findings. For instance, Wang et al. [42] noted that relational immersion with distributors fosters close and mutual relationships, enhancing trust and ultimately boosting performance. Additionally, a meta-analysis of 60 empirical studies by Bai et al. [103] found that both calculative and relational trust positively influence organizational performance. The distinction between calculative and relational trust is that calculative trust primarily occurs during the initial stages of a relationship, whereas it may evolve into relational trust over time.
These research findings align with the existing literature, as inter-organizational trust enables participants in business relationships to depend less on formal contracts, thereby minimizing transaction costs [60]. These findings present several implications, which are explored in the following section.

6. Implications

6.1. Theoretical Implications

This study illuminates RET and TCE by explicitly exploring the influence of inter-organizational trust on firm performance. The analysis uncovered significant insights for the future application of RET. The study revealed that the arguments presented in RET could further emphasize the positive effects of inter-organizational trust on various firm performance metrics while developing globally sustainable marketing channels through Industry 4.0 technologies. This insight is vital for RET, as overall firm performance has been shown to drive financial success and market performance, which is essential for a sustainable distribution channel [56].
Furthermore, the research complemented the traditional rigorous PLS-SEM analysis with NCA, revealing the essential “must-have” role of the marketing channel operational performance construct, even though there was an insignificant relationship between marketing channel operational performance and firm performance (FP). These results indicate that NCA enhances the findings of PLS-SEM by highlighting that both significant and nonsignificant determinants can represent necessary “must-have” conditions. Consequently, the combined use of PLS-SEM and NCA is critical for interpreting the interaction between inter-organizational trust and firm performance, as suggested in prior research [85].

6.2. Managerial Implications

This research presents significant findings by examining the distinct relational pathways among inter-organizational trust, the operational aspects of marketing channels, and overall market and financial performance outcomes. It underscores the crucial role of inter-organizational trust in enhancing various performance metrics, such as operational efficiency and profitability, which, in turn, influence overall sustainability. Specifically, the study indicates that nurturing trust between organizations within the context of global distribution channels can lead to improved collaboration and, consequently, better performance across multiple dimensions.
Establishing reliable communication channels is essential for promoting trust. Industry 4.0 technologies—such as cloud computing, artificial intelligence, and the Internet of Things—facilitate these channels by enabling real-time information sharing and continuous connectivity among distribution channel members. This technological foundation allows organizations to engage in critical resource pooling, share valuable IT assets and capabilities, and jointly manage risks. Through resource pooling and risk sharing, firms can reduce costs and build stronger, more resilient partnerships. Additionally, improving the operational performance of marketing channels requires streamlining processes, enhancing coordination, and leveraging technology. Companies can optimize logistics and inventory management to minimize delays and ensure efficient product distribution. Implementing data-driven decision-making, such as AI and analytics for demand forecasting, can enhance responsiveness to market trends. Strengthening collaboration with partners through clear communication, performance tracking, and continuous improvement initiatives also improves overall efficiency and effectiveness.
Moreover, the research underscores the significance of interpersonal trust as a fundamental component in cultivating strong inter-organizational trust. Trust among employees improves stability and cohesion within the workforce, which is essential for sustaining long-term inter-organizational relationships. Employee stability—referring to low turnover and consistent team members—helps maintain institutional knowledge and strengthens the trust that develops over time. Thus, organizations should prioritize employee retention and consistency in team composition to bolster the trust crucial for successful inter-organizational collaborations. The findings stress that inter-organizational trust, supported by reliable information exchange and personnel stability, is vital for achieving superior market and financial outcomes. Building inter-organizational trust in international marketing channels necessitates transparency, consistency, and cultural awareness. Open and honest communication ensures that all parties receive accurate and timely information, minimizing misunderstandings and promoting cooperation. Well-defined contracts that clarify roles, responsibilities, and expectations provide security, while fair and adaptable agreements facilitate adaptation to changing market conditions.

7. Limitations and Future Research

The research findings are based on respondents from the United States, with a smaller sample from Canada. This geographic concentration suggests limited applicability in other regions, as cultural, economic, and regulatory differences could significantly influence inter-organizational trust and performance dynamics. Future research must explore different geographical contexts to determine whether these findings hold across varied cultural and business environments. By conducting studies in locations beyond North America, researchers could better assess the generalizability and consistency of the findings and identify any context-specific variations.
Furthermore, this study did not focus on any specific industry or sector, which may limit the relevance of its insights for particular fields with unique operational and relational characteristics. Inter-organizational trust dynamics vary significantly depending on industry norms, competitive intensity, and levels of technological adoption. As a result, future research could benefit from exploring these constructs within the context of distinct industries, such as manufacturing, health care, technology, or retail, to uncover potential sector-specific differences. This approach could yield a more in-depth understanding of how inter-organizational trust affects performance in various industry environments and provide practical insights tailored to different sectors. Finally, comparing companies with at least limited experience and no experience in deploying Industry 4.0 technologies would be valuable, as it would bring insights into the perceptual differences between these groups of companies.

8. Conclusions

This research investigates the relationship between inter-organizational trust, marketing channel operations, and marketing performance (MP), as well as their impact on financial performance (FP). Numerous studies have examined the effect of individual constructs, such as marketing channel operational performance, on MP. However, this research addresses a gap in the literature, as few studies thoroughly explore the effects of critical constructs, like inter-organizational trust and marketing channel operational performance, on FP and MP.
In this study, inter-organizational trust significantly impacted the marketing channel operational performance, influencing MP. The NCA emphasized the vital role of the marketing channel operational performance construct, recognizing it as a necessary “must-have” condition for FP despite the absence of a significant direct relationship between this performance and FP.
The study suggests that the propositions outlined in RET can be further expanded to demonstrate that inter-organizational trust positively influences various firm performance metrics, particularly in the development of globally sustainable marketing channels enhanced by Industry 4.0 technologies. Therefore, firms should prioritize their investments in optimizing marketing channel operations and strengthening inter-organizational trust.

Supplementary Materials

The following supporting information can be downloaded at: https://www.mdpi.com/article/10.3390/su17083524/s1, Supplementary file: Correlations (Note. Please see Table 2 for the variable names for shortcuts).

Author Contributions

Conceptualization, M.H.; Validation, M.H.; Data curation, M.H.; Writing—original draft, M.H., J.C.T. and N.N.; Writing—review & editing, M.H. and J.C.T. All authors have read and agreed to the published version of the manuscript.

Funding

This research received no external funding.

Institutional Review Board Statement

Not applicable.

Informed Consent Statement

Not applicable.

Data Availability Statement

The raw data supporting the conclusions of this article will be made available by the authors on request.

Conflicts of Interest

The authors declare no conflict of interest.

Appendix A

The scenarios in interpreting the NCA results.
SettingPLS–SEM ResultsNCA ResultsConclusion
1. Exogenous
construct is
a…
significant
determinant
and a necessary
condition
On average, an increase in the exogenous construct will increase the outcome. However, a certain level of the exogenous construct is necessary for the outcome to manifest.
2. Exogenous
construct is
a…
significant
determinant
but no
necessary
condition
On average, an increase in the exogenous construct will increase the outcome; no minimum level of the construct is needed to ensure that the outcome will manifest.
3. Exogenous
construct is
a…
nonsignificant
determinant
but a necessary
condition
A certain level of the exogenous construct is necessary for the outcome to manifest. However, a further increase is not recommended, as it will not increase the outcome any further.
4. Exogenous
construct is
a…
nonsignificant
determinant
and not a necessary conditionExogenous construct is neither a mus-have nor a should-have factor for the manifest outcome.

Appendix B

NCA ceiling charts.
Sustainability 17 03524 g0a1

References

  1. Choi, T.; Kumar, S.; Yue, X.; Chan, H. Disruptive technologies and operations management in the Industry 4.0 era and beyond. Prod. Oper. Manag. 2022, 31, 9–31. [Google Scholar] [CrossRef]
  2. Beltrami, M.; Orzes, G.; Sarkis, J.; Sartor, M. Industry 4.0 and Sustainability: Towards Conceptualization and Theory; Elsevier Ltd.: Amsterdam, The Netherlands, 2021. [Google Scholar] [CrossRef]
  3. Schwab, K. The Fourth Industrial Revolution; Crown Business: NewYork, NY, USA, 2016. [Google Scholar]
  4. Alcácer, V.; Cruz-Machado, V. Scanning the Industry 4.0: A literature review on technologies for manufacturing systems. Eng. Sci. Technol. Int. J. 2019, 22, 899–919. [Google Scholar] [CrossRef]
  5. Martínez-Olvera, C.; Mora-Vargas, J. A comprehensive framework for the analysis of Industry 4.0 value domains. Sustainability 2019, 11, 2960. [Google Scholar] [CrossRef]
  6. Arromba, I.F.; Martin, P.S.; Cooper Ordoñez, R.; Anholon, R.; Rampasso, I.S.; Santa-Eulalia, L.A.; Martins, V.W.; Quelhas, O.L. Industry 4.0 in the product development process: Benefits, difficulties and its impact in marketing strategies and operations. J. Bus. Ind. Mark. 2021, 36, 522–534. [Google Scholar] [CrossRef]
  7. Ajayi, O.; Bagula, A.; Maluleke, H. The Fourth Industrial Revolution: A Technological Wave of Change. In Industry 4.0-Perspectives and Applications; Gordan, M., Ghaedi, K., Maluleke, H., Eds.; IntechOpen: London, UK, 2023. [Google Scholar] [CrossRef]
  8. Gupta, H.; Kumar, A.; Wasan, P. Industry 4.0, cleaner production and circular economy: An integrative framework for evaluating ethical and sustainable business performance of manufacturing organizations. J. Clean. Prod. 2021, 295, 126253. [Google Scholar] [CrossRef]
  9. Delligatti, J. The Benefits and Challenges of Digital Supply Chain Integration; SDI, The Digital Supply Chain: Bristol, PA, USA, 2024. [Google Scholar]
  10. Saarikko, T.; Westergren, U.H.; Blomquist, T. The Internet of Things: Are you ready for what’s coming? Bus. Horiz. 2017, 60, 667–676. [Google Scholar] [CrossRef]
  11. Shahzad, K.; Hafeez, S. Communication, Leadership and Trust in Organizations, 1st ed.; Paliszkiewicz, J., Cusumano, J.L.G., Eds.; Routledge: New York, NY, USA, 2023; Chapter 5. [Google Scholar] [CrossRef]
  12. Shahzad, K.; Hafeez, S. Digital trust in business ecosystem collaboration. In Trust, Digital Business and Technology; Routledge: New York, NY, USA, 2022; pp. 242–254. [Google Scholar] [CrossRef]
  13. Cygler, J.; Wyka, S. Internal barriers to international R&D cooperation: The case of Polish high-tech firms. Forum Sci. Oeconomia 2019, 7, 25–45. [Google Scholar]
  14. Oláh, J.; Hidayat, Y.A.; Dacko-Pikiewicz, Z.; Hasan, M.; Popp, J. Inter-organizational trust on financial performance: Proposing innovation as a mediating variable to sustain in a disruptive era. Sustainability 2021, 13, 9947. [Google Scholar] [CrossRef]
  15. Patil, K.; Garg, V.; Gabaldon, J.; Patil, H.; Niranjan, S.; Hawkins, T. Firm performance in digitally integrated supply chains: A combined perspective of transaction cost economics and relational exchange theory. J. Enterp. Inf. Manag. 2024, 37, 381–413. [Google Scholar] [CrossRef]
  16. Kittur, P.; Agarwal, S. Cultural bridges in business: Critical review and future directions in cross-cultural B2B relationships. J. Bus. Res. 2024, 180, 114721. [Google Scholar] [CrossRef]
  17. Ketokivi, M.; Mahoney, J.T. Transaction Cost Economics As a Theory of Supply Chain Efficiency. Prod. Oper. Manag. 2020, 29, 1011–1031. [Google Scholar] [CrossRef]
  18. Nosalska, K.; Mazurek, G. Marketing principles for Industry 4.0—A conceptual framework. Eng. Manag. Prod. Serv. 2019, 11, 9–20. [Google Scholar] [CrossRef]
  19. Daviy, A.O.; Paklina, S.N.; Prokofyeva, A.S. Digital manufacturing: New challenges for marketing and business models. Russ. Manag. J. 2017, 15, 537–552. [Google Scholar] [CrossRef]
  20. Mazurek, G. Transformacja Cyfrowa-Perspektywa Marketingu; Wydawnictwo Naukowe PWN: Warsaw, Poland, 2019. [Google Scholar]
  21. Bowen, F.E.; Rostami, M.; Steel, P. Timing is everything: A meta-analysis of the relationships between organizational performance and innovation. J. Bus. Res. 2010, 63, 1179–1185. [Google Scholar] [CrossRef]
  22. Rosenbusch, N.; Brinckmann, J.; Bausch, A. Is innovation always beneficial? A meta-analysis of the relationship between innovation and performance in SMEs. J. Bus. Ventur. 2011, 26, 441–457. [Google Scholar] [CrossRef]
  23. Brozzi, R.; Forti, D.; Rauch, E.; Matt, D.T. The advantages of Industry 4.0 applications for sustainability: Results from a sample of manufacturing companies. Sustainability 2020, 12, 3647. [Google Scholar] [CrossRef]
  24. Ghobakhloo, M. Industry 4.0, digitization, and opportunities for sustainability. J. Clean. Prod. 2020, 252, 119869. [Google Scholar] [CrossRef]
  25. Li, Y.; Dai, J.; Cui, L. The impact of digital technologies on economic and environmental performance in the context of industry 4.0: A moderated mediation model. Int. J. Prod. Econ. 2020, 229, 107777. [Google Scholar] [CrossRef]
  26. Tiwari, K.; Khan, M.S. Sustainability accounting and reporting in the industry 4.0. J. Clean. Prod. 2020, 258, 120783. [Google Scholar] [CrossRef]
  27. Kamble, S.S.; Gunasekaran, A.; Gawankar, S.A. Sustainable Industry 4.0 framework: A systematic literature review identifying the current trends and future perspectives. Process Saf. Environ. Prot. 2018, 117, 408–425. [Google Scholar] [CrossRef]
  28. Mumtaz, U.; Ali, Y.; Petrillo, A. A linear regression approach to evaluate the green supply chain management impact on industrial organizational performance. Sci. Total Environ. 2018, 624, 162–169. [Google Scholar] [CrossRef] [PubMed]
  29. Yong, J.Y.; Yusliza, M.; Ramayah, T.; Jabbour, C.J.C.; Sehnem, S.; Mani, V. Pathways towards sustainability in manufacturing organizations: Empirical evidence on the role of green human resource management. Bus. Strategy Environ. 2020, 29, 212–228. [Google Scholar] [CrossRef]
  30. Umar, M.; Khan, S.A.R.; Yusliza, M.Y.; Ali, S.; Yu, Z. Industry 4.0 and green supply chain practices: An empirical study. Int. J. Product. Perform. Manag. 2022, 71, 814–832. [Google Scholar] [CrossRef]
  31. Pero, M.; Lamberti, L. The supply chain management-marketing interface in product development. Bus. Process Manag. J. 2013, 19, 217–244. [Google Scholar] [CrossRef]
  32. Amar, J.; Yeon, H. Customers’ Lives Are Digital—But is Your Customer Care Still Analog? McKinsey & Company: Chicago, IL, USA, 2017. [Google Scholar]
  33. Ardito, L.; Petruzzelli, A.M.; Panniello, U.; Garavelli, A.C. Towards Industry 4.0. Bus. Process Manag. J. 2019, 25, 323–346. [Google Scholar] [CrossRef]
  34. Bal, H.Ç.; Erkan, Ç. Industry 4.0 and Competitiveness. Procedia Comput. Sci. 2019, 158, 625–631. [Google Scholar] [CrossRef]
  35. Rajamanickam, M.; Nirmala, E.; Royan, J.G.; Ramaswamy, G.; Rajendran, M.; Vadivelu, V. Fourth Industrial Revolution: Industry 4.0. In Integration of Mechanical and Manufacturing Engineering with IoT: A Digital Transformation; Rajasekar, R., Moganapriya, C., Kumar, P.S., Kumar, M.H., Eds.; Wiley: Hoboken, NJ, USA, 2023; pp. 41–84. [Google Scholar]
  36. Ashraf, N.; Siddiqui, D.A. The effect of service customization on customer loyalty towards mobile network operator in Pakistan: The mediatory role of perceived quality, value, customer satisfaction, and trust. SSRN Electron. J. 2020, 39, 2140–2154. [Google Scholar] [CrossRef]
  37. Turner, F.; Merle, A.; Gotteland, D. Enhancing consumer value of the co-design experience in mass customization. J. Bus. Res. 2020, 117, 473–483. [Google Scholar] [CrossRef]
  38. Gillani, F.; Chatha, K.A.; Jajja, M.S.S.; Farooq, S. Implementation of digital manufacturing technologies: Antecedents and consequences. Int. J. Prod. Econ. 2020, 229, 107748. [Google Scholar] [CrossRef]
  39. Rekettye, G.; Rekettye, G., Jr. The changing role of customer experience in the age of Industry 4.0. Mark. Menedzsment 2020, 54, 17–27. [Google Scholar] [CrossRef]
  40. Mittal, A.; Sachan, S.; Kumar, V.; Vardhan, S.; Verma, P.; Kaswan, M.S.; Garza-Reyes, J.A. Essential organizational variables for the implementation of Quality 4.0: Empirical evidence from the Indian furniture industry. TQM J. 2024, 36, 1550–1568. [Google Scholar] [CrossRef]
  41. Raj, R.; Kumar, V.; Sharma, N.K.; Verma, P. Industry 4.0 readiness: The impact of effective implementation of I4.0 on marketing performance. J. Bus. Ind. Mark. 2024, 39, 2140–2154. [Google Scholar] [CrossRef]
  42. Wang, M.; Zhao, D.; Gu, F.F. Distributors’ customer-driving capability under supplier encroachment. Ind. Mark. Manag. 2021, 94, 52–65. [Google Scholar] [CrossRef]
  43. Cabrilo, S.; Dahms, S. How strategic knowledge management drives intellectual capital to superior innovation and market performance. J. Knowl. Manag. 2018, 22, 621–648. [Google Scholar] [CrossRef]
  44. Gangwani, K.K.; Bhatia, M.S. The effect of market orientation and technology orientation on industry 4.0 technologies and market performance: Role of innovation capability. Ind. Mark. Manag. 2024, 118, 231–241. [Google Scholar] [CrossRef]
  45. Villena, V.H.; Choi, T.Y.; Revilla, E. Revisiting inter-organizational trust: Is more always better or could more be worse? J. Manag. 2019, 45, 752–785. [Google Scholar] [CrossRef]
  46. Bruneel, J.; Spithoven, A.; Clarysse, B. Interorganizational trust and technology complexity: Evidence for new technology-based firms. J. Small Bus. Manag. 2017, 55, 256–274. [Google Scholar] [CrossRef]
  47. Bryan Jean, R.; Sinkovics, R.; Hiebaum, T.P. The effects of supplier involvement and knowledge protection on product innovation in customer-supplier relationships: A study of global automotive suppliers in China. J. Prod. Innov. Manag. 2014, 31, 98–113. [Google Scholar] [CrossRef]
  48. Lau, E.; Rowlinson, S. Interpersonal trust and inter-firm trust in construction projects. Constr. Manag. Econ. 2009, 27, 539–554. [Google Scholar] [CrossRef]
  49. Seppänen, R.; Blomqvist, K.; Sundqvist, S. Measuring inter-organizational trust—A critical review of the empirical research in 1990–2003. Ind. Mark. Manag. 2007, 36, 249–265. [Google Scholar] [CrossRef]
  50. Claro, D.P.; Hagelaar, G.; Omta, O. The determinants of relational governance and performance: How to manage business relationships? Ind. Mark. Manag. 2003, 32, 703–716. [Google Scholar] [CrossRef]
  51. Söderlund, M.; Julander, C.-R. The variable nature of services: An empirical examination of trust and its effects on customers’ satisfaction responses to poor and good service. Total Qual. Manag. Bus. Excell. 2003, 14, 291–304. [Google Scholar] [CrossRef]
  52. Yu, Q.; Cuypers, I.R.P.; Wang, H. A tale of two signals: Partner CSR versus CSI and alliance formation. Acad. Manag. J. 2025, 68, 138–161. [Google Scholar] [CrossRef]
  53. Yang, Z.; Jia, F.; Cai, S. The performance implications of perceptual differences of dependence in marketing channels. Asia Pac. J. Mark. Logist. 2014, 26, 344–364. [Google Scholar] [CrossRef]
  54. Lumineau, F.; Jin, J.L.; Sheng, S.; Zhou, K.Z. Asset specificity asymmetry and supplier opportunism in buyer–supplier exchanges. J. Bus. Res. 2022, 149, 85–100. [Google Scholar] [CrossRef]
  55. Dyer, J.H.; Singh, H. The relational view: Cooperative strategy and sources of inter-organizational competitive advantage. Acad. Manag. Rev. 1998, 23, 660. [Google Scholar] [CrossRef]
  56. Fiala, R.; Prokop, M.; Živělová, I. The relationship between inter-organizational trust and performance. Acta Univ. Agric. Et Silvic. Mendel. Brun. 2013, 60, 89–98. [Google Scholar] [CrossRef]
  57. Poppo, L.; Zhou, K.Z.; Li, J.J. When can you trust ‘trust’? Calculative trust, relational trust, and supplier performance. Strateg. Manag. J. 2016, 37, 724–741. [Google Scholar] [CrossRef]
  58. Zhou, K.Z.; Zhang, Q.; Sheng, S.; Xie, E.; Bao, Y. Are relational ties always good for knowledge acquisition? Buyer–supplier exchanges in China. J. Oper. Manag. 2014, 32, 88–98. [Google Scholar] [CrossRef]
  59. Safari, A.; Albaum, G. Transactional or relational exchange theory in B2C marketing: An agenda for a different type of relational exchange theory. J. Cust. Behav. 2019, 18, 87–100. [Google Scholar] [CrossRef]
  60. Gulati, R.; Sytch, M. Dependence asymmetry and joint dependence in inter-organizational relationships: Effects of embeddedness on a manufacturer’s performance in procurement relationships. Adm. Sci. Q. 2007, 52, 32–69. [Google Scholar] [CrossRef]
  61. Rai, A.; Patnayakuni, R.; Seth, N. Firm performance impacts of digitally enabled supply chain integration capabilities. MIS Q. 2006, 30, 225. [Google Scholar] [CrossRef]
  62. Krause, D.R.; Handfield, R.B.; Tyler, B.B. The relationships between supplier development, commitment, social capital accumulation and performance improvement. J. Oper. Manag. 2007, 25, 528–545. [Google Scholar] [CrossRef]
  63. Zhao, X.; Huo, B.; Selen, W.; Yeung, J.H.Y. The impact of internal integration and relationship commitment on external integration. J. Oper. Manag. 2011, 29, 17–32. [Google Scholar] [CrossRef]
  64. Williamson, O.E. Markets and Hierarchies: Analysis and Antitrust Implications: A Study in the Economics of Internal Organization; University of Illinois at Urbana-Champaign’s: Champaign, IL, USA, 1975. [Google Scholar]
  65. Dyer, J.H.; Chu, W. The determinants of trust in supplier–automaker relationships in the US, Japan, and Korea. J. Int. Bus. Stud. 2011, 42, 10–27. [Google Scholar] [CrossRef]
  66. Gligor, D.M.; Esmark, C.L.; Holcomb, M.C. Performance outcomes of supply chain agility: When should you be agile? J. Oper. Manag. 2015, 33–34, 71–82. [Google Scholar] [CrossRef]
  67. Wong, C.W.Y.; Lai, K.; Cheng, T.C.E.; Lun, Y.H.V. The role of IT-enabled collaborative decision making in inter-organizational information integration to improve customer service performance. Int. J. Prod. Econ. 2015, 159, 56–65. [Google Scholar] [CrossRef]
  68. Khan, K.A.; Çera, G.; Netek, V. Perception of the selected business environment aspects by service firms. J. Tour. Serv. 2019, 10, 111–127. [Google Scholar] [CrossRef]
  69. Gök, O.; Peker, S. Understanding the links among innovation performance, market performance and financial performance. Rev. Manag. Sci. 2017, 11, 605–631. [Google Scholar] [CrossRef]
  70. Kwak, D.-W.; Seo, Y.-J.; Mason, R. Investigating the relationship between supply chain innovation, risk management capabilities and competitive advantage in global supply chains. Int. J. Oper. Prod. Manag. 2018, 38, 2–21. [Google Scholar] [CrossRef]
  71. Gligor, D.; Gligor, N.; Maloni, M. The impact of the supplier’s market orientation on the customer market orientation-performance relationship. Int. J. Prod. Econ. 2019, 216, 81–93. [Google Scholar] [CrossRef]
  72. Na, Y.K.; Kang, S.; Jeong, H.Y. The effect of market orientation on performance of sharing economy business: Focusing on marketing innovation and sustainable competitive Advantage. Sustainability 2019, 11, 729. [Google Scholar] [CrossRef]
  73. Aldakhil, A.M.; Aamir, A.; Nassani, A.A.; Askar, S.E. Exploring the nexus between the market orientation, market performance and financial performance of manufacturing firms in KSA: Does the supply chain strategy matter? Rev. Argent. Clínica Psicológica 2020, 29, 652–663. [Google Scholar]
  74. Laari, S.; Töyli, J.; Ojala, L. The effect of a competitive strategy and green supply chain management on the financial and environmental performance of logistics service providers. Bus. Strategy Environ. 2018, 27, 872–883. [Google Scholar] [CrossRef]
  75. Esparza, O. The Benefits of Industry 4.0 for Small and Medium-Sized Enterprises. Available online: https://www.linkedin.com/pulse/benefits-industry-40-small-medium-sized-enterprises-oscar-esparza/ (accessed on 15 February 2025).
  76. BDO. Industry 4.0: Redefining How Mid-Market Manufacturers Derive and Deliver Value. Available online: https://www.bdo.com/insights/industries/industry-4-0/industry-4-0-redefining-how-midmarket-manufacturers-derive-and-deliver-value# (accessed on 29 May 2024).
  77. Soper, D. Post-hoc Statistical Power Calculator for Multiple Regression. Available online: http://www.danielsoper.com/statcalc (accessed on 15 February 2025).
  78. Bahrami, M.; Shokouhyar, S. The role of big data analytics capabilities in bolstering supply chain resilience and firm performance: A dynamic capability view. Inf. Technol. People 2022, 35, 1621–1651. [Google Scholar] [CrossRef]
  79. Liu, X.; Singh, P.V.; Srinivasan, K. A structured analysis of unstructured big data by leveraging cloud computing. Mark. Sci. 2016, 35, 363–388. [Google Scholar] [CrossRef]
  80. Ren, S.J.-F.; Wamba, S.F.; Akter, S.; Dubey, R. Modelling quality dynamics, S.J.C., business value and firm performance in a big data analytics environment. Int. J. Prod. Res. 2017, 55, 5011–5026. [Google Scholar] [CrossRef]
  81. Zaheer, A.; McEvily, B.; Perrone, V. Does trust matter? Exploring the effects of inter-organizational and interpersonal trust on performance. Organ. Sci. 1998, 9, 141–159. [Google Scholar] [CrossRef]
  82. Hair, J.F.; Hult, G.T.; Ringle, C.; Sarstedt, M. A Primer on Partial Least Squares Structural Equation Modeling (PLS-SEM), 2nd ed.; Sage: Los Angeles, CA, USA, 2022. [Google Scholar]
  83. Lowry, P.B.; Gaskin, J. Partial Least Squares (PLS) Structural Equation Modelling (SEM) for building and testing behavioural causal theory: When to choose it and how to use it. IEEE Trans. Prof. Commun. 2014, 57, 123–146. [Google Scholar] [CrossRef]
  84. Ringle, C.M.; Sarstedt, M.; Mitchell, R.; Gudergan, S.P. Partial least squares structural equation modeling in HRM research. Int. J. Hum. Resour. Manag. 2020, 31, 1617–1643. [Google Scholar] [CrossRef]
  85. Richter, N.F.; Schubring, S.; Hauff, S.; Ringle, C.M.; Sarstedt, M. When predictors of outcomes are necessary: Guidelines for the combined use of PLS-SEM and NCA. Ind. Manag. Data Syst. 2020, 120, 2243–2267. [Google Scholar] [CrossRef]
  86. Dul, J. Necessary Condition Analysis (NCA). Organ. Res. Methods 2016, 19, 10–52. [Google Scholar] [CrossRef]
  87. Sukhov, A.; Lättman, K.; Olsson, L.E.; Friman, M.; Fujii, S. Assessing travel satisfaction in public transport: A configurational approach. Transp. Res. D Transp. Environ. 2021, 93, 102732. [Google Scholar] [CrossRef]
  88. Cochran, W.G. Sampling Techniques; John Wiley & Sons: New York, NY, USA, 1977. [Google Scholar]
  89. Grande, T. Identifying Multivariate Outliers with Mahalanobis Distance in SPSS. Available online: https://www.youtube.com/watch?v=AXLAX6r5JgE (accessed on 15 February 2025).
  90. Hair, J.F.; Black, W.C.; Babin, B.J.; Anderson, R.E. Multivariate Data Analysis. In Always Learning; Pearson Education Limited: London, UK, 2013; Available online: https://books.google.ca/books?id=VvXZnQEACAAJ (accessed on 15 February 2025).
  91. Henseler, J.; Ringle, C.M.; Sarstedt, M. A new criterion for assessing discriminant validity in variance-based structural equation modeling. J. Acad. Mark. Sci. 2015, 43, 115–135. [Google Scholar] [CrossRef]
  92. Hair, J.F.; Ringle, C.M.; Sarstedt, M. PLS-SEM: Indeed a silver bullet. J. Mark. Theory Pract. 2011, 19, 139–152. [Google Scholar] [CrossRef]
  93. Geisser, S. The predictive sample reuse method with applications. J. Am. Stat. Assoc. 1975, 70, 320–328. [Google Scholar] [CrossRef]
  94. Stone, M. Cross-validatory choice and assessment of statistical predictions (with discussion). J. R. Stat. Soc. Ser. B 1976, 38, 102. [Google Scholar] [CrossRef]
  95. Chin, W.W. Commentary: Issues and opinions on Structural Equation Modelling. MIS Q. 1998, 22, vii–xvi. [Google Scholar]
  96. Hair, J.F.; Howard, M.C.; Nitzl, C. Assessing measurement model quality in PLS-SEM using confirmatory composite analysis. J. Bus. Res. 2020, 109, 101–110. [Google Scholar] [CrossRef]
  97. Sullivan, G.M.; Feinn, R. Using effect size—Or why the P value is not enough. J. Grad. Med. Educ. 2012, 4, 279–282. [Google Scholar] [CrossRef]
  98. Cohen, J. Things I have learned (so far). Am. Psychol. 1990, 45, 1304–1312. [Google Scholar] [CrossRef]
  99. Klein, G.A. A Recognition-Primed Decision (RPD) Model of Rapid Decision Making. In Decision-Making in Action: Model and Methods; Klein, G.A., Orasanu, J., Calderwood, R., Zsambok, C.E., Eds.; Ablex Publishing Compnay: Norwood, OH, USA, 1993; pp. 138–147. [Google Scholar]
  100. Hauff, S.; Richter, N.F.; Sarstedt, M.; Ringle, C.M. Importance and performance in PLS-SEM and NCA: Introducing the combined importance-performance map analysis (cIPMA). J. Retail. Consum. Serv. 2024, 78, 103723. [Google Scholar] [CrossRef]
  101. Mubarak, M.F.; Petraite, M. Industry 4.0 technologies, digital trust and technological orientation: What matters in open innovation? Technol. Forecast. Soc. Change 2020, 161, 120332. [Google Scholar] [CrossRef]
  102. Kostopoulos, K.; Papalexandris, A.; Papachroni, M.; Ioannou, G. Absorptive capacity, innovation, and financial performance. J. Bus. Res. 2011, 64, 1335–1343. [Google Scholar] [CrossRef]
  103. Bai, J.; Su, J.; Xin, Z.; Wang, C. Calculative trust, relational trust, and organizational performance: A meta-analytic structural equation modeling approach. J. Bus. Res. 2024, 172, 114435. [Google Scholar] [CrossRef]
Figure 1. The structural model for the study.
Sustainability 17 03524 g001
Table 1. Industry 4.0 technologies deployment stage in the companies of the respondents.
Qualification Criteria#QuestionOriginal Sample (N = 944)%Final Sample (N = 131)
Global vs. domestic1Not involved in global value chain activities.81386.1
Respondent’s affiliation1Other than 1. Marketing, business development, and sales, 2. Distribution or 3. Operations.
Firm size1Less than 400 employees.
Deployment stage of Industry 4.0 technologies1Unaware of any marketing analytics applications.
2Aware of the Industry 4.0 technologies.
3Knowledge of the Industry 4.0 technologies, but have not yet evaluated any.
4Evaluation of the potential of the Industry 4.0 technologies.
5Limited deployment of the Industry 4.0 technologies.424.532.1%
6General deployment of Industry 4.0 technologies indicates a wide impact on critical business processes.576.043.5%
7Mature deployment for a longer period of time with legacy support.323.424.4%
Table 2. Measurement of the target constructs.
ConstructIndicator VariableSource
Financial performance
(CA = 0.928,
CR = 0.946,
AVE = 0.777)
  • Over the past couple of years, our firm’s financial performance has been outstanding (FP1).
[78,79]
  • Over the past couple of years, our firm’s financial performance has exceeded the competitor’s performance (FP2).
  • Over the past couple of years, our firm’s sales growth has been outstanding (FP3).
  • Over the past couple of years, our firm’s profitability has been higher than our competitors’ profitability (FP4).
  • Over the past couple of years, our firm’s sales growth exceeded the competitor’s (FP5).
Market performance
(CA = 0.858,
CR = 0.904,
AVE = 0.703)
  • Our quicker entry to new markets (MP1).
[80]
  • Our faster introduction of new products or services to the market (MP2).
  • Our success rate of new products or services has been higher than our competitors (MP3).
  • Our higher market share (MP4).
Marketing channel operational performance
(CA = 0.849,
CR = 0.892,
AVE = 0.630)
  • Our delivery cycle times are good (MCOP1)
[78,79]
  • Our manufacturing cycle times are good (MCOP2)
  • Our missing/wrong/damaged/defective products shipped are at a low level (MCOP3)
  • Our on-time delivery time performance is good (MCOP4)
  • Our warranty/returns processing costs are at a low level (MCOP5)
Inter-organizational trust
(CA = 0.718,
CR = 0.875,
AVE = 0.778)
  • Our distributors have always been evenhanded in their negotiations with us (TRU1).
[81]
  • Our distributors may use opportunities that arise to profit at our expense (TRU2).
  • Based on experience, we cannot confidently rely on our distributors to keep promises made to us (TRU3).
  • We are hesitant to transact with our distributors when the specifications are vague (TRU4).
  • Our distributors are trustworthy (TRU5).
Table 3. Description of the sample (N = 131).
#Country of Residence N (%) Years With the OrganizationN (%)
1Canada19 (14.5%)1Less than a year5 (3.8%)
2United States111 (84.7%)22–5 years35 (26.7%)
3Other1 (0.8%)36–10 years36 (27.5%)
Age groupN (%)411–15 years25 (19.1%)
119–243 (2.3%)516–19 years12 (9.2%)
225–288 (6.1%)6Over 20 years18 (13.7%)
329–3419 (14.5%) EducationN (%)
435–4027 (20.6%)1High school or less18 (13.7%)
541–4511 (8.4%)2Some college–no degree30 (22.9%)
646–5415 (11.5%)3College diploma4 (3.1%)
755–6439 (29.8%)4Associate18 (13.7%)
8+659 (6.9%)5Bachelor’s44 (33.6%)
6Master’s13 (9.9%)
7Doctorate4 (3.1%)
8Other0 (0.0%)
Table 4. Mean values, standard deviations, and normality of the data with z-scores for skewness and kurtosis.
ConstructVariable *)MeanStd. Dev.SkewnessKurtosisKolmogorov–Smirnov **)Sign.Shapiro–WilkSign.
Financial performanceFP14.040.98−1.0241.0090.225<0.0010.819<0.001
FP24.081.01−1.1711.3390.233<0.0010.800<0.001
FP33.931.03−0.9280.6210.229<0.0010.838<0.001
FP44.010.97−0.9550.9870.222<0.0010.825<0.001
FP53.981.00−1.0010.8140.247<0.0010.830<0.001
Market performanceMP13.910.90−0.529−0.1170.235<0.0010.862<0.001
MP24.190.88−1.0070.7450.257<0.0010.802<0.001
MP34.150.85−0.685−0.3080.246<0.0010.818<0.001
MP44.010.95−0.8940.7480.230<0.0010.834<0.001
Marketing channel operational performanceMCOP14.240.86−1.1591.2460.268<0.0010.783<0.001
MCOP24.190.96−1.2361.3560.273<0.0010.781<0.001
MCOP33.981.07−0.9090.1910.227<0.0010.830<0.001
MCOP44.290.90−1.1900.9120.312<0.0010.761<0.001
MCOP53.951.08−1.0230.6190.234<0.0010.825<0.001
Inter-organizational trustTRU13.730.98−0.6010.2690.226<0.0010.873<0.001
TRU23.461.04−0.095−0.5170.227<0.0010.893<0.001
TRU32.961.290.138−1.0440.177<0.0010.905<0.001
TRU43.451.21−0.398−0.6430.171<0.0010.894<0.001
TRU54.180.87−1.0861.100.248<0.0010.797<0.001
*) See Table 2 for the shortcuts. **) With a Lilliefors significance correction.
Table 5. Discriminant validity assessment.
RelationshipHTMT2.5%97.5%
MP ↔ FP0.7880.6230.907
Marketing channel operational performance ↔ FP0.6880.5550.794
Marketing channel operational performance ↔ MP0.7250.5720.850
Inter-organanizational trust ↔ FP0.7840.6050.906
Inter-organanizational trust ↔ MP0.7480.5730.886
Inter-organanizational trust ↔ Marketing channel operational performance0.7450.5220.935
Table 6. Predictive power and relevance.
ConstructQ2PredictRMSEMAE
FP0.9750.6550.492
MP0.9790.6020.460
Marketing channel operational performance0.9780.6250.444
Table 7. The significance of the path coefficients and effect sizes.
HRelationshipPath Coeffi-cient5% Bootstrapping Confidence IntervalsEffect Size (f2)Effect Size DescriptorTotal Effect **)Indirect Effect
2.5%97.5%
1Marketing channel operational performance → MP0.4370.2640.6410.258Large to medium0.437-
2Inter-organizational trust → Marketing channel operational performance0.5710.4110.6620.551Large0.571-
3Inter-organizational trust → MP0.3030.1260.4550.135Medium to small0.5520.250 *)
4Inter-organizational trust → FP0.2980.0780.5070.114Medium to small0.6890.391 *)
5MP → FP0.4410.1940.6870.192Medium to large0.441-
6Marketing channel operational performance → FP0.258−0.0290.5020.071Small to medium0.4500.193 *)
*) Indicates significance at 0.01 level. **) Indicates significance at 0.001 level.
Table 8. Specific indirect effects.
RelationshipSpecific Indirect Effectp-Value
Marketing channel operational performance → MP → FP0.1930.006
Inter-organizational trust → Marketing channel operational performance → FP0.1470.058
Inter-organizational trust → Marketing channel operational performance → MP → FP0.1100.020
Inter-organizational trust MP → FP0.1330.028
Inter-organizational trust → Marketing channel operational performance → MP0.2500.001
Table 9. Bottleneck table—CE-FDH (values).
FP (%)FPMPMarketing Channel Operational PerformanceInter-Organizational Trust
30%2.20NNNNNN
40%2.60NN2.00NN
50%3.00NN2.00NN
60%3.40NN2.002.40
70%3.80NN2.003.00
80%4.20NN3.503.00
90%4.60NN3.503.00
100%5.004.003.503.20
Note: NN = Not Necessary.
Table 10. NCA effect sizes and their permutation significance.
ConstructCR-FDH Effect Size (d)Permutation p-ValueEffect Size Descriptor on the Marketing Agility
MP0.0330.069Small
Marketing channel operational performance0.1680.001Medium
Inter-organizational trust0.1450.000Medium
Table 11. The scenarios in the interpretation of the NCA results.
SettingPLS–SEM ResultsNCA ResultsConclusionConclusion
1. MP construct is
a…
significant
determinant
but no
necessary
condition
On average, an increase in the MP construct will increase the FP; no minimum level of MP is needed to ensure that the FP will manifest.Should have!
2. Marketing channel operational performance construct is a…non-significant
determinant
and a necessary
condition
A certain level of the marketing channel operational performance construct is necessary for the FP to manifest. However, a further increase is not recommended, as it will not increase the FP any further.Must have!
2. Inter-organizational trust
construct is
a…
significant
determinant
and a necessary
condition
On average, increasing inter-organizational trust will increase FP. However, a certain level of the inter-organizational trust construct is necessary for FP to manifest.Must have!
Disclaimer/Publisher’s Note: The statements, opinions and data contained in all publications are solely those of the individual author(s) and contributor(s) and not of MDPI and/or the editor(s). MDPI and/or the editor(s) disclaim responsibility for any injury to people or property resulting from any ideas, methods, instructions or products referred to in the content.

