1. Introduction
The sustainability of the agricultural ecosystem has attracted more attention worldwide due to rapid population growth and the limitation of land resources [
1]. Studies indicate that developing countries, especially Jordan, confront escalating food security risks, particularly with wheat production, which is an essential part of the Jordanian diet and a vital component of the national food basket [
2]. Recently, researchers have focused on researching how to create wheat varieties resistant to drought and temperature effects [
3]. Several studies have also investigated the impact of climate change in some Arab countries, such as rising temperatures and water shortages, on wheat production [
4]. Researchers have also focused on monitoring wheat growth, improving harvest schedules, and developing storage practices using remote sensing techniques. Researchers have also focused on urging advanced irrigation systems, fertilization, and harvesting methods to increase wheat production by enhancing agricultural management practices [
5] and conducting a group of important research on breeding high-yielding, disease-resistant wheat ranges [
6]. Recent studies include introducing sprouted wheat into Arabic bread to improve its nutritional value and examining the effects of sprouted wheat on bread quality [
7].
In Jordan, many factors affect wheat production. Climate change, which is characterized by low rainfall levels, drought, high temperatures, and fast population growth, has significantly strained local wheat production [
8,
9]. Additionally, urban expansion and the degradation of agricultural land have further reduced the area available for wheat cultivation, thus increasing Jordan’s dependence on wheat imports [
10]. It is estimated that Jordan imports approximately (97%) of its wheat needs, adding pressure to the national economy and posing risks to food security. To achieve self-sufficiency, Jordan would need to cultivate around (4) million dunums of wheat. However, the greater importance of the obstacles to the availability of water resources was highlighted in the study titled Unpacking the Discourse of Water Scarcity in Jordan” by [
11], which delves into the intricate narratives surrounding water scarcity in Jordan, uncovering how these discourses influence perceptions and policy decisions regarding water management. Also, the study identifies two primary narratives that dominate the water scarcity discourse: water insufficiency and water mismanagement. The water insufficiency narrative attributes the crisis primarily to natural limitations, such as low precipitation, compounded by factors like population growth due to immigration, the influx of refugees, and climate change. Meanwhile, this perspective is propagated mainly by governmental entities, which advocate for supply-side solutions such as large infrastructure projects to address perceived deficiencies [
12].
Conversely, Ref. [
13] focused on Jordan’s present water security situation and delineated necessary policies and programs to achieve a more robust and resilient water sector. While acknowledging Jordan’s progress in securing various components of its water sector system, it also recognizes that certain components require further attention and strengthening. A central point of this discussion is the critical need for increasing available water resources to enhance Jordan’s water security. The text identifies seawater desalination at Aqaba, under sole Jordanian sovereignty, as the most vital issue. This approach is seen as crucial for achieving the following objectives: 1—improving the security of providing additional water; 2—releasing overexploited aquifers and preventing their depletion and quality deterioration; 3—enabling the introduction of new industries to Jordan; 4—de-sharpening conflicts over shared water resources with Jordan’s neighboring countries and potentially transforming these conflicts from social, economic, human, environmental, and political issues into a problem of royalty on water resources; 5—enhancing Jordan’s resilience to climate change. This study also calls for prioritizing resource development, infrastructure protection, water quality management, and technological advancements to secure the nation’s sustainable and resilient water future.
According to [
14], Jordan faces a multifaceted water crisis characterized by a widening gap between water demand and supply, unsustainable resource use, and unpredictable transboundary flows. Climate change, regional conflict, and population growth exacerbate these challenges. The main crisis could be fundamentally rooted in Jordan’s political structure and governance deficits. Also, the analysis of Jordan’s water reforms over the past two decades reveals a persistent inability to achieve stated goals. This can be attributed to the pervasive influence of a “shadow state”—a network of powerful elites embedded in the political system. This group manipulates policies and controls resources, including water, often to the detriment of broader national interests.
Ultimately, to move beyond purely technical solutions to Jordan’s water crisis through a critical examination of the political and governance context, recognizing that meaningful and sustainable water security will depend on tackling deeply entrenched power structures and fostering genuine reform.
Data collected from national institutions reveal variations in population growth rates and wheat production levels across different Jordanian governorates from 1995 to 2022. For instance, Amman experienced a high population growth rate between 1994 and 2004, which is 4.07% annually [
15], leading to a decrease in wheat production from 4882.3 to 1192.2 tons. Meanwhile, the Balqa Governorate recorded a lower population growth rate (0.05). However, its wheat production dropped significantly from 3134.6 to 577.6 tons. It is essential for countries with limited arable land to develop sustainable agricultural policies and to carry out product-based land suitability assessments [
16]. Therefore, climatic changes already observed on a global scale constitute a great source of uncertainty in the economic sector related to crops [
17]. These changes indicate a complex relationship between population growth and wheat production; this necessitates an in-depth analysis of population growth trends, climate factors, and agricultural practices [
18], as these strongly affect wheat production. Although drought- and heat-resistant wheat varieties have been developed, challenges persist. This reflects the multifactor dependability of wheat production. This study seeks to analyze the spatial impact of climate change on wheat production using Geographic Information Systems (GIS) to identify the most affected regions and suggest practical solutions [
19].
Jordan’s food security is currently experiencing significant challenges, particularly geopolitical instability and conflicts in surrounding areas. These conflicts severely impact supply chains, including the availability of imported wheat. The Jordanian government’s limited economic resources decline its ability to invest in modern agricultural technological methods that could enrich wheat production efficiency [
20]. In addition, spreading awareness about sustainable farming practices is necessary to encourage farmers to use techniques that improve soil fertility and save water. In this context, the cooperation between the public and private sectors can be effective in terms of resources and experience to support local farmers effectively [
21]. Against this backdrop, this study focuses on assessing the impact of rapid population growth and climate change on wheat production in Jordan using GIS techniques.
3. Analyses and Results
The main role wheat production plays in the study as a principal agricultural activity was found to be essential in research. The history and destiny of wheat in this region would be incomplete without considering how much it has been affected by climatic changes and changing population patterns. Therefore, one should not be surprised when they hear that there has been a call for strategies to be developed to improve wheat production so that food security can be ensured in that location. The results revealed varying trends regarding wheat output during this period under review, which may have significant implications on the workability of existing policies intended to ensure a constant supply of food crops throughout different parts of the country. because little has been accomplished so far in addressing these challenges. The authors deduced the following from analyzing all these data sources.
Wheat production in the study area underwent significant fluctuations during the study period. Between 1995 and 2013, production decreased substantially by approximately 30,976.7 tons, representing a drop from 50.9% of the total agricultural output in 1995 to 21.9% in 2013, eventually reaching 23,371.5 tons (a reduction of 29%). By 2022, the decline in wheat production amounted to 34.2%, representing a 36,489.5-ton decrease from the reference year of 1995. Between 2004 and 2013, however, there was a slight growth increase of 12,223.3 tons (11.5%). Conversely, this was followed by a significant reduction of 5512.8 tons (5.2%) between 2013 and 2022. Therefore, these annual output fluctuations indicate that wheat has been affected by different environmental and human factors in various years. The study uncovered substantial fluctuations in wheat production levels during the study period. In 1995, production stood at approximately 54,348.2 tons, decreasing by 79.48% to 11,148.2 tons in 2004. Production then rose by 109.64% in 2013 compared to 2004, reaching 23,371.5 tons, but decreased again by 23.58% in 2022, amounting to 17,858.7 tons, as shown in
Table 1.
There were results that showed that the output reduced by 43, 200 tons from 1995 to 2004, rose by 12,223 tons from 2004 to 2013, and later declined by 5, 512 tons in 2022. Cultivated wheat areas decreased from 512,322.7 dunums in 1995 to 142,378.3 dunums in 2022, marking a reduction of 369,944.4 dunums.
During the time of the research, a total of 836, 876 dunums were harvested, underlining the importance of creating policies that improve agriculture to guarantee food security. In Amman, the productive area decreased from 4882.3 dunums in 1995 to 836.4 dunums in 2022, reflecting the impact of economic and climatic changes and urban encroachment on agricultural land. There was a decrease in cultivated areas in Aqaba, from 4882.3 dunums that were cultivated in 1995 to 1502.5 dunums in 2022. On the other hand, in Ajlun, it was observed that while there were only 371.5 dunums of cultivated land by 1995, this number rose slightly over time, thus growing to around 671.8 dunums to date. In 1995, the highest productivity was 54,348.2 dunams, which later dropped to 43,200 in 2004. It went up again to 12,223.3 in 2013, but in 2022, it fell to 5512.8 dunams.
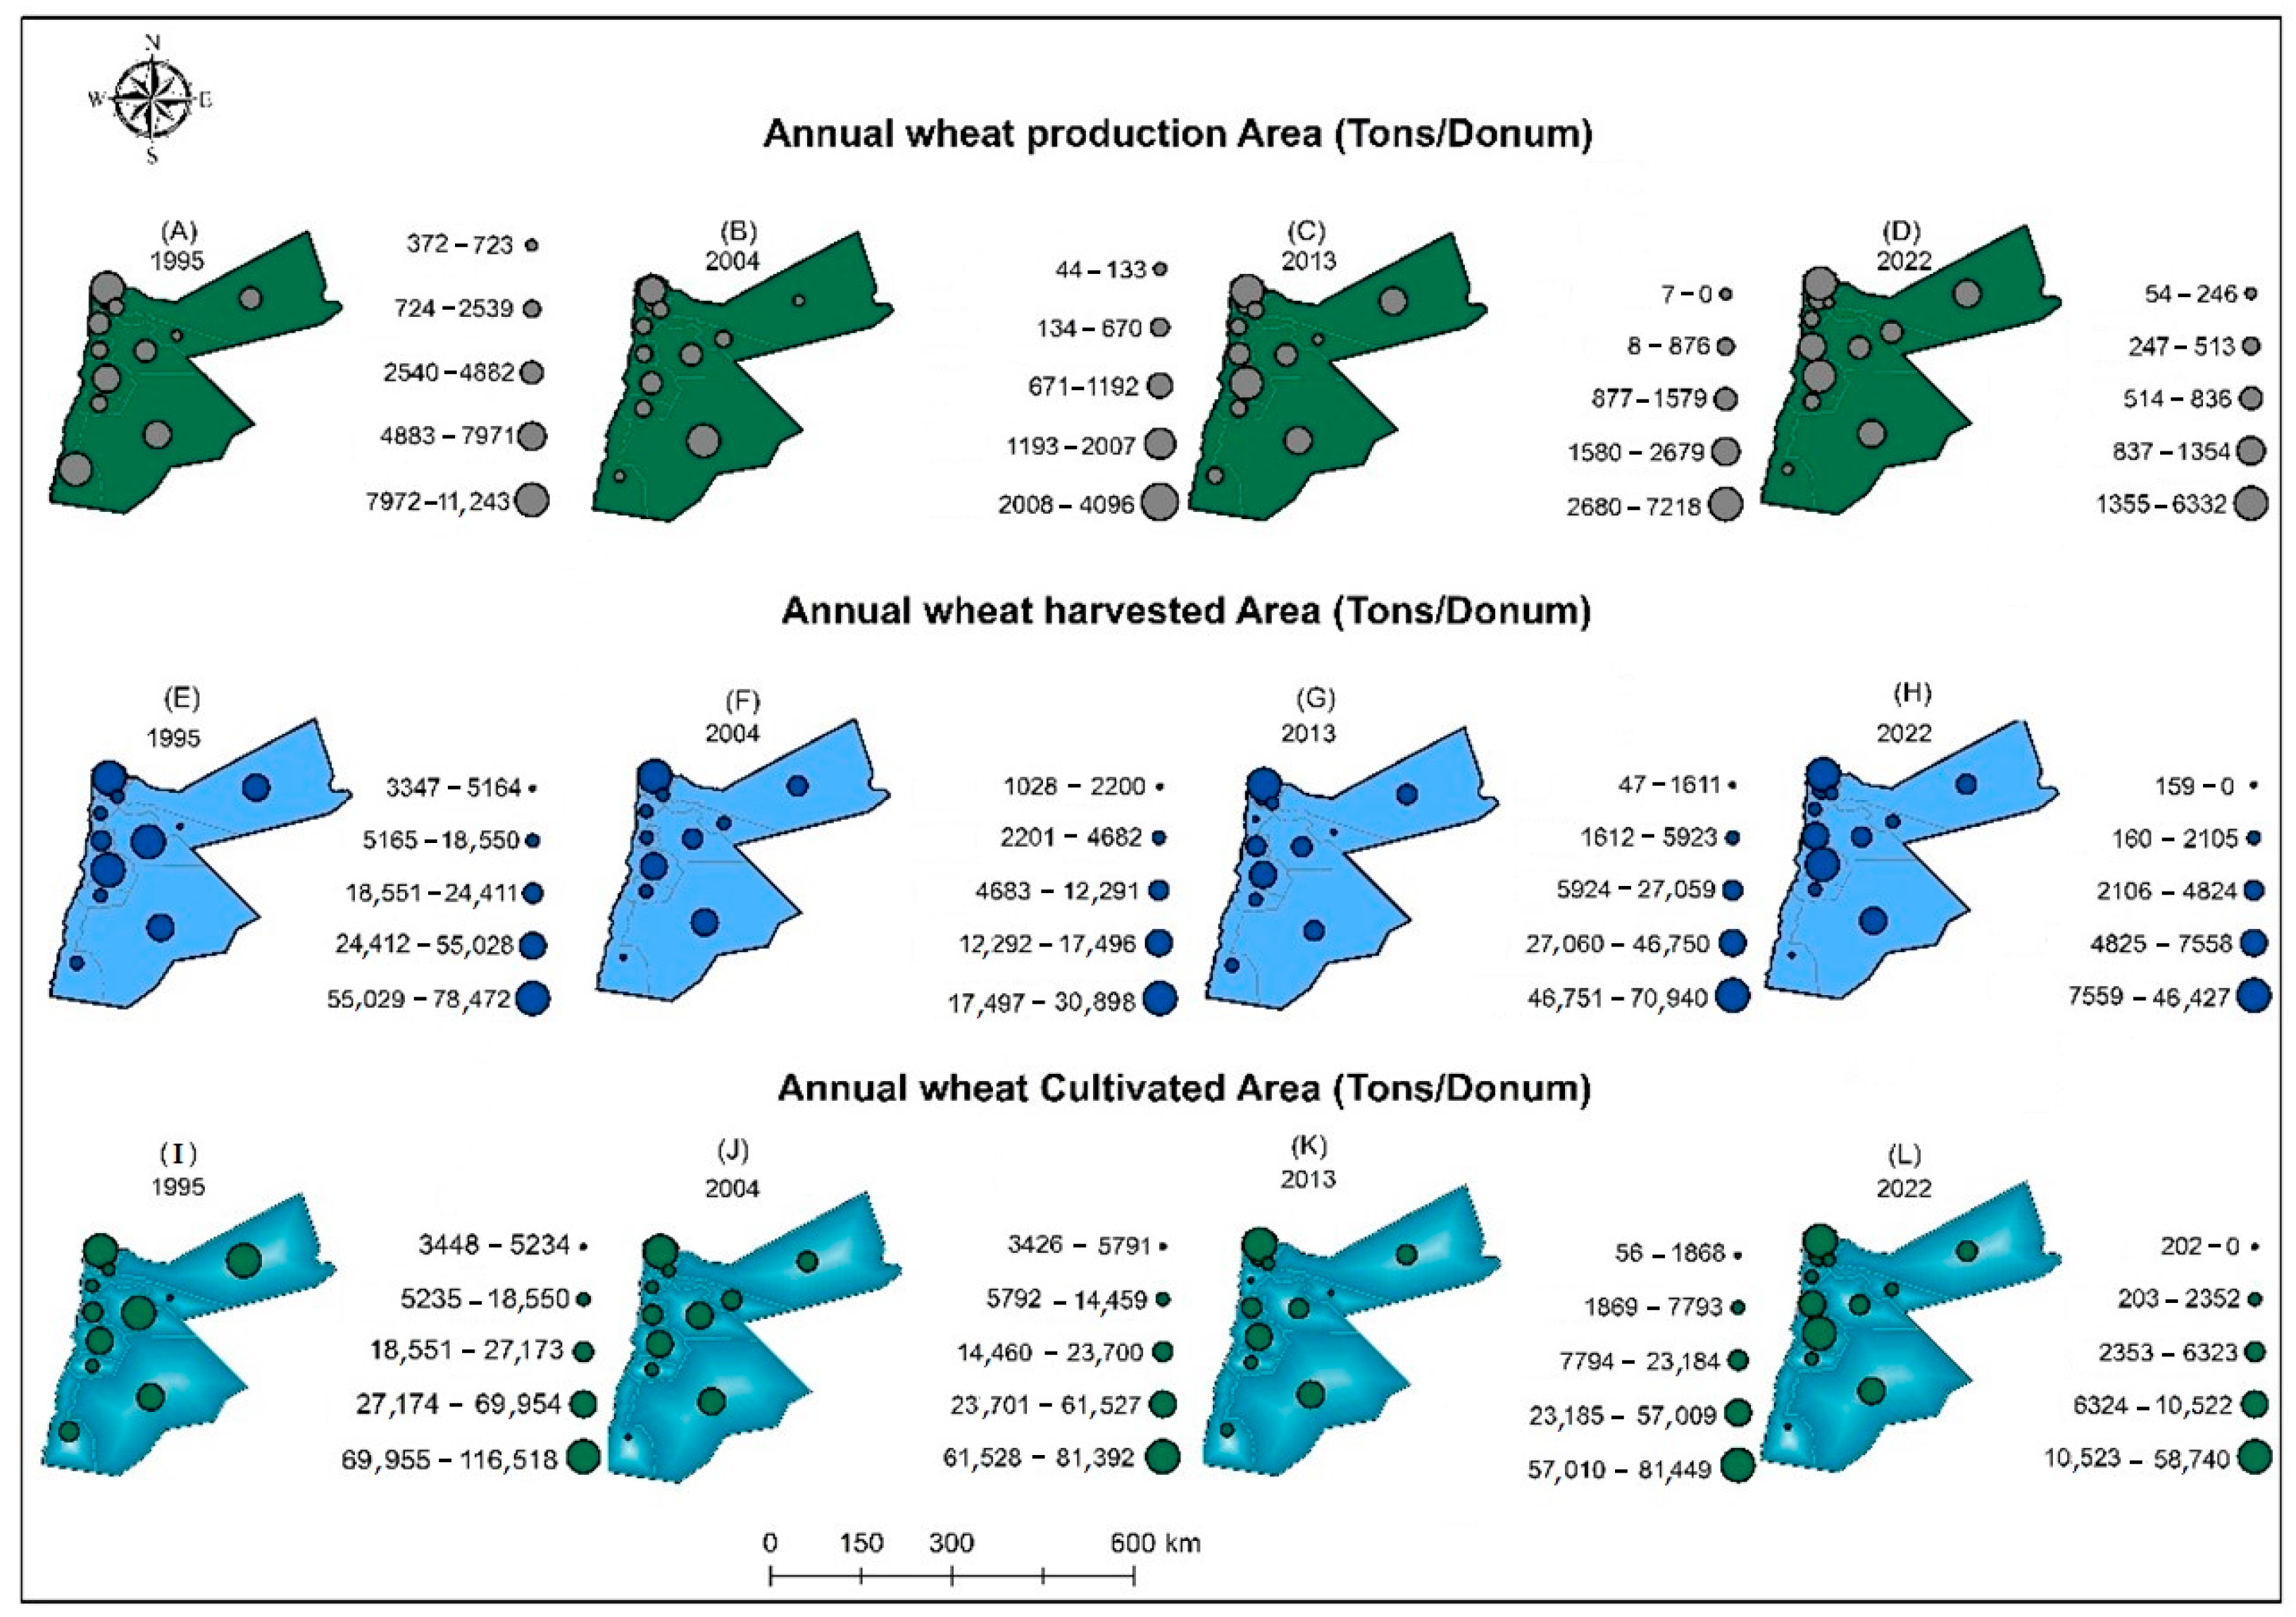
3.1. Mapping of Analysis of Wheat Cultivation, Production and Harvested
The results showed a significant decline in the wheat-cultivated area in Jordan from 1995 to 2022. Specifically, the cultivated area decreased from 512,322.7 dunums to 142,378.3, a substantial reduction of approximately 369,944.4 dunums, equivalent to 27.79%. This decline is indicative of broader agricultural challenges faced by the region. The total cultivated area during this study period totaled 1,262,324.3 dunums, reflecting continuous struggles in the agricultural sector, particularly concerning staple crops like wheat. Additionally, the total productive wheat area across various governorates was recorded at 106,726.6 dunums, emphasizing the regional disparities in productivity relevant to wheat farming. Productivity showed a general downward trend, with the highest recorded figure in 1995 at 54,348.2 dunums. Subsequently, productivity fell to 43,200.0 tons/dunums in 2004 and saw a slight recovery, reaching 12,223.3 tons/dunums in 2013, but ultimately dropped again to a low of 5512.8 tons/dunums by 2022. The cumulative decline in productivity from 1995 to 2022 amounted to 36,490 tons/dunums or 34.19% (see
Figure 3).
Notably, the declines were not uniform across the governorates. For example, in Aqaba, the productive wheat area plummeted from 4882.3 dunums in 1995 to 1502.5 in 2022. In Irbid, production diminished from 11,243.4 tons/dunums to 6331.9 tons/dunums over the same period. Similarly, Karak’s figures dropped from 7970.7 tons/dunums to 4644.8 tons/dunams. Interestingly, Ajlun experienced a slight increase in productivity, climbing from 371.5 ton/dunums to 671.8 ton/dunams. The total harvested area across the periods assessed was 836,876 dunums, with varying percentages of harvested areas across different years—48.64% in 1995, declining to 12.82% in 2004, then recovering slightly to 25.55% in 2013, only to fall again to 13.17% in 2022. This trend points to an urgent need for policy improvements to bolster food security and support sustainable agricultural practices in Jordan.
The comprehensive analysis of the wheat production landscape in Jordan illustrates significant challenges from 1995 to 2022. A key finding is the total decline in the productive area, which fell by 36,489.5 tons/dunums, reflecting a decrease of approximately 34.18%. This downward trend indicates the economic and environmental difficulties affecting wheat farming in the region.
According to
Figure 3, wheat production among various governorates is particularly noteworthy in the situation in Amman, where the productive area saw a dramatic decline, plummeting from 4882.3 tons/dunums in 1995 to just 836.4 tons/dunums in 2022-a reduction of 49.42%. Such regional disparities emphasize the varying rates of decline in wheat farming productivity. Also, the analysis indicates that the total harvested area over the four periods amounted to 836,876 dunums. The percentages of harvested areas displayed significant fluctuations: 48.64% in 1995, a sharp drop to 12.82% in 2004, a slight increase to 25.55% in 2013, and then a decrease again to 13.17% in 2022. These trends underscore the pressing need for policy improvements to enhance agricultural productivity and bolster food security across Jordan.
3.2. Analysis of Mapping Climate Parameters
The climate data from 1995 to 2022 reveal distinct patterns in rainfall and maximum and minimum temperatures across Jordan, as shown in
Figure 4. Temporal analysis indicates slight increases in the average maximum temperatures across all seasons and years, with these temperatures ranging between 32 °C and 34 °C, reflecting the generally warm climate of the kingdom. The data also demonstrate minor variations in maximum temperatures among governorates, as shown in
Table 2, with Aqaba, Ma’an, Tafila, Karak, and Madaba recording the highest temperatures, reaching an annual average of up to 39 °C in Aqaba.
Based on
Figure 4 and
Table 2, the results indicate a precise insight into the patterns of minimum temperatures during the study period, enabling a comprehensive analysis of climate changes and their impact on wheat production. The results reveal significant spatial variations in minimum temperatures across governorates, with the highest averages observed in Southern and Central Jordan, while the lowest was recorded in northern regions. The data do not indicate significant differences in the average minimum temperatures between years, though notable seasonal variations are evident. Higher averages occur during winter, while lower averages are observed in summer. Governorates with the highest minimum temperatures include Aqaba, Ma’an, Tafila, Karak, and Madaba, while Ajlun, Jerash, and Zarqa recorded the lowest averages.
3.3. Analysis of Population Density and Growth Rate Data in Jordan
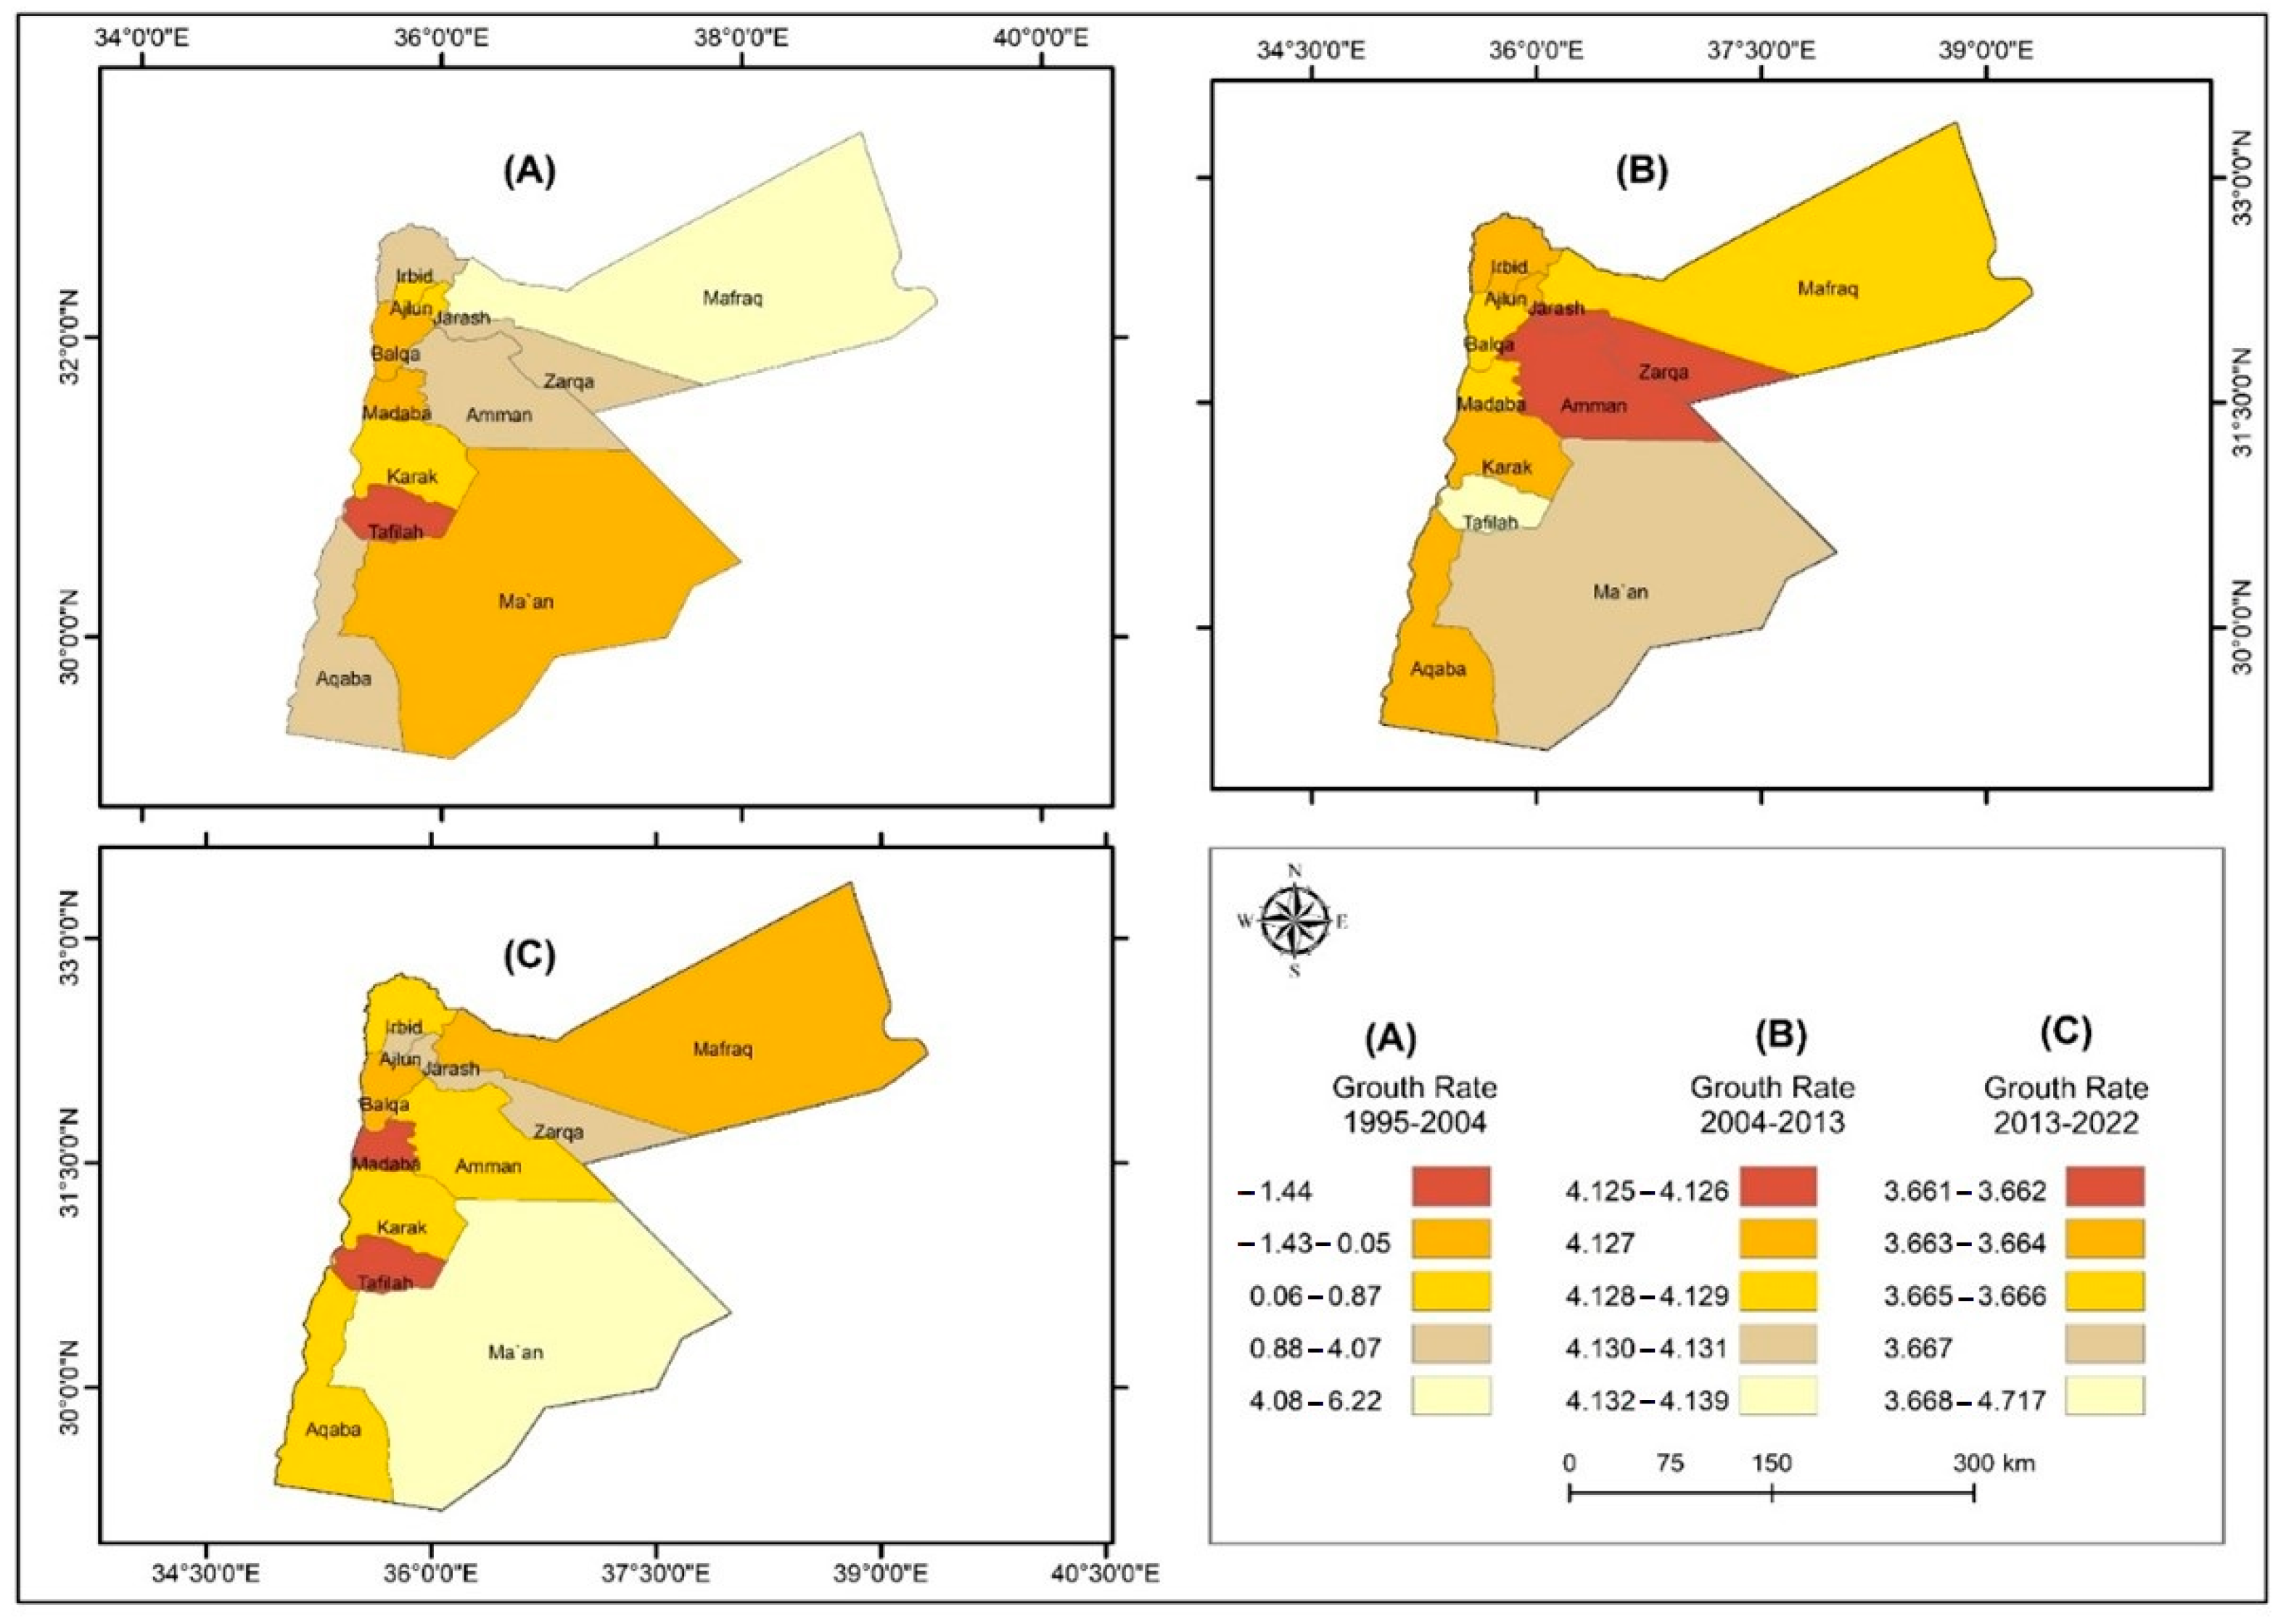
Population growth in Jordan presents a significant challenge, particularly regarding its impact on agricultural productivity, especially wheat production. This study aims to conduct a scientific evaluation to determine the effects of population growth on wheat production across various governorates of Jordan by analyzing changes in wheat output corresponding to each unit change in the population growth rate. Data from census records issued by the Jordan Department of Statistics in 1994, 2004, 2013, and 2022 were used to conduct the study. The equations for absolute and relative population change are important to analyze how populations grow or decline and how demographic factors differ. These equations are necessary tools for demographers, as shown in
Figure 5 and
Figure 6. By analyzing population changes, we can understand how these changes affect main economic sectors, such as agriculture. This knowledge allows us to evaluate the relationship between population growth and wheat production.
3.3.1. Absolute and Relative Population Change
The absolute population change, calculated as the difference between the final and initial population sizes, directly measures the actual increase or decrease in a population over a specific period [
30]. This metric is crucial for understanding real demographic shifts that impact agricultural requirements.
Governments and policymakers utilize absolute population change to ensure the proper allocation of resources, develop effective agricultural strategies, and plan for increased wheat production to guarantee food security.
The relative population change (rate of population increase), expressed as a percentage, indicates the extent to which a population has fluctuated over a given period:
Additionally, this analysis is critical to present the pattern of demographic trends, forecast future population growth, and assess resource requirements, including the agricultural sector’s needs for wheat production.
Where the equation of population growth rate was applied based on a natural logarithmic equation for calculating the population growth rate as follows [
31]:
where the following definitions are used:
R = The population growth rate;
Pt = The population size in the subsequent period;
Po = The population size in the previous period;
T = The time interval between the censuses (in years, months, or days).
3.3.2. Wheat and Population Growth Relationships
Applying these equations to Jordan’s census data and analyzing their impact on wheat cultivation provides a deeper understanding of the relationship between population growth and agricultural demand, specifically wheat production, as shown in
Table 3. The findings inform policymakers regarding resource allocation for expanding agricultural activities and guide policy toward increasing wheat production to achieve food self-sufficiency. Furthermore, the analysis identifies governorates most vulnerable to population growth pressures, enabling targeted agricultural interventions to enhance production in areas of heightened need.
Wheat prices in Jordan experience noticeable fluctuations due to the influence of several interconnected factors, making it challenging to determine a fixed price per ton (see
Table 4). These prices are primarily affected by local production costs, including expenses for seeds, fertilizers, and pesticides, as well as irrigation, harvesting, and labor costs. These costs vary among farms based on geographical location, soil type, and farming methods. On the other hand, global wheat prices play a crucial role in determining local prices, as Jordan relies on importing a significant portion of its wheat needs. Through the Ministry of Industry, Trade, and Supply, the Jordanian government intervenes to regulate prices by setting wheat selling prices for mills.
The Ministry of Agriculture also supports farmers in reducing production costs, and the government strives to achieve a delicate balance between supporting farmers to ensure continued production and providing wheat at reasonable prices for consumers through the pricing and support mechanisms it adopts.
In
Table 5a–c, the correlation matrices between rainfall, temperature, and wheat yield are analyzed. The correlation matrix reveals a direct relationship between rainfall and wheat production (R
2 = 0.37; 0.49 and 0.63) for North, Middle, and South Jordan. This direct association is attributed to the concentration of wheat cultivation in the northern and central Jordanian regions, which receive more than 300 mm of annual rainfall. In contrast, the southern regions receive lower rainfall than the other Kingdom areas, where higher rainfall amounts reflect improved wheat yield or production quantities. Conversely, a significant inverse relationship exists between population growth and wheat production quantities (R
2 = −0.56; −0.78 and −0.89) for North, Middle, and South Jordan, respectively. This reflects that wheat is a staple food in Jordan, and the increasing population directly drives higher consumption of domestic wheat supplies. Furthermore, research suggests that urban expansion over the past four decades has encroached upon agricultural land, likely contributing to reducing grain-producing areas. This is supported by the observed inverse correlations between population and both cultivated (R
2 = −0.56; −0.78 and−0.89) and harvested areas (R
2 = −0.24; 0.61 and 0.54) for North, Middle, and South Jordan, respectively.
4. Geographically Weighted Regression (GWR)
The primary GWR output, comprising local parameter estimates and their standard errors, is summarized using a nine-number summary to efficiently convey the variability of these local estimates, as shown in
Table 6. A method involving quartiles and standard deviations can facilitate a practical, albeit informal, comparison of local parameter estimates derived from geographically weighted regression (GWR). This approach allows for comparing the range of local estimate values between the lower and upper quartiles while referencing the range of values at ±1 standard deviation of the corresponding global estimate. As the authors of [
28] outlined, this technique offers a straightforward way to understand the variability and distribution of local parameter estimates in relation to international estimates.
The model GWR was used to analyze the data, which indicate that the mean annual rainfall and temperatures in the north of Jordan, which cover the governorate Irbid, Ajlun, Jarash, and Mafraq, are 258.9 ± 41.4 mm and 23.8 °C ± 1.5; for Amman, Balqa, Zarqa, and Madaba, they are 226 ± 62.7 mm and 25 °C ± 1.5; and for the southern part of Jordan, which covers Karak, Tafilah, Ma’an, and Aqaba, they are 81.8 ± 15.2 mm and 23.2 °C ± 1.6; these areas received a higher amount of rain than in the growing season. About 98% of total rainfall comes in the growing season, and a higher temperature determines wheat yield. The highest rainfalls in the year were in Ajlun and Balqa (380 and 331 mm). In contrast, the lowest rainfall (16.5 mm) was recorded in Aqaba, and these areas are the most sensitive periods to climatic conditions.
The critical climatic factors of rainfall and temperature during the wheat growth stages affect early development after sowing, flowering, and milking. Unfavorable conditions, such as insufficient rain and low temperatures, significantly limit yield potential in dryland farming [
32,
33]. Winter wheat, typically sown in November or December and harvested between June and July, is particularly sensitive to these climatic variables during specific periods: early development (November/December), flowering (April), and milking (May/June). Insufficient rainfall or unsuitable temperatures during these phases can severely hinder wheat development and reduce crop yields. For instance, the authors of [
34] identified moisture stress during heading and soft dough stages (late June to July) as a primary determinant of wheat yield. Similarly, Ref. [
35] demonstrated that a curvilinear regression model effectively represents the crop yield/water use relationship, closely mirroring its natural behavior. Numerous crop–climate evaluation studies have highlighted the utility of crop yield–weather relationship models in estimating the yield potential, climatic impacts, and the interplay between yield and climate [
36,
37]. In this context, an approximate likelihood ratio test, based on the F-test, was employed to assess the relative performance of the Geographically Weighted Regression (GWR) model in replicating observed data, as shown in
Table 7 [
28].
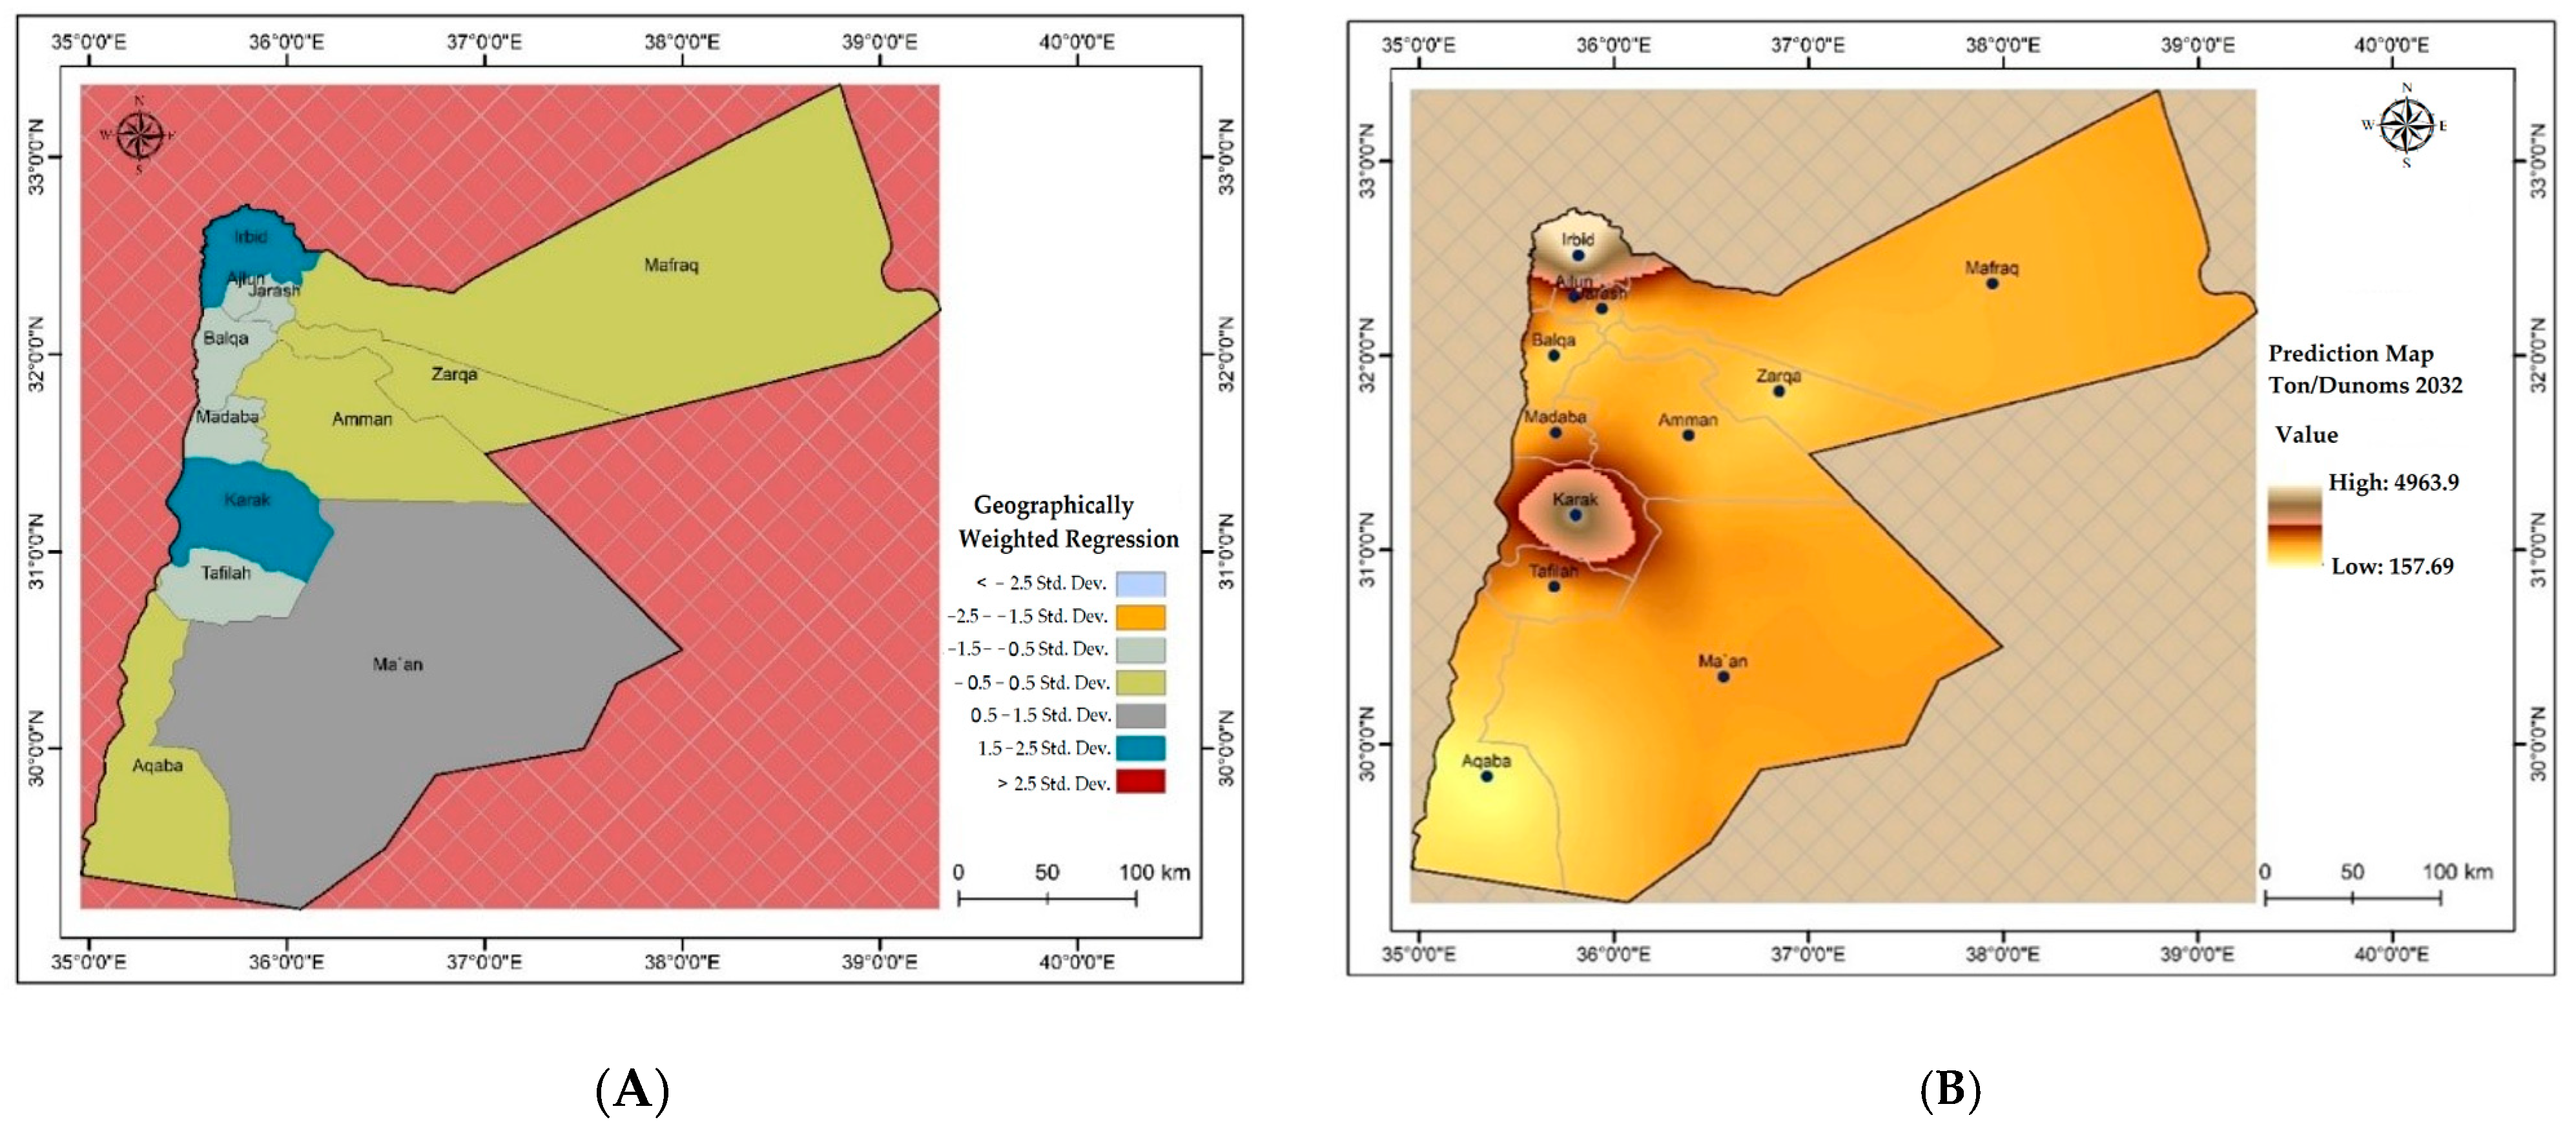
To investigate the relationship between wheat production, the population growth rate, rainfall, and maximum and minimum temperatures, a geographically weighted regression (GWR) model was employed [
38]. Wheat production was considered the dependent variable, while the population growth rate, rainfall, and maximum and minimum temperatures served as explanatory variables. According to
Figure 7A, the regression model results revealed a statistically significant relationship between wheat production and the explanatory variables (rainfall and minimum temperature) [
39]. The coefficients obtained from the model indicated a strong positive correlation between wheat production and rainfall in most of the studied governorates (
Figure 7B), with statistically significant importance [
40]. The results for rainfall had a statistically significant (sig) value of less than (0.01), indicating that an increase in rainfall in a given year significantly impacts the rise in wheat production for that year [
41]; similar conclusions can be drawn for the minimum temperature based on the associated t-statistic (measuring the effect size) and
p-value (assessing statistical significance).
The independent variable (rainfall) explained 32.12% of the variations in wheat production, while the minimum temperature explained 30.74%, the maximum temperature explained 13.84%, and the population growth rate explained 26.34%. This demonstrates a strong relationship between wheat production, rainfall, and the minimum temperature. Therefore, it can be concluded that the model is valid and that there is a connection between the amount of wheat produced and the other explanatory variables. A multicollinearity test was conducted to confirm the presence of this relationship. The results showed that the VIF for the model ranged between 1 and 1.38, which is less than 3, indicating the absence of multicollinearity issues [
42].
Future Wheat Production Scenarios
Table 8 indicates a significant variation in expected wheat production across different governorates of Jordan (measured in tons per dunum); high wheat production is expected in the northern and central regions, particularly in Irbid, Karak, Tafila, and Madaba, due to favorable climatic conditions [
43]. In contrast, medium production levels are anticipated in the northwestern regions, such as Jerash, Ajlun, and Balqa. Southern areas like Ma’an and Aqaba, along with Amman, show lower wheat production levels; the most minimal production is expected in the northern distant regions, like Mafraq and Zarqa, as well as the areas adjacent to the Dead Sea; this is attributed to harsh climatic conditions and low rainfall, making the soil less fertile [
44].
Local factors can explain these results: Irbid benefits from extensive agricultural land and a suitable climate, making it one of the highest-producing areas. In contrast, Amman faces rapid urban expansion, transforming agrarian lands into residential and commercial areas, thus reducing available farming space [
45]. Southern regions such as Ma’an and Aqaba contend with challenges like drought and scarce water resources, which directly impact wheat yields [
46]. Finally, the areas near the Dead Sea suffer from soil salinity issues, which complicate agriculture and reduce productivity.
5. Discussions
Jordan, like many countries in the region—for instance, Syria, Lebanon, parts of Iraq, and even some areas of Egypt—faces significant challenges in wheat production, ranging from severe climate change and worsening water scarcity to a rapidly growing population and deteriorating soil quality. These factors put enormous pressure on the agricultural sector and increased reliance on wheat imports, exposing national food security to global price fluctuations. Compared to neighboring countries, agrarian policies, levels of technology adoption, and investment in research and development vary significantly, impacting wheat productivity and the ability of these countries to achieve self-sufficiency. A comprehensive comparison between Jordan and Egypt, its neighboring country, is politically and militarily stable. In Egypt, rapid population growth significantly exacerbates these pressures, contributing to food vulnerability. Egypt’s population, estimated at 100 million in 2020, consumed approximately 20 million metric tons of wheat that year [
47]. In general, the agricultural area in the Arab world in 2013 amounted to about 69,625 thousand hectares, and Sudan ranked first with an area of 21,756 thousand hectares, followed by the Kingdom of Morocco and then Algeria in third place. As for the areas invested, they amounted to 59,548,035 thousand hectares, and these areas varied in their investment, as grain crops comprised an area of 757% of the total cultivated lands, then oil crops, which constituted 17.4%. Large areas, estimated at 59% of agricultural land in the Arab world, depend on rain, and the remaining percentage depends on irrigation water. Wheat comes at the forefront of cultivated areas, as the area cultivated with this crop in 2017 amounted to about 84,470 thousand hectares, and production amounted to 21,855 thousand tons. Morocco ranked first among Arab countries in terms of cultivated area, as it amounted to 2413.64 thousand hectares, and its production amounted to about 2731.12 thousand tons, equivalent to (12.4%) of the Arab world’s production. Egypt ranked first in production, as its wheat production amounted to about 9344.5 thousand tons, equivalent to 42.7% of the Arab world’s production. Then came Iraq after Egypt in terms of production, as it produced about 3052.9 thousand tons in an area estimated at 924.31 thousand hectares, followed by Algeria, with 1937.62 thousand tons, and Syria, with 1726.25 thousand tons, and they followed Arab countries, as shown in Table (28). It is noted that productivity is low in the Arab world, reaching 2587 kg/hectare in 2017, due to the prevailing natural climatic conditions in the Arab world and the dependence of wheat cultivation in most Arab countries on rainfall, which varies from one year to another [
48].
According to soil data available from the Ministry of Agriculture for various parts of Jordan, in addition to the attached map showing soil development according to the USDA classification, there are varying levels of soil types between the fertile areas in the northwest and the less productive areas in the south and east. However, the percentage of organic matter in Jordan does not exceed 1% in the best cases. Data from the Ministry of Agriculture indicate that the pH level of most lands in Jordan ranges between 7.5 and 8.5. Due to the water situation in Jordan, we rely on rainfall for wheat cultivation, and wheat crops are typically planted in areas that receive more than 300 mm of rainfall. This crop is considered essential in the agricultural landscape of Jordan. For this reason, government policies play a pivotal role in supporting and enhancing wheat production, as these policies form the framework that determines the course of agriculture and directly impacts farmers. These policies encompass multiple aspects, from financial support that alleviates burdens on farmers and enables them to invest in production inputs through providing high-quality seeds and fertilizers that ensure a bountiful crop to setting fair prices that encourage production and protect farmers from market fluctuations. The government’s role is not limited to this but includes providing agricultural extension services that equip farmers with knowledge and modern technologies. Additionally, policies related to water management play a vital role in ensuring the availability of water necessary for irrigation. In contrast, policies combating desertification and climate change contribute to protecting agricultural lands and maintaining their sustainability. Providing appropriate and integrated support to farmers increases wheat productivity and contributes to achieving food security and boosting the national economy.
In this study, it is evident by looking at the data that severe fluctuations in wheat production from 1995 to 2022 occurred in the area surveyed. Such significant changes in wheat productivity result from the combined effect of environmental and human factors on all agricultural outputs [
39,
49]. The more considerable decrease in wheat yield availability and the acreage under wheat cultivation is due to the combined influences of climatic stress, like less rainfall and higher temperatures, and perhaps pressures from demographic shifts due to the expansion of urban areas [
4]. It may shrink the available area of arable land (
Table 1). This challenge underlines the necessary development of converged agricultural as well as land-use dynamics that promote good sustainable agricultural practices such as drought-tolerant crops and improved irrigation methodologies to cope with such environmental variations and ensure food security in the regions.
A profound deterioration in wheat growing or cultivation from 836,876 hectares of harvested crops is emphasized, giving rise to the need for action to develop resilient agricultural policies and food security [
2]. Amman shows a dramatic loss of productive areas, from 4882.3 hectares in 1995 to 836.4 hectares in 2022, that arose from economic changes, climatic variations, and the expansion of the urban regions to amortize agricultural lands. Like Aqaba, the area also decreased in terms of wheat cultivation in the same year, as opposed to Ajlun, which grew slightly. Fluctuating until 1995, these productivity changes seemed to have drastically reduced by 2022, indicating intensified challenges and the need for the most appropriate measures for sustainable agricultural practices and land management to fight these trends (
Table 1).
The critical reduction in wheat cultivation in Jordan over the years 1995 to 2022 was further highlighted by this study after a significant decrease of 369,944 or 27.79% expansion in the wheat area (
Figure 3). Through this decline, the other economic landmarks of wheat plantations further opened, and, hence, it became evident that there was a massive challenge facing productivity due to the diminishing acreage of productive lands from the year 1995 onwards, when they reached peak productivity. The highest productivity changes were marked disproportionately, as productivity rates differentiated across different governorates. Thus, areas such as Aqaba and Irbid had particularly dramatic losses, whereas Ajlun exhibited some modest gains. Trends fluctuated across years for the harvested area, underlining the necessity of policies emphasizing agricultural productivity and food security improvements to experience any turbulence from the economic or environmental scenarios under future scopes [
50].
The climate data from 1995 to the present (2022) show some notable variation trends in rainfall and temperatures around Jordan, with an annual maximum temperature of around 34 °C on average, steadily increasing in value and demonstrating the typically warm nature of the kingdom’s climate. The trend is seen in different regions, as shown in both
Figure 4 and
Table 2, reflecting a specific distribution between Aqaba, Ma’an, Tafila, Karak, and Madaba, among others, where the regions usually exceed the rest of the areas in any particular year by elevating it to roughly 39 °C average annually. The variation within this region underpins the difference in climatic conditions, which is necessary for agricultural and environmental planning [
8].
The range and types of minimum temperature data presented in
Figure 4 and
Table 2 facilitate a comprehensive analysis of spatial variability and possible effects on wheat production. The data show significant differences between Jordanian governorates in the average minimum temperatures, the highest reaching its average in the south and center and the lowest in the north. Although there is no significant change in the annual mean, seasonal fluctuations are observed, with higher temperatures in the colder winter and lower temperatures in the hot summer. Aqaba, Ma’an, Tafila, Kerak, and Madaba have the highest low-temperature averages, showing the derived effect in opposite coolers available in areas like Ajlun, Jerash, and Zarqa, which are essential for planning strategies on crops and climate adaptability.
By compiling demographic data from several censuses to examine the extent to which different changes in population have an overall impact on agricultural outputs in the country’s governorates, it is evident that the changing demography at the grassroots level has a vital role in agricultural development, with a significant focus on socio-environmental factors informing studies on population demographics, as stated in [
51]. The study describes various areas of demographic change, and the compilation of census data can be used in this study to determine the size and current rate of population growth in Jordan. Otherwise, the metrics for absolute and relative population changes follow the growth rate displacement, which must be monitored in the future, just like having annual crop calendars to include dates and technologies considered for each growth sequence. Metrics for absolute population change may consist of measurements leading to the total increase or decrease in the population within a specific period, determining the reliability of data for resource allocation, and laying down plans for agriculture. Meanwhile, the relative population change calculates the percentage variation based on time so policymakers can determine how a population grows. They should plan accordingly to ensure food security and effectively handle issues related to the management of agricultural resources.
Figure 5 and
Figure 6 demonstrate the trends associated with both population change variables with direct links to illustrate how important such changes are in defining compelling scenes of agricultural representation in wheat production.
Jordan’s population statistics were analyzed to determine how they affect wheat production. This offers space for more information to examine the general environment of population growth on an agricultural basis [
8,
9]. Thus, this study contributes to increasing the knowledge gap regarding the effect of demographic modeling on the super-growth in the population and the resulting impact on field wheat itself as a source of food, which is mentioned further in
Table 3. The findings obtained are the basis of any information or policymaking on the distribution of resources for strategies that enhance wheat productivity and achieve self-sufficiency in agriculture. Moreover, the analysis highlights areas where the changing demographic makeup is binding on districts, and these happen to be areas where wheat production can increase with effectively targeted interventions in agriculture to meet mounting needs. Lastly, this strategic emphasis, grounded in the most vulnerable areas, aims to raise productivity and prudently ensure food security.
The GWR model was developed to assess the impact of population density growth, change in temperature patterns, and rainfall changes on wheat production in Jordan, since they all impact complex agricultural dynamics. Wheat production was used as the dependent variable and controlled by climate and demographic variables as the explanatory variable, significantly marked by wheat production, rainfall, and minimum temperatures. As seen in the results of GWR in
Figure 7A, rainfall is correlated with a significant improvement in wheat yield, and this pattern is noted in several governorates. Likewise, the effect of the minimum temperature is well appreciated. Both variable factors contribute comparatively to a significant portion of the variability in wheat production; the variation in wheat production is 32.12% covered by rainfall and 30.74% covered by the minimum temperature. The absence of multicollinearity, verified by 1 to 1.38 VIF values, asserts the model’s independence; thus, the environmental factors significantly contribute to wheat production without overlapping effects. These assertions, therefore, clearly show that wheat yields significantly correlate with specific parameters within the climate and attach a quantifiable frame within which policymakers can plan for agricultural enhancements and the allocation of resources to sustain such wheat production in the rapidly changing climatic environment.
Table 8 shows a significant regional variation in wheat production in different governorates in Jordan from 1995 to 2022, indicating that geographical variations significantly impact agricultural output. Substantial amounts of wheat are expected for regions such as Irbid, Karak, Tafila, and Madaba due to favorable climatic conditions with abundant agricultural lands. This contrasts with available data in areas such as Mafraq, Zarqa, and those bordering the Dead Sea, with completely unfavorable cruel climates, drought, and salinity in soil likely to lower production drastically. Therefore, while optimal conditions prevail in northern and central regions, the agricultural potential is restricted by accelerated urbanization in Amman, and the availability of fertile land is reduced by desert climates in southern governorates like Ma’an and Aqaba. This highlights the critical importance of region-specific agricultural programs to address unique challenges in each location and improve productivity while ensuring food security throughout Jordan.
This research implies an immediate call for strategies to take a comprehensive approach to addressing climate variability-related challenges and changes in population trends in wheat production [
52]. Focusing on land, such significant reduction indeed happens in cultivated areas, mainly in urbanized regions [
53] like Amman and Zarqa, thus necessitating the development of more stern land use regulations to avoid further encroachment upon the farming lands. Formulating urban growth boundaries and inducing the preservation of such arable land could work so that urban expansion could negatively impact the environment in unregulated ways.
Moreover, an affronting strategy should also be developed to make agricultural sectors adaptable to climate change through sustainable means. The use of water in irrigation, indigenous wheat resistance genes to drought, and precision agriculture practice technologies are all means that can draw much better gains in productivity and resource use efficiency. Farm–farmer support programs and public–private partnerships can substantially assist in mobilizing resources and implementing these strategies. Another order of initiatives for policymakers’ interests can be earmarked by embedding long-term climate projections in agriculture planning to ensure provisions for food security and minimize wheat imports due to rising demographic pressures.
This study highlighted significant disparities in wheat productivity across Jordan because, in every ecological area of the country, constraints on the use of land under different conditions will differ; overall, these studies reveal that such disparities result from diversity in climatic conditions, land use, and urbanization [
54].
The higher-altitude and north regions, for example, including Irbid, Ajlun, and Tafilah, which are conducive to moderate intense rainfall and temperature, all produced significantly higher productivity levels. Conversely, the sweltering climates and limited rainfall in southern and generally arid regions like Aqaba and Ma’an—often making production more difficult—have shown systematic rate reductions in production. These figures capture the agricultural effects of climatic advantages and constraints at a regional level.
Urban development is connected to the widening regional disparities, especially in heavily urbanized Amman and Zarqa areas, which have shown the sharpest dip in cultivated land and productivity because of usurpation in fertile agricultural areas. In contrast, the data for Ajlun, which is less urbanized, are relevant and up to date. These regional differences would be better dealt with by actions matched for specific conditions, from targeted resources to infrastructure developments for better irrigation quality and zoning acts to defend against urbanization on farming lands. With such measures, the region is becoming less vulnerable, and the disparity of more balanced productivities between areas will improve regarding agriculture in Jordan.
Jordan confronts a formidable hurdle to its current agricultural practices in increasing variability in the climate, as derived from both the climate variability and the dramatic increase in population growth [
55]. The central components of the existing traditional farming techniques, reliance on rain-fed agriculture, and ineffective irrigation systems have paved the way for reduced wheat yields. Several arid regions, such as Ma’an and Aqaba, are not equipped with modern irrigation methods to heave off the effects of lower rainfall and higher temperatures, leading to compromised productivity. Similarly, the adoption of progressive farming technologies, such as precision agriculture and drought-resilient wheat varieties, continues to frustrate any attempts to adapt resources to become ecology-sensitive.
This is a severe problem because most Middle Eastern countries are intensely urbanized and very small, and the population is still increasing. The capital cities are always too crowded, and the growing demand for crop production tends to destroy arable land in these countries. Examples are Amman and Zarqa, which have visually lost a large part of their fertile lands as unchecked urban expansion has taken root. This is ample proof that land-use plans are not fully integrated with key features of zoning laws, providing leverage to those who may abuse it instead of serving long-term agricultural purposes. Enforcement and inspecting mechanisms of laws on zoning are extremely weak, which merchants exploit illegally, thereby destroying once-valuable soils. Resolving such problems that are growing and becoming more damaging involves adopting new agricultural practices, promoting improved water management systems, and creating better policies regulating land usage in the overarching framework of protecting sustainable agricultural methods. Until these are introduced, almost all potential wheat gains would be at risk—posing great jeopardy for food security in Jordan.
Wheat, Jordan, and their indispensable companions combine to heal in a grain blade that reaches the future. Production in any area will vary almost radically. The latest drastic changes are the real, rapidly ongoing climate change of land use and demographic pressures. For example, the northern part of the country and parts of Tafilah and Irbid lands still have good productivity levels, with some moderate rainfall and moderate heat there. Droughts, difficult soil, and limited water availability in these barren regions have quite a considerable detrimental effect on production compared with such scenarios already depicted. Expanding already-significant towns and cities in densely settled areas with greater populations will leave less and less land for cultivation, increasing the pressure on the farming field even more.
Action in preparation for the future is imperative for Jordan to reduce foreseeable decreases. Adaptation or readiness to future changes must be adopted, keeping the upcoming decline in sight. Indeed, the same investment in precision farming technologies could provide dizzy drought wheat strains and improved water-use efficiencies to sustain productivity. Furthermore, future climate change scenarios in the national security strategy allow policymakers to identify where resource allocation and strategies must be focused and targeted in the agriculture sector. This is a critical element in ensuring that these conditions are sustainable. This production is based on internal resources and conserved for future generations in Jordan due to growing environmental and demographic challenges.
Fascinating technological principles and sustainable agricultural practices are crucial in resolving the issues that seem to deter or, if not, stand in the way of wheat production in Jordan. Precision agriculture will introduce advanced technologies, including remote sensing and GIS, to identify the potential highest-cultivation areas in real time and monitor crop health. In Jordan’s case, developing new varieties adapted to the region could enhance productivity significantly in water-scarce areas such as Ma’an and Aqaba.
When there is a severe fluctuation in the climate pattern, artificial mitigation measures come in handy; practices such as water-saving innovations to improve farming, carefully managed tillage methods, and a shift in the planting of crops are examples of a damage-containing-the-use scenario. Technologically managed and advanced water-saving methods include drip irrigation, while the cutting-edge application of information technology in this field requires that agricultural lands be populated by radio communication, sensors, and satellite technocrats in the dissemination of detailed information from the state-of-the-acre information system. One important procedure is no-till farming for earthworms. Since a drop of liquid has been added to the sloth pool, thanks to adaptation in water conservation and yields, application rates could be calculated well based on the bottled-up basin situation. This activity is necessary to help manage a rapidly increasing population and extreme weather conditions, which can contribute to further annoyance among local farmers.
Food security remains seriously under threat because of the decline in the production of wheat in Jordan, aggravated by climate variability, proliferation into cities, and the utter disregard of resources, causing the decline in wheat cultivation by about 34% from 1995 to 2022. Consequently, the country has engaged in a trading partnership, which has further subjected the country to external dependence, with the country experiencing the vulnerability that often comes with global market economic fluctuations and geopolitical tension. This heavy dependence on dependent external sources accounted for meeting almost 97% of the required wheat and fell under more economic strains, as well as increased the risks for food security stability.
To address food security, a combined approach ought to be used, focusing on increasing local wheat production and varying input sources. The encroachment of urban activities on Agri-bargained lands should be minimized. In addition, resource efficiency can be improved through the implementation of the latest techniques in irrigation and agriculture, while climate-resilient crops could be adopted. In the process, developing the storage infrastructure and creating good supply chain management is important to lessen the possibilities of import dependency. This, therefore, will ensure food security in Jordan as it involves keeping a good balance of producing enough in the country and wisely strategizing on imports to consider the anticipated population expansion.
It is recognized that challenges and prospects in wheat production revealed in Jordan are a shadow of challenges and solutions lying ahead pertaining to arid and semi-arid authoritative contexts concerning agricultural systems. Jordan is similar in terms of how this trend is affecting the neighboring states in the Middle East and North Africa: diminishing agricultural water resources, even more profound urbanization, and discontent with the vulnerability to climate change because for Jordan, food production and especially its security have been significantly affected. Since the gap in development has been impacted, it seems that this similarity offers the possibility of more efforts to advocate adaptation in agriculture, especially depending on cereals like wheat, in water-scarce lands globally.
Integrating challenges experienced by Jordan into a wider world context highlights the need for collaborative research, sharing of technology, and policy development. Best practices can inspire Jordanian policymakers to emulate or adapt. For instance, the lessons from such successful interventions could be precision agriculture in Morocco and heatedly climate-resilient wheat varieties in Egypt that can guide local strategies in Jordan. Furthermore, integrating the results of this investigation with regional strategies, such as food security partnerships or climate adaptation programs, can better position Jordan within the broader range of capacity-building efforts that extend to unique agricultural challenges and the context of a typical regional response to food insecurity.


