Article

Improving Wheat Yield, Fertilizer Use Efficiency, and Economic Benefits Through Farmer-Participation Nutrient Management

1
College of Resources and Environment, Henan Agricultural University, Zhengzhou 450046, China
2
Institute of Plant Nutrition, Resource and Environment, Henan Academy of Agricultural Sciences, Zhengzhou 450002, China
3
College of Resources and Environment, China Agricultural University, Beijing 100193, China
*
Author to whom correspondence should be addressed.
These authors contributed equally to this work.
Sustainability 2025, 17(8), 3481; https://doi.org/10.3390/su17083481
Submission received: 14 March 2025 / Revised: 9 April 2025 / Accepted: 10 April 2025 / Published: 14 April 2025
(This article belongs to the Special Issue Achieving Sustainable Agriculture Practices and Crop Production)

Abstract

:
Optimal nutrient management is crucial for ensuring food security and agricultural sustainability. While technological innovation in nutrient management has been emphasized, the widespread adoption of such technologies remains a significant challenge, particularly in smallholder farming economies. This study presents a case of farmer-participation nutrient management (FPNM), where smallholder farmers are engaged through dialogue and their feedback is integrated into technology optimization and implementation strategies. A multi-site experiment was conducted on 71 fields, where 36 fields were treated with farmer’s customary nutrient management (FCNM) and FPNM, while the remaining 35 fields received only FCNM. The results showed that compared to FCNM, the FPNM increased grain yield by 10.9% and reduced chemical fertilizer inputs by 24.7%, including nitrogen (N) fertilizer by 10%, phosphate (P) fertilizer by 21%, and potassium (K) fertilizer by 25%. The fertilizer cost was reduced by 15.6% and the net income increased by 14.5% under FPNM. Additionally, fertilizer use efficiency increased by 17.1% for N, 37.5% for P, and 33.7% for K. These improvements were primarily achieved through farmers modifying their fertilizer formulas and increasing the application of organic fertilizer. Importantly, the participation-based management approach was particularly valuable as it effectively incorporated farmers’ management practices and acceptance willingness, making sustainable nutrient management techniques highly applicable in regions with widespread smallholder farming operations.

1. Introduction

As the human population has grown, the demand for various resources has also risen higher and higher. How to make use of limited arable land area to obtain higher yields is an important challenge and focus of study for agricultural scientists [1]. In addition to ensuring food security, people also face the challenge of protecting the environment. To meet these goals, it is necessary to produce more grain with fewer inputs and lower environmental costs [2,3]. Fertilizer is an important factor that can ensure high and stable crop yields. Some farmers over-fertilize in pursuit of yields, but this method does not achieve a satisfactory yield level [4]. According to data from the National Bureau of Statistics of China, the usage of chemical fertilizers in China has been on a steady rise from 2000 to 2015, making the country the world’s largest fertilizer consumer, although the total amount of chemical fertilizers applied has declined since 2015 [5]. Although the application of single-component nitrogen (N) fertilizers has decreased, the use of compound fertilizers still showed an upward trend [5]. However, the increased fertilizer consumption has not brought about corresponding benefits, but rather increased fertilizer loss and environmental pollution [6]. To achieve the goal of green and sustainable agricultural development, it is necessary to further increase the fertilizer use efficiency (FUE) to reduce the amount of fertilizers applied [7].
Many studies have considered how to improve FUE, with research focused on aspects including soil testing and fertilization recommendations, organic fertilizer application, and cultivation techniques [8,9,10,11]. However, it is not enough to focus solely on improving fertilization techniques to improve FUE. For example, studies have shown that the average size of farms in poor countries is much smaller than that in wealthy countries, and the labor productivity is higher on large farms than on small ones, thus having a significant impact on agricultural productivity [12]. It was found that fertilizer use could be reduced by increasing farm size because larger farms were more mechanized, and farmers were more dependent on farm income and more sensitive to the price of fertilizer [13]. In China, farm fields are small in size, and the cultivated land is fragmented. Most of these smallholdings are managed by smallholder farmers, resulting in great differences in soil and management practices between different fields [14]. In China, more than 95% of smallholder farmers have farmland with an area of 3.4 ha or less, and these small farmlands account for more than 80% of the total arable area [15]. The agricultural production and operation by smallholders with numerous fields lead to low marginal benefits of agricultural technology investment and low enthusiasm for the application of agricultural technologies in most smallholder farmers.
So how can these problems be solved? It was found that farmers in China were unable to achieve higher yields by increasing fertilizer use, but they could attain sustainable and eco-friendly agriculture if they received necessary education and training [16]. However, it would be difficult to train a large number of smallholder growers to adopt a science- and evidence-based approach to production problems. Some studies have shown that farmers can be given locally appropriate recommendations and incentivized to adopt them in their production practices, and that farmer participatory management could improve the crop yield and nutrient use efficiency of smallholder farmers [14,17]. Here, a group of smallholder farmers were recruited to participate in a multi-site field trial in the North China Plain to analyze the changes in yield, economic benefits, fertilizer inputs, and FUE. The objective of the work is to evaluate the effectiveness, practicality, and replicability of the technology promotion model of FPNM.

2. Materials and Methods

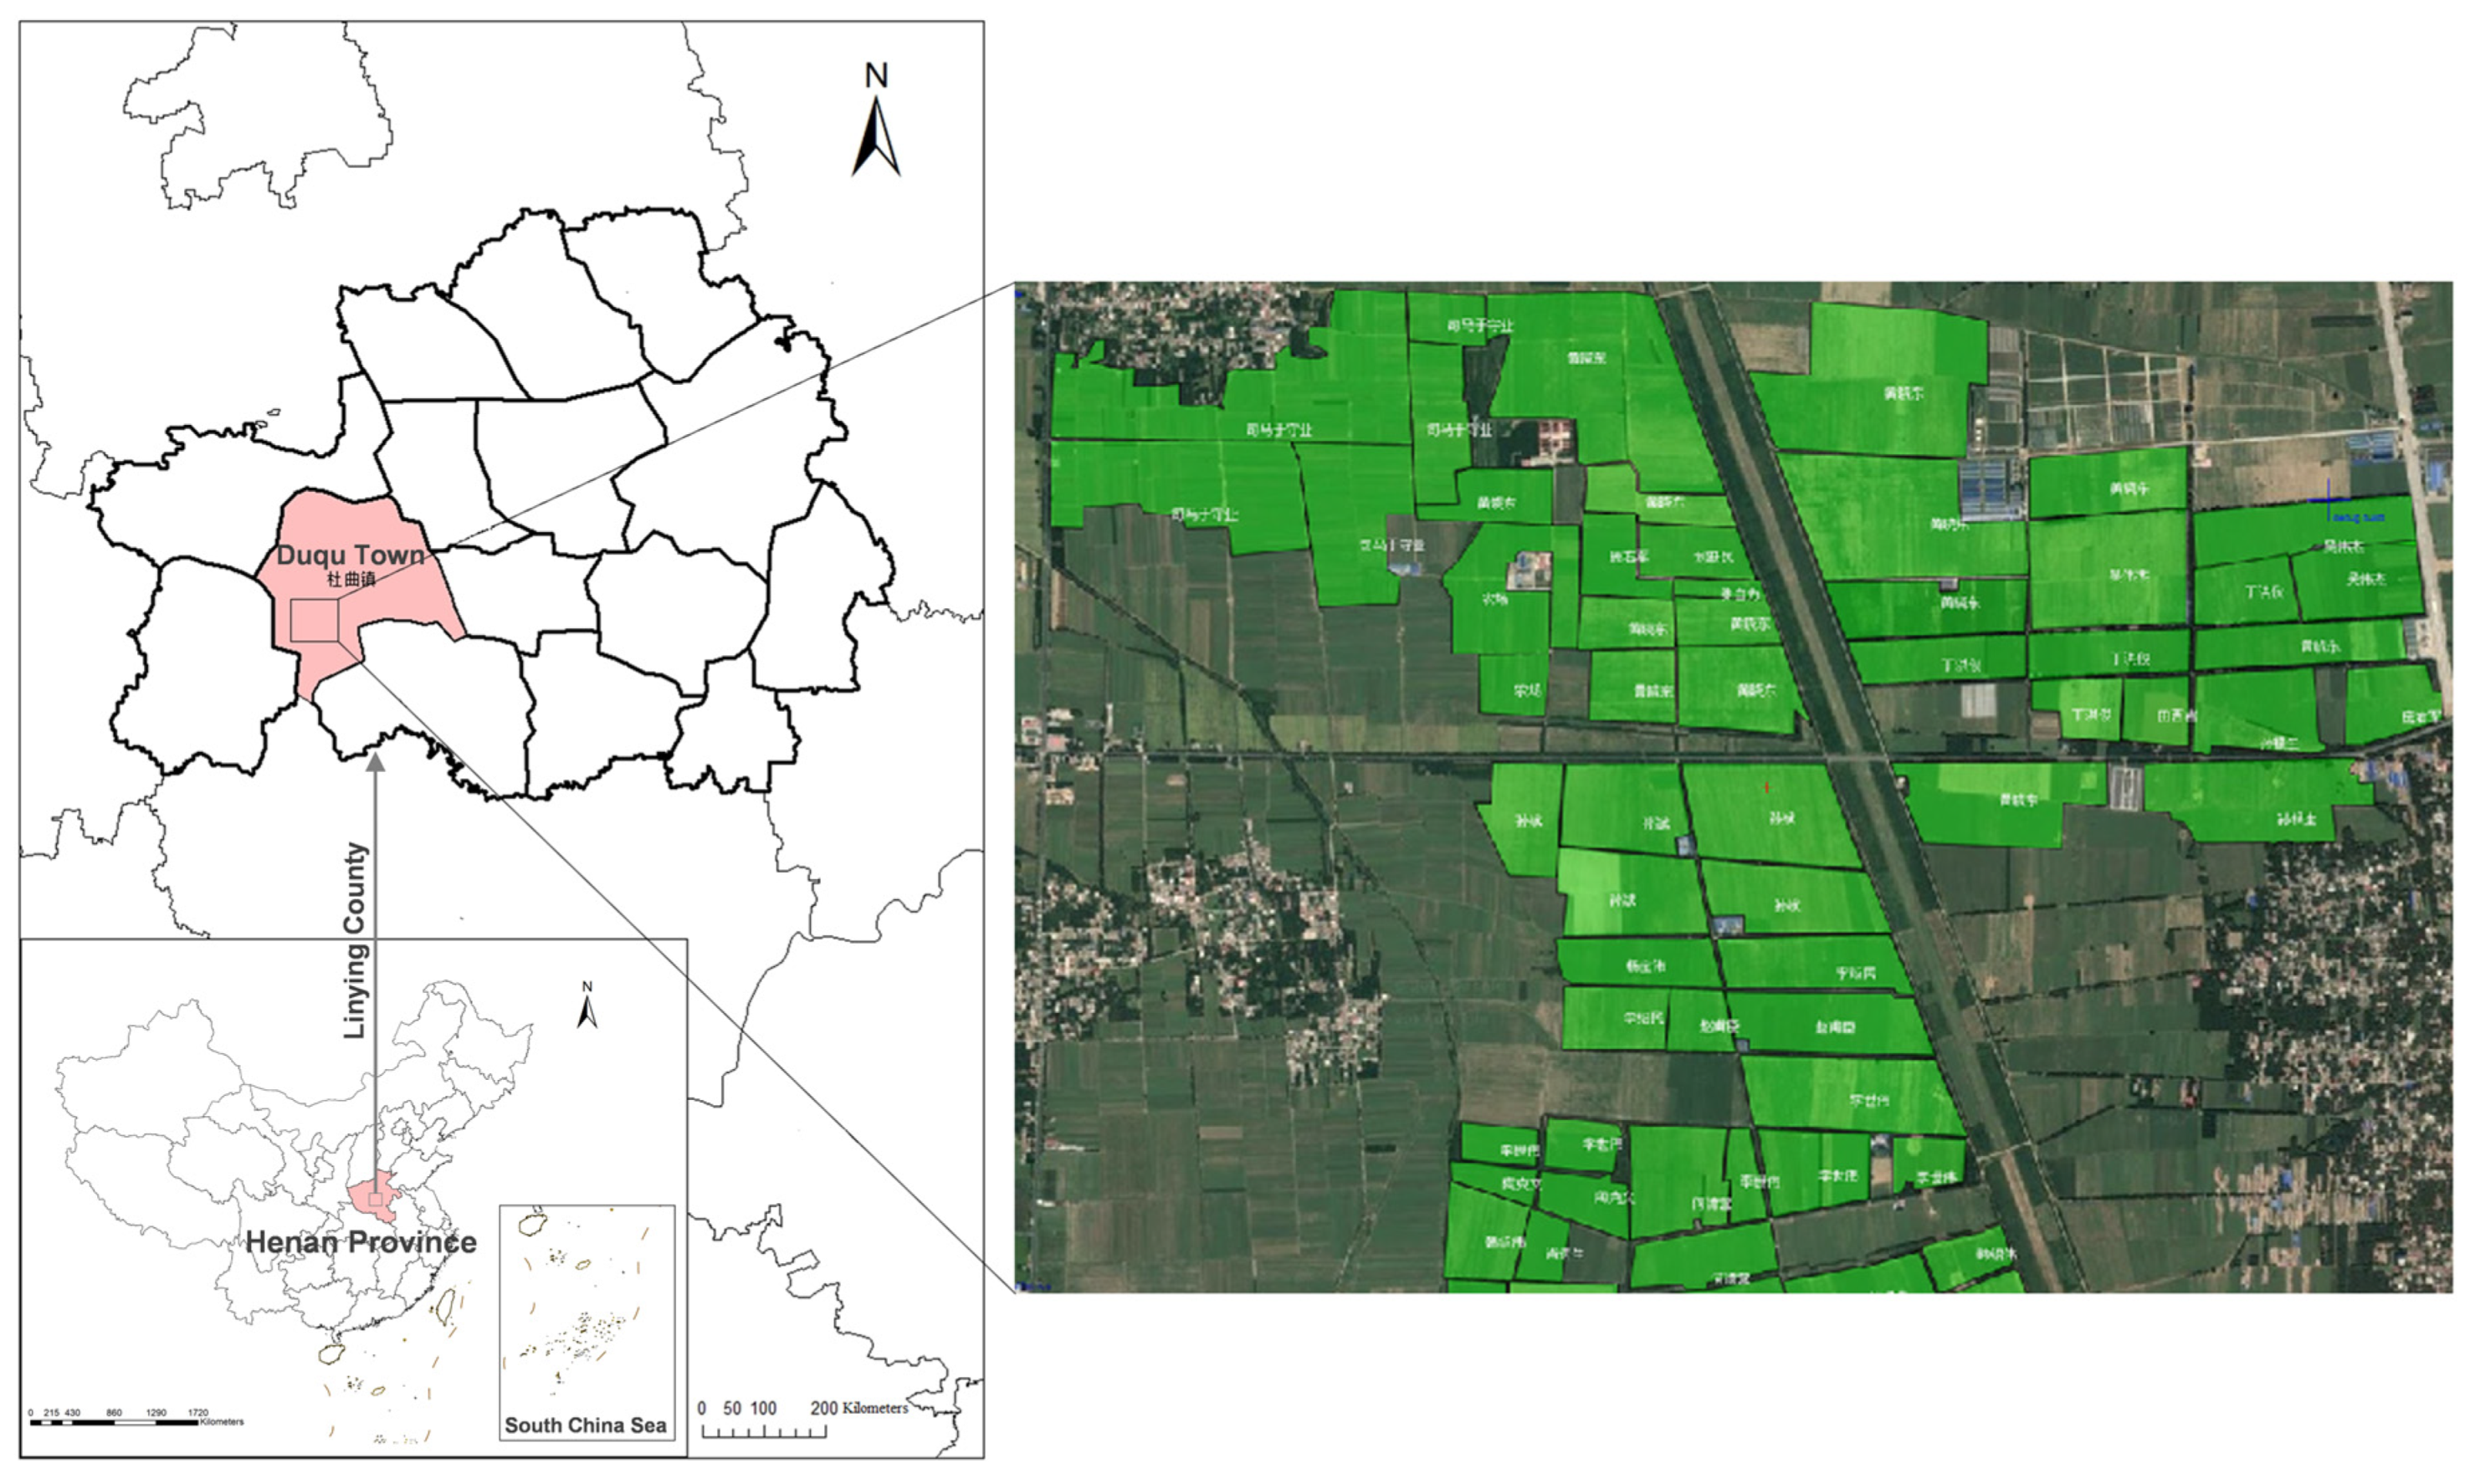
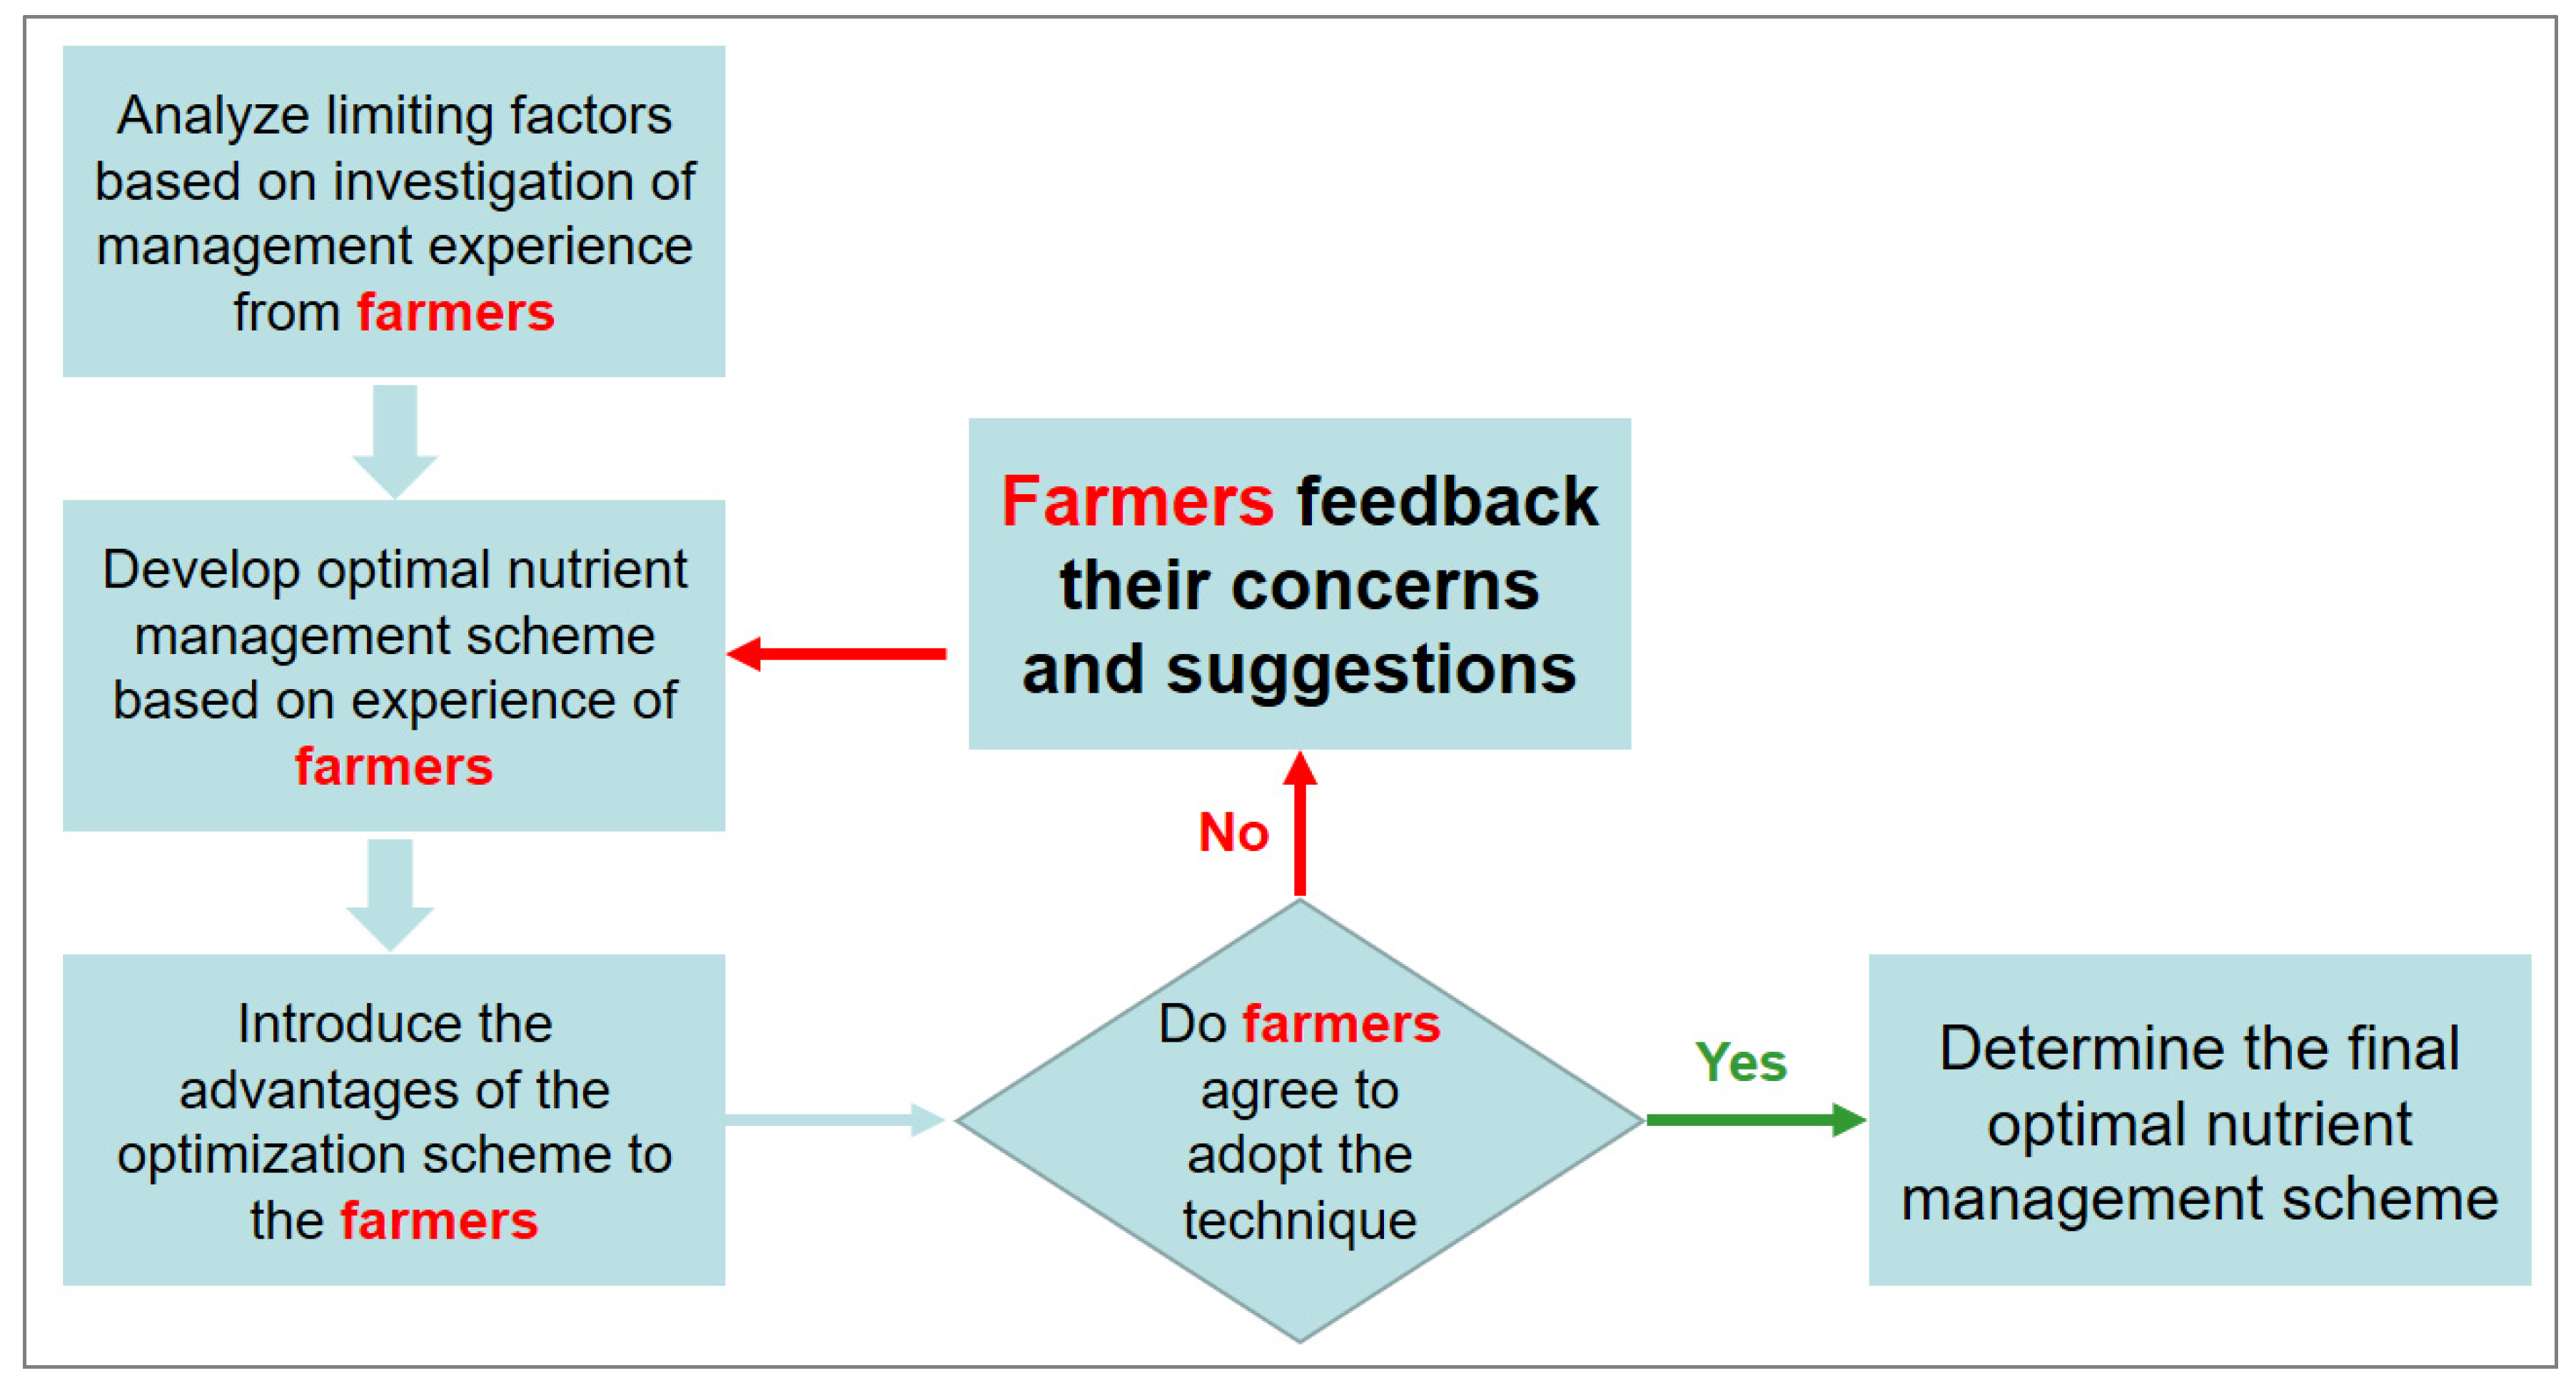
2.1. Experimental Site and Design

The multi-site farmer-participation experiment for this study was conducted in 2017–2018 in a farmer’s field in Duqu Town, Linying County, Henan Province, China (N 33°47′, E 113°50′, Figure 1). The study area has a temperate monsoon climate, with an average annual temperature of 14.5 °C, a frost-free period of 226 days, and an average annual precipitation of 720 mm. The precipitation is affected by the monsoon, with hot and rainy summers and cold and dry winters. The planting system for the field experiment was winter wheat and summer maize rotation. The wheat varieties were determined by farmers, including Xinmai 26, Fengdecunmai 5, and Bainong 207, but varieties for different treatments in the same fields were consistent. The soil type was fluvo-aquic soil with a light clay texture. The average properties of 0–20 cm topsoil before the experiment were 7.3 for pH, 23.5 g/kg for organic matter, 1.68 g/kg for total N, 10.0 mg/kg for available P, and 80.0 mg/kg for available K.
Two treatments consisting of the farmer’s customary nutrient management (FCNM) and FPNM treatment were set up. First of all, the current situation of wheat management such as fertilizer application for farmers was investigated by cooperating with the local agricultural government departments. The preliminary fertilization design of FPNM was based on previous investigations of farms’ management and experimental results conducted in the region, which have strong relevance and can provide guidance for local management [18]. Farmers were recruited through local agro-extension departments and received training so that they would understand the reasons for and advantages of the optimal fertilization plan. The content of the training and discussion included the application rate of N, P, and K fertilizer, formula selection, fertilizer time, and importance of organic fertilizer application. Farmers decided whether to adopt the plan after training and discussion, and opinions and feedback from them were used to refine the plan. A further round of discussion with farmers was organized for the updated optimal fertilization plan until the farmers were assured of accepting the latest plan of FPNM (Figure 2). A total of 71 farmer’s fields were selected, of which 36 fields had both the FCNM and FPNM treatments, while the others only had the FCNM treatments.

2.2. Data Collection and Measurement

The fertilizer formulas based on the labeling of fertilizer products and application rate for both treatments were tracked and recorded in detail for each experiment. The amount of N, P, and K nutrient inputs were calculated from the fertilizer formulas and application rates.
In each field, three sample points were randomly selected at maturity, and a 5 m2 area of wheat in each sample point was harvested and then threshed. The fresh weight and moisture of the grain in each sample square were measured. The standard wheat yield at 13% moisture content was converted uniformly. About 40 g of wheat grains were weighed and counted, and the 1000-grain weight was calculated.

2.3. Data Processing

Partial factor productivity (PFP) of N (PFPN), P (PFPP), and K (PFPK) were used to evaluate FUE, and net income was used to evaluate the economic benefits of wheat planting under different fertilization methods.
PFPN (PFPP, PFPK) = grain yield/N (P, K) fertilizer rate
Net income = grain yield × grain price − fertilizer rate × fertilizer price
The wheat price was calculated at a uniform rate of 0.33 $/kg grain. Fertilizer costs were calculated according to the formula and the amount of fertilizer with 0.62 $/kg N, 0.66 $/kg P2O5, and 0.77 $/kg K2O.
Data were collated using Microsoft Excel 2016, statistically analyzed using IBM SPSS 19.0, and plotted using OriginPro 2018. Differences between treatments were analyzed using one-way ANOVA with multiple comparisons by Duncan’s method at a 5% significance level.

3. Results

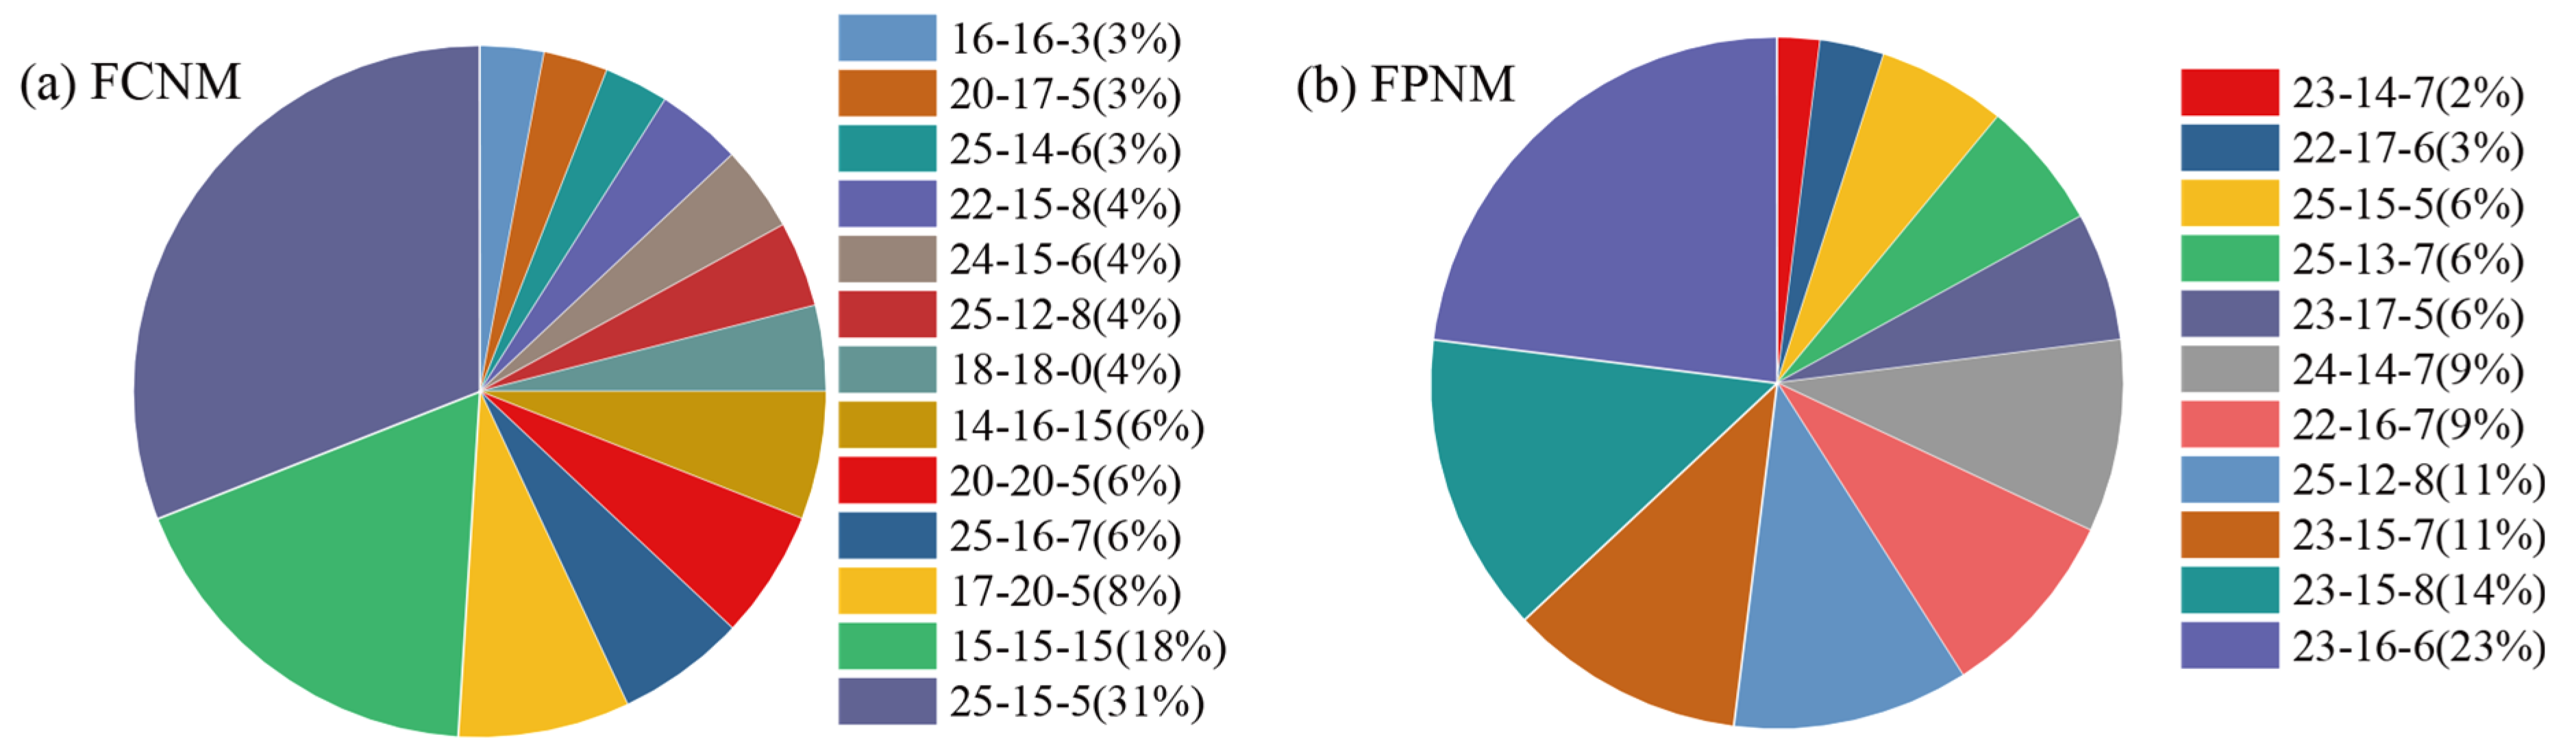
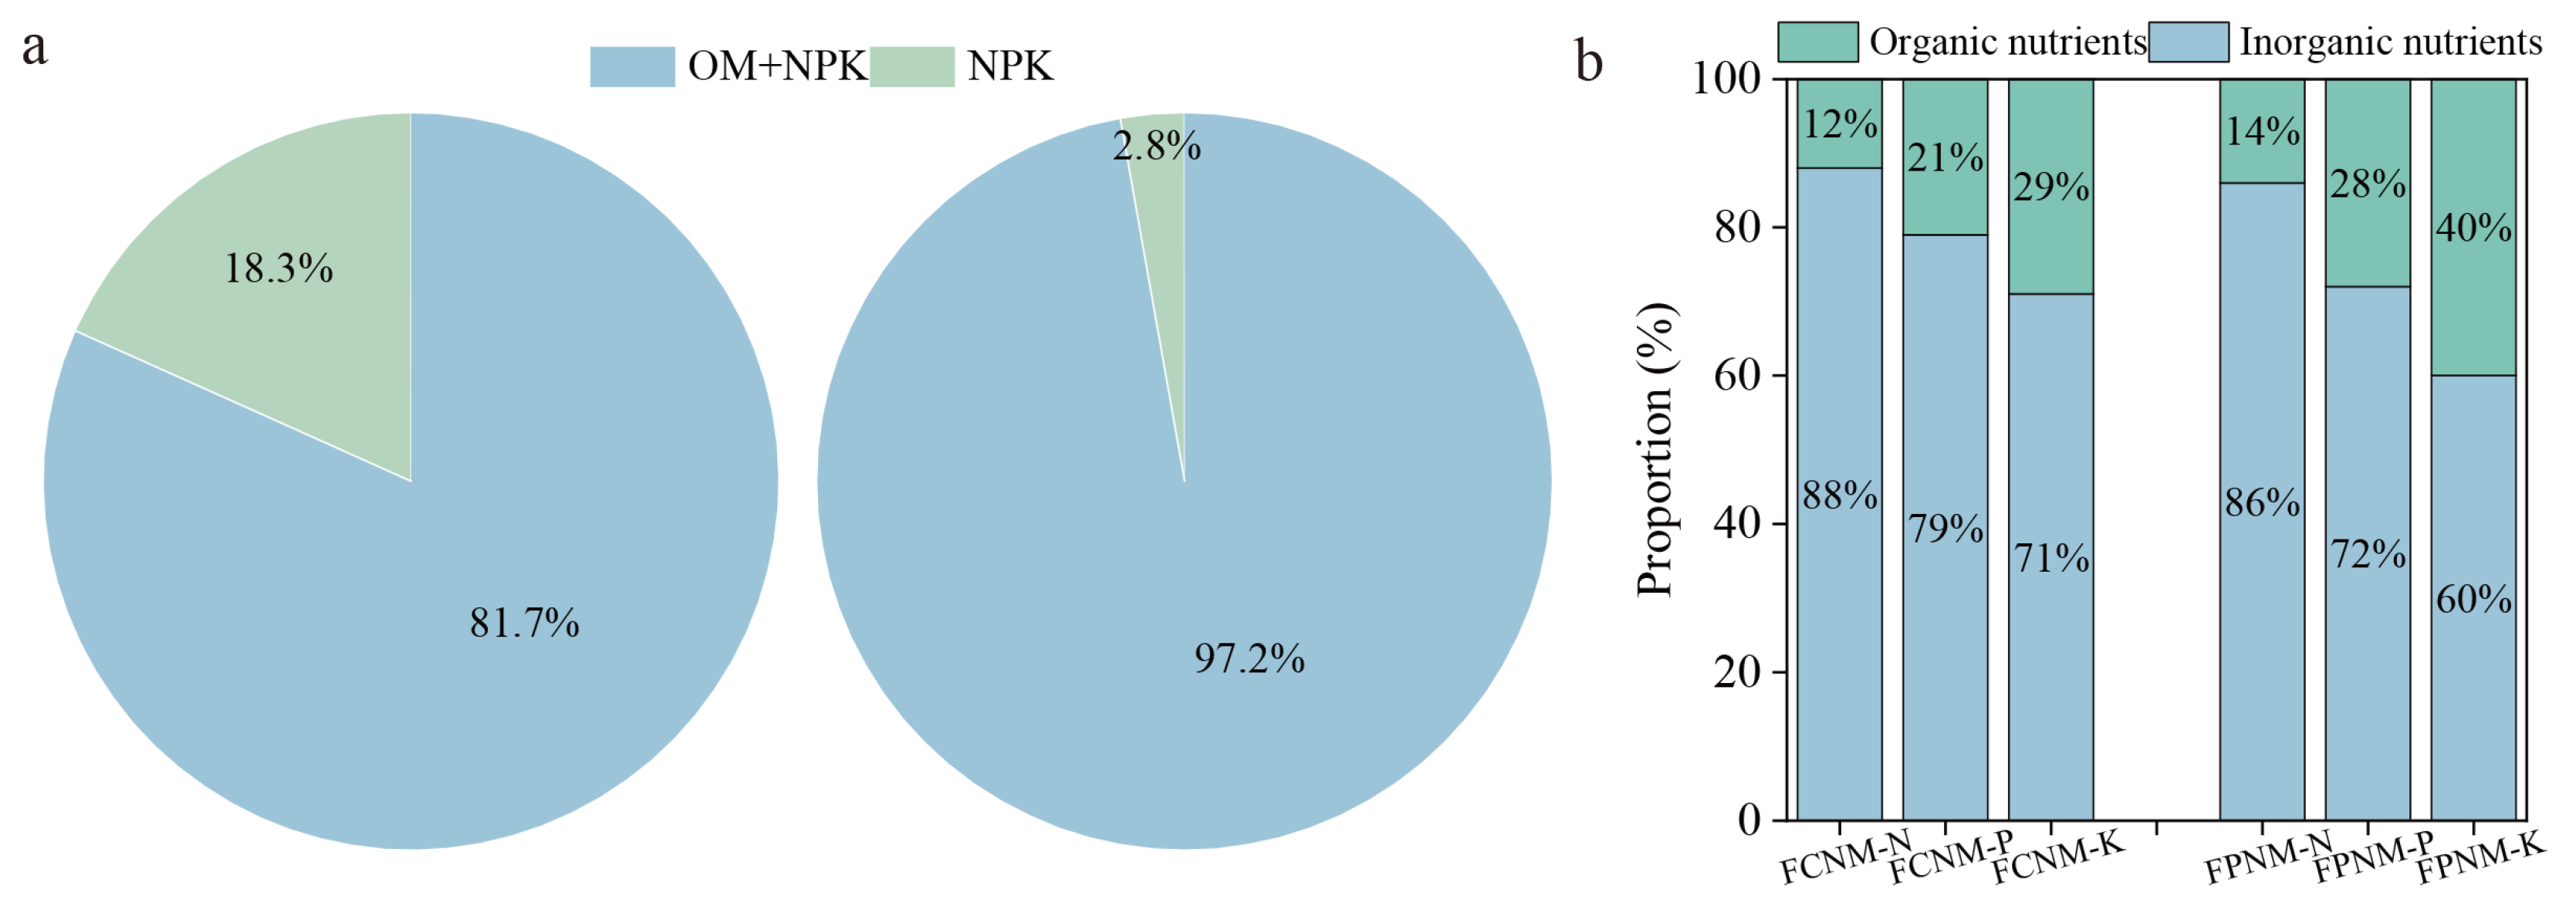
3.1. Fertilizer Formulations

According to the records, 13 fertilization formulas were used for the FCNM treatment, and the NPK content of the formulas varied greatly. The high-N formula of 25-15-5 NPK and the balanced formula of 15-15-15 NPK accounted for 31% and 18% of formulas used in the FCNM treatment, respectively. Together, the two formulations accounted for 49%, while the remaining formulas accounted for 51%, of which the proportion of each formula did not exceed 8% (Figure 3a). The N concentration for formulations used in the FPNM treatment ranged from 22% to 25%. The most commonly used formulations were 23-16-6 (23%) and 23-15-8 (14%), formulations of 23-15-7 and 25-12-8 accounted for 11%, formulations of 22-16-7 and 24-14-7 accounted for 9%, and other formulations accounted for less than or equal to 6% (Figure 3b).

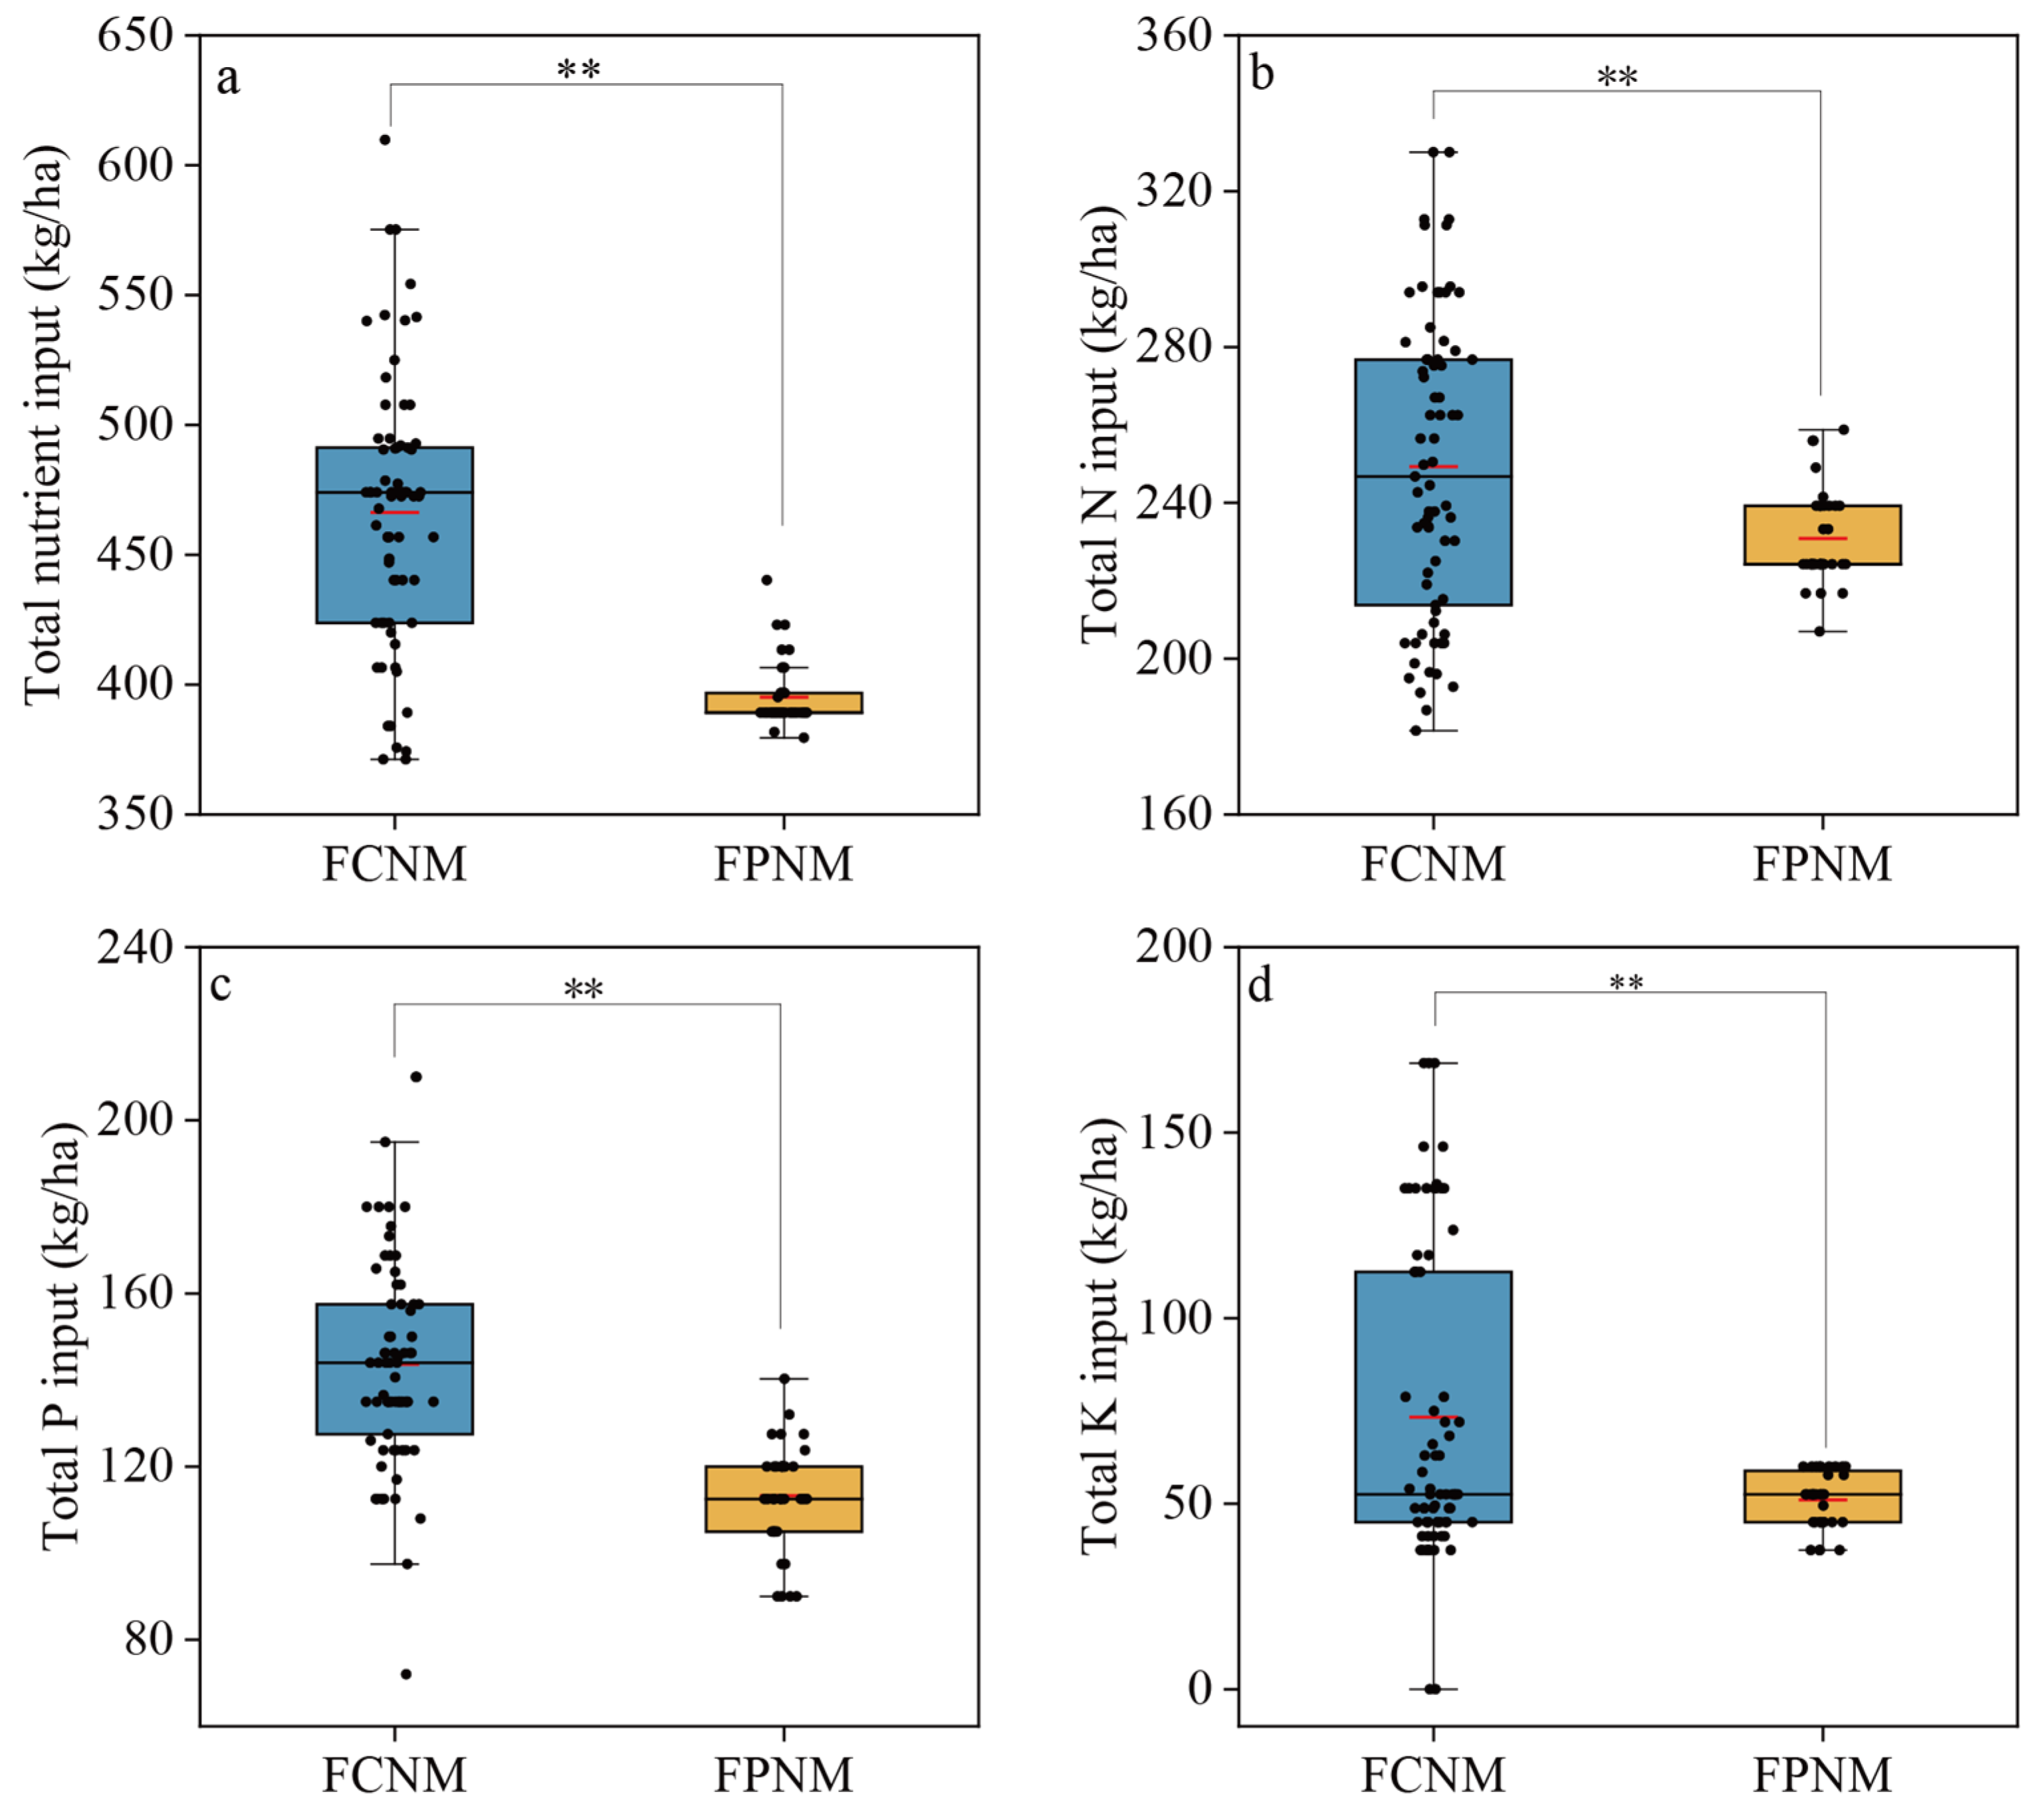
3.2. Nutrient Inputs from Chemical Fertilizer

Under FCNM treatment, the total amount of N, P, and K was high and greatly variable, ranging from 371.3 to 609.7 kg/ha with a mean value of 525.1 kg/ha. The NPK inputs for FPNM ranged from 379.5 to 423.1 kg/ha with a mean value of 395.2 kg/ha, which was 24.7% lower than that of FCNM (Figure 4a). The mean values of the N, P, and K inputs for the FCNM treatments were 249.3, 143.4, and 73.3 kg/ha, respectively, and ranged from 181.5 to 330.0, 72.0 to 210.0, and 0 to 168.8 kg/ha, respectively. The N, P, and K inputs for the FPNM treatments ranged from 207.0 to 258.8, 90.0 to 140.3, and 37.5 to 60.0 kg/ha, respectively, and averaged 223.9, 113.3, and 54.8 kg/ha, respectively. Compared with the FCNM, the FPNM treatment reduced N, P, and K fertilizer inputs by 10%, 21%, and 25%, respectively (Figure 4b–d). In addition, FPNM reduced the variability of nutrient inputs.

3.3. Organic Fertilizer Application

In total, 97.2% of farmers applied chemical plus organic fertilizer in the FPNM treatment, and 2.8% applied chemical fertilizer only; these proportions were 81.7% and 18.3%, respectively, for the FCNM treatment (Figure 5a). The proportions of N, P, and K inputs through organic fertilizer were 14%, 28%, and 40% in the FPNM treatment, respectively, which were higher than those in the FCNM treatment (Figure 5b).

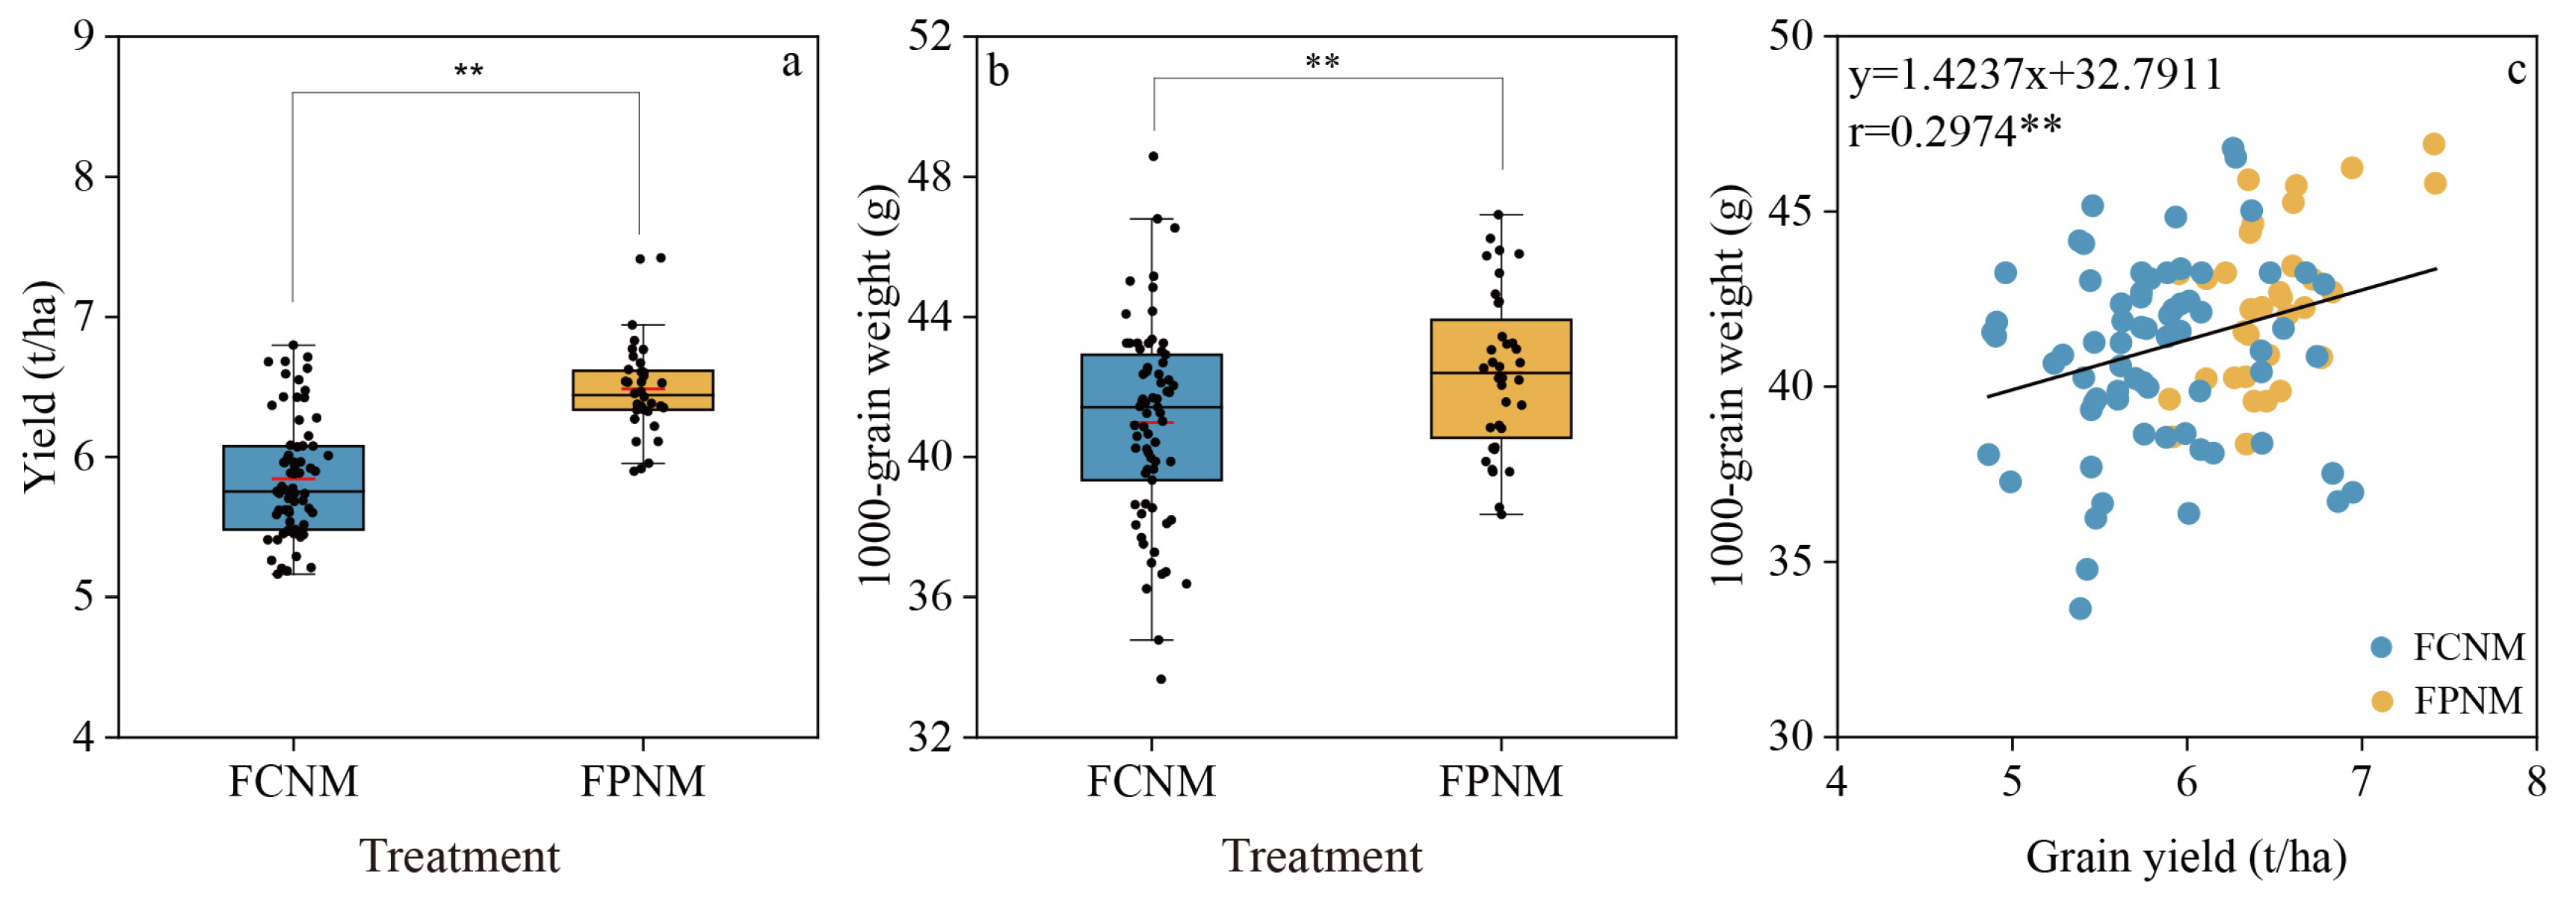
3.4. Wheat Grain Yield

The average yield under the FCNM treatment was 5.85 t/ha, with a range of 5.16–6.80 t/ha, while the wheat yield under FPNM averaged 6.49 t/ha with a range of 5.91–7.42 t/ha, which was 10.9% higher than in the FCNM treatment (Figure 6a). The 1000-grain weight of winter wheat ranged from 33.7 to 48.6 g for the FCNM treatment, with an average of 41.1 g, and from 38.4 to 46.9 g with an average value of 42.4 g for the FPNM treatment (Figure 6b). There was a significant positive correlation between wheat yield and 1000-grain weight in all the treatments (Figure 6c).

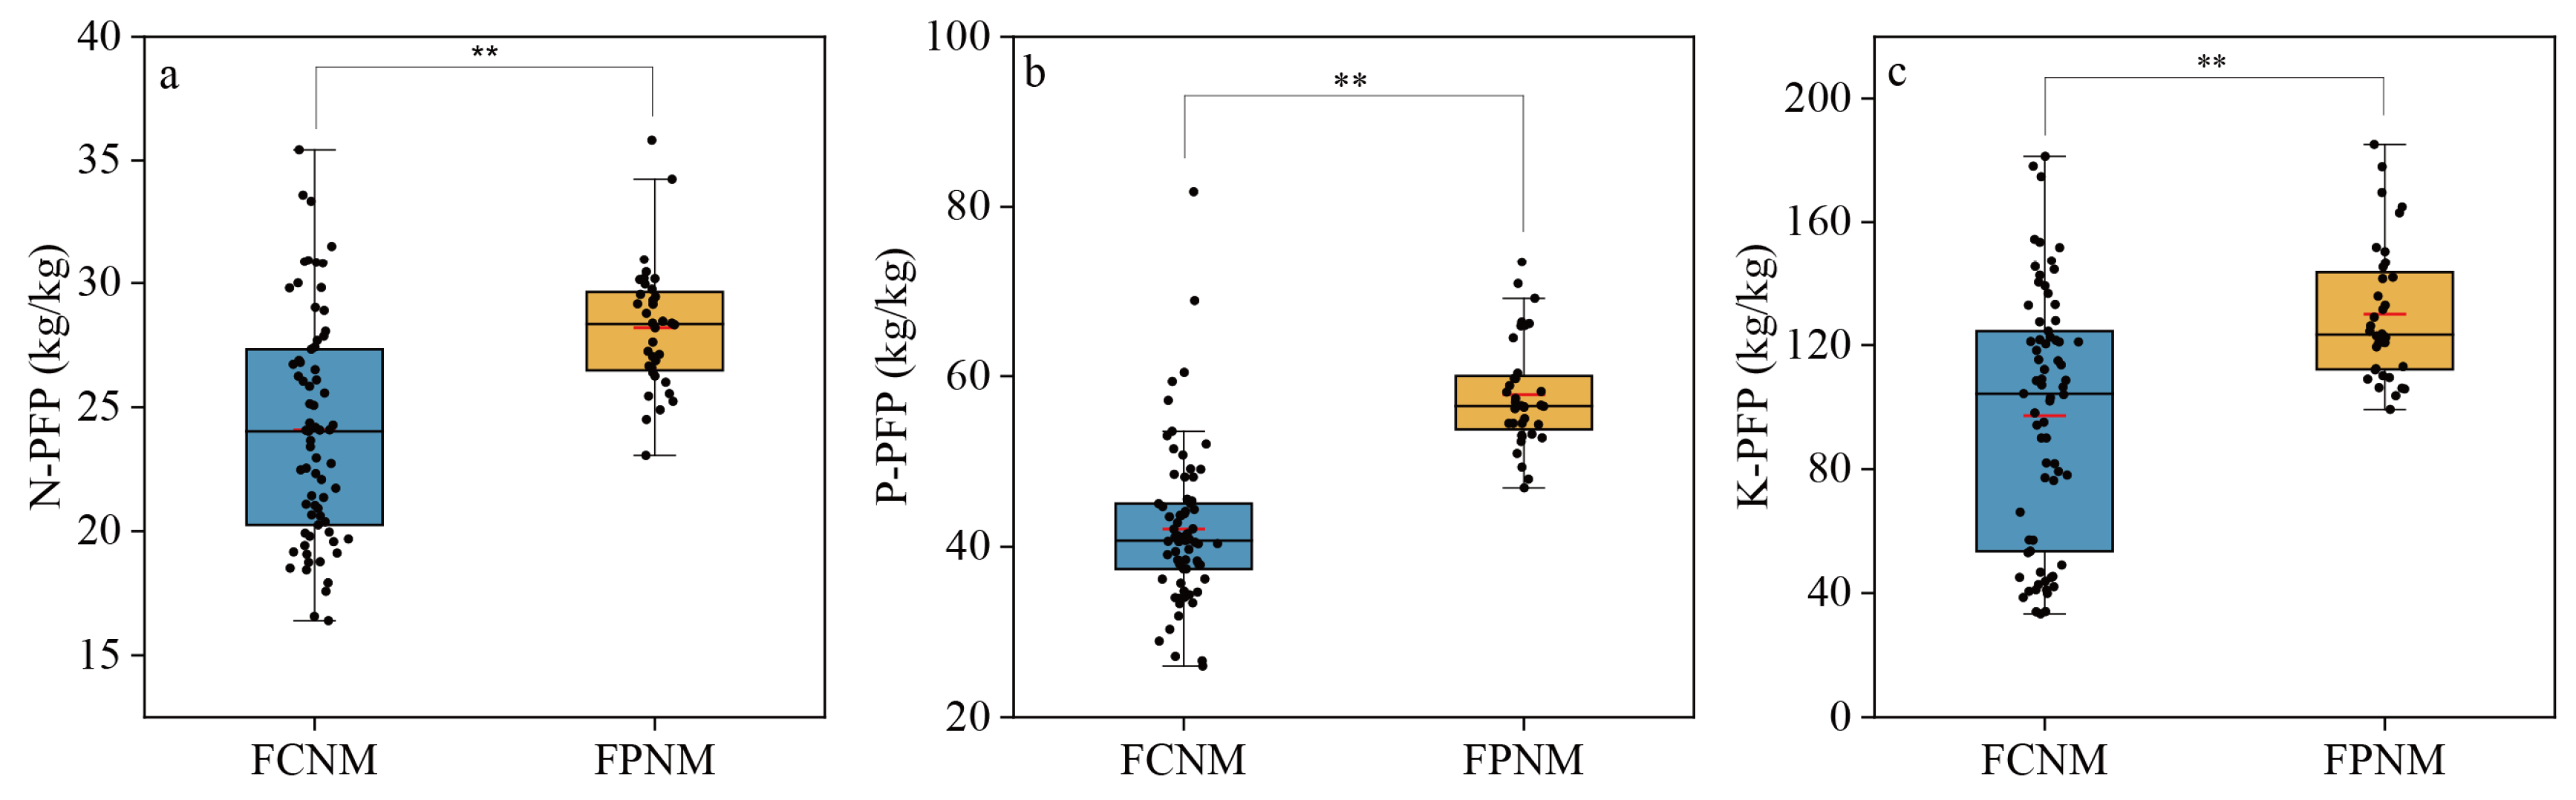
3.5. PFPN, PFPP, and PFPK

The N-PFP, P-PFP, and K-PFP of the FPNM were significantly higher than under the FCNM (Figure 7). Under the FCNM, the range of N-PFP was 16.4–35.4 kg/kg, with a mean value of 24.1 kg/kg, while the range of N-PFP under the FPNM was 23.5–35.8 kg/kg with a mean value of 28.2 kg/kg, improving by 17.1% compared with the FCNM (Figure 7a). The mean value of P-PFP under FCNM was 42.1 kg/kg, with a range of 26.0–81.7 kg/kg, while P-PFP ranged from 46.9 to 73.4 kg/kg with a mean value of 57.8 kg/kg under FPNM, which was 37.5% higher than that under FCNM (Figure 7b). The K-PFP averaged 110.0 kg/kg, with great variation of 33.3–181.3 kg/kg under the FCNM, while the K-PFP averaged 130.0 kg/kg with a range of 99.3–185.2 kg/kg under the FPNM, which was 33.7% higher than that under the FCNM (Figure 7c).

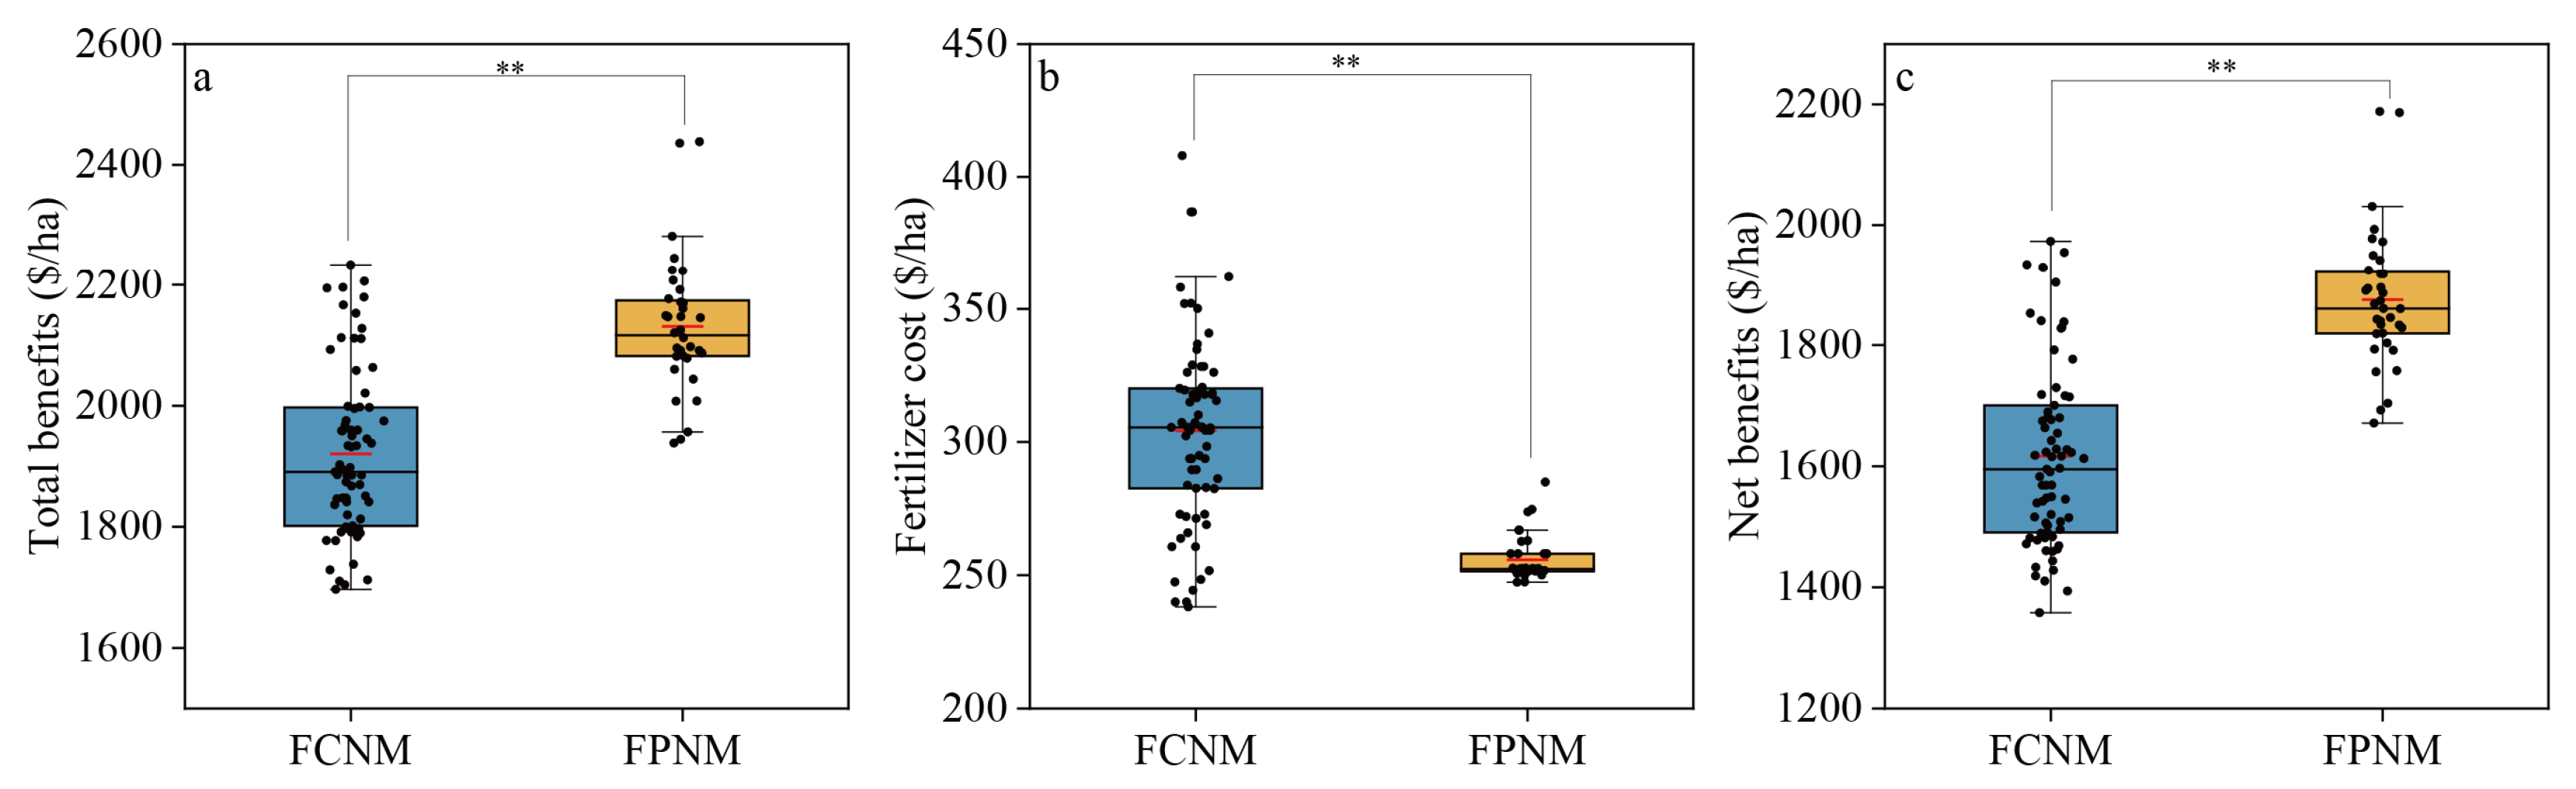
3.6. Economic Benefits

The FPNM could achieve gross economic benefits of 2131 $/ha with a variation of 1938–2438 $/ha, while the FCNM treatment could reach an economic value of 1916 $/ha, with a variation of 1697–2234 $/ha (Figure 8a). In terms of fertilizer costs, the average input was 255 $/ha for FPNM, lower than 302 $/ha for FCNM, saving 15.6% (Figure 8b). The net benefits for FPNM reached 1852 $/ha, with a range of 1671–2188 $/ha, which was significantly higher than the FCNM treatment of 1616 $/ha with a range of 1394–2234 $/ha. Therefore, FPNM could increase farmers’ income by 236 $/ha, or 14.5%, compared with FCNM (Figure 8c).

4. Discussion

With less than 10% of the world’s arable land, China feeds more than 20% of the world’s population. This level of productivity comes at a high cost in terms of resource depletion and environmental degradation. China is projected to face heightened pressure by 2030 due to population growth and declining productivity [20]. To address future challenges, China needs to promote practical technologies to obtain more food output from limited arable land while emphasizing resource efficiency and environmental sustainability [3]. Achieving this goal requires adopting technical tools such as efficient nutrient management and soil quality improvement, coupled with government policy support, to foster sustainable and intensive agricultural development [11,21]. These measures aim to shift China’s grain production from high-input, high-output models to lower, more refined input systems.
The results of the multi-site experiment show that the FPNM treatment can increase wheat yield while reducing fertilizer input, thus achieving increases in yield and income as well as cost savings and an efficiency increase. This is mainly because (1) soil nutrient supply and crop demand can be matched and a balance between nutrients can be achieved by adjusting fertilizer formulations, and (2) encouraging farmers to apply more organic fertilizer can improve soil fertility [10]. In China, farm managers are generally older, have a low education level, and lack professional knowledge. As a result, most farmers do not have extensive knowledge about crop nutrient absorption, soil nutrient supply, and fertilizer application technology, which leads to difficulty in selecting the optimal fertilizer formula [22]. Based on the local climate and soil conditions, the FPNM model was able to propose appropriate nutrient management solutions in combination with the results of previous local research [18]. Therefore, the FPNM can not only increase yield and income, but can also reduce fertilizer application, save costs, and improve FUE.
The results of the present study showed that the 1000-grain weight of wheat under FPNM was significantly higher than that obtained under FCNM, which was an important reason for the wheat yield increase under optimized management. The middle and late growth periods of wheat are the most important periods affecting grain weight [23]. By optimizing the fertilization formula, reducing the amount of chemical fertilizer, and combining chemical and organic fertilizer, it is possible to avoid the lodging and diseases caused by excessive chemical fertilizer application [18,24]. Achieving these goals is very important to improve grain filling and increase yield in the middle and late growth period of wheat. In this study, the overall yield of wheat was lower than that in recent years, which was mainly due to the relatively serious freezing stress and Fusarium head scab that occurred in the experiment year. However, the stress resistance of wheat could be improved through nutrient optimization management [18]. In addition, it was found that the proportion of local farmers using organic fertilizer was very high, much higher than the survey results in other regions [25]. This was mainly because the local government adopted an organic fertilizer subsidy policy. It can be seen that the government’s policy support is an important means to encourage farmers to change their fertilization practices and promote sustainable agricultural development.
The problems of small farm operations in addition to land fragmentation and discontinuity are quite prominent. To some extent, these issues increase the cost of many agricultural technologies and reduce their adoption rate. Although intensive agricultural production can be promoted through land transfer, this issue has not been well solved due to cost and policy restrictions [26]. These problems are important obstacles to the spread of many agricultural technologies. For example, techniques such as soil testing and formula fertilization can help farmers understand soil nutrient supply and apply the optimal fertilizer to improve yields. However, when dealing with many scattered fields, soil testing would be too expensive [27]. Some studies have recommended fertilization methods for different regions, but owing to the great differences in the fertility of scattered fields, precise fertilization is still difficult to achieve, and its effect will be greatly reduced. In addition, the low profits from agriculture, especially profits from growing food crops, have led to a lack of interest among farmers in adopting new technologies. A lack of agricultural knowledge and conservative thinking has made many farmers reluctant to adopt new technologies [28].
A regional-specific fertilizer formula is developed based on the practical climate and soil characteristics to ensure broad applicability [29]. Following training sessions, the experimental farmer adjusted their fertilizer application practices to better suit regional-specific conditions, resulting in cost savings and increased productivity. At present, farmers’ demand for technology is shifting toward options with low labor intensity, low technical complexity, and low-cost investment [9]. Therefore, agricultural technology should be tailored to farmers’ needs to enhance its potential for widespread adoption. When implementing farmer-participation nutrient management and technology extension, the plan should be adapted to local agricultural practices, with benefits explained to farmers through training and discussion [30]. After discussion, fertilizer recommendations should allow for some compromises based on farmers’ input, leveraging their practical experience, considering the adaptability of technology to local conditions, meeting the technological needs of different farmers, and breaking the trust barrier in the process of communication with farmers. The existing agricultural technology research and extension system in small-scale farming areas has faced challenges such as communication gaps, lagging methods, and insufficient adaptability. By leveraging farmer-participatory technology innovation and extension, farmers’ concerns can be effectively addressed, thereby narrowing the yield gap and enhancing crop yields and FUE [17]. This approach is crucial not only for achieving food production and resource efficiency goals but also for promoting technology diffusion and application [19].

5. Conclusions

The results of the multi-point field trial demonstrated that optimizing fertilization based on farmer participation could increase crop yields while reducing chemical NPK fertilizer inputs, thereby lowering fertilizer costs and increasing farmers’ net income through improved fertilizer use efficiency. Additionally, FPNM narrowed the variability of farmer’s nutrient inputs by encouraging the adoption of more rational formula fertilizer and organic fertilizer. Importantly, this participatory approach is easily extensible due to its alignment with farmers’ preferences and management practices. This study underscores the potential of FPNM for widespread adoption of sustainable agricultural practices. Future research should prioritize the following: first, evaluating the long-term effects of environment, crop quality, and farmers’ fertilization behavior from this technology diffusion mode; second, fostering multistakeholder collaboration, including government and private sectors, to jointly address the economic and human resource challenges; and third, advancing nutrient management technology innovation by integrating climatic, soil, crop variety, and environmental change with digital and intelligent technologies to develop dynamic models, thereby enhancing FPNM applicability, cost-effectiveness, convenience, and timeliness.

Author Contributions

Conceptualization, Y.Y. and Y.Z.; Methodology, Z.R., H.Z., Q.W. and Y.Z.; Formal analysis, H.L. and Q.W.; Investigation, H.Z., H.L. and Q.W.; Resources, H.Z. and Y.H.; Data curation, Z.R. and Q.W.; Writing—original draft, Z.R., H.Z. and H.L.; Writing—review & editing, Y.Z.; Supervision, Y.H. and Y.Z.; Project administration, Y.Z.; Funding acquisition, Y.Y. All authors have read and agreed to the published version of the manuscript.

Funding

This research was funded by the National Key Research and Development Program of China (2021YFD1901000, 2017YFD0200107), and Postgraduate Education Reform and Quality Improvement Project of Henan Province (YJS2023JD19).

Institutional Review Board Statement

Not applicable.

Informed Consent Statement

Not applicable.

Data Availability Statement

Data are contained within the article.

Conflicts of Interest

The authors declare no conflict of interest.

References

  1. Tilman, D.; Balzer, C.; Hill, J.; Befort, B.L. Global food demand and the sustainable intensification of agriculture. Proc. Natl. Acad. Sci. USA 2011, 50, 20260–20264. [Google Scholar] [CrossRef]
  2. Mueller, N.D.; Gerber, J.S.; Johnston, M.; Ray, D.K.; Ramankutty, N.; Foley, J.A. Closing yield gaps through nutrient and water management. Nature 2012, 7419, 254–257. [Google Scholar] [CrossRef] [PubMed]
  3. Chen, X.; Cui, Z.; Fan, M.; Vitousek, P.; Zhao, M.; Ma, W.; Wang, Z.L.; Zhang, W.J.; Yan, X.Y.; Yang, J.C.; et al. Producing more grain with lower environmental costs. Nature 2014, 7523, 486–489. [Google Scholar] [CrossRef]
  4. Yu, J.; Hou, P.; Gao, Q.; Tan, Q.; Jiang, D.; Dai, T.; Tian, Z. Optimizing nitrogen fertilizer and straw management promote root extension and nitrogen uptake to improve grain yield and nitrogen use efficiency of winter wheat (Triticum aestivum L.). Arch. Agron. Soil Sci. 2024, 70, 1–17. [Google Scholar] [CrossRef]
  5. National Bureau of Statistics of the People’s Republic of China. China Statistical Yearbook; Statistics Press: Beijing, China, 2021.
  6. Yan, L.; Wang, Y.Y.; Tumbalam, P.; Zhang, T.L.; Gao, Q.; Zhang, W.J.; Wei, D.M.; Yaa, O.K. Spatiotemporal distribution of chemical fertilizer application and manure application potential in China. Environ. Eng. Sci. 2019, 10, 1337–1348. [Google Scholar] [CrossRef]
  7. Liu, C.; Zhu, T.; Xin, L. Effectiveness of agricultural technology services on fertilizer reduction in wheat production in China. Sustainability 2025, 17, 2840. [Google Scholar] [CrossRef]
  8. Ejigu, D.; Pushpalatha, R.; Jayaprakash, S.K.; Gangadharan, B.; Himanshu, S.K.; Gopakumar, S. Integrated fertilizers for sustainable wheat production to improve food security—A comprehensive review. J. Plant Nutr. Soil Sci. 2025, 188, 5–16. [Google Scholar] [CrossRef]
  9. Sanyaolu, M.; Sadowski, A. The role of precision agriculture technologies in enhancing sustainable agriculture. Sustainability 2024, 16, 6668. [Google Scholar] [CrossRef]
  10. Sheoran, S.; Prakash, D.; Yadav, P.K.; Siddiqui, M.H.; Alamri, S.; Gupta, R.K. Grain quality, wheat productivity and microbial properties in sandy loam soil under pearl millet-wheat sequence: Long-term effects of organic manure and fertilizer N application. Arch. Agron. Soil Sci. 2025, 71, 1–17. [Google Scholar] [CrossRef]
  11. Fernández-Ortega, J.; Álvaro-Fuentes, J.; Cantero-Martínez, C. The use of double-cropping in combination with no-tillage and optimized nitrogen fertilization reduces soil N2O emissions under irrigation. Sci. Total Environ. 2023, 857, 159458. [Google Scholar] [CrossRef]
  12. Adamopoulos, T.; Restuccia, D. The size distribution of farms and international productivity differences. Am. Econ. Rev. 2014, 6, 1667–1697. [Google Scholar] [CrossRef]
  13. Ju, X.T.; Gu, B.J.; Wu, Y.Y.; Galloway, J.N. Reducing China’s fertilizer use by increasing farm size. Glob. Environ. Change 2016, 41, 26–32. [Google Scholar] [CrossRef]
  14. Cui, Z.L.; Zhang, H.Y.; Chen, X.P.; Zhang, C.C.; Ma, W.Q.; Huang, C.D.; Zhang, W.F.; Mi, G.H.; Miao, Y.X.; Li, X.L.; et al. Pursuing sustainable productivity with millions of smallholder farmers. Nature 2018, 7696, 363–366. [Google Scholar] [CrossRef]
  15. Zhao, C.J. Current situations and prospects of smart agriculture. J. South China Agric. Univ. 2021, 6, 1–7. [Google Scholar]
  16. Li, S.; Lei, Y.D.; Zhang, Y.Y.; Liu, J.G.; Shi, X.Y.; Jia, H.; Wang, C.; Chen, F.; Chu, Q.Q. Rational trade-offs between yield increase and fertilizer inputs are essential for sustainable intensification: A case study in wheat-maize cropping systems in China. Sci. Total Environ. 2019, 679, 328–336. [Google Scholar] [CrossRef] [PubMed]
  17. Zhang, W.F.; Cao, G.X.; Li, X.L.; Zhang, H.Y.; Wang, C.; Liu, Q.Q.; Chen, X.P.; Cui, Z.L.; Shen, J.B.; Jiang, R.F.; et al. Closing yield gaps in China by empowering smallholder farmers. Nature 2016, 7622, 671–674. [Google Scholar] [CrossRef]
  18. Li, H.J.; Wu, Q.H.; Zhao, Y.N.; Ye, Y.L.; Huang, Y.F. Effects of different formula fertilizers on population dynamics, stress resistance and grain yield of winter wheat. Soil Fertil. Sci. China 2021, 3, 300–307. [Google Scholar]
  19. An, Z.; Yang, Y.; Yang, X.; Ma, W.; Li, Y.; Chen, G.; Zhang, W.; Zhuang, M.; Wang, C.; Zhang, F. Promoting sustainable smallholder farming via multistakeholder collaboration. Proc. Natl. Acad. Sci. USA 2024, 121, e2319519121. [Google Scholar] [CrossRef]
  20. Chen, A.Q.; He, H.X.; Wang, J.; Li, M.; Guan, Q.C.; Hao, J.M. A study on the arable land demand for food security in China. Sustainability 2019, 11, 4769. [Google Scholar] [CrossRef]
  21. Jiao, X.Q.; He, G.; Cui, Z.L.; Shen, J.B.; Zhang, F.S. Agri-environment policy for grain production in China: Toward sustainable intensification. China Agric. Econ. Rev. 2018, 1, 78–92. [Google Scholar] [CrossRef]
  22. Cao, G.X. Study on the Restricting Factors and Countermeasures for Sustainable Intensified Grain Production Technology Application in Smallholder Farming System. Ph.D. Dissertation, China Agricultural University, Beijing, China, 2015. [Google Scholar]
  23. Mirosavljević, M.; Mikić, S.; Špika, A.K.; Župunski, V.; Zhou, R.; Abdelhakim, L.; Ottosen, C.O. The effect of heat stress on some main spike traits in 12 wheat cultivars at anthesis and mid-grain filling stage. Plant Soil Environ. 2021, 2, 71–76. [Google Scholar] [CrossRef]
  24. Zhao, X.; Hu, Y.; Liang, B.; Chen, G.; Feng, L.; Pu, T.; Sun, X.; Yong, T.; Liu, W.; Liu, J.; et al. Coordination of density and nitrogen fertilization improves stalk lodging resistance of strip-intercropped maize with soybeans by affecting stalk quality traits. Agriculture 2023, 13, 1009. [Google Scholar] [CrossRef]
  25. Dang, G.; Wang, Z. Organic fertilizer application in wheat production of China: History, bottleneck, and strategy. J. Plant Nutr. Fertil. 2025, 1, 12–31. [Google Scholar]
  26. Lu, H. Research on the Impact of Land Fragmentation, off Farm Labor Supply on Land Transfer. Ph.D. Dissertation, Nanjing Agricultural University, Nanjing, China, 2017. [Google Scholar]
  27. Faruque, A.S.; Huang, Z.H.; Karimanzira, T.T.P. Investigating key factors influencing farming decisions based on soil testing and fertilizer recommendation facilities (STFRF)—A case study on rural Bangladesh. Sustainability 2018, 10, 4331. [Google Scholar] [CrossRef]
  28. Yu, W.Z.; Luo, X.F. Farming experience and farmers’ adoption of low-carbon management practices: The case of soil testing and fertilizer recommendations in China. Environ. Sci. Pollut. Res. 2022, 5, 6755–6765. [Google Scholar] [CrossRef]
  29. Hu, J.; Yang, Y.; Zhang, H.; Li, Y.; Zhang, S.; He, X.; Huang, Y.; Ye, Y.; Zhao, Y.; Yan, J. Reduction in nitrogen rate and improvement of nitrogen use efficiency without loss of peanut yield by regional mean optimal rate of chemical fertilizer based on a multi-site field experiment in the North China Plain. Plants 2023, 12, 1326. [Google Scholar] [CrossRef]
  30. Cerf, M.; Jeuffroy, M.H.; Prost, L.; Meynard, J.M. Participatory design of agricultural decision support tools: Taking account of the use situations. Agron. Sustain. Dev. 2012, 4, 899–910. [Google Scholar] [CrossRef]
Figure 1. Experimental site. The fields marked in light green on the right of the figure participated in the experiment.
Sustainability 17 03481 g001
Figure 2. Framework of farmer-participatory nutrient management (FPNM) adapted with permission from ref. [19].
Sustainability 17 03481 g002
Figure 3. Fertilizer formulas and their proportion for the farmer’s customary nutrient management (FCNM) (a) and farmer-participation nutrient management (FPNM) (b).
Sustainability 17 03481 g003
Figure 4. Total fertilizer (a), N (b), P (c), and K inputs (d) for wheat under the farmer’s customary nutrient management (FCNM) and farmer-participation nutrient management (FPNM). The top, middle, and bottom black lines of the box denote 75%, 50%, and 25% quantiles, respectively; the whiskers above and below the box denote the 90% and 10% quantiles, respectively; The short red line inside the box denotes the mean; ** significant differences at the p < 0.01 level.
Sustainability 17 03481 g004
Figure 5. Proportion of farmers applying NPK plus organic fertilizer and NPK fertilizer alone (a), and NPK inputs from organic fertilizer application (b) under farmer’s customary nutrient management (FCNM) and farmer-participation nutrient management (FPNM).
Sustainability 17 03481 g005
Figure 6. Wheat yield (a) and 1000-grain weight (b) under farmer’s customary nutrient management (FCNM) and farmer-participation nutrient management (FPNM), and the relationship between wheat yield and 1000-grain weight (c). The top, middle, and bottom black lines of the box denote 75%, 50%, and 25% quantiles, respectively; the whiskers above and below the box denote the 90% and 10% quantiles, respectively; The short red line inside the box denotes the mean; ** significant differences and correlation at the p < 0.01 level.
Sustainability 17 03481 g006
Figure 7. Partial factor productivity of N (a), P (b), and K (c) fertilizer under farmer’s customary nutrient management (FCNM) and farmer-participation nutrient management (FPNM). The top, middle, and bottom black lines of the box denote 75%, 50%, and 25% quantiles, respectively; the whiskers above and below the box denote the 90% and 10% quantiles, respectively; The short red line inside the box denotes the mean; ** significant differences at the p < 0.01 level.
Sustainability 17 03481 g007
Figure 8. Total benefit (a), fertilizer cost (b), and net benefit (c) of wheat under farmer’s customary nutrient management (FCNM) and farmer-participation nutrient management (FPNM). The top, middle, and bottom black lines of the box denote 75%, 50%, and 25% quantiles, respectively; the whiskers above and below the box denote the 90% and 10% quantiles, respectively; The short red line inside the box denotes the mean; ** significant differences at the p < 0.01 level.
Sustainability 17 03481 g008
Disclaimer/Publisher’s Note: The statements, opinions and data contained in all publications are solely those of the individual author(s) and contributor(s) and not of MDPI and/or the editor(s). MDPI and/or the editor(s) disclaim responsibility for any injury to people or property resulting from any ideas, methods, instructions or products referred to in the content.

