Article

Cycling as Critical Infrastructure for Green Start-Ups: A Multilevel Analysis in Germany

1
Federal Institute for Research on Building, Urban Affairs and Spatial Development (BBSR), Federal Office for Building and Regional Planning (BBR), Deichmanns Aue 31–37, 53179 Bonn, Germany
2
Institute of Geography, University of Cologne (UoC), Albertus-Magnus-Platz, 50923 Cologne, Germany
Sustainability 2025, 17(8), 3441; https://doi.org/10.3390/su17083441
Submission received: 27 February 2025 / Revised: 26 March 2025 / Accepted: 8 April 2025 / Published: 12 April 2025

Abstract

:
Despite physical infrastructure being known as a critical enabler of entrepreneurship, cycling infrastructure and its role in entrepreneurship remain largely unexplored. However, a well-established cycling infrastructure can support green start-up activity by facilitating connectivity and the exchange of knowledge and ideas without the reliance on carbon-intensive transport, which aligns with their environmental goals. This article studies the relationship between cycling infrastructure and green start-up activity at the regional (NUTS-3) level in Germany and whether this relationship is amplified by the wider entrepreneurial ecosystem (EE). This study is virtually the first to examine how a well-established cycling infrastructure is conducive to start-up activity. With firm-level data from the IAB/ZEW Start-up Panel, multilevel regression models are used to account for differences in green start-up activity across urban, intermediate, and rural regions. The findings show a strong significant and positive relationship between cycling infrastructure and green start-up activity at the regional level, even after including various controls. However, this relationship is not amplified by the wider ecosystem. In the transition towards a Green Economy, policymakers should invest in cycling infrastructure because of its supportive role towards green start-ups.

1. Introduction

Despite that cycling is well-known as a solution to a variety of mobility-related problems in cities and regions, including environmental issues, such as pollution and transport carbon emissions [1,2], it remains largely unexplored in the field of entrepreneurship. This is surprising for two related reasons.
First, physical infrastructure is generally seen as a critical enabler of entrepreneurship [3]. It fosters connectivity between individuals and the exchange of knowledge and ideas [4]. This idea is well reflected in one of the current most popular concepts in the field of entrepreneurship: the concept of entrepreneurial ecosystems (EEs). This concept sheds light on how ten interdependent contextual (f)actors, for example, physical infrastructure and knowledge, foster growth-oriented entrepreneurship in a given territory [5]. However, physical infrastructure has often been measured through air and motorway transport in EE studies [6,7,8,9].
This brings us to the second reason. Not only does a well-developed cycling infrastructure facilitate connectivity as well, but traditional metrics of physical infrastructure in EE studies are also not conducive to every type of entrepreneurship. Environmental concerns linked to air and motorway transport can be a potential barrier to certain types of entrepreneurship. This becomes particularly apparent with green start-ups. Green start-ups, defined as ventures under eight years old that place ecological sustainability at the core of their business model, attach particular importance to operating in green contexts [10]. Cycling-friendly cities and regions can support green start-up activity by facilitating connectivity without the reliance on carbon-intensive transport, which aligns with their environmental goals.
While in response to the lack of sustainability in the traditional EE concept, a novel concept has emerged, so-called sustainable entrepreneurial ecosystems (SEEs), virtually no study has yet explored how cycling infrastructure fosters green start-up activity. SEEs are ecosystems designed to foster entrepreneurship that places environmental and/or social sustainability at the core of the business model [11]. However, previous SEE studies have been limited to sustainable orientation in institutional settings [12], within actor networks, on the customer side [13], within stakeholder support and collaboration [14], and university-related support programs [15].
The objective of this study is twofold. First, this study explores the relationship between cycling infrastructure and green start-ups at the regional (NUTS-3) level (see definition of NUTS-3 regions in Section 3.2) in Germany. Second, this study investigates whether this effect is amplified by the wider ecosystem, referring to all other ecosystem resources and institutions, aside from physical infrastructure, which are specifically defined in Section 3.2.4. After all, physical infrastructure can serve as a gateway, enabling entrepreneurs to access a wider ecosystem of institutions and resources, for example, networks, knowledge, and human capital. Without these connections, infrastructure risks remain an isolated resource rather than a driver of entrepreneurship [16]. With data from the IAB/ZEW Start-up Panel (2021) [17], multilevel regression models are used. This helps account for differences in green start-up activity across urban, intermediate, and rural regions, reducing the influence of regional disparities on the results. Also, control variables related to public transportation systems; quality of life (QoL) (i.e., population-employment density, population growth, amenities and the creative class); and the regional business structure are included that could otherwise interfere with the studied relationships.
This study makes an important contribution to the entrepreneurship literature. It is virtually the first study that explores the relationship between start-up activity and cycling infrastructure. As economic considerations often drive infrastructure investments among policymakers, the finding that cycling-friendly regions are significantly conducive to green start-up activity is an important one. With current challenges such as climate change, investing in cycling infrastructure is important to accelerate the transition towards a Green Economy through its supporting role to green start-ups.
The remainder of this article is structured as follows. In Section 2, the literature review and hypotheses are discussed. Section 3 focuses on the data and methods. Hereinafter, the results are discussed in Section 4. Finally, Section 5 includes the conclusion and discussion.

2. Literature Review

2.1. Definition of Sustainable Entrepreneurship

Sustainable entrepreneurship is defined as a process of “discovering, creating, and exploiting entrepreneurial opportunities that generate social and environmental benefits to communities to promote sustainability” [18] (p. 1). It distinguishes from traditional entrepreneurship in that social and environmental protection are at the core instead of purely economic goals [19]. As “companies are considered by many to be the main players creating environmental and social problems and thus to be the source of a lack of sustainability in society”, sustainable entrepreneurship is important in the transition towards a sustainable economy [10] (p. 222).

2.1.1. Defining Green (Eco-)Start-Ups

However, the theoretical boundaries between sustainable entrepreneurship and the related concepts of green (eco-) and social entrepreneurship are quite blurry [19]. While social entrepreneurship centers on solving societal problems, green (eco-)entrepreneurship centers on solving environmental issues. As discussed earlier, this study focuses on green (eco-)entrepreneurship.
Green (eco-)entrepreneurship refers to any entrepreneurial activity that results in an absolute reduction in environmental impacts, also within traditional markets [10]. The entrepreneurial challenge is to achieve economic success through the provision of products and services, all while minimizing environmental impacts. Green (eco-)entrepreneurship can emerge in established ventures (incumbents), emerging and young ventures (start-ups), as well as nascent entrepreneurs who are in the process of developing new businesses. However, start-ups are said to have the strongest impact on the transition towards a Green Economy [20]. In Schumpeter’s seminal work in 1934 [21], start-ups were identified as a key force in innovation and transformation. To be labelled as “green”, businesses must align with the Triple Bottom Line, prioritizing products (goods or services) that generate positive environmental impacts and support Green Economy objectives. The green nature of start-ups is primarily defined by three key aspects of their business:
  • Product-related characteristics—Do the start-up’s products (goods or services) align with environmental goals? This includes areas like renewable energy, resource efficiency, circular economy, waste management, emission reduction, and biodiversity protection.
  • Entrepreneur-related characteristics—How do entrepreneurs themselves shape the greenness of their start-ups? This involves their motivation [10], values [22], and attitudes [23] on environmental issues in the business. Additionally, the environmental-related qualifications and knowledge of the entrepreneur can be considered relevant [24].
  • Strategy-related characteristics—How can strategy through (continuous) interaction with external stakeholders strengthen or weaken the greenness of the start-up? This is decided by external stakeholders, such as investors, suppliers, and customers.

2.2. The Current State of the Art: Sustainable Entrepreneurial Ecosystems (SEEs)

The context of entrepreneurship plays a crucial role in strengthening or weakening the trajectory of green businesses. This idea dates back to Welter [25], who argued that entrepreneurship does not take place in a vacuum but in particular contexts. Contexts are formative for entrepreneurship in that they enable or constrain entrepreneurship [26]. While contexts are multifarious, the geographical context is an important one. This is well reflected in the popular concept of entrepreneurial ecosystems (EEs) [26]. An EE is defined as a set of ten interdependent contextual (f)actors that enable productive entrepreneurship within a given territory [5]. The contextual (f)actors range from resource endowments (e.g., physical infrastructure, knowledge, and human capital) to institutional arrangements (e.g., formal institutions and culture) [27]. However, an EE is centered around traditional growth-oriented entrepreneurship and pays little attention to sustainable entrepreneurship [28,29]. This has raised the question of how ecosystems can support sustainable entrepreneurship.
In response to this, a novel wave of ecosystem research has emerged around sustainable entrepreneurial ecosystems (SEEs) that center around the question of how contexts support sustainable entrepreneurship, both environmental and/or social sustainability. Thus far, SEE studies have investigated interactions among entrepreneurial actors [13], the role of credibility and sharing ventures in sustaining a sustainable economy [12], and the development of opportunities within SEEs [30]. Other research has analyzed perceptions of SEE strength in specific regions [14] and the impact of university-related support programs on sustainable regional development through knowledge spillovers [15].
However, physical infrastructure has received less attention in empirical SEE studies thus far, whereas it plays a crucial role in enabling entrepreneurs to connect with suppliers, customers, and other ecosystem (f)actors [31]. Conversely, can an SEE truly be considered “sustainable” if little attention has been paid to how entrepreneurship and contextual (f)actors are connected through the available physical infrastructure? Even with abundant resources, such as funding, mentorship, and collaborative spaces, their impact on entrepreneurship may be limited if infrastructure fails to support access and seamless integration into the ecosystem. Since physical infrastructure is crucial for the functioning of (S)EEs, we need to improve our understanding of what kinds of physical infrastructure support sustainable entrepreneurship.
Although it remains unclear if traditional EEs can foster sustainable entrepreneurship as well and to what extent EEs and SEEs are overlapping concepts or complementary fields [11], the environmental concerns with traditional metrics of physical infrastructure in EE studies call their applicability to green entrepreneurship into question. Much of the physical infrastructure metrics in traditional EE studies are centered around air or motorway transport [6,7,8,9]. While these metrics do reflect economic connectivity, they largely overlook environmental impacts. High reliance on motorway and air transport contributes significantly to climate change, air pollution, and resource depletion [32]—challenges that contradict the sustainability objectives of green start-ups. Given the growing urgency of climate change, there is a need to integrate environmentally conscious metrics of physical infrastructure in studies of SEEs to align with the environmental goals of green enterprises.

2.2.1. Cycling as Critical Infrastructure for Green Start-Ups

The growing demand for cycling is a reflection of the realization of the limitations of auto-mobile-dependent transport planning, on the one hand, in terms of traffic congestion, road traffic injury, parking problems, reduced levels of amenity and liveability, and wider issues of public health [2], and on the other hand, concerning air pollution, resource depletion, and climate change [33]. Although the literature on the impacts of cycling infrastructure on entrepreneurship is limited to date, cycling can be seen as a critical infrastructure for green start-ups for three main reasons. The first reason relates to environmental considerations, the second to direct economic advantages, and the third to personal (lifestyle) considerations.
First, cities and regions that invest in cycling infrastructure support environmentally responsible economic activity by decarbonizing mobility systems. Cycling facilitates connectivity and the exchange of knowledge and information without reliance on carbon-intensive transport, which is essential for green business formation and growth.
Second, direct economic advantages are also a key consideration. Cycling is highly cost-efficient. Compared to other alternative modes of transportation (e.g., public transportation), cycling requires minimal direct user costs [34], which is particularly advantageous for start-ups that are often budget-constrained [35]. In addition, businesses located in areas with a well-established cycling infrastructure are found to gain more profit from local customers than those in auto-centric areas—although this relationship persists particularly in urban downtowns and retail corridors. A study showed that cyclists and pedestrians spend more per month than visitors who arrive by car [36]. Thus, non-auto-centric businesses might economically benefit from cycling-friendly cities.
Third, there are also personal (lifestyle) considerations that attract green start-ups to cycling-friendly cities and regions. Both the founders and labor force of green start-ups are inclined to be located in environments that demonstrate a certain commitment to sustainability [37], which can be reflected in cycling-friendly areas. This is driven by personal values in which they advocate for local sustainability. However, highly educated professionals, often employed in sustainable businesses [38], also show a desire to pursue an active and healthy lifestyle through cycling, particularly in the context of Germany [39]. This further demonstrates why green start-ups often prefer a location in cycling-friendly cities and regions. Building on these arguments, the following hypothesis is tested:
Hypothesis 1.
The share of cycling infrastructure is positively associated with green start-up activity at the regional level.

2.2.2. Cycling and the Connection to the Wider Ecosystem

Despite this, cycling infrastructure risks becoming an isolated resource rather than a catalyst for entrepreneurship without connections to the broader ecosystem [16]. Ecosystems function as complex, interconnected systems where entrepreneurs, institutions, networks, and resources like physical infrastructure dynamically interact to drive business formation and growth [5]. In isolation, the elements of an ecosystem may have little impact on entrepreneurship. For example, investments in innovation hotspots without the necessary cultural and social support have resulted in empty real estate rather than thriving centers of innovation [40]. While physical infrastructure alone may not directly drive entrepreneurship, it can play a crucial indirect role by connecting start-ups to essential resources and institutions within the ecosystem. When integrated into the wider ecosystem, cycling infrastructure can significantly enhance its impact on green start-ups—not only by facilitating physical movement but also by fostering meaningful engagement with key actors and resources, such as knowledge hubs, incubators, accelerators, and networks. Therefore, understanding whether the wider ecosystem amplifies the impact of cycling infrastructure on green start-ups is crucial.
However, it remains unclear in what kinds of ecosystems sustainable entrepreneurship, e.g., green start-ups, is engaged. Are these EEs, SEEs, or a combination of both? Since it is unknown whether traditional EEs can also foster sustainable entrepreneurship, the first step is to determine whether ecosystems that are successful in fostering traditional, growth-oriented entrepreneurship also work in fostering sustainable entrepreneurship [11]. Evidence already suggests that the rates of traditional entrepreneurship correlate with the rates of social entrepreneurship at a country level [41]. Are these findings also transferable to green start-ups? With the second hypothesis, the interaction effect between cycling infrastructure and the wider, traditional EE on green start-up activity is tested:
Hypothesis 2.
The positive association between the share of cycling infrastructure and green start-up activity at the regional level is amplified by the wider EE.

3. Materials and Methods

3.1. Firm-Level Data

This study uses firm-level data from the IAB/ZEW Start-up Panel, IAB and ZEW, Nürnberg and Mannheim, Germany [17]. While this panel covers data from 2008 to 2021, information on the environmental objectives of start-ups is only available for 2018 and 2021. This study uses data from 2021 (reference year: 2020) on 6776 start-ups, mainly to avoid a time lag with the regional data. Start-ups are defined as firms younger than eight years old. The data cover all industries, excluding agriculture, mining and quarrying, electricity, water and gas supply, health care, and the public sector. Annual surveys are conducted once a year with computer-aided telephone interviews (CATIs). The entities are legally independent firms run by at least one full-time entrepreneur; de-merger foundations and subsidiaries are not considered in the panel. The data cover information related to the entrepreneur(s) and the firm, including the headquarters office at the regional (NUTS-3) level.

3.1.1. Dependent Variables

The panel uses two definitions of green start-ups based on energy and overall CO2 reduction that are product-related as well as strategy-related (see Section 2.1.1). In the annual survey, start-ups were asked if they slightly (2 = yes, low); significantly (1 = yes, significant); or not at all (0 = no) reduced their energy consumption and/or overall CO2 within the company (strategy-related) and/or on the customer side (product-related). This study captures start-ups that only significantly did so because environmental protection takes a more central role in their business models [10]. The dependent variables are formulated as follows:
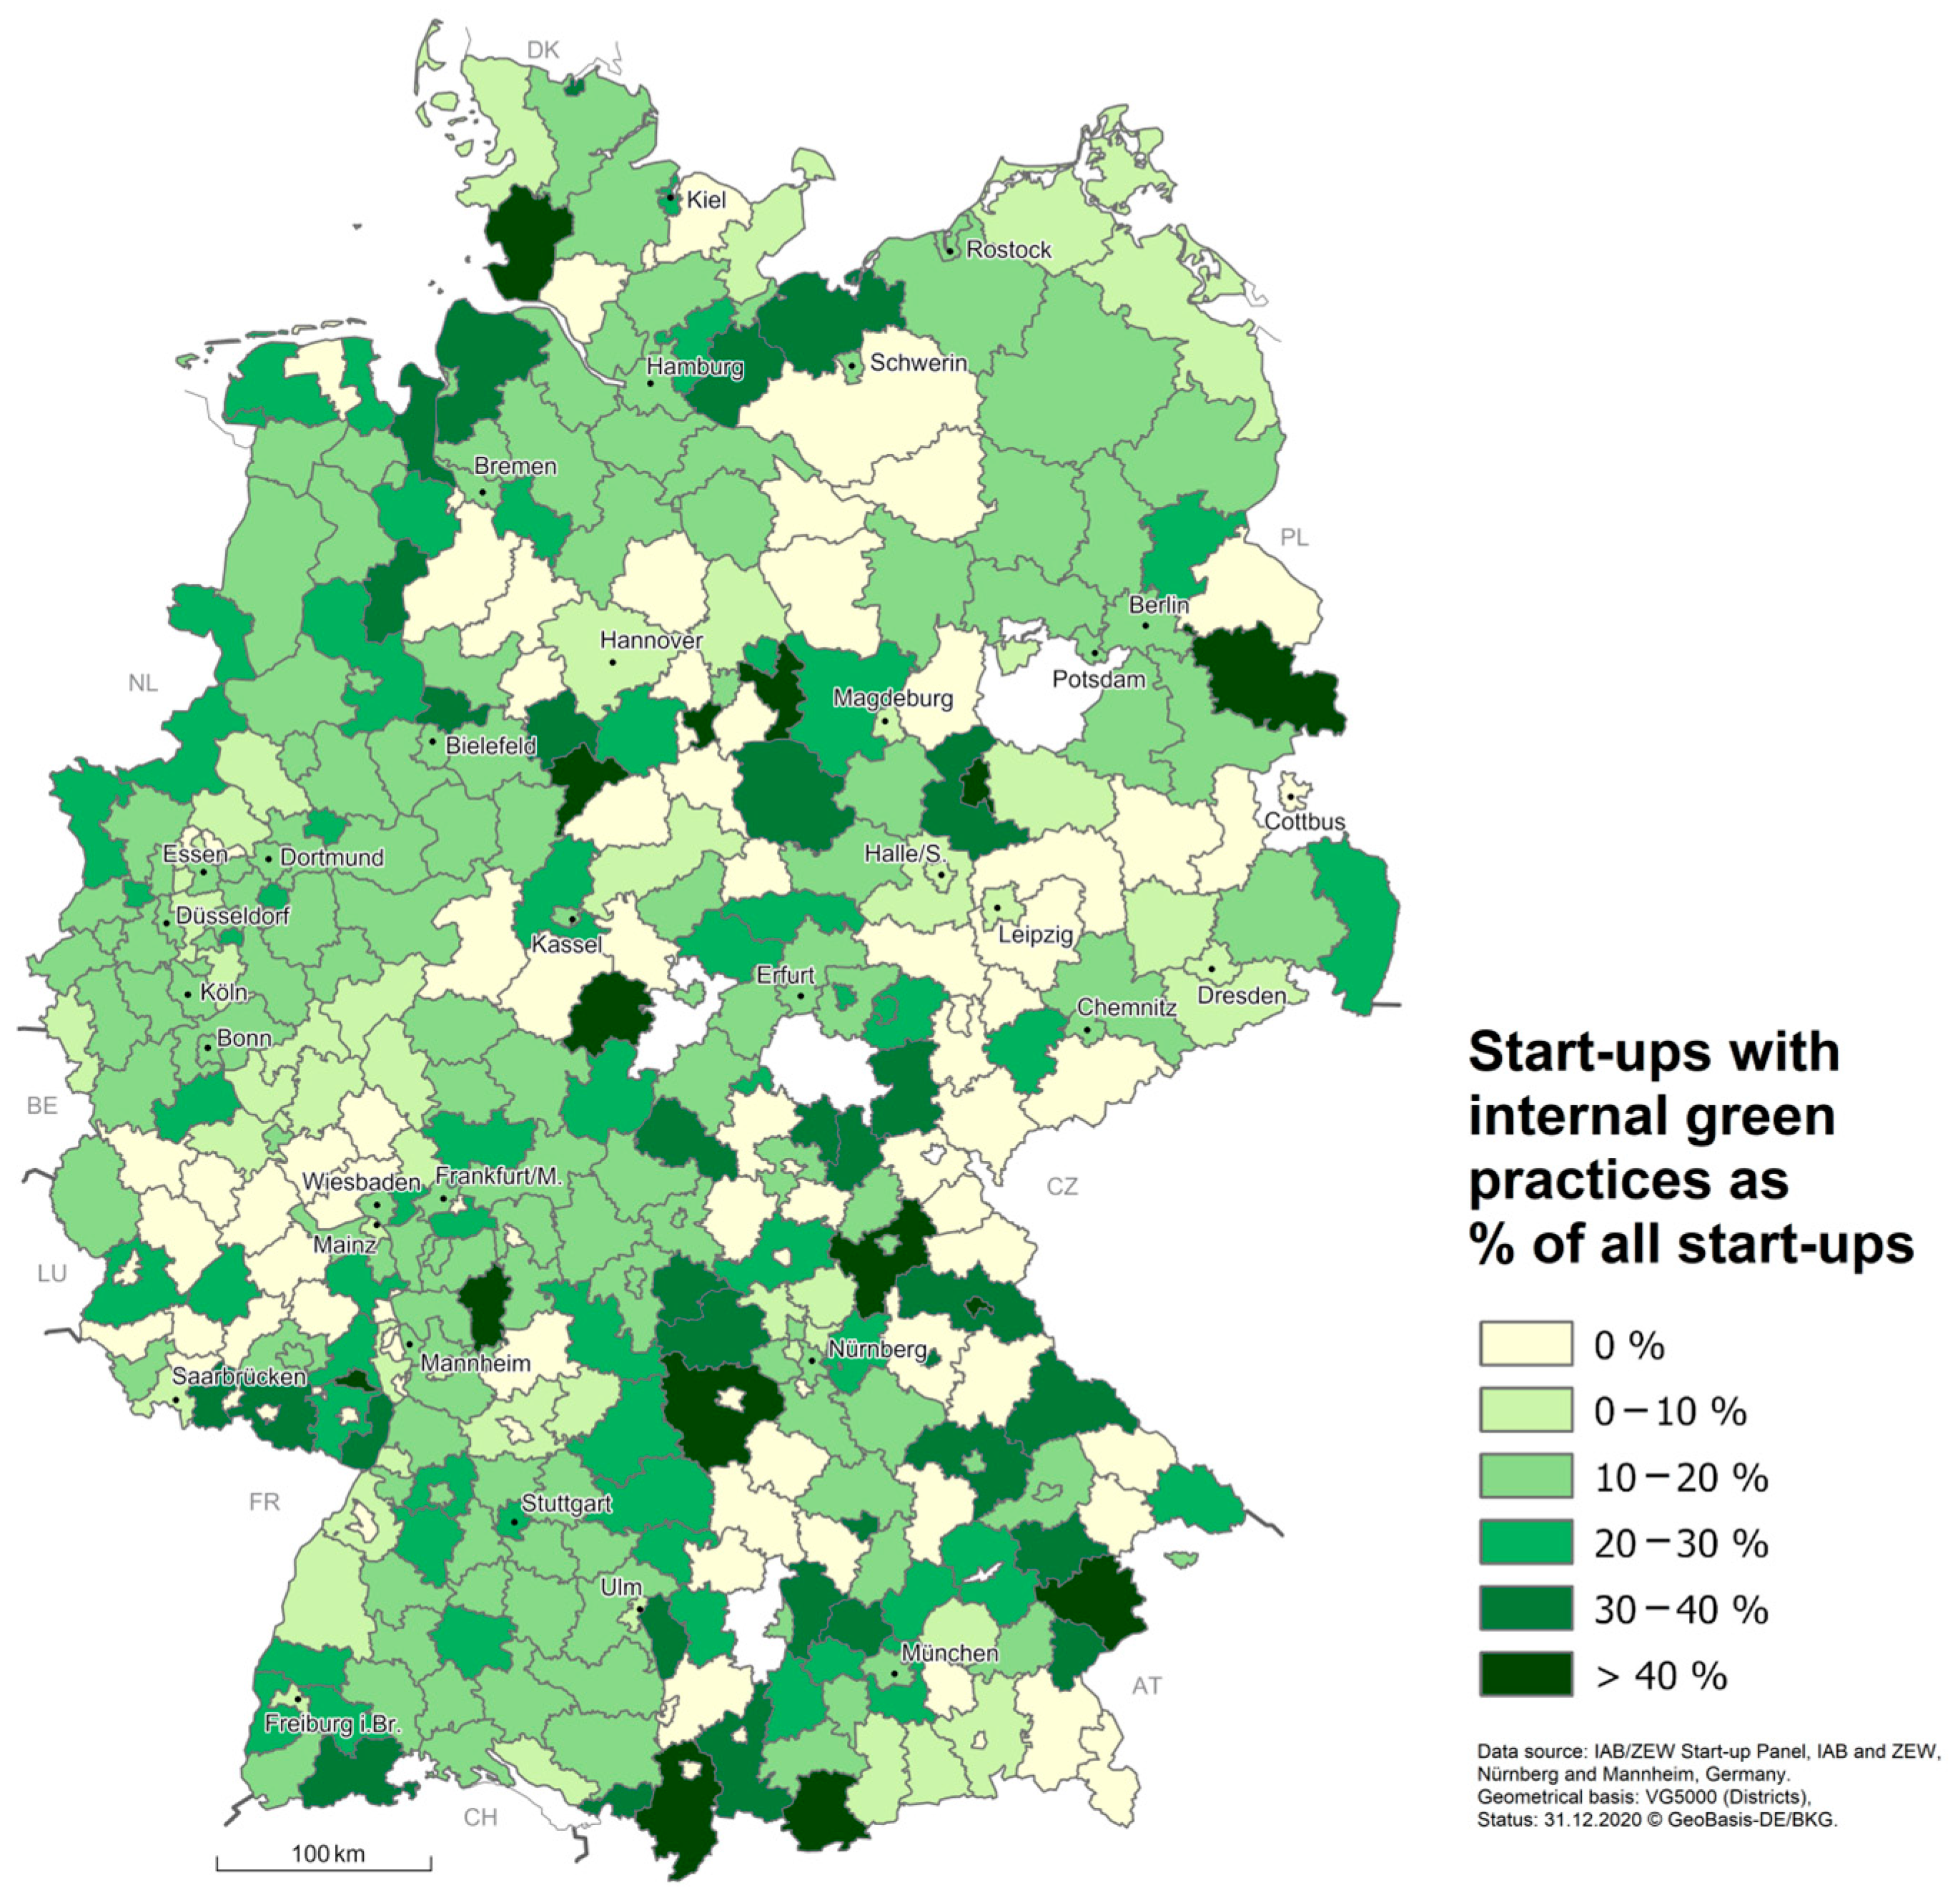
  • The first dependent variable measures the number of start-ups that significantly reduced energy consumption and/or the overall CO2 balance in the company at the regional (NUTS-3) level;
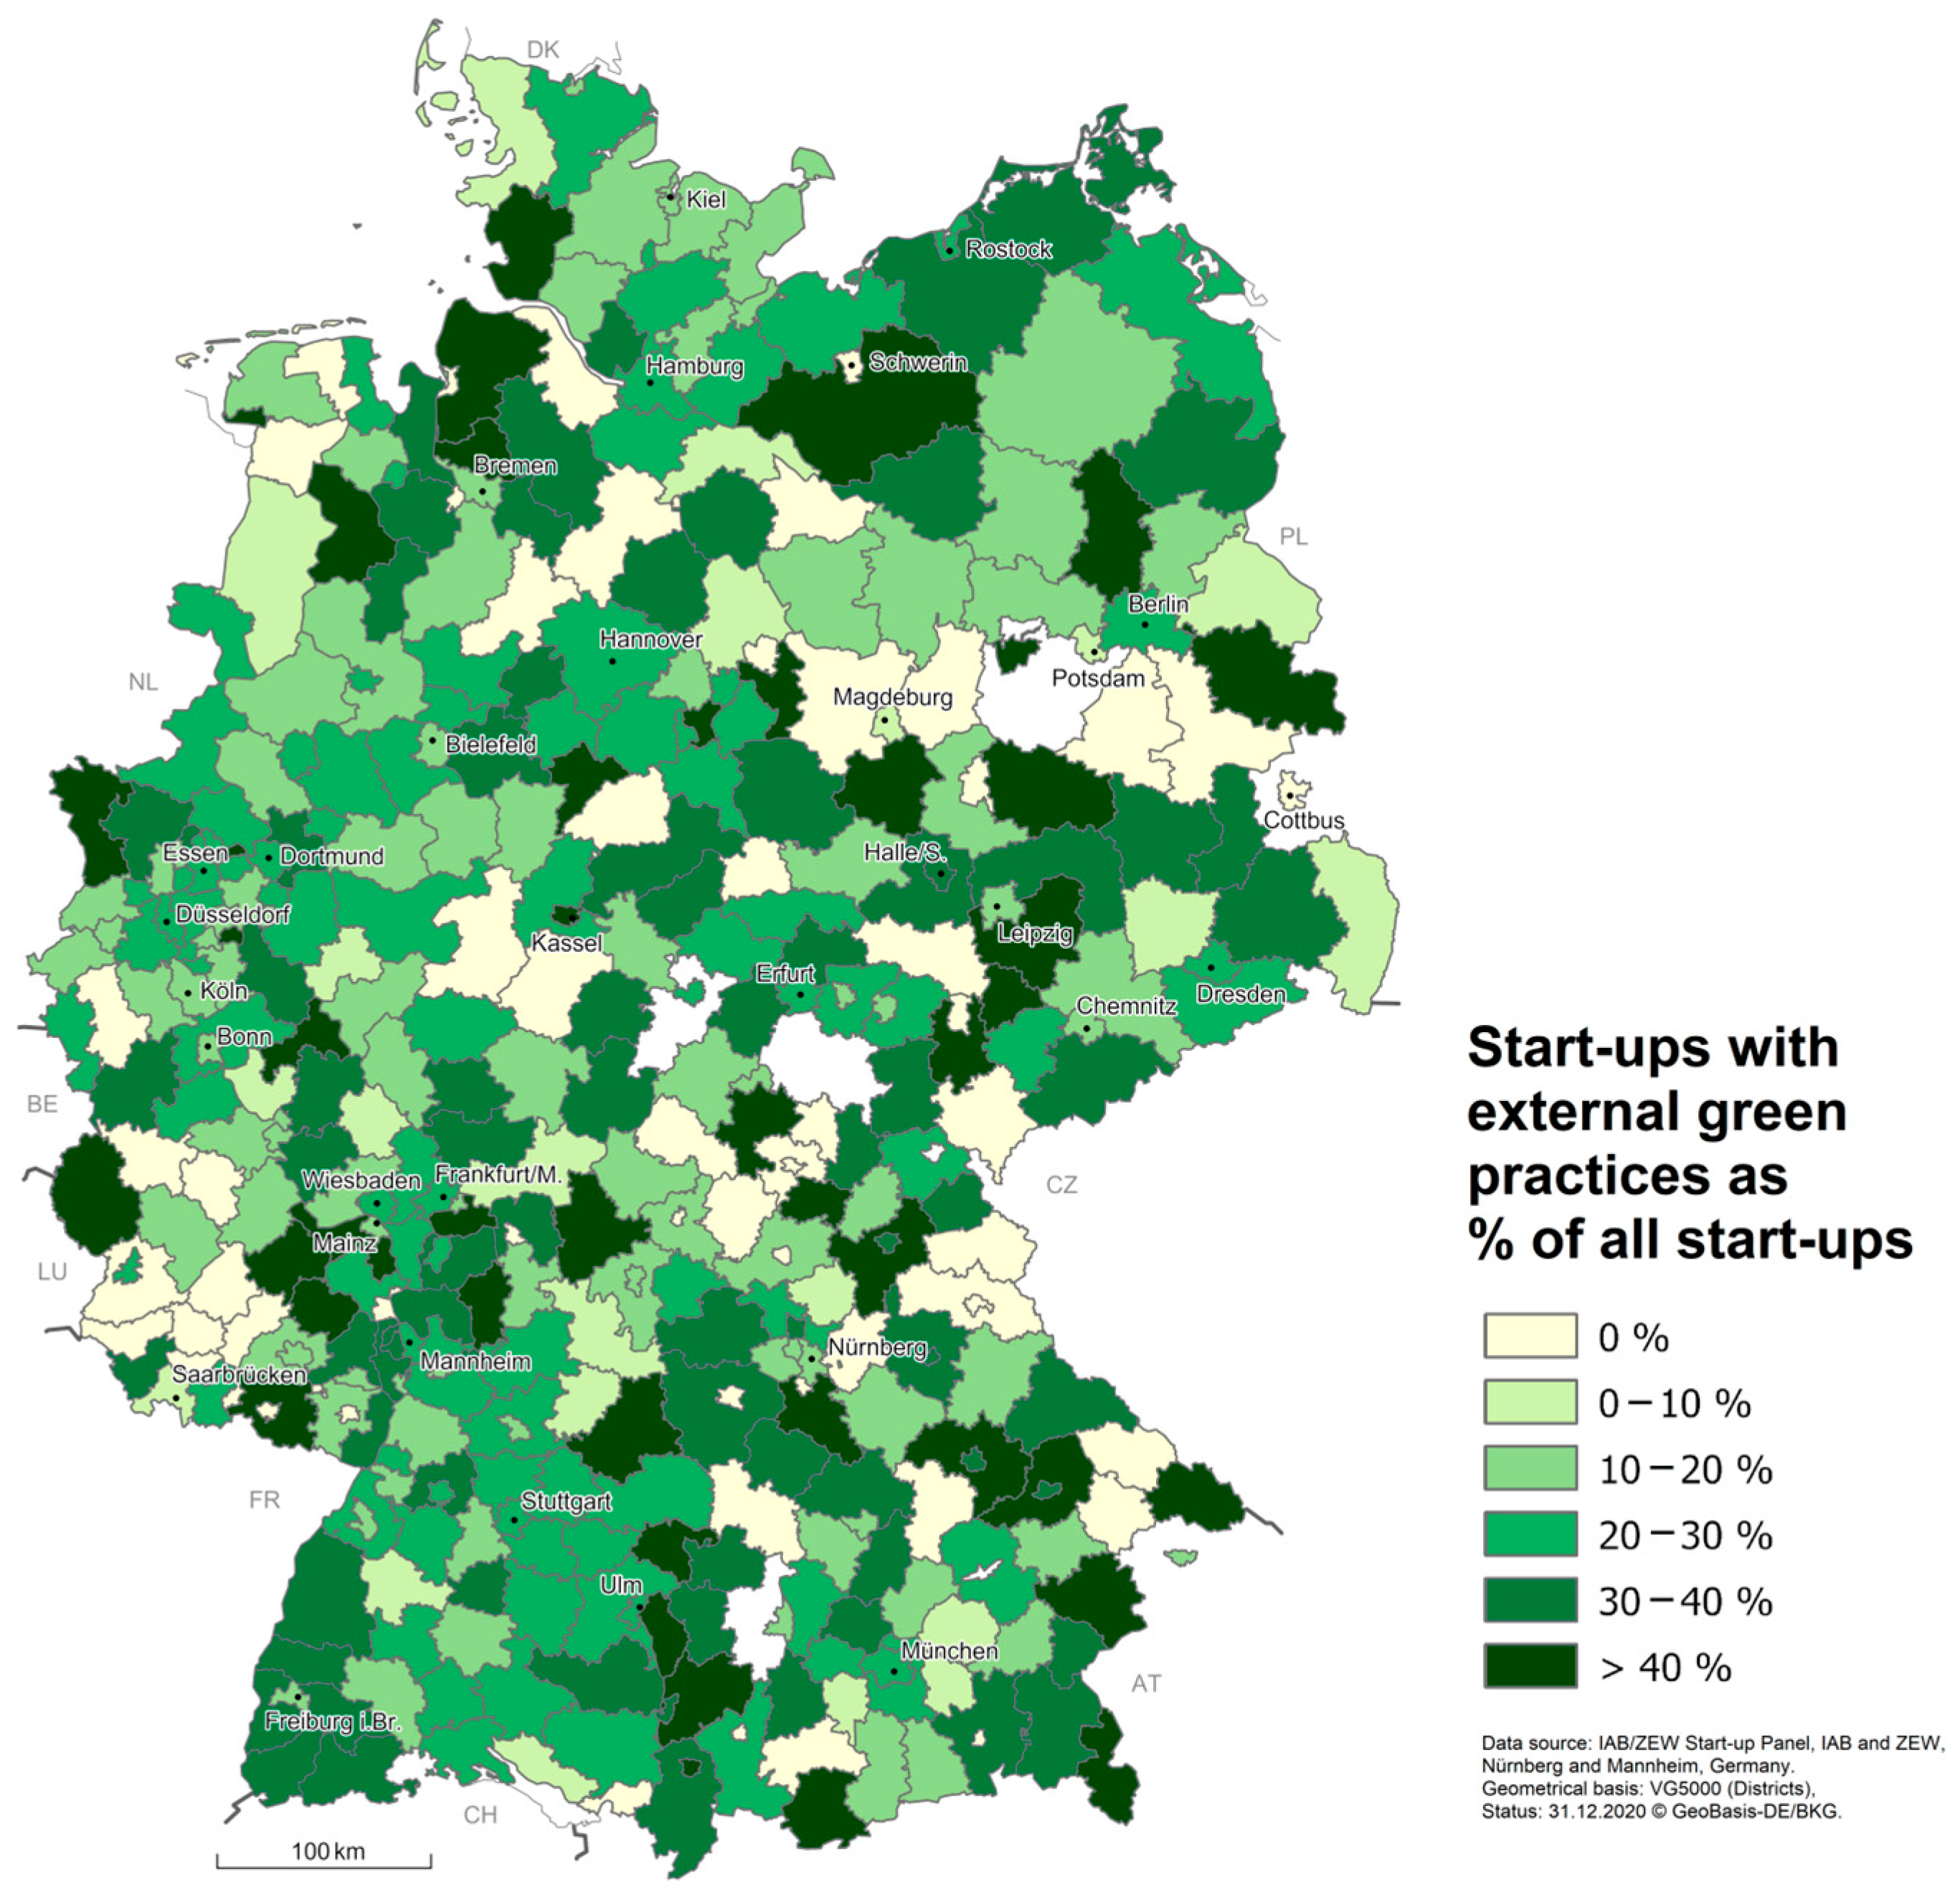
  • The second dependent variable measures the number of start-ups that significantly reduced energy consumption and/or the overall CO2 balance on the customer side at the regional (NUTS-3) level.

3.1.2. Sample

Information on green start-ups at the regional (NUTS-3) level was aggregated to a sample of 390 regions—from the 401 regions in the year 2020—due to firm-level data availability. From the initial 6776 start-ups, 1007 start-ups significantly reduced energy consumption and/or the overall CO2 balance in the company, while 1573 start-ups did so on the customer side. Figure 1 shows the spatial distribution of green start-ups with internal green practices, while Figure 2 illustrates those with customer-focused external green practices. In general, there are more green start-ups with external green practices than there are start-ups with internal green practices. In both Figure 1 and Figure 2, green start-up activity is not as strong as expected in North Rhine–Westphalia, the most populated federal state of Germany, and quite strong in Bayern instead.

3.2. Region-Level Data

The region-level data are linked to aggregated firm-level data at the NUTS-3 level. An advantage of using NUTS-3 regions is that they represent the local dimension of entrepreneurship [6], on the one hand, and, the measurement of many regional indicators, on the other hand. The NUTS (Nomenclature of Units for Territorial Statistics) system is a hierarchical classification of regions used by the European Union for statistical purposes. NUTS-3 regions specifically refer to the third level of this classification, which corresponds to smaller, more localized administrative regions within a country (see https://ec.europa.eu/eurostat/web/nuts, accessed on 30 January 2025).

3.2.1. Measurement of Cycling Infrastructure

There is a great demand for data on cycling infrastructure, because such information is crucial to enhancing safe cycling and encouraging cycling as a sustainable mode of transport. Until recently, no official source provided this kind of information at the regional level at a European scale. Lately, the European Cyclists’ Federation (ECF) has established a dataset that quantifies different kinds of cycling infrastructures (e.g., cycle tracks, cycle lanes, and cycle streets) using OpenStreetMap (OSM). This study uses the share of cycling lanes relative to the main road network in km, taking into account the directionality. Cycle lanes are used, because they are a standardized form of cycling infrastructure found across most cities and regions in Germany. In contrast, other forms of cycling infrastructure, for example, cycle streets, may vary more significantly in design and implementation across Germany, making cycle lanes a more ideal metric for cross-regional studies. Cycling lanes are defined as a part of a carriageway designated for cycles only, distinguished from the rest of the carriageway by paint or other markings but without physical separation from motorized traffic. The total main road network is defined through the main arteries for motorized traffic.
While the first edition of the ECF tracker 1.0 represents data for 500+ European cities, the second edition of the ECF tracker 2.0 (2024) [42] expanded the methodology to cover peri-urban and rural areas as well. Although an advantage of the second edition is that it covers all regions in Germany, there is a clear time lag with the firm-level data (reference year: 2020), which is problematic. Cycling infrastructure in Germany has experienced notable developments within four years, for example, it has been influenced by national strategies, such as The National Cycling Plan 3.0 (NCP 3.0), introduced in 2020. To deal with this endogeneity issue, the ECF tracker 2.0 data were cross-referenced with the oldest ECF tracker 1.0 from 2022, which was possible for 66 German cities due to data availability. A pairwise t-test showed that there is no meaningful significant difference between the two years (p = 0.715). Thus, data from the ECF tracker 2.0 can be used unproblematically as a measure of the regional quality of cycling infrastructure in 2020 due to no extreme fluctuations over time.

3.2.2. Controlling for Other Modes of Transportation

Public transport systems are an important control when studying cycling infrastructure, because they often interact with cycling or walking as a complementary form of mobility, unlike motorway or air transport [43]. Research has shown that the presence of accessible public transport systems can encourage individuals to cycle, as they may use bicycles for short trips and rely on public transport for longer journeys [44]. It is essential to account for public transport systems to accurately isolate the effects of cycling infrastructure itself, without confounding influences. In this study, public transportation is measured by the average inhabitant-weighted linear distance to the nearest public transport stop (buses, trams, and trains). The data cover stops with at least 20 departures, and distances were calculated in a 100 × 100 m grid (BBSR, 2021) [45].

3.2.3. Controlling for Quality of Life

Simultaneously, a well-established cycling infrastructure could be representative of the regional quality of life (QoL). The quality of life in cities and regions is defined as the overall conditions that contribute to the well-being of a community [46]. To avoid omitted variable biases—where unaccounted factors, such as the regional QoL, distort the relationship between cycling infrastructure and green start-ups—it is essential to control for confounding factors in the analysis. Jacobs’ (1961) promotion of a dense, socially and economically diverse environment has greatly influenced recent studies on quality of life reclaiming vibrant and healthy cities and regions [47]. Here, density indicators as well as metrics of amenities and the creative class are important to measure socially and economically vibrant regions. Building on Jacobs’ work (1961) [47], the following QoL indicators are used in this study:
  • Population-employment density (measured by the population and employees at the workplace per km2);
  • Population growth (measured in percentage over five years);
  • Amenities (measured by the proportion of inhabitants with a max. 1000 m distance to the nearest supermarket or discounter);
  • Creative class (measured by the percentage of employees in the creative and cultural industries).

3.2.4. Measurement of Entrepreneurial Ecosystems (EEs)

Table 1 represents the definitions and measurements of the wider EE, consisting of nine elements. Physical infrastructure is not included, because it is already represented by cycling infrastructure. The operationalization of the elements is based on common metrics [9,27]. Due to data availability, few elements in the dataset exhibit a time lag, of up to three years (see Table 1). The elements in Table 1 build the wider ecosystem, calculated with a Principal Component Analysis (PCA) as a dimensionality reduction technique. All variables were standardized according to z-scores to ensure comparability. Five PCA components were extracted into one final variable, with a total cumulative proportion of 0.756 based on the “elbow rule” [48].

3.2.5. Controlling for the Regional Business Structure

The regional business structure could simultaneously influence green start-up activity in the region. To control for this, firm characteristics derived from all start-ups in the IAB/ZEW Start-up Panel (2021) [17] were aggregated at the regional level. Green start-up activity can be higher in regions dominated by large firms (measured in terms of workforce and revenue) because of the enriching effects of partnerships with established firms [51]. Simultaneously, firm age negatively influences the environmental orientation in firms [52]. The older firms averagely are in a region, the less environmentally oriented they tend to be. Also, the in-house R&D in a region is found to be representative of the sustainable performance of local firms, aside from innovation [53]. Lastly, regions dominated by manufacturing industries often represent high carbon footprints and a lack of sustainable orientation in the local firms [54].

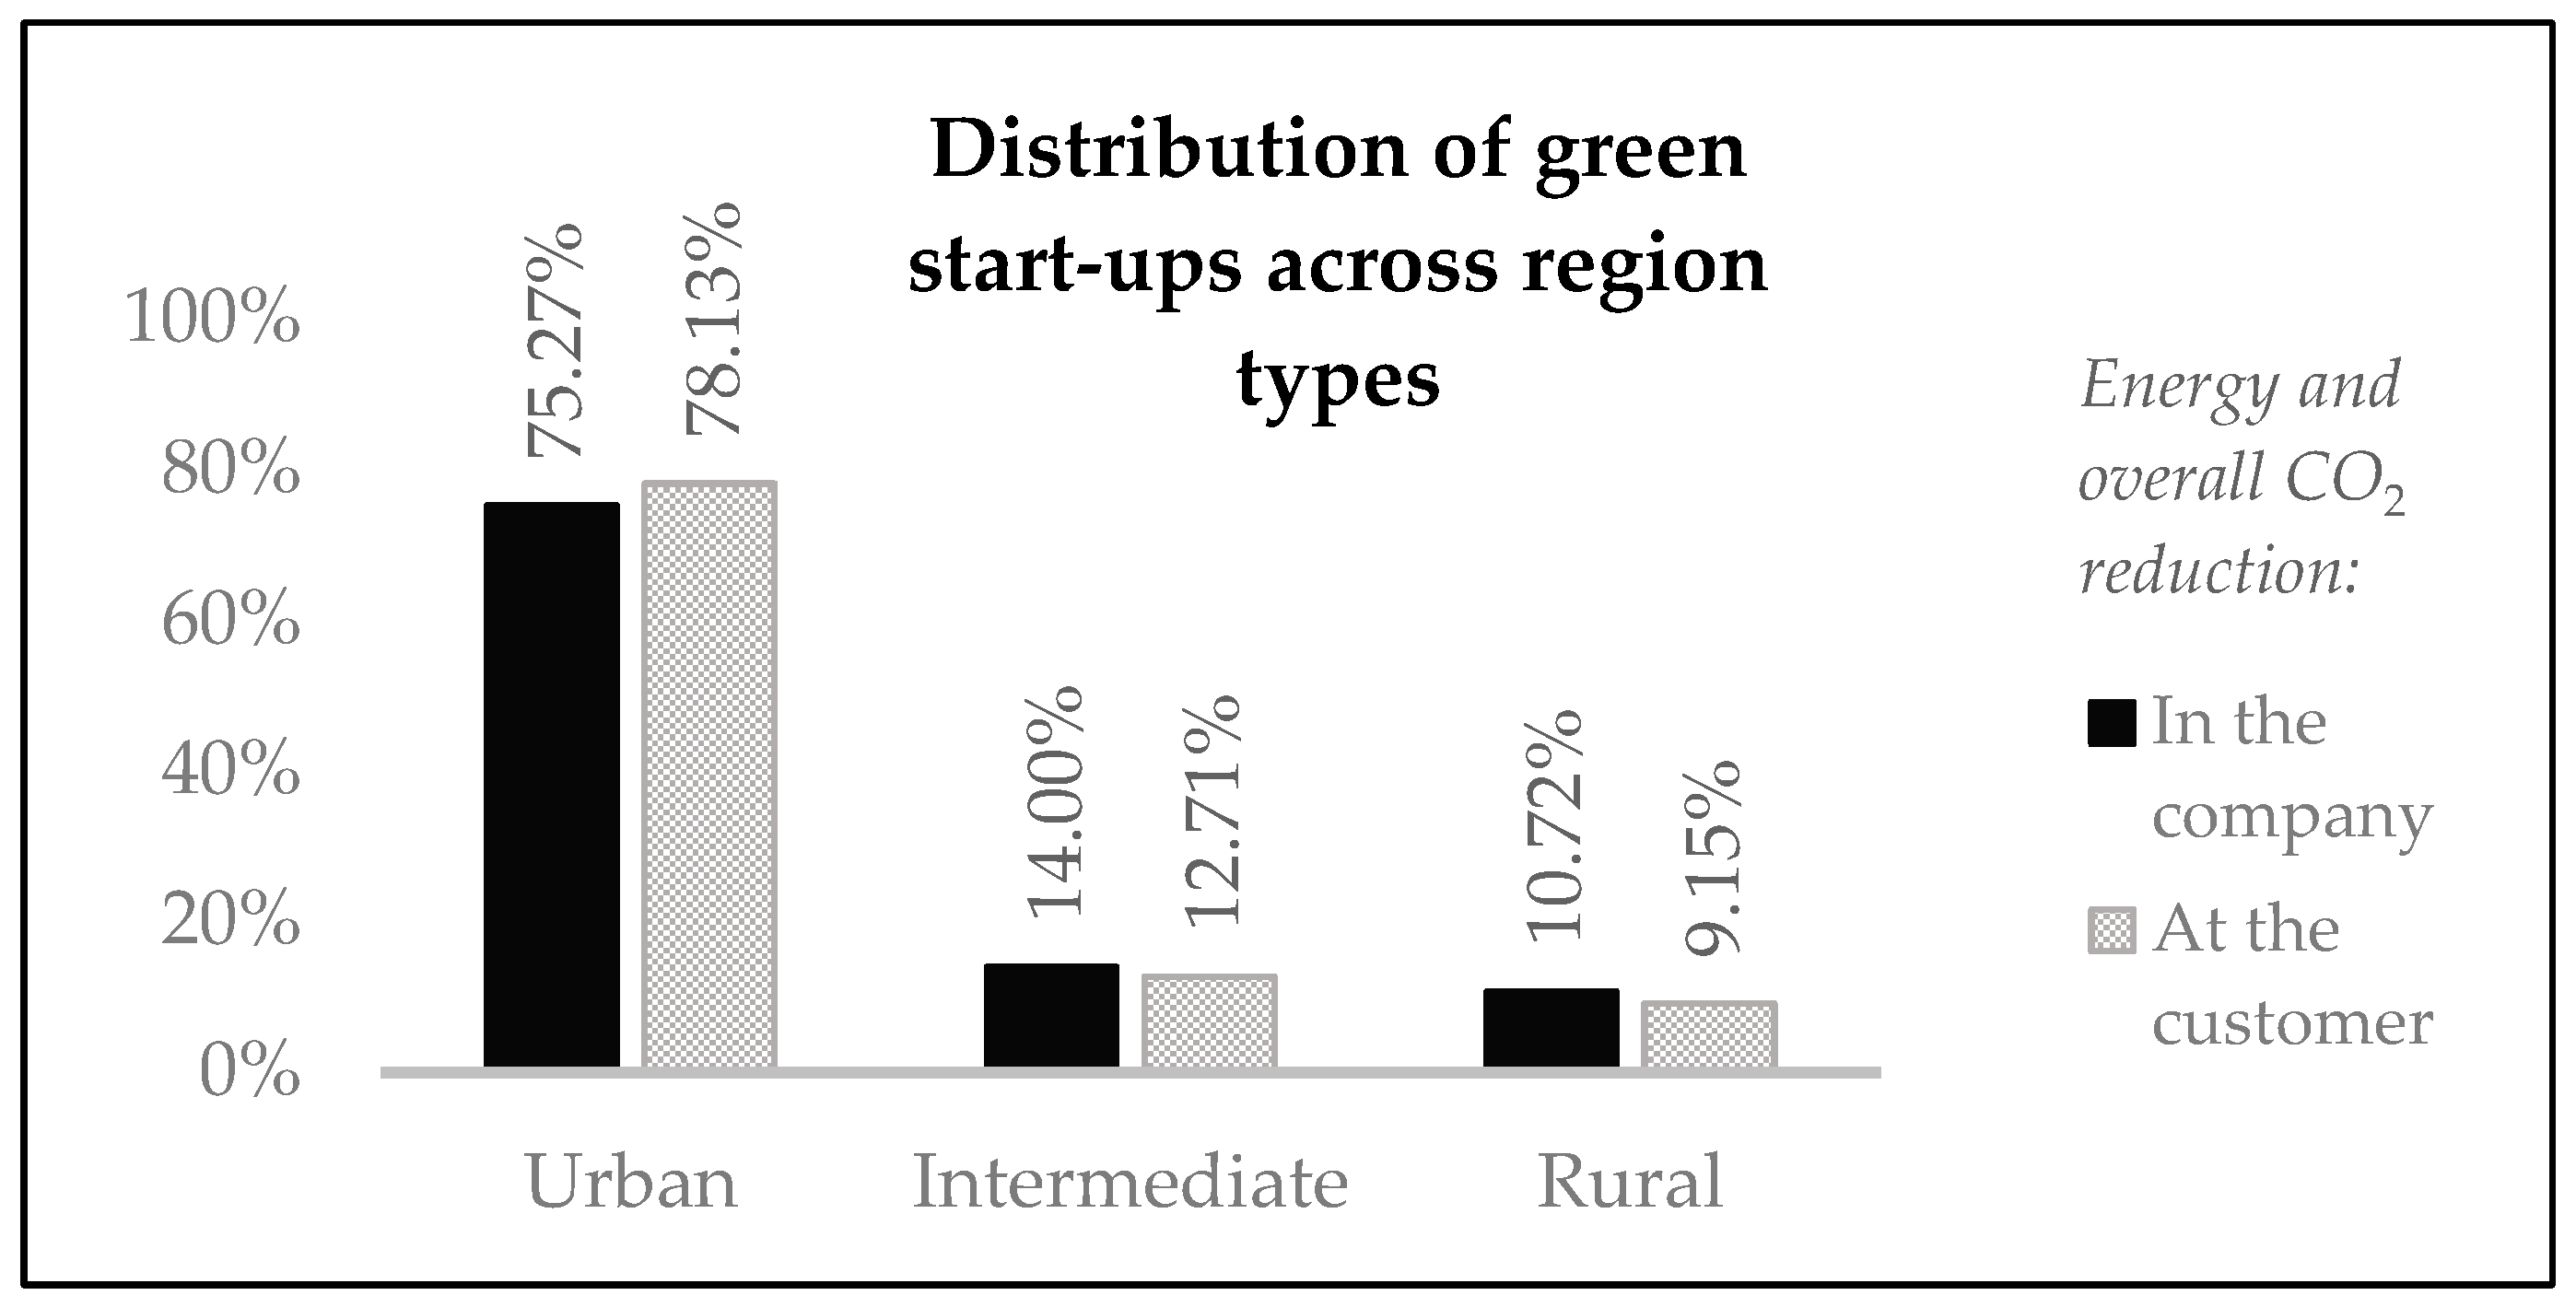
3.3. Classification of Region Types

Since green start-up activity might point to differences between urban, intermediate, and rural regions in Germany, a multilevel model is used across different levels of region types. The classification of NUTS-3 regions in urban, intermediate, and rural regions is based on the concentration of the population, jobs, and the geographical proximity to these areas (BBSR, 2021) [45]. Geographical proximity was measured using the BBSR accessibility model. The centrality index of the accessibility model cumulates the daily population (inhabitants plus inbound commuters minus outbound commuters) that can reach settlement centers within two hours of travel time by motorized private transport. The data consist of 211 urban, 84 intermediate, and 95 rural regions.

3.4. Model

Multilevel linear regression models with random intercepts were used to allow the error term to differ across the three levels of the region types. Different types of regions can have unique baseline effects on the outcome (i.e., the number of green start-ups), driven by contextual factors [55]. Random intercepts capture these differences, preventing biased estimates of the relationships. Within the model, a two-way interaction term was included to model how the effect of the share of cycling infrastructure on the outcome changes depending on the wider ecosystem. Two models were created for the two dependent variables, where
Y i j = β 0 + k = 1 K β k X i k + Q ( X i 1 Z j ) + u j + ϵ i j
  • Yij is the number of green start-ups for i-region in the j-region type;
  • β0 is the fixed intercept, representing the overall baseline rate of green start-ups;
  • k = 1 K β k X i k is the summation of K predictor variables (Xik) for the i-region, each with its fixed effect coefficient βk;
  • Q is the coefficient of the interaction term, capturing how the effect of Xi1 on Yij changes depending on Zj;
  • uj is the random intercept for the j-region type, capturing deviations of the j-region type’s intercept from the overall intercept β0;
  • ϵij is the residual error term for the i-region within the j-region type, capturing deviations of observed Yij from the predicted value after accounting for fixed and random effects.

3.5. Descriptive Statistics

Table 2 represents the descriptive statistics. Prior to the analysis, all continuous independent variables were standardized. By standardizing the continuous variables using z-scores, the influence of outliers was mitigated in the analysis. The descriptive statistics of the standardized variables are represented in Table A1a in Appendix A. The variance inflation factor (VIF) was calculated to control for multicollinearity in Table A1b in Appendix A. There is no concerning level of multicollinearity (mean = 1.473).

4. Results

To evaluate whether a multilevel analytical approach is appropriate, Bonferroni-adjusted pairwise t-tests were conducted. These tests compare the means of the outcome across different levels of the grouping variable of the region types. The aim was to assess whether significant differences exist between region types. The Bonferroni-adjusted pairwise t-tests were computed for the first dependent variable in Table 3 and the second dependent variable in Table 4 at the 5% significance level. Both Table 3 and Table 4 show significant differences in rates between urban–intermediate as well as urban–rural regions but no significant differences between intermediate–rural regions. This is also illustrated in Figure 3, where green start-up activity is the highest in urban and the lowest in rural regions, with no meaningful differences between rural and intermediate regions.
As the Bonferroni-adjusted pairwise t-tests indicate significant differences between some region types but not others, the intraclass correlation coefficient (ICC) was calculated to assess how much of the overall variance in the outcome is explained by differences across region types. The ICC helps to further justify whether a multilevel model is appropriate. Table 5 represents the multilevel model for the first dependent variable: green start-ups with internal green practices. Here, the ICC is 2.52%, suggesting that only a very small proportion of the variance in green start-up activity is explained by differences across region types. Table 6 shows the multilevel model for the second dependent variable: green start-ups with external green practices on the customer side. The ICC is 5.42%, which suggests that differences across region types account for a moderate proportion of the variance in green start-up activity. While the random variance component is statistically significant in Table 6 (p = 0.009) but not in Table 5 (p > 0.05), a multilevel approach remains appropriate to correct for the non-independence of observations within region types. This approach ensures more precise standard errors, accounts for potential unobserved heterogeneity, and allows for meaningful comparisons across models.

4.1. Fixed Effects

In both Table 5 and Table 6, the regional business structure as a control is not significant. More specifically, the aggregated start-up characteristics of firm size, in-house R&D, and firm age do not influence green start-up activity in the region. Also, manufacturing industries do not influence green start-up activity in the region. However, the regional QoL seems to play a role. Creative class and population-employment density are significant and positively influence green start-up activity in the region. Densely populated regions and those with a strong presence of creative and cultural industries are leaders in drawing green start-ups. This holds for green start-ups with internal green practices (see Table 5) and those with external green practices on the customer side (see Table 6). However, amenities and population growth are insignificant. Lastly, public transportation systems do not significantly influence green start-up activity in the region. The following Section 4.1.1 tests the first hypothesis. Section 4.1.2 tests the second hypothesis.

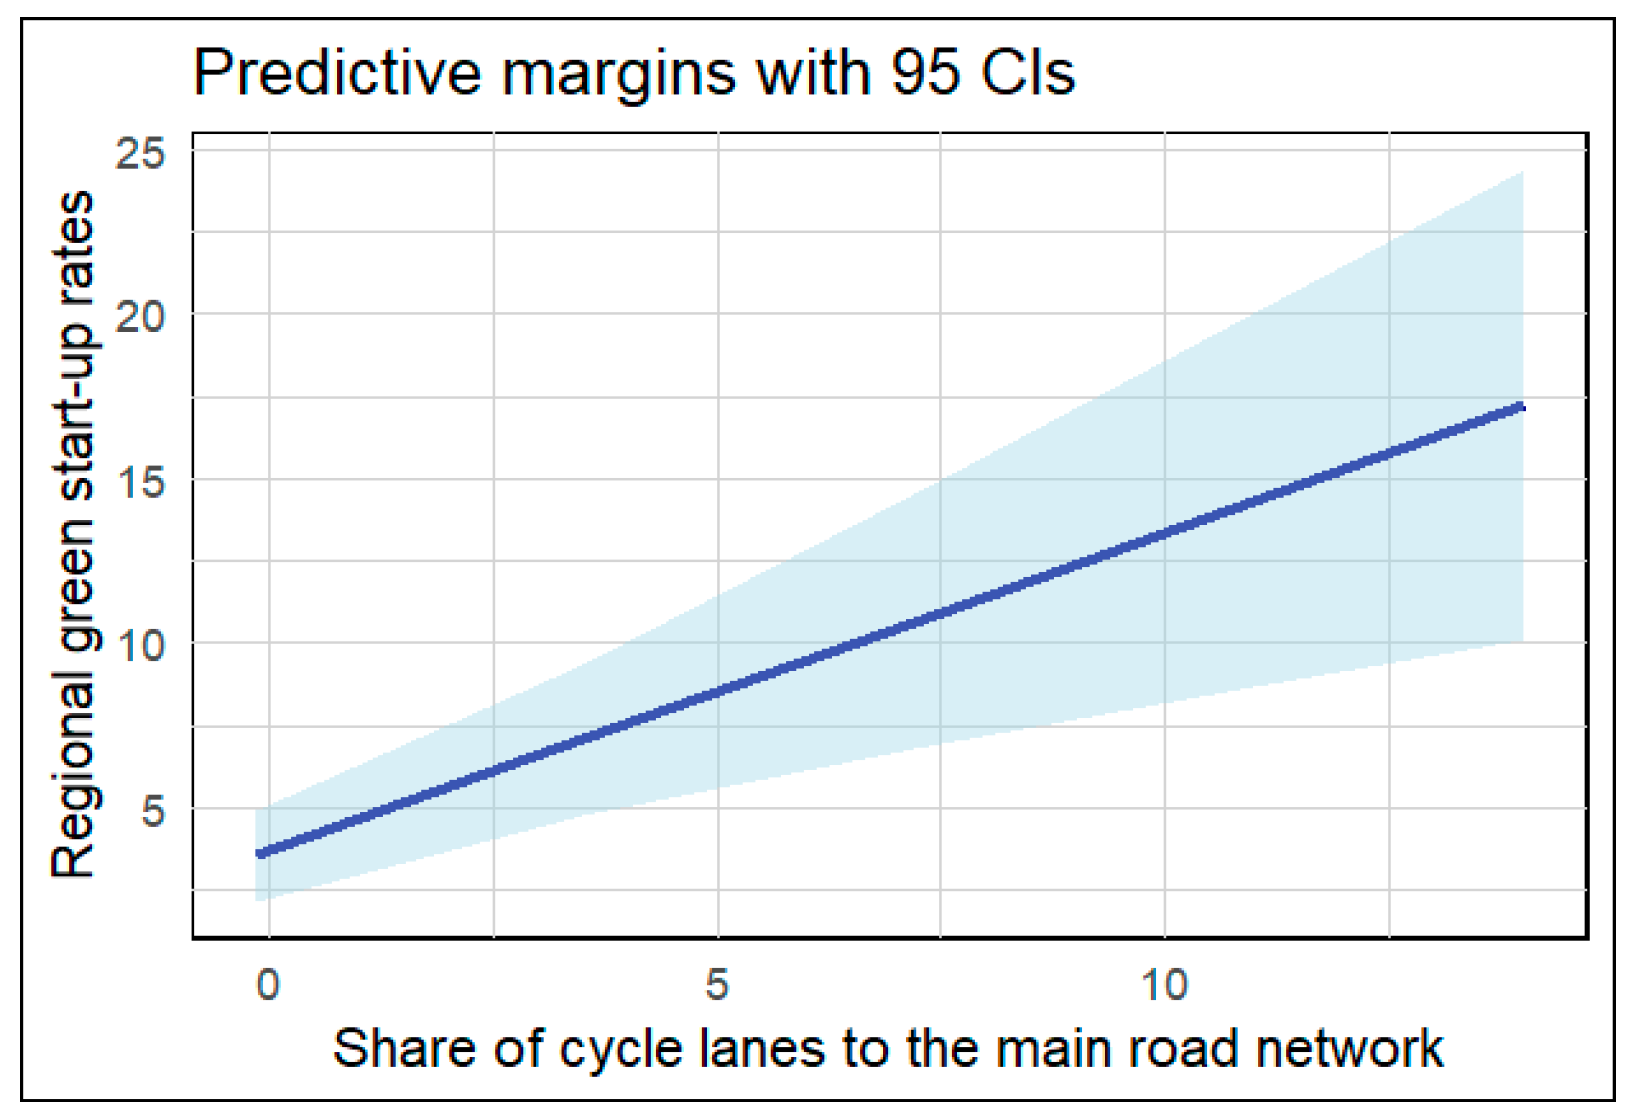
4.1.1. Cycling Infrastructure

The first hypothesis tests whether the share of cycling infrastructure is positively associated with green start-up activity at the regional level. Even after including regional controls, including public transportation systems; the quality of life (QoL) (e.g., population-employment density, population growth, amenities, and the creative class); as well as the regional business structure, there is a significant positive relationship between the share of cycling infrastructure and green start-up activity—both with internal and external green practices.
The findings in Table 5 and Table 6 are also robust across different region types, ranging from urban to intermediate and rural. When start-ups engage in green activities internally and/or externally, they directly benefit from a well-established cycling infrastructure, independently from their location. For example, employees can commute more sustainably by reducing their carbon footprint, logistics can become more eco-friendly, and overall operations can better align with the environmental goals of the start-up business. While businesses might face lower consumer demand for green products in rural regions [56], Table 6 suggests that investments in cycling infrastructure will still translate into increased green start-up activity with external green practices on the customer side in rural, aside from intermediate and urban, regions. Figure 4 and Figure 5 show the predictive margins. However, the relationship between green start-ups and cycling infrastructure may not be one-directional; rather, these businesses could also actively contribute to the regional adoption and reinforcement of cycling as a mode of transportation. In this sense, start-ups that integrate sustainability into their business models may also generate additional demand for sustainable mobility systems.

4.1.2. Cycling Infrastructure in the Connection to the Wider Ecosystem

Before testing the second hypothesis, Table 5 and Table 6 show a significant and positive relationship between traditional EEs and green start-up activity in regions. This significant relationship holds for green start-ups with internal green practices (see Table 5) and those with external green practices on the customer side (see Table 6) and is also robust across different region types. This finding shows that green start-ups are not excluded from traditional, growth-oriented EEs, as often thought so [57]. Traditional EEs can still foster green start-up activity, although their support may be less strong than towards traditional, non-sustainable businesses.
The second hypothesis tests whether the positive relationship between cycling infrastructure and green start-up activity at the regional level is amplified by the wider EE. The interaction effect between cycling infrastructure and EEs is not significant in Table 5 and Table 6. This suggests that cycling infrastructure, while beneficial for green start-ups, does not necessarily strengthen or weaken the role of EEs in fostering these kinds of businesses. Locations committed to sustainability may not share the same priorities as traditional EEs, which typically prioritize business growth, innovation, and competitiveness over environmental sustainability [11]. This misalignment could limit the extent to which sustainable infrastructure, such as cycling, becomes embedded within EEs. This is a notable limitation, because EEs, as discussed before, support green start-ups (see Table 5 and Table 6), and the integration of sustainable-focused infrastructure, such as cycling, in traditional EEs could increase connectivity and access to resources in traditional EEs for sustainable businesses.

5. Conclusions and Discussion

This article examined the relationship between cycling infrastructure and green start-up activity at the regional (NUTS-3) level in Germany and whether this relationship is amplified by the wider, traditional EE. This study is virtually the first to examine how a well-established cycling infrastructure is conducive to start-up activity. Multilevel linear regression models were used to account for differences in green start-up activity across urban, intermediate, and rural regions.
There is strong significant evidence that the share of cycling infrastructure is positively associated with green start-up activity at the regional level in Germany, even after including various controls related to public transportation systems, quality of life (QoL), and the regional business structure. This significant relationship is robust across urban, intermediate, and rural regions for green start-ups with internal and external green practices on the customer side. Through a well-established cycling infrastructure, green start-ups can better align their overall operations with the environmental goals of the start-up business. Simultaneously, a thriving green start-up scene may also drive demand for cycling, as sustainable businesses are often inclined to advocate for sustainability-friendly policies in cities and regions [37].
However, the effect of cycling infrastructure on green start-ups is not amplified by the traditional EE. This suggests that cycling infrastructure is not a well-embedded factor in EEs. One possible explanation for this is that locations committed to sustainability are not necessarily well-aligned with traditional EEs, whose goals are not sustainability-oriented [11]. Despite this, the results indicate that traditional EEs foster green start-up activity. This is a novel insight, because few studies have addressed how traditional EEs and sustainable entrepreneurial activities relate [11]. While cycling infrastructure and EEs independently increase green start-up activity, their combined effect is not additive or synergistic.
The findings have important implications for policymakers and researchers. First, as green start-ups are not excluded from traditional EEs, and cycling is a critical infrastructure in fostering green start-up activity, policymakers and scholars should consider cycling as a way to enable connectivity between the (f)actors of EEs to mitigate environmental impacts, as opposed to common EE metrics, such as air and motorway transport [6,7,8,9]. Second, policymakers should invest more proactively in cycling infrastructure because of its positive effect on green start-up activity. In Germany, cycling infrastructure expansion is largely demand-driven, influenced by advocacy groups, petitions, and political pressure. However, demand only increases when infrastructure improves, particularly in terms of safety [58]. Since cars remain the dominant mode of transportation in Germany [59], and investments follow demand, progress remains slow, creating a possible vicious cycle. Hence, a more proactive approach is required, as seen in Denmark and the Netherlands, where cycling infrastructure is integrated into long-term urban and regional planning rather than being dependent on shifting public demand to accelerate the transition towards a Green Economy.

Limitations and Future Research

There are several limitations. First, this study used data on cycling lanes, because it is the most standardized form of cycling infrastructure found across all kinds of regions in Germany. Future studies should explore how other types of cycling infrastructures (e.g., cycling streets or bike-sharing networks) are conducive to start-up activity—although this may limit the feasibility of cross-regional studies. Second, the question remains unanswered as to whether cycling is conducive to entrepreneurship in general or only to green businesses like start-ups. Are the findings transferrable to other types of entrepreneurship? Third, qualitative research is needed to understand the underlying mechanisms behind the relationship between cycling and green start-ups, as well as how it could impact EEs or SEEs. Qualitative studies can help us understand why and how cycling matters, rather than merely statistically testing if it does so. Fourth, future research could use more fine-grained data and further analyze how traditional EEs, particularly, which links between the contextual (f)actors, promote green start-up activity. Fifth, the use of random-intercept models limited the ability to understand to what extent the significant relationship between cycling and green start-up activity changes across different types of regions. Future research should use random-slope models to understand this.

Funding

This research received no external funding.

Institutional Review Board Statement

Not applicable.

Informed Consent Statement

Not applicable.

Data Availability Statement

This study used data from the IAB/ZEW Start-up Panel, IAB and ZEW, Nürnberg and Mannheim, Germany (see https://www.gruendungspanel.de/en/zew-start-up-panel/home, accessed on 7 April 2025). The data are not publicly available but can be accessed upon request from the data providers. No new data were generated for this study.

Conflicts of Interest

The author declares no conflict of interest.

Appendix A

Table A1. (a) Descriptive statistics of standardized continuous variables according to z-scores. (b) Variance inflation factor (VIF).
(a)
Descriptive StatisticsMeanSt. Dev.MinMax
Firm size (employees) (mean)01−0.6815.785
Firm size (turnover) (mean)01−0.05119.698
In-house R&D (mean)01−0.6147.354
Manufacturing industries (mode)0.6970.4601
Firm age (mean)01−2.9694.658
Creative class01−0.9876.347
Amenities01−1.5513.303
Population-employment density01−0.6826.288
Population growth01−3.2783.385
Public transportation01−0.75811.036
Cycle lanes01−0.14614.488
Entrepreneurial ecosystems (EEs) (PCA)01−7.0351.451
Region type1.7030.83513
(b)
Descriptive StatisticsVIF
Firm size (employees) (mean)1.058
Firm size (turnover) (mean)1.016
In-house R&D (mean)1.107
Manufacturing industries (mode)1.064
Firm age (mean)1.111
Creative class1.682
Amenities3.002
Population-employment density2.224
Population growth1.195
Public transportation1.708
Cycle lanes1.039
Entrepreneurial ecosystems (EEs) (PCA)1.481

References

  1. Fishman, E. Bikeshare: A review of recent literature. Transp. Rev. 2016, 36, 92–113. [Google Scholar] [CrossRef]
  2. Pucher, J.; Buehler, R. Walking and cycling for healthy cities. Built Environ. 2010, 36, 391–414. [Google Scholar] [CrossRef]
  3. Audretsch, D.B.; Heger, D.; Veith, T. Infrastructure and entrepreneurship. Small Bus. Econ. 2015, 44, 219–230. [Google Scholar] [CrossRef]
  4. Audretsch, D.B.; Belitski, M. Entrepreneurial ecosystems in cities: Establishing the framework conditions. J. Technol. Transf. 2017, 42, 1030–1051. [Google Scholar] [CrossRef]
  5. Stam, E.; Spigel, B. Entrepreneurial Ecosystems; USE Discussion Paper Series; Utrecht University: Utrecht, The Netherlands, 2016. [Google Scholar]
  6. Audretsch, D.B.; Belitski, M. Towards an entrepreneurial ecosystem typology for regional economic development: The role of creative class and entrepreneurship. Reg. Stud. 2021, 55, 735–756. [Google Scholar] [CrossRef]
  7. Hechavarría, D.M.; Ingram, A.E. Entrepreneurial ecosystem conditions and gendered national-level entrepreneurial activity: A 14-year panel study of GEM. Small Bus. Econ. 2019, 53, 431–458. [Google Scholar] [CrossRef]
  8. Miles, M.P.; Morrison, M. An effectual leadership perspective for developing rural entrepreneurial ecosystems. Small Bus. Econ. 2020, 54, 933–949. [Google Scholar] [CrossRef]
  9. Leendertse, J.; Schrijvers, M.; Stam, E. Measure twice, cut once: Entrepreneurial ecosystem metrics. Res. Policy 2022, 51, 104336. [Google Scholar] [CrossRef]
  10. Schaltegger, S.; Wagner, M. Sustainable entrepreneurship and sustainability innovation: Categories and interactions. Bus. Strategy Environ. 2011, 20, 222–237. [Google Scholar] [CrossRef]
  11. Volkmann, C.; Fichter, K.; Klofsten, M.; Audretsch, D.B. Sustainable entrepreneurial ecosystems: An emerging field of research. Small Bus. Econ. 2021, 56, 1047–1055. [Google Scholar] [CrossRef]
  12. Pankov, S.; Velamuri, V.K.; Schneckenberg, D. Towards sustainable entrepreneurial ecosystems: Examining the effect of contextual factors on sustainable entrepreneurial activities in the sharing economy. Small Bus. Econ. 2021, 56, 1073–1095. [Google Scholar] [CrossRef]
  13. DiVito, L.; Ingen-Housz, Z. From individual sustainability orientations to collective sustainability innovation and sustainable entrepreneurial ecosystems. Small Bus. Econ. 2021, 56, 1057–1072. [Google Scholar] [CrossRef]
  14. Bischoff, K. A study on the perceived strength of sustainable entrepreneurial ecosystems on the dimensions of stakeholder theory and culture. Small Bus. Econ. 2021, 56, 1121–1140. [Google Scholar] [CrossRef]
  15. Wagner, M.; Schaltegger, S.; Hansen, E.G.; Fichter, K. University-linked programmes for sustainable entrepreneurship and regional development: How and with what impact? Small Bus. Econ. 2021, 56, 1141–1158. [Google Scholar] [CrossRef]
  16. Wurth, B.; Stam, E.; Spigel, B. Toward an entrepreneurial ecosystem research program. Entrep. Theory Pract. 2022, 46, 729–778. [Google Scholar] [CrossRef]
  17. IAB/ZEW Start-up Panel, IAB and ZEW, Nürnberg and Mannheim, Germany. 2021. Available online: https://www.gruendungspanel.de/en/zew-start-up-panel/home (accessed on 20 October 2022).
  18. Rosário, A.T.; Raimundo, R.J.; Cruz, S.P. Sustainable entrepreneurship: A literature review. Sustainability 2022, 14, 5556. [Google Scholar] [CrossRef]
  19. Muñoz, P.; Cohen, B. Sustainable entrepreneurship research: Taking stock and looking ahead. Bus. Strategy Environ. 2018, 27, 300–322. [Google Scholar] [CrossRef]
  20. Bergset, L.; Fichter, K. Green start-ups—A new typology for sustainable entrepreneurship and innovation research. J. Innov. Manag. 2015, 3, 118–144. [Google Scholar] [CrossRef]
  21. Schumpeter, J.A. The Theory of Economic Development; Harvard University Press: Cambridge, MA, USA, 1934. [Google Scholar]
  22. Parrish, B.D. Sustainability-driven entrepreneurship: Principles of organization design. J. Bus. Ventur. 2010, 25, 510–523. [Google Scholar] [CrossRef]
  23. Kuckertz, A.; Wagner, M. The influence of sustainability orientation on entrepreneurial intentions—Investigating the role of business experience. J. Bus. Ventur. 2010, 25, 524–539. [Google Scholar] [CrossRef]
  24. Patzelt, H.; Shepherd, D.A. Recognizing opportunities for sustainable development. Entrep. Theory Pract. 2011, 35, 631–652. [Google Scholar] [CrossRef]
  25. Welter, F. Contextualizing entrepreneurship—Conceptual challenges and ways forward. Entrep. Theory Pract. 2011, 35, 165–184. [Google Scholar] [CrossRef]
  26. Stam, E.; Welter, F. Geographical contexts of entrepreneurship: Spaces, places and entrepreneurial agency. In The Psychology of Entrepreneurship; Routledge: London, UK, 2020; pp. 263–281. [Google Scholar]
  27. Stam, E.; Van de Ven, A. Entrepreneurial ecosystem elements. Small Bus. Econ. 2021, 56, 809–832. [Google Scholar] [CrossRef]
  28. Bischoff, K.; Volkmann, C.K. Stakeholder support for sustainable entrepreneurship—A framework of sustainable entrepreneurial ecosystems. Int. J. Entrep. Ventur. 2018, 10, 172–201. [Google Scholar] [CrossRef]
  29. Fichter, K.; Fuad-Luke, A.; Hjelm, O.; Klofsten, M.; Backman, M.; Bergset, L.; Bienkowska, D.; Clausen, J.; Geier, J.; Hirscher, A.L.; et al. SHIFTing the Support of Entrepreneurship in Eco-Innovation. SHIFT Project Summary; SHIFT: Helsinki, Finland, 2016. [Google Scholar]
  30. O’Shea, G.; Farny, S.; Hakala, H. The buzz before business: A design science study of a sustainable entrepreneurial ecosystem. Small Bus. Econ. 2021, 56, 1097–1120. [Google Scholar] [CrossRef]
  31. Woolley, J.L. The creation and configuration of infrastructure for entrepreneurship in emerging domains of activity. Entrep. Theory Pract. 2014, 38, 721–747. [Google Scholar] [CrossRef]
  32. Hickman, R.; Banister, D. Transport and the environment. In A Research Agenda for Transport Policy; Edward Elgar Publishing: Cheltenham, UK, 2019; pp. 25–33. [Google Scholar]
  33. Fishman, E. Cycling as transport. Transp. Rev. 2016, 36, 1–8. [Google Scholar] [CrossRef]
  34. Pucher, J.; Buehler, R. Cycling towards a more sustainable transport future. Transp. Rev. 2017, 37, 689–694. [Google Scholar] [CrossRef]
  35. Stucki, T. Success of start-up firms: The role of financial constraints. Ind. Corp. Chang. 2014, 23, 25–64. [Google Scholar] [CrossRef]
  36. Volker, J.M.B.; Handy, S. Economic impacts on local businesses of investments in bicycle and pedestrian infrastructure: A review of the evidence. Transp. Rev. 2021, 41, 401–431. [Google Scholar] [CrossRef]
  37. Speckemeier, L.; Tsivrikos, D. Green entrepreneurship: Should legislators invest in the formation of sustainable hubs? Sustainability 2022, 14, 7152. [Google Scholar] [CrossRef]
  38. Tiba, S.; van Rijnsoever, F.J.; Hekkert, M.P. Sustainability startups and where to find them: Investigating the share of sustainability startups across entrepreneurial ecosystems and the causal drivers of differences. J. Clean. Prod. 2021, 306, 127054. [Google Scholar] [CrossRef]
  39. Hudde, A. Educational differences in cycling: Evidence from German cities. Sociology 2022, 56, 909–929. [Google Scholar] [CrossRef]
  40. Pugh, R.; MacKenzie, N.G.; Jones-Evans, D. From ‘techniums’ to ‘emptiums’: The failure of a flagship innovation policy in Wales. Reg. Stud. 2018, 52, 1009–1020. [Google Scholar] [CrossRef]
  41. Lepoutre, J.; Justo, R.; Terjesen, S.; Bosma, N. Designing a global standardized methodology for measuring social entrepreneurship activity: The Global Entrepreneurship Monitor social entrepreneurship study. Small Bus. Econ. 2013, 40, 693–714. [Google Scholar] [CrossRef]
  42. European Cyclists’ Federation. ECF Tracker 2.0. 2024. Available online: https://www.ecf.com/en/resources/ecfs-cycling-infrastructure-tracker/ (accessed on 12 September 2023).
  43. Ton, D.; Duives, D.C.; Cats, O.; Hoogendoorn-Lanser, S.; Hoogendoorn, S.P. Cycling or walking? Determinants of mode choice in the Netherlands. Transp. Res. Part A Policy Pract. 2019, 123, 7–23. [Google Scholar] [CrossRef]
  44. Pucher, J.; Buehler, R. Integrating bicycling and public transport in North America. J. Public Transp. 2009, 12, 79–104. [Google Scholar] [CrossRef]
  45. Bundesinstitut für Bau-, Stadt- und Raumforschung (BBSR). Raumgliederungen des BBSR. 2021. Available online: https://www.bbsr.bund.de/BBSR/DE/forschung/raumbeobachtung/Raumabgrenzungen/raumabgrenzungen-uebersicht.html (accessed on 9 September 2021).
  46. Mouratidis, K. Urban planning and quality of life: A review of pathways linking the built environment to subjective well-being. Cities 2021, 115, 103229. [Google Scholar] [CrossRef]
  47. Jacobs, J. The Death and Life of Great American Cities; Random House: New York, NY, USA, 1961. [Google Scholar]
  48. Greenacre, M.; Groenen, P.J.F.; Hastie, T.; d’Enza, A.I.; Markos, A.; Tuzhilina, E. Principal component analysis. Nat. Rev. Methods Primers 2022, 2, 100. [Google Scholar] [CrossRef]
  49. European Commission. Regional Competitiveness Index 2.0—2022 Edition. European Union, n.d. 2022. Available online: https://ec.europa.eu/regional_policy/information-sources/maps/regional-competitiveness_en (accessed on 7 April 2024).
  50. Bundesinstitut für Bau-, Stadt- und Raumforschung (BBSR). Indikatoren und Karten zur Raum- und Stadtentwicklung. INKAR. 2021. Available online: https://www.inkar.de/ (accessed on 17 November 2021).
  51. Riandita, A.; Broström, A.; Cagliano, R. Partnering with green start-ups: A vehicle for eco-innovation? Ind. Innov. 2025, 32, 24–52. [Google Scholar] [CrossRef]
  52. Hörisch, J.; Kollat, J.; Brieger, S.A. Environmental orientation among nascent and established entrepreneurs: An empirical analysis of differences and their causes. Int. J. Entrep. Ventur. 2019, 11, 373–393. [Google Scholar] [CrossRef]
  53. Hájek, P.; Stejskal, J. R&D cooperation and knowledge spillover effects for sustainable business innovation in the chemical industry. Sustainability 2018, 10, 1064. [Google Scholar] [CrossRef]
  54. Delgado-Gomes, V.; Oliveira-Lima, J.A.; Martins, J.F. Energy consumption awareness in manufacturing and production systems. Int. J. Comput. Integr. Manuf. 2017, 30, 84–95. [Google Scholar] [CrossRef]
  55. Mayer, H.; Habersetzer, A.; Meili, R. Rural–urban linkages and sustainable regional development: The role of entrepreneurs in linking peripheries and centers. Sustainability 2016, 8, 745. [Google Scholar] [CrossRef]
  56. Lopes, J.M.; Silva, L.F.; Massano-Cardoso, I.; Galhardo, A. Green Purchase Determinants in a Rural Region of Europe: How can green marketing influence consumers’ decisions? The mediating role of green awareness of price. Adm. Sci. 2024, 14, 293. [Google Scholar] [CrossRef]
  57. Theodoraki, C. Building entrepreneurial ecosystems sustainably. Found. Trends Entrep. 2024, 20, 384–480. [Google Scholar] [CrossRef]
  58. Hull, A.; O’Holleran, C. Bicycle Infrastructure: Can Good Design Encourage Cycling? Urban Plan. Transp. Res. 2014, 2, 369–406. [Google Scholar] [CrossRef]
  59. Helferich, M.; Tröger, J.; Dütschke, E. The role of automobility engagement for car use and car use reduction intentions in Germany. Transp. Res. Part F Traffic Psychol. Behav. 2024, 106, 199–214. [Google Scholar] [CrossRef]
Figure 1. Green start-ups with energy and/or overall CO2 reduction in the company across Germany. Data source: IAB/ZEW Start-up Panel [17].
Sustainability 17 03441 g001
Figure 2. Green start-ups with energy and/or overall CO2 reduction on the customer side across Germany. Data source: IAB/ZEW Start-up Panel [17].
Sustainability 17 03441 g002
Figure 3. Distribution of green start-ups across region types.
Sustainability 17 03441 g003
Figure 4. Predictive margins between cycle lanes and green start-up activity at the regional level (product-oriented).
Sustainability 17 03441 g004
Figure 5. Predictive margins between cycle lanes and green start-up activity at the regional level (strategy-oriented).
Sustainability 17 03441 g005
Table 1. Definition and operationalization of the wider EE.
IndicatorsDefinitionMeasurement in Time <>NUTS LevelSource and Data Availability <>
Formal institutions The rules and regulations in societyQuality of Government Index based on the level of corruption, unaccountability, and impartiality <2021>NUTS-2Quality of Government Index by the Quality of Government Institute (University of Gothenburg) in the RCI (2022) [49]
Entrepreneurial cultureThe extent to which entrepreneurship is appreciated in societyPercentage of self-employed per 100 members of the workforce <2020>NUTS-3Ongoing spatial monitoring of the BBSR (2000–2023) [50]
NetworksThe connectedness of businesses for new value creationPercentage of SMEs with innovation cooperation activities <2021>NUTS-2Regional Innovation Scoreboard (DG GROW) in the RCI (2022) [49]
Market demandThe availability of financial resources within the population to purchase goods and servicesGDP per capita <2020>NUTS-3Ongoing spatial monitoring of the BBSR (2000–2023) [50]
IntermediariesServices that facilitate the creation, development, and growth of new businessesIndirect federal grants for R&D projects in 1000 EUR per member of the working-age population <2017>NUTS-3Ongoing spatial monitoring of the BBSR (1991–2017) [50]
TalentThe skills, knowledge, and experience held by individualsPercentage of students at universities and universities of applied sciences per 1000 inhabitants <2020>NUTS-3Ongoing spatial monitoring of the BBSR (2006–2021) [50]
KnowledgeInvestments in knowledge (both scientific and technological)Intramural R&D expenditure as % of GDP <2019>NUTS-2Eurostat, Regional Science and Technology Statistics in the RCI (2022) [49]
LeadershipThe presence of leaders that guide and direct collective actionEU research framework program H2020 in 1000 EUR per member of the working-age population <2017>NUTS-3Ongoing spatial monitoring of the BBSR (2014–2017) [50]
FinanceThe presence of financial means
to invest in business activities
Percentage of start-ups that received external financial support in loans, venture capital, or funds at least once <2018–2020>NUTS-3IAB/ZEW Start-up Panel (2021) [17]
Table 2. Descriptive statistics (n = 390).
Descriptive StatisticsMeanSt. Dev.MinMax
Firm size (employees) (mean)3.3244.8890.00080.500
Firm size (turnover) (mean)7.871 × 10111.554 × 10130.0003.070 × 1014
In-house R&D (mean)15,406.75025,099.6500.000200,000.000
Manufacturing industries (mode)0.6970.4600.0001.000
Firm age (mean)2.0760.6990.0005.333
Creative class2.5202.1320.41516.048
Amenities1177.731547.731328.0002987.000
Population-employment density794.7641094.98147.6607679.780
Population growth0.8572.277−6.6098.565
Public transportation583.267579.462144.0006978.000
Cycle lanes8.48258.1040.000850.310
Entrepreneurial ecosystems (EEs) (PCA)0.0000.728−5.1231.056
Region type1.7030.8351.0003.000
Table 3. Bonferroni-adjusted pairwise t-test 1. *** = p < 0.001.
Pairwise t-Tests (Bonferroni)UrbanIntermediate
Urban-3.3 × 10⁻⁵ ***
Intermediate3.3 × 10−5 ***-
Rural1.7 × 10−8 ***0.84
Table 4. Bonferroni-adjusted pairwise t-test 2. *** = p < 0.001.
Pairwise t-Tests (Bonferroni)UrbanIntermediate
Urban-4.1 × 10⁻⁶ ***
Intermediate4.1 × 10−6 ***-
Rural1.3 × 10−9 ***0.87
Table 5. Random intercept model of the first dependent variable.
Fixed Effects
EstimateStd. Errort ValuePr (>|t|)
(Intercept)2.2610.3895.8100.004
Firm size (employees) (mean)−0.0700.151−0.4640.643
Firm size (turnover) (mean)0.0600.1490.4040.686
In-house R&D (mean)0.2200.1551.4180.157
Manufacturing industries (mode)0.2740.3380.8110.418
Firm age (mean)0.1400.1520.9210.358
Creative class0.8670.1934.4800.000
Amenities0.3760.2611.4430.150
Population-employment density1.4970.2206.8160.000
Population growth0.0770.1620.4780.633
Public transportation−0.0780.196−0.3990.690
Entrepreneurial ecosystems (EEs) (PCA)0.7330.1834.0010.000
Cycle lanes0.5780.1523.8100.000
EEs X Cycle lanes0.0770.1480.5190.604
Random variance0.218 0.127
Likelihood Ratio Test (Chisq)134.59 <2.2 × 10⁻¹⁶
AIC1981.8
Table 6. Random intercept model of the second dependent variable.
Fixed Effects
EstimateStd. Errort ValuePr (>|t|)
(Intercept)3.5190.8174.3060.021
Firm size (employees) (mean)−0.0730.253−0.2870.774
Firm size (turnover) (mean)0.1340.2480.5380.591
In-house R&D (mean)0.3680.2601.4170.157
Manufacturing industries (mode)0.2370.5640.4200.675
Firm age (mean)0.1480.2540.5850.559
Creative class1.0780.3243.3320.001
Amenities0.6700.4371.5330.126
Population-employment density2.4790.3676.7570.000
Population growth0.1040.2710.3830.702
Public transportation−0.1030.329−0.3140.753
Entrepreneurial ecosystems (EEs) (PCA)1.1690.3073.8100.000
Cycle lanes0.9680.2533.8190.000
EEs X Cycle lanes0.2410.2470.9760.330
Random variance1.341 0.009
Likelihood Ratio Test (Chisq)137.3 <2.2 × 10⁻¹⁶
AIC2372.7
Disclaimer/Publisher’s Note: The statements, opinions and data contained in all publications are solely those of the individual author(s) and contributor(s) and not of MDPI and/or the editor(s). MDPI and/or the editor(s) disclaim responsibility for any injury to people or property resulting from any ideas, methods, instructions or products referred to in the content.

