Article

Comprehensive Risk Assessment of Smart Energy Information Security: An Enhanced MCDM-Based Approach

College of Management, Xi’an University of Science and Technology, Xi’an 710054, China
*
Author to whom correspondence should be addressed.
Sustainability 2025, 17(8), 3417; https://doi.org/10.3390/su17083417
Submission received: 19 March 2025 / Revised: 4 April 2025 / Accepted: 10 April 2025 / Published: 11 April 2025

Abstract

:
To address the challenges of assessing information security risks in smart energy systems, this study proposes a multi-attribute decision support method based on interval type-2 fuzzy numbers (IT2TrFN). First, expert questionnaires were designed to gather insights from eight specialists in the fields of smart energy and safety engineering. Linguistic terms associated with IT2TrFN were employed to evaluate indicators, converting expert judgments into fuzzy numerical values while ensuring data reliability through consistency measurements. Subsequently, a decision hierarchy structure and an expert weight allocation model were developed. By utilizing the score and accuracy functions of IT2TrFN, the study determined positive and negative ideal solutions to rank and prioritize the evaluation criteria. Key influencing factors identified include the rate of excessive initial investment, regulatory stringency, information security standards, environmental pollution pressure, and incident response timeliness. The overall risk index was calculated as 0.5839, indicating a moderate level of information security risk in the evaluated region. To validate the robustness of the model, sensitivity analyses were conducted by varying IT2FWA (Weighted aggregated operator) and IT2FGA (Weighted geometric operator) operator selections and adjusting weight coefficients. The results reveal that key indicators exhibit high risk under different scenarios. This method provides an innovative tool for the scientific evaluation of information security risks in smart energy systems, laying a solid theoretical foundation for broader regional applications and the expansion of assessment criteria.

1. Introduction

Energy is the cornerstone of socio-economic development and plays a crucial role in driving economic growth. For nations committed to sustainable development, energy security remains a top priority. According to the Asia Pacific Energy Research Centre, energy security encompasses the availability, accessibility, environmental adaptability, and cost-effectiveness of sustainable energy resources [1]. Ensuring the security of energy supply is a vital indicator of the clean, low-carbon, and sustainable expansion of energy systems. However, with the continuous growth in global energy demand, energy security faces significant challenges. It is estimated that by 2040, energy consumption in developing countries will increase by 33% [2]. The growth of economic clusters and population further drives energy demand, which, if not effectively managed, could have negative consequences for global energy security.
Amid the accelerated global energy transition and rapid advancements in information technology, smart energy systems have emerged as a key direction for the intelligent, efficient, and sustainable development of the energy industry [3]. Smart energy systems leverage technologies such as the Internet of Things (IoT), big data, and artificial intelligence (AI) to enable intelligent perception, optimized management, and efficient coordination of energy production, transmission, and consumption. However, the “physical-information” coupling characteristics of smart energy systems introduce complex security risks [4]. As the proportion of renewable energy sources continues to rise, changes in the energy structure bring new challenges, such as the instability of renewable energy, insufficient energy storage technologies, and an increased reliance on data in smart energy systems. These issues complicate energy security management, particularly in the realm of information security, where traditional energy management models can no longer meet the needs of modern smart energy systems.
Despite the advantages of smart energy systems in terms of intelligence and sustainability, information security risks are becoming increasingly prominent, posing critical constraints to their healthy development. These risks include concerns over data privacy, system stability, and service continuity, with potentially far-reaching impacts on socio-economic and national security. For instance, smart grids rely on numerous sensors and data transmissions, which, if subjected to cyberattacks or data breaches, could lead to energy supply disruptions and even regional power outages. Additionally, smart energy systems store vast amounts of user data, such as energy usage patterns and consumption records. If these data are unlawfully accessed or misused, it could pose a serious threat to user privacy.
In recent years, cyberattacks on the energy sector have become more common. For example, in 2021, the U.S. Colonial Pipeline suffered a ransomware attack, leading to fuel shortages along the East Coast and exposing vulnerabilities in energy infrastructure cybersecurity [5]. Similarly, smart grids and gas pipelines in Europe and Asia have become frequent targets for hackers. In May 2021, Norway’s energy and infrastructure technology provider, Volue, was attacked by the Ryuk ransomware, resulting in the shutdown of applications for water supply and treatment facilities across 200 cities, affecting 85% of the country’s residents [6]. In December 2023, a cyberattack caused a nationwide disruption of Iran’s gas stations, affecting 70% of fuel service stations [7]. These incidents highlight that the information security risks of smart energy systems have become a global challenge.
To address the information security risks in smart energy systems, intelligent energy risk assessment is essential. The integration of information and communication technology (ICT) into power systems has expanded the potential attack surface for cyber threats, necessitating robust risk assessment methods [8]. However, current research primarily focuses on technical risk analysis, while neglecting environmental, economic, and managerial factors. Additionally, existing information security risk assessments are often domain-specific and lack comprehensive evaluations across all energy systems in a given region. Traditional cybersecurity risk assessment methods, such as attack trees (AT), fault tree analysis (FTA), and risk matrix-based approaches, are based on static models [9]. However, these methods struggle to adapt to the dynamic, complex, and cross-domain nature of smart energy systems. Therefore, a comprehensive and adaptive risk assessment method is urgently needed to effectively identify and address multidimensional risks in smart energy systems.
While previous studies have largely focused on technical solutions and domain-specific applications, this study contributes to the literature by introducing a holistic approach that integrates environmental, technical, economic, and managerial perspectives within the risk assessment process. Multi-Criteria Decision-Making (MCDM) methods have been widely applied in energy security management and risk assessment. MCDM methods allow decision-makers to optimize choices when confronted with multiple conflicting criteria. For example, in the natural gas industry, MCDM methods have been used for pipeline safety assessments to optimize maintenance plans and resource allocation [10]. Similarly, MCDM methods have been applied in the information security risk assessment of smart grids, including fuzzy logic-based MCDM and cumulative prospect theory-based security analysis [11].
The advantage of MCDM methods lies in their ability to simultaneously consider multiple decision factors, such as environmental, economic, technical, and managerial aspects, making them highly applicable in risk assessments for complex systems. Methods such as the Analytic Hierarchy Process (AHP), Decision-Making Trial and Evaluation Laboratory (DEMATEL), VIKOR, and TOPSIS have been applied in the risk analysis of smart energy systems [12]. However, this study extends the application of MCDM methods to the information security risk assessment of smart energy systems by incorporating cross-domain risks, including environmental and managerial aspects, which have often been overlooked in prior research [13]. Despite the effectiveness of MCDM methods in energy security management, certain limitations remain. First, there is a lack of holistic analysis, as most existing studies focus on domain-specific risk assessments, such as smart grids or gas pipelines, rather than considering smart energy systems as an integrated whole. Second, there is an over-reliance on technical aspects, with most studies concentrating on cybersecurity threats such as network attacks and data security, while neglecting environmental, economic, and managerial risks [14].
To address these research gaps, this study introduces a comprehensive MCDM-based risk assessment method for smart energy information security, marking a significant contribution by evaluating risks across multiple domains and offering a holistic framework that systematically integrates and ranks these factors. Interval Type-2 Fuzzy Numbers (IT2TrFN) are advanced fuzzy sets characterized by upper and lower membership functions, enabling the representation of complex uncertainties in decision-making processes. The IT2TrFN method offers significant advantages over traditional fuzzy approaches by capturing higher-order uncertainties in expert judgments, making it particularly suitable for dynamic risk assessment in smart energy systems. This approach evaluates risks from four dimensions—environmental, technical, economic, and managerial—constructing a holistic assessment framework to systematically analyze threats and use MCDM models for comprehensive evaluation and ranking of risk factors, thus providing scientific guidance for decision-makers.
The contributions of this study are as follows: First, it proposes a systematic smart energy information security risk assessment framework, addressing the limitations of existing research by integrating environmental, economic, technical, and managerial factors to enhance the comprehensiveness and scientific validity of assessments. Second, it provides a quantitative analysis method based on MCDM, offering scientific decision-making support for policymakers and energy managers. Lastly, this research expands the theoretical framework of smart energy security management and provides practical guidance for building more intelligent, resilient, and secure smart energy systems in the future.

2. Literature Review

2.1. Information Security Risks in Smart Energy Systems

Smart energy systems integrate advanced technologies such as smart grids, Internet of Things (IoT) devices, data analytics, and distributed energy production to improve energy efficiency, optimize infrastructure, and enhance overall security [15]. These systems are pivotal in advancing energy distribution and management, directly influencing energy security. Recent cybersecurity standards, such as ISO/IEC 27001 and the NIST Cybersecurity Framework, have been increasingly adopted to address the security challenges within these systems, ensuring alignment with international cybersecurity practices. Wang et al. underscore the role of smart grids in improving energy security and reliability [16], while Arsecularatne et al. highlight the importance of data-driven decision-making for optimizing energy usage, load scheduling, and security monitoring [17]. Machine learning and AI algorithms further enhance predictive analytics for identifying energy consumption patterns, while emerging AI-driven threat detection technologies provide real-time monitoring, bolstering the capacity to identify vulnerabilities and mitigate security risks. These innovations foster industrial progress, leading to the development of complex energy system architectures that indirectly strengthen energy security [18].
However, despite their potential advantages, smart energy systems face significant challenges, such as data privacy risks, high implementation costs, and the need for effective governance frameworks. The integration of ICT infrastructure into energy management has improved monitoring and optimization capabilities [2]. However, some studies raise concerns that the energy consumption associated with ICT could undermine sustainability objectives [19]. Empirical research indicates that ICT enhances energy efficiency and security by enabling intelligent energy management and driving smart industrial advancements [20]. However, the increasing use of AI and machine learning to optimize security measures raises concerns about the adequacy of traditional security frameworks, highlighting the need for adaptive and evolving defense strategies in smart energy systems.
While the existing literature primarily focuses on theoretical models of smart energy systems, fewer studies examine the potential security risks introduced by ICT integration. This research addresses this gap by exploring the relationship between smart energy systems and information security risks. Empirical findings suggest that the development of smart energy systems affects energy security management in varying degrees across different economies. Some studies report a positive correlation between the adoption of smart energy systems and improved information security, but further research is required to assess the impact of AI and machine learning on security frameworks within these evolving systems.

2.2. Application of MCDM Methods in Smart Energy Information Security Risk Assessment

Multi-Criteria Decision-Making (MCDM) methods have been widely applied in managing and assessing risks within smart energy systems [21]. These methods assist decision-makers in optimizing choices when faced with multiple conflicting criteria, thereby enhancing the scientific validity of security strategies. In smart energy security management, MCDM methods facilitate the evaluation of security strategies, resource allocation, and system resilience [14]. The incorporation of AI-based algorithms into MCDM frameworks has improved decision-making by enabling real-time threat detection and dynamic risk evaluation, ensuring that security strategies are adaptive to emerging risks. Fuzzy MCDM approaches, which integrate fuzzy logic, offer flexible frameworks to address uncertainties in security evaluations [22]. Additionally, cumulative prospect theory-based MCDM methods quantify decision-makers’ risk preferences, improving the accuracy of assessments [11].
Smart energy security encompasses multiple dimensions, including data privacy, cybersecurity threats, and system stability [23]. Traditional single-criterion security evaluation methods often fail to capture the complexity of these interconnected issues. MCDM methods, particularly those based on interval-valued fuzzy sets, enhance risk assessment reliability in uncertain environments [24]. Recent advancements, such as the integration of MCDM with deep learning techniques, enable machine learning algorithms to detect security risk patterns while MCDM models analyze the contributing factors and optimize protective measures [25]. AI-driven frameworks, such as those utilizing generative adversarial networks (GANs), have been introduced to bolster cybersecurity defenses in smart energy systems, providing more robust defense mechanisms [26].
Despite the advantages of MCDM methods, challenges remain, particularly the reliance on expert judgment, which can be subjective and inconsistent. Moreover, some security risk indicators, such as the potential impact of cyberattacks, are inherently difficult to quantify [27]. To address these challenges, researchers have integrated fuzzy set theory and AI-enhanced consistency measurement techniques into MCDM methods to improve reliability and minimize biases in expert judgment. Triangular fuzzy numbers and interval type-2 fuzzy sets increase flexibility by reducing dependence on precise numerical data [28]. The incorporation of consistency measurements further mitigates expert bias, improving the transparency and fairness of risk evaluations.
Several advanced MCDM methods have been proposed to refine smart energy security assessments. Analytical Hierarchy Process (AHP) and Analytical Network Process (ANP) have been used to quantify the relative importance of different security risk factors [29]. AHP structures pairwise comparisons to determine criterion weights but assumes the independence of criteria, which may not be valid in complex energy security assessments [30]. In contrast, ANP considers the interdependencies among criteria, making it more suitable for comprehensive security risk analysis. Hybrid approaches combining MCDM with AI and machine learning models are increasingly being explored to enhance these assessments.
Consensus measurement techniques have refined the application of MCDM in security risk assessment [31]. Traditional MCDM methods often lack standardized consensus evaluations, leading to inconsistencies in expert opinions [32]. AI-based consensus measurement techniques help reduce discrepancies and improve the robustness and consistency of evaluations. These methods help align expert opinions and dynamically adjust weight allocations [33], thereby enhancing decision-making [34]. In the context of smart energy security [35], AI-driven anomaly detection models have been integrated with MCDM to address dynamic cybersecurity threats, offering real-time adaptability and improving risk mitigation strategies.
Overall, MCDM methods, when integrated with AI technologies and consensus measurement frameworks, hold significant potential to enhance the accuracy and adaptability of smart energy security risk assessments. Future research should focus on exploring the application of AI-driven adaptive MCDM methods to strengthen the resilience of smart energy systems against evolving cybersecurity threats and emerging risk landscapes.

3. Methodology

The IT2TrFN-based Multi-Criteria Decision-Making (MCDM) method was selected for this study due to its ability to address the dynamic and cross-domain nature of smart energy systems—an area where traditional risk assessment methods often fall short. The methodology employed in this research is structured into four stages, each designed to systematically assess the information security risks associated with smart energy systems. The first stage focuses on the identification and construction of an indicator system relevant to smart energy information security risk assessment. This system is developed through an extensive review of the existing literature, ensuring that it encompasses all critical aspects of smart energy systems. The indicator system provides the foundation for subsequent stages by identifying the key factors that influence security risks. In the second stage, data preprocessing is carried out. This involves determining the relative importance of the experts based on their expertise and experience. The process includes the construction of two matrices: the Initial Decision Matrix ( I D M ) and the Aggregated Decision Matrix ( A D M ). These matrices include previously identified secondary and tertiary indicators. During this stage, consensus metrics must meet the fundamental requirements for decision modeling. The outcome of this stage is the creation of a comprehensive Aggregated Weighted Group Decision Matrix ( C A W G D M ).
The third stage involves the analysis of the results to assess the performance of the developed method. This includes the identification of both the Negative Ideal Solution ( N I S ) and Positive Ideal Solution ( P I S ). The distance between these ideal solutions and the individual indicators is then calculated. This enables the calculation of the level index, which is used to reveal the information security risks associated with smart energy systems in the studied region.
The final stage is dedicated to sensitivity analysis, which evaluates the robustness of the proposed method from two perspectives. The first perspective examines the variation in EA(Expert Assessment) weights under different aggregation operators. The second perspective explores the impact of varying parameter θ values on the E A weights. This stage is crucial for understanding the stability of the decision-making process and ensuring the method’s reliability under different conditions. Both the IT2TrFN and MCDM methods utilized in this study are implemented using Matlab 2022a, ensuring robust data processing and analysis capabilities.
To establish the decision hierarchy, it is essential to identify all constituent elements. The hierarchy consists of a set of n criteria (denoted as B 1 ,   B 2 , , B n ) and r indicators (denoted as C 1 , C 2 , C r ). Additionally, the formation of a collaborative expert group (labeled as E 1 ,   E 2 , , E l ) is a key step in the practical implementation of the developed method. The process for implementing this methodology is described in detail through the following steps:
Step 1: Assigning weights to experts. This step involves determining the relative importance of each expert within the group. Two specific parameters, d e 1 and d e 2 , are used to calculate the weight of the e t h expert in a group of l experts. The calculation procedure is outlined as follows:
d e 1 = m e + δ e m e m e + y e + m e m e + y e m e + n e + λ e d e 2 = μ e 2 π + γ e μ e 2 π μ e + η e + μ e μ e + η e 2 π μ e + η e + σ e ω e = ( 1 ϑ ) d e 1 + ϑ d e 2 1 l ( 1 ϑ ) d e 1 + ϑ d e 2
where ω e is the weight of the e t h expert, and ϑ is the weight coefficient.
Step 2: The Initial Decision Matrix ( I D M ) is created by assigning linguistic terms to each criterion, which are paired with interval type-2 fuzzy numbers ( I T 2 T r F N ) to reflect the importance level of each indicator. These I T 2 T r F N s are subsequently defuzzified in a specified manner to construct the matrix.
To ensure the reliability of the data, outliers or extreme values in the expert assessment data are identified using the interquartile range (IQR) method. Specifically, the IQR is calculated as the difference between the 75th percentile (Q3) and the 25th percentile (Q1) of the expert judgments. Any data points that fall below Q1 − 1.5 × IQR or above Q3 + 1.5 × IQR are flagged as potential outliers. These outliers are then reviewed and adjusted through iterative consensus-building sessions with the experts to ensure alignment with the overall assessment context. This process mitigates the impact of extreme values on the final index values, thus enhancing the robustness and reliability of the results.
A ~ ~ = A ~ i U , A ~ i L = a i 1 U , a i 2 U , a i 3 U , a i 4 U ; H 1 A ~ i U , H 2 A ~ i U , a i 1 L , a i 2 L , a i 3 L , a i 4 L ; H 1 A ~ i L , H 2 A ~ i L
Here, H j ( A ~ i U ) and H j ( A ~ i L ) represent the membership degrees of the j + 1 elements in the membership functions a i ( j + 1 ) U and a i ( j + 1 ) L , where 1 j 2 .
D e f u z z i f i e d A ~ ~ i = a i 4 U a i 1 U + H 1 A ~ i U a i 2 U a i 1 U + H 2 A ~ i U a i 3 U a i 1 U 4 + a i 1 U + a i 4 L a i 1 L + H 1 A ~ i L a i 2 L a i 1 L + H 2 A ~ i L a i 3 L a i 1 L 4 + a i 1 L 2
Constructing the I D M requires the arrangement of linguistic terms and I T 2 T r F N to form the matrix.
Z e B = X 1 X 2 X q B 1 u 11 e u 21 e u 1 q e B 2 u 12 e u 22 e u 2 q e B n u 1 n e u n 2 e u n q e
Here, Z e B represents the I D M constructed by the e t h expert, and q is the number of objects.
Step 3: Expert opinions are integrated into a unified decision matrix using a weighted aggregation approach, helping to consolidate individual assessments into a collective judgment.
M ω Z 1 B , Z 2 B , , Z l B = ω 1 Z 1 B ω 2 Z 2 B ω l Z l B =                                     1 1 l 1 m i j ( e ) 2 ω e v i 2 π 1 1 l 1 μ e 2 π 2 ω e , 1 l n i j ( e ) ω e v i 2 π 1 n w e i 2 π ω e , 1 l 1 m i j ( e ) 2 ω e 1 l 1 m i j ( e ) 2 δ i j ( e ) 2 ω e v i 2 π 1 l 1 μ e i 2 π 2 ω e Π 1 l 1 μ δ i 2 π 2 γ e i 2 π 2 ω e
Here, ω e represents the weight assigned to the e t h expert.
Step 4: The construction of the Aggregated Decision Matrix ( A D M ) to assess the relative importance of the considered secondary indicators is as follows:
Z B = X 1 X 2 X q B 1 u 11 B u 12 B u 1 q B B 2 u 21 B u 22 B u 2 q B B n u n 1 B u n 2 B u n q B
Here, Z B represents the A D M . In practice, a value of 1 is typically assigned to each object. Therefore, the A D M can be expressed as: Z B =   X 1 B 1 u 11 B B 2 u 21 B B n u n 1 B and Z B =   X 1 B 1 u 11 B B 2 u 21 B B n u n 1 B .
It is essential to note that before proceeding further with the data processing, consistency measures must be met. Consistency is ensured through the application of Appendix A.1.
Step 5: Construction of the I D M for Tertiary Indicators. Step 5 involves the construction of the IDM for the tertiary indicators. Secondary indicators consist of various tertiary indicators; for example, the secondary indicator B 1 includes two tertiary indicators C 1 and C 2 , while B 2 includes C 3 and C 4 . Experts evaluate the performance of these tertiary indicators under their respective secondary indicators. The I D M specific to expert C 4 is constructed as follows:
Z e C = B 1 B 2 B n C 1 u 11 C t C 2 u 21 C t C 3 u 32 C t C 4 u 42 C t C r u r n C t
Here, Z e C represents the I D M constructed by expert e t h , and u i j C t = m v i j ( e ) i μ e , n v i j ( e ) i η e , δ v i j ( e ) i γ e , λ v i j ( e ) i σ e .
Step 6: The IDM for tertiary indicators is created, followed by the aggregation of expert opinions to form the corresponding ADM for these indicators. This step integrates expert evaluations into a final decision matrix [36].
I T 2 F W A a ~ ~ j ( 1 ) , a ~ ~ j ( 2 ) , , a ~ ~ j ( e ) = e = 1 n D M θ e a j , 1 U ( e ) , e = 1 n D M θ e a j , 2 U ( e ) , e = 1 n D M θ e a j , 3 U ( e ) ; 1 e = 1 n D M 1 h A j U ( e ) θ e , e = 1 n D M θ e a j , 1 L ( e ) , e = 1 n D M θ e a j , 2 L ( e ) , e = 1 n D M θ e a j , 3 L ( e ) ; 1 e = 1 n D M 1 h A j L ( e ) θ e
Here, θ e represents expert e t h , and n D M denotes the number of decision-makers.
Z C = B 1 B 2 B n C 1 u 11 C C 2 u 21 C C 3 u 32 C C 4 u 42 C C r u r n C
Here, Z C represents the A D M , and u i j C = m v C i j i μ e , n v C i j i η e , δ v C i j i γ e , λ v C i j i σ e . Before proceeding with further data processing, it is crucial to ensure that consistency measures meet the basic requirements.
Step 7: Constructing the C A W G D M to evaluate the tertiary indicators in detail. This process involves weighting the aggregated matrix ( Z C ) according to the conditions specified in W B . The equation is outlined as follows:
Z C o m = W B Z C n × r = m B m C i j v i 2 π μ e 2 π A μ e 2 π , n B 2 + n C i j 2 n B 2 n C i j 2 v i 2 π η e 2 π 2 + C η e 2 π 2 η e 2 π 2 C η e 2 π 2 , 1 n B 2 δ C i j 2 + 1 n C i j 2 δ B 2 δ C i j 2 δ B 2 v i 2 π 1 η e 2 π 2 C Y 2 π 2 + 1 C e 2 π 2 γ e 2 π 2 C γ e 2 π 2 γ e 2 π 2
The constructed C A W G D M will be presented as follows:
Z Q = B 1 B 2 B n C 1 u 11 Q C 2 u 21 Q C 3 u 32 Q C 4 u 42 Q C r u r n Q
Here, u i j Q = m i j v Q i μ e , n i j v Q i η e , δ i j v Q i γ e , λ i j v Q i σ e . Z A can be represented as: C 1 C 2 C 3 C r u 11 Q u 21 Q u 31 Q u r 1 Q .
Step 8: Determining the P I S and N I S in the C A W G D M . P I S is represented as C , characterized by the maximum value in the entire matrix, while N I S is represented as C + , containing the minimum value. The formulas for these solutions are as follows:
C + = m a x 1 i r u i j Q ; C = m i n 1 i r u i j Q
Here, P I S and N I S are derived from the scores and accuracy functions of I T 2 T r F N (Appendix A.2). P I S and N I S are denoted as C + = m i j + , n i j + , δ i j + , λ i j + , μ i j + , η i j + , γ i j + , σ i j + and C = m i j , n i j , δ i j , λ i j , μ i j , η i j , γ i j , σ i j .
Step 9: Measuring the distance from the tertiary indicators to the P I S and N I S . The calculations for these are outlined as follows:
K C i , C + = ρ { m , n , δ , λ } ρ i j 2 ρ i j + 2 2 + 1 16 π 4 ζ { μ , η , γ , σ } ζ i j 2 ζ i j + 2 2 K C i , C = ρ { m , n , δ , λ } ρ i j 2 ρ i j 2 2 + 1 16 π 4 ζ { , η , η , γ , σ } ζ i j 2 ζ i j 2 2  
Here, K C i , C + and K C i , C represent the distances from the tertiary indicators to the P I S and N I S .
Step 10: Distances from the tertiary indicators to both the PIS and NIS are calculated. The ranking values are then determined for each indicator, and the level index is computed by averaging these values.
α C i = K C i , C + K C i , C + Z C i , C +
χ = 1 r i = 1 r α C i
Here, α C i refers to the ranking value assigned to sub-criteria, while χ represents the value of the Level Index.
To provide a clearer description of the model we have developed, we have created a technical roadmap, as shown in Figure 1.

4. Case Study

This section presents an overview of the application of the proposed methodology in Shaanxi Province, China. It details the implementation process, the assessment results of smart energy information security risks in the province, and a comparison analysis with alternative methods. The theoretical and managerial implications derived from the study are also discussed.

4.1. Implementation of the Methodology

This study introduces an innovative Multi-Criteria Decision-Making (MCDM) approach to assess the information security risks of smart energy cities. The primary objective is to calculate the information security risk index for smart energy cities. After identifying relevant criteria and indicators, an indicator system for smart energy cities was established. The information security risk index is categorized into three levels: low, medium, and high, based on the calculated index values.
Shaanxi Province was selected as the case study location due to its significance as a major energy hub in Northwest China. Known as “China’s Kuwait”, Shaanxi is rich in key energy resources such as coal, oil, and natural gas. Its developed energy system plays a crucial role in supporting the national energy supply and economic development. Moreover, as a strategic connector between eastern and western China, Shaanxi holds an irreplaceable position in energy transport and national strategic planning (Figure 2).
Through an extensive literature review, the study categorizes the indicators for evaluating smart energy information security risks into four main types: environmental, technological, economic, and management risks. Specifically, the information security risk for smart energy cities is classified as a primary indicator in the decision hierarchy, consisting of four secondary indicators. Each secondary indicator is further subdivided into 6–8 tertiary indicators, yielding a total of 29 tertiary indicators. Table 1 provides a detailed description of the identified indicators and the quantification method for each tertiary indicator. The secondary indicators are labeled as B 1 , B 2 , B 3 , B 4 , and the tertiary indicators are labeled as C 11 , C 12 , C 13 , , C 46 . Based on these identified indicators, a decision hierarchy is constructed.
Table 1. Smart Energy Information Security Risk Indicator System.
ObjectiveSecondary IndicatorTertiary IndicatorIndicator QuantificationReference
Smart Energy Information Security RiskEnvironmental Risk B 1 Climate Change Risk C 11 Severe, Moderate, Mild[37]
Resource Supply Stability C 12 Strong, Moderate, Weak[38]
Environmental Pollution Pressure C 13 Severe, Moderate, Mild[39]
Policy and Regulatory Intensity C 14 Severe, Moderate, Mild[40]
Legal Protection for Information Security C 15 Severe, Moderate, Mild[41]
Information Security Management System C 16 Severe, Moderate, Mild[42]
Information Security Standards C 17 Available, In Progress, None[43]
Technical Risk B 2 Infrastructure Completeness C 21 (Normal Operating Time/Total Operating Time) × 100%[44]
Critical Facility Redundancy C 22 (Backup Equipment/Total Critical Equipment) × 100%[45]
Energy Information Transmission Stability C 23 (Lost Data Packets/Total Sent Data Packets) × 100%[46]
Fault Response Capability C 24 Average Fault Recovery Time (MTTR): The average time from fault occurrence to recovery[47]
Data Encryption Strength C 25 (Encrypted Data/Total Data) × 100%[48]
Unauthorized Access Detection Rate C 26 (Successfully Detected Unauthorized Access/Actual Unauthorized Access) × 100%[49]
System Vulnerability Management C 27 (Fixed Vulnerabilities/Total Found Vulnerabilities) × 100%[50]
Network Attack Defense Capability C 28 (Successfully Blocked Attacks/Total Attacks) × 100%[51]
Economic Risk B 3 Initial Investment Deviation C 31 [(Actual Initial Investment−Budgeted Initial Investment)/Budgeted Initial Investment] × 100%[52]
Operational Cost Growth Rate C 32 [(Current Operational Cost−Previous Operational Cost)/Previous Operational Cost] × 100%[53]
Technology Update Cost Share C 33 (Technology Update Cost/Total Cost) × 100%[54]
Unit Energy Production Cost C 34 Total Production Cost/Total Energy Output[55]
Energy Price Volatility C 35 [(Current Energy Price−Previous Energy Price)/Previous Energy Price] × 100%[56]
Market Demand Growth Rate C 36 [(Current Market Demand−Previous Market Demand)/Previous Market Demand] × 100%[53]
Investment Return Period C 37 Total Investment/Average Annual Net Profit[57]
Revenue Volatility C 38 [(Current Revenue−Previous Revenue)/Previous Revenue] × 100%[58]
Management Risk B 4 Information Security Responsibility Implementation C 41 Strong, Moderate, Weak[59]
Security Training Coverage Rate C 42 (Actual Participants/Required Participants) × 100%[60]
Emergency Plan Drill Frequency C 43 Annual Drills/Planned Drills[61]
Timeliness of Security Incident Response C 44 (Incidents Responded to within the Specified Time/Total Incidents) × 100%[62]
Operations and Maintenance Compliance Rate C 45 (Compliant Operations/Total Operations) × 100%[63]
Outsourced Security Management Capability C 46 Strong, Moderate, Weak[64]
The parameters used in this article are shown in Table 2.
Before the first phase of the assessment, data collection tools were designed to capture expert insights on the indicators. Expert selection was based on their specific research areas and years of practical experience, ensuring relevance to the subject matter. A total of 8 experts in the fields of smart energy and safety engineering were invited to participate in the assessment [65,66]. During the evaluation, linguistic terms related to I T 2 T r F N were employed to assess the importance of the indicators in the given context. Table 3 provides a comprehensive overview of the linguistic terms associated with I T 2 T r F N .
In the MCDM modeling process, experts provided data using these linguistic terms, which were then converted into corresponding fuzzy numbers. The conversion process was based on expert-defined parameters to capture the inherent linguistic uncertainty in their judgments. The fuzzy number parameters ( m s ( x ) e i μ s ( x ) , n s ( x ) e i η s ( x ) , δ s ( x ) e i γ s ( x ) , λ s ( x ) e i σ s ( x ) ) were determined by the expert’s interpretation of each linguistic term, reflecting the range of possible values. For example, the term “Extremely High (EH)” was assigned a fuzzy number where the membership function is represented by complex exponential expressions, such as 0.15 e i 2 π ( 0.20 ) , 0.90 e i 2 π ( 0.95 ) , 0.10 e i 2 π ( 0.20 ) , 0.53 e i 2 π ( 0.39 ) , based on expert experience and the specific application context. These parameters help capture both the magnitude and phase of uncertainty, ensuring that the fuzziness of expert judgments is adequately represented.
To ensure the reliability of the data, consistency measures were applied, enhancing the credibility of the results. The developed method carefully assessed consensus in two key areas: (i) the relative importance of the evaluation criteria in relation to the objective, and (ii) the detailed ratings of indicators within each criterion. The weighted coefficient of variation (CV) for these two areas was calculated as { B 1 , B 2 , B 3 , B 4 } = {0.3325, 0.2987, 0.3160, 0.3225}, indicating a high degree of consensus among the experts, as all values exceed the critical threshold of 0.30. This confirms the acceptability of expert judgments and allows for the continuation of data processing.

4.2. Evaluation Results

Once the decision hierarchy was established, the method first assigns weights to the experts. The weights assigned to each expert are as follows: E 1 = 0.142 ,   E 2 = 0.119 ,   E 3 = 0.119 ,   E 4 = 0.125 ,   E 5 = 0.065 ,   E 6 = 0.142 ,   E 7 = 0.163 ,   E 8 = 0.125 . Based on the judgments provided by the experts, the primary results are as follows: the Negative Ideal Solution ( N I S ) and Positive Ideal Solution ( P I S ) are determined using the score and accuracy functions of I T 2 T r F N . Specifically, the P I S is given by A = { 0.25 e + I 2 π 0.31 , 0.81 e + I 2 π 0.85 , 0.32 e + I 2 π 0.38 , 0.61 e + I 2 π ( 0.45 ) } and the NIS is: A = { 0.36 e + I 2 π 0.44 , 0.48 e + I 2 π 0.52 , 0.47 e + I 2 π 0.55 , 0.67 e + I 2 π ( 0.48 ) } . The ranking and ordering of these 29 tertiary indicators are presented in Figure 3 and Figure 4.
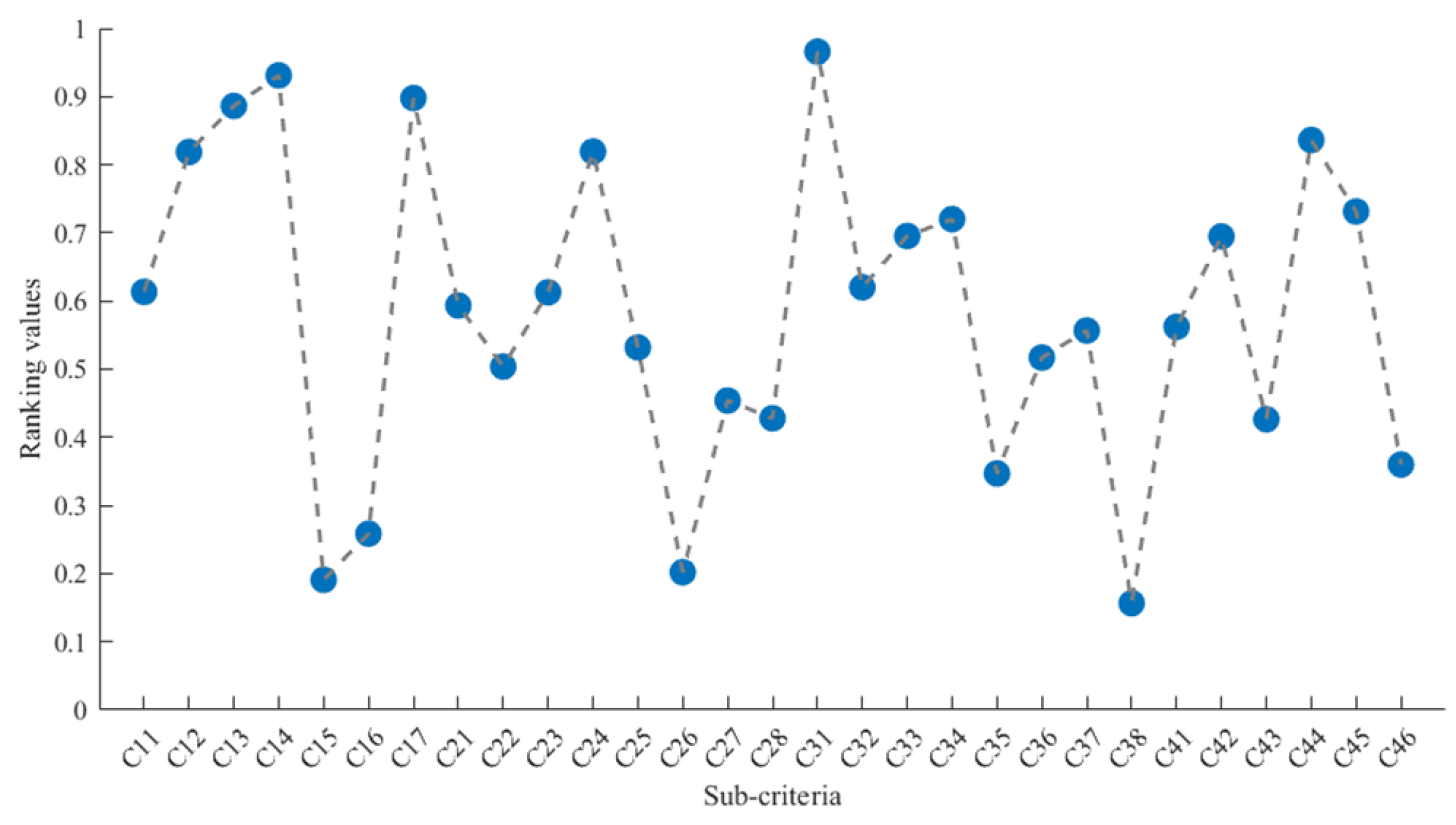
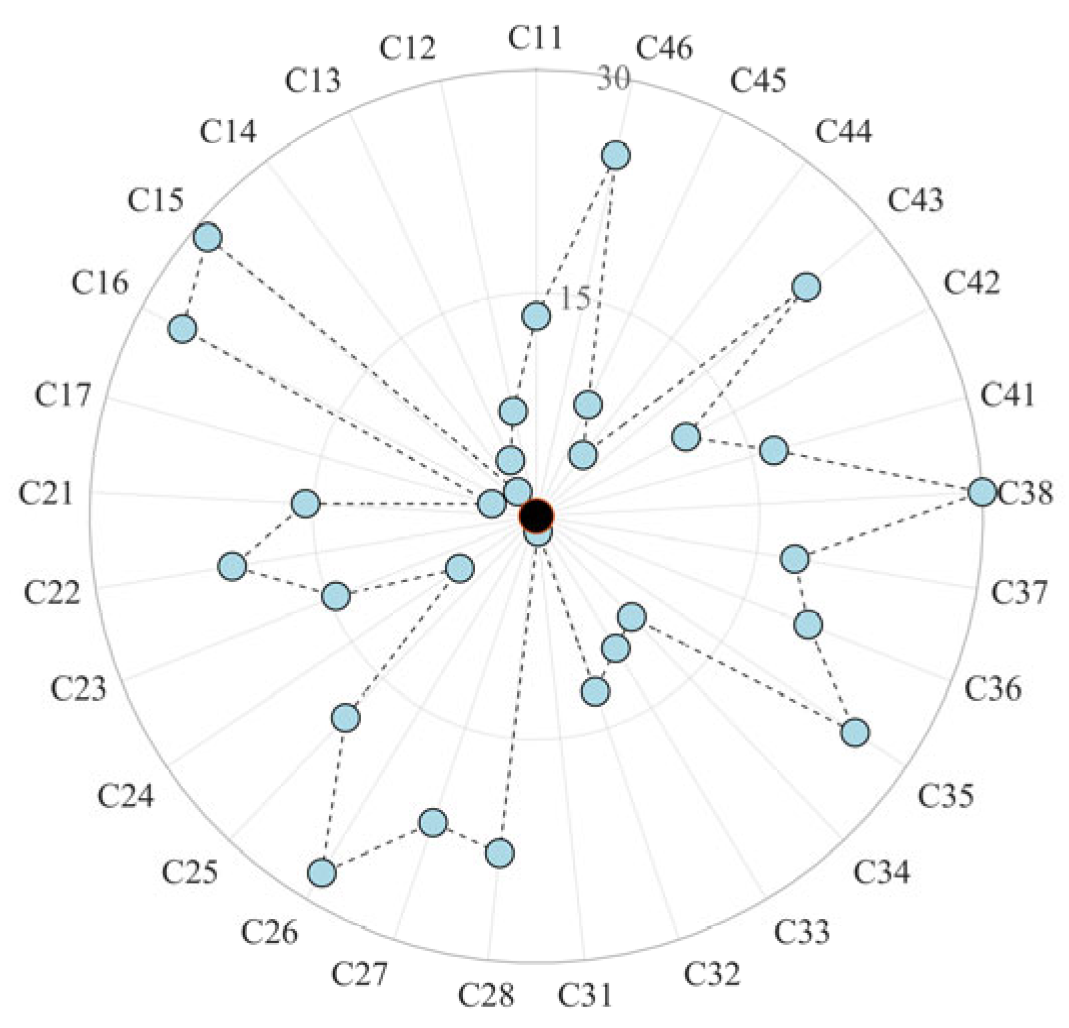
As shown in the ranking values in Figure 3, all secondary indicators except C 27 , C 28 , C 43 , C 46 , C 35 , C 16 , C 26 , C 15 , and C 38 have ranking values above 0.5. The ranking order of the secondary indicators is presented in Figure 4. The analysis reveals that the top five indicators among the secondary indicators are C 31 (Initial Investment Deviation), C 14 (Policy and Regulatory Intensity), C 17 (Information Security Standards), C 13 (Environmental Pollution Pressure), and C 44 (Timeliness of Security Incident Response). These indicators are critical factors in evaluating the information security risks of smart energy, as they influence the reliability, sustainability, and resilience of the energy system.
The average ranking value, or level index, is 0.5839, which falls within the range of [0.30, 0.60). Based on this, the smart energy information security risk for the study subject is categorized as medium risk. This indicates that there is room for improvement in key areas for Shaanxi Province. Strengthening investment efficiency, improving policy regulation, refining security standards, reducing environmental impacts, and enhancing emergency response capabilities are critical steps toward achieving a more efficient and stable information security protection system.

4.3. Sensitivity Analysis

Sensitivity analysis is crucial for understanding the impact of parameter variations on model outcomes. This analysis is conducted from two perspectives, using a detailed example to assess its robustness. The first perspective involves applying different aggregation operators, specifically I T 2 F W A and I T 2 F G A (with calculation details outlined in Equation (16)). The second perspective explores how varying the weight coefficient ( θ ) while using specific aggregation operators affects the results. This comprehensive approach allows for a thorough evaluation of the decision-making process’s stability and reliability, shedding light on how changes in these parameters influence the outcomes.
I T 2 F G A A ~ 1 , , A ~ n ( x ) = μ _ A ~ ( x ) , μ ¯ A ~ ( x ) = p = 1 n μ _ A ~ p ( x ) θ p 1 Σ θ p , p = 1 n μ ¯ A ~ p ( x ) θ p 1 Σ θ p
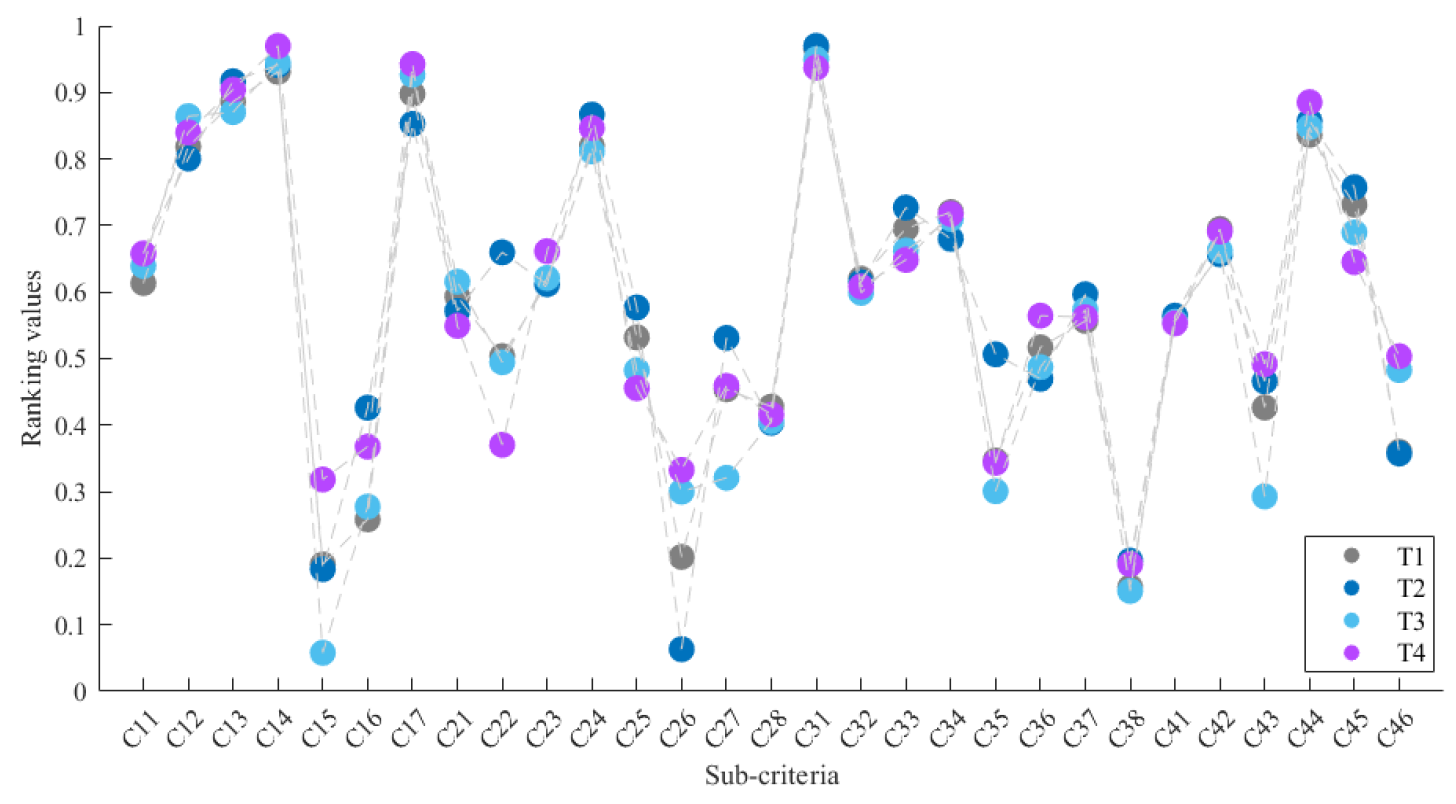
(1) Sensitivity Analysis from the First Perspective: Four distinct scenarios are established for this analysis, as outlined in Table 4. Figure 5 illustrates the ranking of indicators under these four scenarios ( T 1 , T 2 , T 3 , T 4 ). When applying specific aggregation operators, the rankings of the indicators remain largely consistent, indicating that the operator has minimal effect on the results. However, when different operators are used to aggregate judgments, especially for key indicators, significant fluctuations in ranking values are observed. This suggests that certain indicators are more sensitive to the aggregation operators, with variations in weight distribution influencing the rankings.
The analysis reveals that despite some differences, the overall ranking order remains relatively stable across scenarios. Certain indicators maintain a consistent ranking, signifying broad consensus on their importance across different conditions. However, other indicators, particularly those ranked lower or in the middle, exhibit greater fluctuations, emphasizing the impact of different aggregation operators on the ranking results.
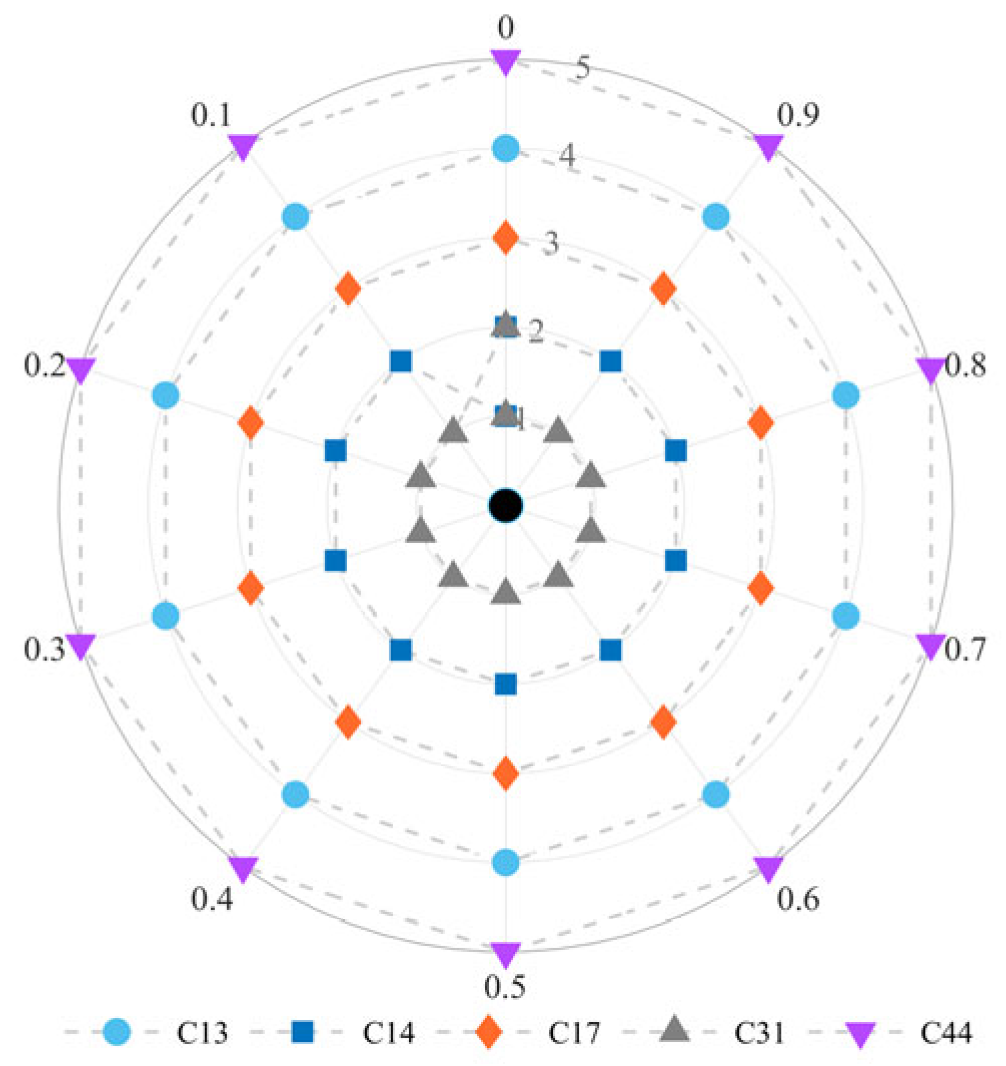
(2) Sensitivity Analysis from the Second Perspective: Regarding the effect of varying the weight coefficient ( θ ) while using specific aggregation operators, Figure 6 shows the ranking indices of the top five indicators under different weight coefficients ( θ ) using I T 2 F W A . Figure 7 further demonstrates that the ranking trends of the indicators are largely consistent, with a notable shift occurring when θ changes from 0.00 to 0.10. Figure 8 presents the indicator rankings across various θ values. Notably, indicators C 31 and C 14 consistently rank first and second, demonstrating their stability across different weight coefficient settings. As θ increases, the level index fluctuates within the range of [0.60, 1.00], indicating that the risk level of the smart energy system is relatively low. Beyond θ = 0.10, the rate of change in the average ranking value stabilizes, suggesting that further increases in θ have minimal impact on the results.
The stability of the rankings for key indicators, such as C 31 (Initial Investment Deviation) and C 14 (Policy and Regulatory Intensity), reflects the robustness of the decision-making process in evaluating information security risks, with minimal influence from the weight coefficient.

5. Discussion and Conclusions

5.1. Discussion

Based on the analysis of the top five key indicators in the risk assessment, the following strategies are proposed to mitigate information security risks in smart energy systems:
(1) Optimize Investment Decisions and Phase-based Evaluations to Enhance Capital Efficiency: To maximize the effectiveness of initial investments, it is critical to establish a structured investment decision-making process during the planning phase. A comprehensive cost–benefit evaluation system should be implemented to assess economic, technological, and risk factors for each investment, prioritizing funds for critical technologies and security measures. Additionally, adopting a phased investment approach with milestone-based assessments ensures that adjustments can be made throughout the project lifecycle. This strategy directly supports SDG 7 (Affordable and Clean Energy) by ensuring that resources are effectively allocated to improve energy access and reliability.
Hypothetical Response Scenario: In a smart energy project, failure to identify security risks during the early stages may lead to disproportionate investments in technology development at the expense of security measures. By implementing phased investments and regular evaluations, the project can identify such issues early, allowing for resource reallocation to mitigate security risks.
(2) Enhance Regulatory Frameworks, Foster Cross-departmental Collaboration, and Implement Technological Monitoring to Strengthen Enforcement: Policies and regulations play a pivotal role in preventing information security risks. It is recommended that information security policies for smart energy systems be regularly updated to reflect international best practices while considering local contexts. Establishing cross-departmental coordination mechanisms between government, industry, and academia will help ensure the effective enforcement of these regulations. Furthermore, leveraging real-time monitoring platforms powered by AI and big data can enable the early detection of security breaches.
Hypothetical Response Scenario: In the event of a data breach within a smart grid, real-time monitoring systems enable regulators to detect anomalies quickly and coordinate a response, mitigating the impact of the incident.
(3) Develop, Promote, and Regularly Update Information Security Standards: Robust information security standards are essential for ensuring a secure smart energy system. It is recommended to integrate both domestic and international best practices into a comprehensive standards framework that meets the specific needs of smart energy systems. These standards should be continuously reviewed and updated to address emerging technologies and security threats.
Hypothetical Response Scenario: If outdated cybersecurity standards are used when integrating new technologies, vulnerabilities may emerge. By adhering to the latest security standards and ensuring regular updates, these risks can be mitigated, securing the system against evolving threats.
(4) Strengthen Environmental Governance and Promote Green Technologies: Environmental factors such as pollution and equipment wear can indirectly impact information security by increasing failure rates. It is recommended to adopt green technologies and low-carbon production processes to reduce environmental pollution. This aligns with SDG 7 (Affordable and Clean Energy) by promoting clean energy solutions and SDG 9 (Industry, Innovation, and Infrastructure) by ensuring that technological innovations are sustainable and environmentally responsible.
Hypothetical Response Scenario: In regions with high pollution, environmental factors may exacerbate equipment failure rates, leading to system instability. By implementing environmental monitoring systems, anomalies can be detected early, allowing for timely intervention to maintain system stability.
(5) Establish a Comprehensive Emergency Response System: A well-coordinated emergency response system is essential for minimizing damage during security incidents. This system should include monitoring, early warning, and recovery processes, supported by advanced monitoring devices and automated alert systems.
Hypothetical Response Scenario: During a cyberattack, the emergency response team, utilizing real-time monitoring tools, can quickly detect the source of the attack and trigger an automated response system. Cross-departmental coordination ensures that resources are mobilized promptly, allowing for efficient decision-making and damage control, thereby restoring system stability.

5.2. Conclusions

This study introduces an innovative framework based on expert insights and fuzzy multi-attribute decision support methods to assess the information security risks of smart energy systems. This framework provides strong support for both theoretical and practical developments in related fields. Eight experts with extensive experience in smart energy and safety engineering were invited to assess the importance of various indicators using language terms related to IT2TrFN, ensuring the reliability of the data through consistency measures. After transforming and verifying the fuzzy data, weighted CV values (all below 0.50) were calculated to evaluate the relative importance of the standards and the detailed ratings of each indicator. This process validated the consistency of expert judgments and ensured the scientific rigor of the data processing. Using IT2TrFN’s score and accuracy functions, this study determined the Negative Ideal Solution (NIS) and Positive Ideal Solution (PIS), establishing the ranking and order of the indicators. Key factors identified for evaluating information security risks included the Initial Investment Overrun Rate, Policy and Regulatory Strength, Information Security Standards, Environmental Pollution Pressure, and Timely Response to Security Incidents.
Despite the advantages of expert-based assessments, this method does have certain limitations. Potential expert bias may arise due to individual differences in experience and subjective judgment, which can affect the consistency of evaluations. Additionally, achieving consensus across a broad range of criteria can be challenging, particularly when assessing complex and interdependent risk factors. To address these limitations, future research could explore integrating automated data collection from operational systems, which would reduce reliance on subjective assessments and enhance the objectivity and robustness of the risk evaluation process.
Furthermore, a decision hierarchy was established with expert weight allocation to create a level index for information security risk assessment, categorizing risk into high, medium, and low levels. The overall level index was found to be 0.5839, indicating a medium risk, suggesting substantial room for improvement in investment efficiency, regulatory enforcement, standard implementation, environmental impact, and emergency response capabilities. Sensitivity analysis confirmed the robustness of the model from two perspectives: aggregation operators (IT2FWA and IT2FGA) and changes in weight coefficients (θ). The results demonstrated the stability of some key indicators across different scenarios and revealed the sensitive impact of operator choices on certain rankings.
Preliminary comparisons with traditional risk assessment models, such as fault tree analysis (FTA) and risk matrix approaches, indicate that the proposed framework provides a more dynamic and comprehensive evaluation by integrating multidimensional factors. However, these alternative models might offer simpler implementation under specific conditions, highlighting potential trade-offs between complexity and adaptability.
It is important to note that the applicability of the model to real-world scenarios faces several challenges, such as the variability of real-world data, the evolving nature of cybersecurity threats, and the potential limitations in the adaptability of the model to rapidly changing technological environments. These factors may influence the precision and effectiveness of the risk assessment model in practice. While the study offers valuable theoretical insights, its application to different regions or industries may require further calibration to account for local conditions and sector-specific differences. Future research could strengthen the robustness of the sensitivity analysis by incorporating multiple weighting approaches, such as equal weighting, experience-based weighting, and familiarity-based weighting. Equal weighting assumes all experts contribute equally to the decision-making process, suitable for scenarios with homogeneous expert backgrounds. Experience-based weighting assigns higher weights to experts with more extensive experience, reflecting their deeper insights. Familiarity-based weighting prioritizes experts familiar with specific criteria or indicators, ensuring that their judgments carry greater weight in relevant areas. These approaches could be incorporated by adjusting the weight allocation model (Equation (1)) and recalculating the ranking values under different weighting schemes. Relevant studies (e.g., [67]) have shown that such methods improve the reliability and adaptability of MCDM models in complex systems.
Finally, based on the established indicator system and risk analysis results, a systematic and dynamic security risk management framework is proposed. This framework offers valuable insights for reducing risks and improving the overall security and operational efficiency of smart energy systems. Future research could integrate neural networks with the proposed MCDM framework to automatically detect threats and improve the accuracy of risk predictions by learning from historical data. This integration would enhance the model’s adaptability to dynamic cybersecurity threats and provide a more robust decision-support tool for managing complex smart energy systems. Future studies should also include detailed comparative analyses with alternative risk assessment models to further elucidate their relative advantages, refine the applicability of the model, and enhance its practical implementation.

Author Contributions

Conceptualization, methodology, writing—original draft preparation, visualization, supervision, P.D.; writing—review and editing, T.L.; funding acquisition, Z.L. All authors have read and agreed to the published version of the manuscript.

Funding

This work was supported by the Natural Science Foundation of Shaanxi Province (grant numbers 2024JC-YBMS-587).

Institutional Review Board Statement

Ethical review and approval were waived for this study due to legal regulations that do not require ethical review for research involving personal information data, according to Chapter 1, Section 3 of the Trial Regulations on Scientific and Technological Ethics Review—jointly issued by the Ministry of Science and Technology of China and nine other departments.

Informed Consent Statement

This study obtained informed consent from all participants involved in the study.

Data Availability Statement

The datasets used and/or analyzed for this study are available from the corresponding author upon reasonable request.

Conflicts of Interest

The authors declare no conflicts of interest.

Appendix A

Appendix A.1

To compute the consistency of interval type-2 fuzzy numbers, it is necessary to first determine their mean and standard deviation. Suppose there are n interval type-2 fuzzy numbers, denoted as A 1 , A 2 , , A n , where the lower and upper bounds of each interval type-2 fuzzy number A i are represented as A i L and A i U , respectively.
The mean ϑ of the interval type-2 fuzzy numbers can be calculated using the following formula:
ϑ = 1 n i = 1 n A i L + A i U 2
The standard deviation σ of the interval type-2 fuzzy numbers can be calculated using the following formula:
σ = 1 n i = 1 n A i L + A i U 2 ϑ 2
Based on the mean and standard deviation, the consistency coefficient ( C V ) of the interval type-2 fuzzy numbers can be calculated using the following formula:
C V = σ ϑ
Based on the calculated C V value, the consistency of the interval type-2 fuzzy numbers can be evaluated. A smaller C V value indicates a higher level of consistency. The specific evaluation criteria are as follows: C V > 0.3 : High consistency, 0.1 < C V 0.3 : Moderate consistency, C V 0.1 : Low consistency, requiring further analysis.

Appendix A.2

Consider the interval type-2 fuzzy set A ~ = { ( x , δ μ A ~ ( m ) , λ n A ~ ( m ) , η ϕ A ~ ( m ) , γ ψ A ~ ( m ) ) | m X } . The score function associated with A ~ is defined as follows:
S ( A ~ ) = 1 2 δ ( μ A ~ L ( m ) + μ A ~ U ( m ) ) λ ( n A ~ L ( m ) + n A ~ U ( m ) )
The corresponding accuracy function is defined as follows:
A ( A ~ ) = 1 2 η ( μ A ~ L ( m ) + μ A ~ U ( m ) ) + γ ( n A ~ L ( m ) + n A ~ U ( m ) )
If S ( A ~ 1 ) > S ( A ~ 2 ) , then A ~ 1 > A ~ 2 .
If S A ~ 1 = S ( A ~ 2 ) , then:
If A A ~ 1 > A ( A ~ 2 ) , then A ~ 1 > A ~ 2 ;
If A A ~ 1 = A ( A ~ 2 ) , then A ~ 1 = A ~ 2 .

References

  1. APERC, A. Quest for Energy Security in the 21st Century: Resources and Constraints; Asia Pacific Energy Research Centre: Tokyo, Japan, 2007. [Google Scholar]
  2. Usman, A.; Naqvi, S.M.M.A.; Ozturk, I.; Hassan, A.; Arif, A. ICT-driven urbanization and energy security risk: Empirical evidence from Group 7 and Emerging 7 economies. Environ. Impact Assess. Rev. 2025, 112, 107809. [Google Scholar] [CrossRef]
  3. Lin, X.J.; Zhang, N.; Mao, Y.H.; Chen, J.Y.; Tian, X.T.; Zhong, W. A review of the transformation from urban centralized heating system to integrated energy system in smart city. Appl. Therm. Eng. 2024, 240, 122272. [Google Scholar] [CrossRef]
  4. Fan, J.; Yang, W.; Liu, Z.; Kang, J.; Niyato, D.; Lam, K.-Y.; Du, H. Understanding Security in Smart City Domains from the ANT-Centric Perspective. IEEE Internet Things J. 2023, 10, 11199–11223. [Google Scholar] [CrossRef]
  5. Goodell, J.W.; Corbet, S. Commodity market exposure to energy-firm distress: Evidence from the Colonial Pipeline ransomware attack. Financ. Res. Lett. 2023, 51, 103329. [Google Scholar] [CrossRef]
  6. Volue. Volue Releases Postmortem Report on Cyberattack. Available online: https://www.volue.com/news/volue-releases-postmortem-report-cyberattack (accessed on 23 June 2021).
  7. Gordon, A. What to Know About the Hacker Group That Shut Down 70% of Iran’s Gas Stations. TIME 2023. Available online: https://time.com/6548680/iran-hacker-gas-station-cyberattack-israel/ (accessed on 18 December 2023).
  8. Janta, P.; Leeraphun, N.; Thapmanee, K.; Niyomna, P.; Sintuya, H.; Setthapun, W.; Maneechot, P.; Sriprapakhan, P.; Chollacoop, N.; Silva, K. Energy resilience assessment: Incorporating consideration of recoverability and adaptability in risk assessment of energy infrastructure. Energy Sustain. Dev. 2024, 81, 101506. [Google Scholar] [CrossRef]
  9. Zheng, Y.; Xue, X.; Xi, S.; Xin, W. Balancing Possibilist-probabilistic risk assessment for smart energy hubs: Enabling secure peer-to-peer energy sharing with CCUS technology and cyber-security. Energy 2024, 304, 132102. [Google Scholar] [CrossRef]
  10. Parvaneh, F.; Hammad, A. Application of Multi-Criteria Decision-Making (MCDM) to Select the Most Sustainable Power-Generating Technology. Sustainability 2024, 16, 3287. [Google Scholar] [CrossRef]
  11. Hanif, M.Z.; Yaqoob, N. Prioritized Decision Support System for Cybersecurity Selection Based on Extended Symmetrical Linear Diophantine Fuzzy Hamacher Aggregation Operators. Symmetry 2025, 17, 70. [Google Scholar] [CrossRef]
  12. Devi, N.N.; Thokchom, S.; Srivastava, G.; Jhaveri, R.H.; Roy, D.S. Demcrp-et: Decentralized multi-criteria ranked prosumers energy trading using distributed ledger technology. Peer-to-Peer Netw. Appl. 2024, 17, 549–565. [Google Scholar] [CrossRef]
  13. Qu, G.; Deng, J.; Ren, S.; Xiao, Y.; Wang, C.; Wang, J.; Duan, X.; Zhang, L. Effect of oxygen deficient conditions on oxidative spontaneous combustion characteristics of raw coal and water-immersed air-dried bituminous coal. Process Saf. Environ. Prot. 2025, 196, 106859. [Google Scholar] [CrossRef]
  14. Lin, S.-S.; Zheng, X.-J. Enhancing smart city assessment: An advanced MCDM approach for urban performance evaluation. Sustain. Cities Soc. 2025, 118, 105930. [Google Scholar] [CrossRef]
  15. Selvaraj, R.; Kuthadi, V.M.; Baskar, S. Smart building energy management and monitoring system based on artificial intelligence in smart city. Sustain. Energy Technol. Assess. 2023, 56, 103090. [Google Scholar] [CrossRef]
  16. Wang, X.; Li, S.; Rahman, M.A. A Comprehensive Survey on Enabling Techniques in Secure and Resilient Smart Grids. Electronics 2024, 13, 2177. [Google Scholar] [CrossRef]
  17. Arsecularatne, B.; Rodrigo, N.; Chang, R. Digital Twins for Reducing Energy Consumption in Buildings: A Review. Sustainability 2024, 16, 9275. [Google Scholar] [CrossRef]
  18. Awan, K.A.; Din, I.U.; Almogren, A.; Rodrigues, J.J.P.C. Quantum-Assisted Intelligent Decision Support Systems for Trustworthy Renewable Energy Management in Consumer Devices. IEEE Trans. Consum. Electron. 2024, 70, 4665–4672. [Google Scholar] [CrossRef]
  19. Chatziamanetoglou, D.; Rantos, K. Blockchain-Based Security Configuration Management for ICT Systems. Electronics 2023, 12, 1879. [Google Scholar] [CrossRef]
  20. Hu, J.-L.; Chen, Y.-C.; Yang, Y.-P. The Development and Issues of Energy-ICT: A Review of Literature with Economic and Managerial Viewpoints. Energies 2022, 15, 594. [Google Scholar] [CrossRef]
  21. Liaqat, M.; Adnan, M.; Ahmad, M.; Iqbal, M.S.; Ahmad, F.; Din, S.U. Hybrid Multi-Criteria Decision Framework for Prosumers Energy Storage Systems in Smart Grids. IEEE Access 2024, 12, 188046–188071. [Google Scholar] [CrossRef]
  22. Alhakami, W. Computational Study of Security Risk Evaluation in Energy Management and Control Systems Based on a Fuzzy MCDM Method. Processes 2023, 11, 1366. [Google Scholar] [CrossRef]
  23. Song, F.; Ma, Y.; You, I.; Zhang, H. Smart Collaborative Evolvement for Virtual Group Creation in Customized Industrial IoT. IEEE Trans. Netw. Sci. Eng. 2023, 10, 2514–2524. [Google Scholar] [CrossRef]
  24. Su, J.; Wang, D.; Xu, B.; Zhang, F.; Ling, X. An improved Interval-valued intuitionistic fuzzy MCGDM for the evaluation of agricultural products live-streaming e-commerce platform. J. Intell. Fuzzy Syst. 2023, 45, 9591–9604. [Google Scholar] [CrossRef]
  25. Sun, L.H.; Li, X.Y.; Su, C.; Wang, X.P.; Yuan, X.F. Analysis of dynamic strategies for decision-making on retrofitting carbon capture, utilization, and storage technology in coal-fired power plants. Appl. Therm. Eng. 2025, 264, 125371. [Google Scholar] [CrossRef]
  26. Foggo, B.; Yamashita, K.; Yu, N. pmuBAGE: The Benchmarking Assortment of Generated PMU Data for Power System Events. IEEE Trans. Power Syst. 2024, 39, 3485–3496. [Google Scholar] [CrossRef]
  27. Su, C.; Deng, J.; Li, X.Y.; Cheng, F.M.; Huang, W.H.; Wang, C.P.; He, W.B.; Wang, X.P. Research on the Game Strategy of Mutual Safety Risk Prevention and Control of Industrial Park Enterprises under Blockchain Technology. Systems 2024, 12, 351. [Google Scholar] [CrossRef]
  28. Li, H.; Dai, X.; Zhou, L.; Yang, W. Multi-criteria constrained interval type-2 fuzzy decision-making: A space analysis perspective. Inf. Sci. 2024, 669, 120581. [Google Scholar] [CrossRef]
  29. Kilic, B.; Gulgen, F.; Celen, M. Comparative Evaluation of Multi-Criteria Decision Making Methods for River Hydromorphology Assessment: Case Study of the Saz-Çayırova Basin, Türkiye. In River Research and Applications; Wiley: Hoboken, NJ, USA, 2024. [Google Scholar]
  30. Orazbayev, B.; Ospanov, Y.; Makhatova, V.; Salybek, L.; Abdugulova, Z.; Kulmagambetova, Z.; Suleimenova, S.; Orazbayeva, K. Methods of Fuzzy Multi-Criteria Decision Making for Controlling the Operating Modes of the Stabilization Column of the Primary Oil-Refining Unit. Mathematics 2023, 11, 2820. [Google Scholar] [CrossRef]
  31. Yacheur, B.Y.; Ahmed, T.; Mosbah, M. Efficient DRL-Based Selection Strategy in Hybrid Vehicular Networks. IEEE Trans. Netw. Serv. Manag. 2023, 20, 2400–2411. [Google Scholar] [CrossRef]
  32. Jiang, L.; Liu, H. Application of focus theory of choice in large scale multi-criteria group decision making. J. Intell. Fuzzy Syst. 2024, 46, 237–246. [Google Scholar] [CrossRef]
  33. Li, J.; Niu, L.-l.; Chen, Q.; Li, M. Optimization models of consensus measurement and improvement processes with hesitant fuzzy linguistic evaluation information. Appl. Intell. 2023, 53, 29414–29432. [Google Scholar] [CrossRef]
  34. Zhu, M.; Mao, J.; Xu, W. A Personalized Individual Semantic Extraction Model Based on Criterion for Adaptive Consensus Reaching Process Under Improved Basic Uncertain Linguistic Environment. Int. J. Inf. Technol. Decis. Mak. 2023, 1–36. [Google Scholar] [CrossRef]
  35. Rahim, M.; Eldin, E.M.T.; Khan, S.; Ghamry, N.A.; Alanzi, A.M.; Khalifa, H.A.E.-W. Multi-criteria group decision-making based on dombi aggregation operators under p, q-quasirung orthopair fuzzy sets. J. Intell. Fuzzy Syst. 2024, 46, 53–74. [Google Scholar] [CrossRef]
  36. Gölcük, I.; Durmaz, E.D.; Şahin, R. Interval type-2 fuzzy development of FUCOM and activity relationship charts along with MARCOS for facilities layout evaluation. Appl. Soft Comput. 2022, 128, 109414. [Google Scholar] [CrossRef]
  37. Ulpiani, G.; Vetters, N. On the risks associated with transitioning to climate neutrality in Europe: A city perspective. Renew. Sustain. Energy Rev. 2023, 183, 113448. [Google Scholar] [CrossRef]
  38. Musleh, A.S.; Ahmed, J.; Ahmed, N.; Xu, H.; Chen, G.; Kerr, S.; Jha, S. Experimental Cybersecurity Evaluation of Distributed Solar Inverters: Vulnerabilities and Impacts on the Australian Grid. IEEE Trans. Smart Grid 2024, 15, 5139–5150. [Google Scholar] [CrossRef]
  39. Minea, M.; Dumitrescu, C.M. Urban Traffic Noise Analysis Using UAV-Based Array of Microphones. Sensors 2023, 23, 1912. [Google Scholar] [CrossRef]
  40. Hyun, J.S.; Park, C.J.; Park, G.-L.; Lee, J. Correlation Analysis between the Renewable Energy Source Generation and the Utilization for Smart Grid in Korea. Trans. Korean Inst. Electr. Eng. 2017, 66, 347–353. [Google Scholar] [CrossRef]
  41. Wang, Y.; Dong, Y.; Sun, X. Can environmental regulations facilitate total-factor efficiencies in OECD countries? Energy-saving target VS emission-reduction target. Int. J. Green. Energy 2023, 20, 1488–1500. [Google Scholar] [CrossRef]
  42. Schirmer, P.A.; Mporas, I. On the non-intrusive extraction of residents’ privacy- and security-sensitive information from energy smart meters. Neural Comput. Appl. 2023, 35, 119–132. [Google Scholar] [CrossRef]
  43. Rekeraho, A.; Cotfas, D.T.; Cotfas, P.A.; Tuyishime, E.; Balan, T.C.; Acheampong, R. Enhancing Security for IoT-Based Smart Renewable Energy Remote Monitoring Systems. Electronics 2024, 13, 756. [Google Scholar] [CrossRef]
  44. Caiping, W.; Xiadan, D.; Jun, D.; Zujin, B.; Weile, C.; Yin, D.; Gaoyang, Q. Characteristics of antioxidant temperature-sensitive hydrogel inhibiting coal spontaneous combustion. Fuel 2025, 394, 135089. [Google Scholar] [CrossRef]
  45. Gong, A.; Qiao, Z.; Li, X.; Lyu, J.; Li, X. A review on methods and applications of artificial intelligence on Fault Detection and Diagnosis in nuclear power plants. Prog. Nucl. Energy 2024, 177, 105474. [Google Scholar] [CrossRef]
  46. Kamble, T.; Ghuge, M.; Jain, R.; Bodade, V.S. Secure data transmission in cloud computing using a cyber-security trust model with multi-risk protection scheme in smart IOT application. Clust. Comput. J. Netw. Softw. Tools Appl. 2025, 28, 1–22. [Google Scholar] [CrossRef]
  47. Zhu, X.; Chen, S.; Liang, X.; Jin, X.; Du, Z. Next-generation generalist energy artificial intelligence for navigating smart energy. Cell Rep. Phys. Sci. 2024, 5, 102192. [Google Scholar] [CrossRef]
  48. Xiong, J.; Shen, L.; Liu, Y.; Fang, X. Enhancing IoT security in smart grids with quantum-resistant hybrid encryption. Sci. Rep. 2025, 15, 3. [Google Scholar] [CrossRef]
  49. Ali, W.; Din, I.U.; Almogren, A.; Khan, M.Y.; Altameem, A. PowerTrust: AI-Based Trustworthiness Assessment in the Internet of Grid Things. IEEE Access 2024, 12, 161884–161896. [Google Scholar] [CrossRef]
  50. Zhou, Z.; Xie, J.; Li, X.; Zhang, B. Resilient energy management strategy in smart residential buildings considering price attack: An aggregative game perspective. Energy Build. 2024, 320, 114593. [Google Scholar] [CrossRef]
  51. Gu, Q.; Sun, W.; Li, X.; Jiang, S.; Tian, J. A new ensemble classification approach based on Rotation Forest and LightGBM. Neural Comput. Appl. 2023, 35, 11287–11308. [Google Scholar] [CrossRef]
  52. Lee, Y.G.; Park, K.; Kim, H.J.; Cho, S.-H. Creating portfolios of firm-specific energy R&D investment under market uncertainty. Energy Environ. 2023, 34, 1548–1563. [Google Scholar]
  53. Yang, T.; Liu, J.; Feng, W.; Chen, Z.; Zhao, Y.; Lou, S. A Three-Layer Scheduling Framework with Dynamic Peer-to-Peer Energy Trading for Multi-Regional Power Balance. Energies 2024, 17, 6239. [Google Scholar] [CrossRef]
  54. Alavi, S.A.; Javadipour, M.; Rahimian, A.; Mehran, K. A novel distributed privacy-preserving control and data collection method for IoT-centric microgrids. IET Gener. Transm. Distrib. 2023, 17, 2249–2259. [Google Scholar] [CrossRef]
  55. Khan, B.S.; Qamar, A.; Wadood, A.; Almuhanna, K.; Al-Shamma, A.A. Integrating economic load dispatch information into the blockchain smart contracts based on the fractional-order swarming optimizer. Front. Energy Res. 2024, 12, 1350076. [Google Scholar] [CrossRef]
  56. Zhou, Y.; Ge, Y.; Jia, L. Double Robust Federated Digital Twin Modeling in Smart Grid. IEEE Internet Things J. 2024, 11, 39913–39931. [Google Scholar] [CrossRef]
  57. Dias, R.R.; Depra, M.C.; Severo, I.A.; Zepka, L.Q.; Jacob-Lopes, E. Smart override of the energy matrix in commercial microalgae facilities: A transition path to a low-carbon bioeconomy. Sustain. Energy Technol. Assess. 2022, 52, 102073. [Google Scholar] [CrossRef]
  58. Zheng, X.; Ju, C.; Yang, G.; Chu, J. Multi-agent modeling for energy storage charging station scheduling strategies in the electricity market: A cooperative learning approach. J. Energy Storage 2025, 106, 114226. [Google Scholar] [CrossRef]
  59. Rahmani, A.M.; Gia, T.N.; Negash, B.; Anzanpour, A.; Azimi, I.; Jiang, M.; Liljeberg, P. Exploiting smart e-Health gateways at the edge of healthcare Internet-of-Things:A fog computing approach. Future Gener. Comput. Syst. Int. J. Escience 2018, 78, 641–658. [Google Scholar] [CrossRef]
  60. Unnisa, N.; Tatineni, M.; Fatima, K.; Pasha, M.M. Intelligent deep learning-aided future beam and proactive handoff prediction model in Unmanned Aerial Vehicle-assisted anti-jamming Terahertz communication system. Int. J. Commun. Syst. 2023, 36, e5504. [Google Scholar] [CrossRef]
  61. Grudz, V.; Grudz, Y.; Pavlenko, I.; Liaposhchenko, O.; Ochowiak, M.; Pidluskiy, V.; Portechyn, O.; Iakymiv, M.; Wlodarczak, S.; Krupinska, A.; et al. Ensuring the Reliability of Gas Supply Systems by Optimizing the Overhaul Planning. Energies 2023, 16, 986. [Google Scholar] [CrossRef]
  62. Wang, Z.; Zhou, Y.; Liu, H.; Qiu, J.; Fang, B.; Tian, Z. ThreatInsight: Innovating Early Threat Detection Through Threat-Intelligence-Driven Analysis and Attribution. IEEE Trans. Knowl. Data Eng. 2024, 36, 9388–9402. [Google Scholar] [CrossRef]
  63. Wang, P.-K.; Shih, S.-G.; Perng, Y.-H. Competitive Advantage Evaluation Model of Sustainable Housing Design. Sustainability 2020, 12, 6020. [Google Scholar] [CrossRef]
  64. Sarma, R.; Moulik, S. e-SAFE: A secure and efficient access control scheme with attribute convergence and user revocation in fog enhanced IoT for E-Health. J. Inf. Secur. Appl. 2024, 85, 103859. [Google Scholar] [CrossRef]
  65. Govindan, K.; Dua, R.; Mehbub Anwar, A.H.M.; Bansal, P. Enabling net-zero shipping: An expert review-based agenda for emerging techno-economic and policy research. Transp. Res. Part. E Logist. Transp. Rev. 2024, 192, 103753. [Google Scholar] [CrossRef]
  66. Hulme, P.E.; Beggs, J.R.; Binny, R.N.; Bray, J.P.; Cogger, N.; Dhami, M.K.; Finlay-Smits, S.C.; French, N.P.; Grant, A.; Hewitt, C.L.; et al. Emerging advances in biosecurity to underpin human, animal, plant, and ecosystem health. iScience 2023, 26, 107462. [Google Scholar] [CrossRef] [PubMed]
  67. Litvinenko, V. Advances in Raw Material Industries for Sustainable Development Goals. In Proceedings of the XII Russian-German Raw Materials Conference, Saint-Petersburg, Russia, 27–29 November 2019; Taylor & Francis: Oxfordshire, UK, 2021. [Google Scholar]
Figure 1. Technology Roadmap.
Sustainability 17 03417 g001
Figure 2. Geographical location map of Shaanxi Province.
Sustainability 17 03417 g002
Figure 3. Indicator Ranking Values.
Sustainability 17 03417 g003
Figure 4. Indicator Ranking Order. Note: The black dot at the center is the visual center point.
Sustainability 17 03417 g004
Figure 5. Comparison of Indicator Values Across Different Scenarios.
Sustainability 17 03417 g005
Figure 6. Ranking of Indicator Values Across Different Scenarios.
Sustainability 17 03417 g006
Figure 7. Indicator Ranking under Different Weight Parameters.
Sustainability 17 03417 g007
Figure 8. Indicator Sorting under Different Weight Parameters.
Sustainability 17 03417 g008
Table 2. Key Experimental Parameters.
ParameterValue/Description
Expert Weight Calculation Parameter ( ϑ ) ϑ = 0.6 (weight coefficient balancing expert experience and domain influence in Equation (1))
Parameters of IT2TrFN Membership FunctionsLinguistic terms mapped to interval type-2 trapezoidal fuzzy numbers (IT2TrFN) with bounds calibrated via expert consensus
Consistency Threshold ( C V ) C V 0.5 (re-calibration required if exceeded).
Sensitivity Analysis Range ( θ ) θ [ 0.0 , 0.5 ] (step size 0.1) to test weight coefficient variations.
IT2FWA and IT2FGA OperatorsIT2FWA: Weighted aggregated operator (Equation (8)); IT2FGA: Weighted geometric operator (Equation (16))
Risk Level ThresholdsHigh ( χ 0.60 ), Medium ( 0.30 χ < 0.60 ), Low ( χ < 0.30 )
Table 3. Language Scale I T 2 T r F N .
Linguistic Term m s ( x ) e i μ s ( x ) , n s ( x ) e i η s ( x ) , δ s ( x ) e i γ s ( x ) , λ s ( x ) e i σ s ( x )
Extremely High(EH) 0.15 e i 2 π ( 0.20 ) , 0.90 e i 2 π ( 0.95 ) , 0.10 e i 2 π ( 0.20 ) , 0.53 e i 2 π ( 0.39 )
Very High(VH) 0.35 e i 2 π ( 0.40 ) , 0.70 e i 2 π ( 0.75 ) , 0.30 e i 2 π ( 0.40 ) , 0.67 e i 2 π ( 0.53 )
High(H) 0.45 e i 2 π ( 0.50 ) , 0.60 e i 2 π ( 0.65 ) , 0.40 e i 2 π ( 0.50 ) , 0.65 e i 2 π ( 0.51 )
Medium(M) 0.55 e i 2 π ( 0.60 ) , 0.50 e i 2 π ( 0.55 ) , 0.50 e i 2 π ( 0.60 ) , 0.58 e i 2 π ( 0.39 )
Low(L) 0.65 e i 2 π ( 0.70 ) , 0.40 e i 2 π ( 0.45 ) , 0.40 e i 2 π ( 0.50 ) , 0.62 e i 2 π ( 0.48 )
Very low(VL) 0.75 e i 2 π ( 0.80 ) , 0.30 e i 2 π ( 0.35 ) , 0.30 e i 2 π ( 0.40 ) , 0.61 e i 2 π ( 0.39 )
Extremely low(EL) 0.95 e i 2 π ( 0.89 ) , 0.20 e i 2 π ( 0.35 ) , 0.10 e i 2 π ( 0.20 ) , 0.40 e i 2 π ( 0.38 )
Table 4. Scenario Descriptions.
ScenarioDescription
Scenario 1 ( T 1 )Different expert weights ( I T 2 F W A )
Scenario 2 ( T 2 )Equal expert weights ( I T 2 F W A )
Scenario 3 ( T 3 )Different expert weights ( I T 2 F G A )
Scenario 4 ( T 4 )Equal expert weights ( I T 2 F G A )
Disclaimer/Publisher’s Note: The statements, opinions and data contained in all publications are solely those of the individual author(s) and contributor(s) and not of MDPI and/or the editor(s). MDPI and/or the editor(s) disclaim responsibility for any injury to people or property resulting from any ideas, methods, instructions or products referred to in the content.