1. Introduction
Over the past century, seed production and supply methods have undergone profound transformations, driven by increasing public and private investments, as well as the establishment of commercial breeding property rights. The industry has evolved globally from traditionally relying on seeds saved from the previous season’s harvest to depending on externally sourced, commercialized varieties, resulting in significant structural reshaping [
1]. As a key input in agriculture, seed research, development, and dissemination directly influence food security and sustainable development. With the growing urgency of climate change adaptation and low-carbon economic transitions, improving efficiency in the seed sector is essential in ensuring both productivity and environmental sustainability [
2].
Commercial seed enterprises—led by a few dominant companies—have risen rapidly since the late 20th century, facilitating technological upgrades and reshaping the agricultural value chain [
3]. However, this growth has been accompanied by intensified global consolidation. From the 1990s to 2015, multinational mergers and acquisitions (M&As) among firms like Monsanto, Syngenta, Bayer, and DuPont dramatically increased industry concentration [
4]. Early research on this period, including Bonny (2014), Lianos et al. (2016), and Deconinck (2019), focused on structural issues such as biodiversity loss, intellectual property control, and price power [
5,
6,
7]. Although these studies offered valuable insights, they relied primarily on qualitative methods and lacked detailed firm-level performance analysis.
In response to this gap, scholars have increasingly adopted quantitative techniques to evaluate operational efficiency. Methods such as Data Envelopment Analysis (DEA) and the Malmquist Productivity Index (MPI) are widely recognized for their ability to capture both static technical efficiency and dynamic productivity change across sectors—ranging from energy systems and transportation to regional innovation and agricultural productivity [
8,
9,
10,
11]. Within the seed sector, Smart et al. (2022) applied DEA to global seed firms, highlighting significant cross-sectional differences but not fully addressing dynamic changes following M&As [
12].
Since 2016, the global seed industry has entered a new phase of transformation characterized by “mega-mergers”, such as Bayer–Monsanto, ChemChina–Syngenta, and Dow–DuPont [
13]. Unlike earlier M&A waves that emphasized scale expansion, this third wave involves strategic integration across biotechnology, agrochemicals, and digital platforms. Although these consolidations have opened up new opportunities for resource reallocation and innovation, they have also intensified debates around the balance between economies of scale and operational complexity [
14,
15,
16]. A larger firm size may enhance efficiency via economies of scale and scope [
17], but excessive concentration may lead to resource misallocation and managerial diseconomies [
18].
While some prior works, such as Smart et al. (2022) [
12], explored the scale-efficiency relationship before 2015, empirical studies that capture the firm-level impact of the third M&A wave—particularly its interaction with technological innovation—remain scarce. As OECD (2018) and Spielman and Kennedy (2016) suggest, more granular, firm-level analyses are needed to assess how innovation, market structure, and efficiency evolve under consolidation pressure [
19,
20]. Moreover, despite growing calls to align seed industry performance with sustainability goals, the connection between technological innovations and firm efficiency is rarely examined.
To address these research gaps and discontinuities, in this study, we conducted a panel-based DEA–MPI efficiency analysis of the world’s top ten seed companies from 2016 to 2022. This study provides a multi-dimensional decomposition of firm performance, capturing technical efficiency, scale efficiency, and innovation-driven productivity. In this study, we proposed three hypotheses based on observed gaps in the literature:
H1. Firms that experienced large-scale mergers after 2016 are more likely to face declining scale efficiency in the short term due to integration frictions and operational diseconomies.
H2. Firms with higher levels of technological innovation (as reflected by TECHCH) tend to exhibit stronger improvements in overall efficiency, but only when such innovation is effectively absorbed and aligned with resource reallocation.
H3. Firms that coordinate scale expansion with technological progress are more likely to achieve sustainable efficiency gains, compared to those pursuing these strategies in isolation.
The uniqueness of this study is reflected in several key aspects that advance the existing literature on efficiency evaluation in the seed industry. First, in terms of the time scope, this study focused on the period from 2016 to 2022, capturing the critical phase after the wave of global mega-mergers in the seed industry—such as Bayer–Monsanto and Dow–DuPont—whereas most prior research centered on structural changes before 2015. This enabled the study to explore how post-merger consolidation has affected efficiency outcomes in a period of rising external uncertainty. Second, from a methodological perspective, this paper integrated DEA model into the Malmquist Productivity Index to jointly assess both the static (cross-sectional) and dynamic (temporal) dimensions of firm performance. This dual approach addressed a notable gap in the previous literature, which often lacked tools for evaluating long-term efficiency trajectories after major structural changes. Third, this study provides a comprehensive decomposition of technical efficiency—into OTE, PTE, and SE—and links these indicators to technological change (TECHCH) and efficiency change (EFFCH). By doing so, it assesses whether innovation can offset the potential inefficiencies caused by large-scale expansion, offering new insights into the interplay between scale and innovation. Finally, rather than focusing solely on measurement, this study’s contribution extends to the strategic and policy level by discussing how firms can achieve optimal resource allocation during industry restructuring. It offers differentiated recommendations for industrial upgrading across development stages, contributing to the broader discourse on sustainable transformation in capital-intensive sectors.
The remainder of this paper is structured as follows:
Section 2 introduces the methodologies employed and describes the data set.
Section 3 presents and discusses the empirical results.
Section 4 comprises our discussion. Finally,
Section 5 summarizes our conclusions and policy recommendations.
2. Methodology and Models
In this study, we aimed to systematically analyze the efficiency performance of the world’s top ten seed-producing companies from 2016 to 2022, examining their resource allocation and technical efficiency amid changing scales. To achieve this, the study employed both Data Envelopment Analysis (DEA) and the Malmquist Productivity Index (MPI), enabling an in-depth investigation—both statically and dynamically—into whether these companies were operating at their optimal scale and how scale expansion or contraction affects efficiency over time.
2.1. Data Envelopment Analysis (DEA) Model
Efficiency measurement fundamentally assesses the ability of a decision-making unit (DMU) to maximize outputs given certain inputs or minimize inputs given specific outputs. Leading efficiency measurement methodologies include Data Envelopment Analysis (DEA) [
21] and Stochastic Frontier Analysis (SFA) [
22,
23]. Unlike SFA’s requirement of a specific functional form and typically single-output setups, DEA’s nonparametric approach offers greater flexibility for handling multiple and diverse outputs. This study employed an input-orientated DEA model to evaluate firms’ relative efficiency through a nonparametric, linear programming-based technique. DEA has found wide application across various domains, such as regional technological innovation [
24,
25], telecommunications [
26], airport operations [
9], agriculture [
11], urban public transportation [
27], and energy efficiency [
8].
The CCR (Charnes–Cooper–Rhodes) model proposed by Charnes et al. (1978) [
21] is widely recognized as a classic framework for efficiency analysis [
28]. The CCR model assumes constant returns to scale (CRS), implying that proportional changes in inputs result in identical proportional changes in outputs. This assumption is appropriate when firms are operating at their optimal scale without external constraints. Under CRS, the efficiency score obtained represents the overall technical efficiency (OTE), which captures inefficiencies arising from both managerial performance and scale effects [
29].
In contrast, Banker et al. (1984) introduced the BCC (Banker–Charnes–Cooper) model [
30], allowing for variable returns to scale (VRS), where firms may exhibit increasing returns to scale (IRS), decreasing returns to scale (DRS), or constant returns to scale (CRS). Efficiency scores under the VRS assumption reflect the pure technical efficiency (PTE), which isolates managerial efficiency from scale-related inefficiencies.
The implications of these assumptions on efficiency interpretation are significant. Under CRS, firms are benchmarked against a single global production frontier, meaning that any inefficiency observed may result from either managerial weaknesses or suboptimal scale. In contrast, under VRS, inefficiencies are attributed solely to managerial performance, as the model accounts for differences in operational scale. The comparison between CRS-based and VRS-based efficiency scores provides insights into whether an observed inefficiency is due to poor managerial practices or inappropriate scale size. This decomposition not only clarifies the sources of inefficiency but also provides a diagnostic framework for firms to adjust their operational scale or improve internal management practices accordingly.
In this study, the input-orientated DEA method is used to calculate the overall technical efficiency (OTE), pure technical efficiency (PTE), and scale efficiency (SE) in conjunction with the CCR model and the BCC model, respectively, in order to differentiate between managerial capabilities and scale factors in firm efficiency. In addition, scale efficiency is calculated by SE = OTE/PTE and combined with the types of scale rewards (IRS, CRS, and DRS) to analyze whether the firm is at the optimal scale and the impact of expansion or contraction on efficiency. Based on the results of DEA calculations, this study systematically assesses the resource allocation efficiency of the top ten global seed companies during 2016–2022 and reveals the impact of industry consolidation on the operating efficiency of enterprises.
2.2. Selection of Input and Output Variables and Theoretical Basis
Selecting appropriate input and output indicators is essential in ensuring the accuracy and interpretability of efficiency measurement results. Given the seed industry’s technology-intensive characteristics, this study incorporates capital investment, R&D expenditure, and labor input as key input variables and seed sales revenue as the primary output indicator.
Capital investment reflects the structural features of long-term resource investment and fundamental production capacities [
31]. In high-technology industries, capital determines a firm’s capability to introduce advanced equipment, improve infrastructure, and achieve economies of scale to enhance efficiency.
R&D investment is vital due to the seed industry’s heavy reliance on technological innovation and varietal improvements [
32]. Including R&D as an input provides a direct measure of a firm’s technological accumulation and diffusion capacity, thus offering empirical insights into how technological efficiency evolves with scale expansion.
Labor input is uniquely significant in the seed sector. Beyond production workers, highly skilled R&D and managerial staff profoundly influence innovation capacity, resource allocation efficiency, and process optimization [
33]. Hence, human resource allocation is pivotal in assessing efficiency and competitive advantages.
Using seed sales revenue as the output indicator directly reflects a firm’s market position, its operational performance, and the ultimate effectiveness of resource allocation and technology implementation. Matching input factors with final sales outputs allows for a comprehensive evaluation of efficiency, offering robust empirical support to determine a firm’s optimal scale.
From DEA calculations, critical quantitative indicators of corporate efficiency performance can be obtained. The input-orientated DEA model focuses on minimizing inputs for a given level of output, thereby capturing a DMU’s OTE. Compared to approaches that measure only the pure technical efficiency, OTE incorporates scale effects to more comprehensively reflect a firm’s overall technical capabilities.
Overall technical efficiency (OTE) considers both technological and scale factors affecting efficiency. It tests whether a DMU can minimize inputs under given output conditions by appropriately allocating resources and managing scale. Thus, the input-orientated DEA model optimizes by eliminating redundant inputs at a fixed output, providing solid evidence to gauge whether a firm maintains efficient resource operations in a complex market environment.
Input-Orientated DEA Model Derivation
For each decision-making unit DMU0, we assume that it has m input variables and s output variables, specifically represented as follows:
Xi0 represents the i-th input (i = 1, 2, …, m), and Xi0 represents the i-th input of DMU0.
Yr0 represents the r-th output (r = 1, 2, …, s), and Yr0 represents the r-th output of DMU0.
The DEA model formulates an optimization problem through linear programming to minimize inputs while maintaining the output level constant. Its linear programming objective can be expressed as follows:
Minimize θ
In the above model, θ is the efficiency parameter to be optimized, with a range between 0 and 1. If θ = 1 and all constraints are rigorously met, then the DMU has achieved the effective frontier in terms of both technical and scale efficiency at the specified output level, implying that efficiency cannot be increased by further reducing inputs. When building the reference set for the current DMU, the parameter λj, which functions as a linear combination coefficient, is utilized to ascertain the relative weights of other DMUs. Constraint (1) ensures that, while maintaining constant output, the input of DMU0 can be reduced to no more than θxi0.
Constraint (2) requires that output is maintained at least at the level of yr0, ensuring that output is not adversely affected by input reduction.
Constraint (3) stipulates that λj is non-negative, ensuring that the reference set includes only feasible positive combinations.
By solving the above linear programming problem, the obtained θ value represents the overall technical efficiency (OTE). This measure offers a quantitative foundation for further investigation into the manner in which variations in company size impact the dynamic development of efficiency and for determining optimization routes. Pure technical efficiency (PTE) is a measure of a firm’s technical utilization level after excluding the influence of scale factors. Under the condition of disregarding the influence of returns to scale, PTE evaluates the maximum technical efficiency that a DMU can achieve given a specific input–output combination. Therefore, PTE characterizes the pure technical performance of a firm under existing technological conditions and resource endowments, providing an important reference for identifying and addressing technical weaknesses.
To calculate PTE, this study employs the Variable Returns to Scale (VRS) DEA model.
This model maintains the same basic framework as the previously discussed DEA models (e.g., the CCR model), but adds constraints to account for the characteristics of returns to scale.
By introducing this additional constraint, the influence of scale factors can be excluded from the measurement of technical efficiency when evaluating the efficiency of decision-making units. This implies that regardless of a firm’s position in the scale hierarchy within the industry, its technical efficiency evaluation is unaffected by scale effects, ensuring the relative fairness of the PTE metric.
Once the PTE is obtained, scale efficiency (SE) can be calculated using the relationship between overall technical efficiency (OTE) and PTE:
When SE = 1, the firm has achieved an optimal scale, and no further adjustments to its scale structure are necessary. Conversely, if SE < 1, this indicates that the firm has not yet reached an optimal scale, and there may be issues related to increasing or decreasing returns to scale. A quantitative analysis of SE can provide a solid foundation for strategic decision-making and resource allocation adjustments.
2.3. Malmquist Productivity Index (MPI)
To expand the analytical perspective and capture the dynamic evolution of firm efficiency, this study adopted the Malmquist Productivity Index (MPI). Unlike the DEA model, which focuses on static efficiency measurement, MPI is based on time-series data and can simultaneously evaluate dynamic changes in efficiency and technological progress. This provides a richer analytical dimension for understanding firms’ adaptability and performance improvement pathways over different periods [
34]. The value of MPI lies in its ability to decompose efficiency changes into two components: efficiency change (EFFCH) and technical change (TECHCH) [
35].
The MPI methodology is based on distance functions, which measure the efficiency of a firm relative to a moving production frontier. Unlike DEA, which provides a static efficiency assessment, MPI evaluates efficiency changes over time, making it particularly useful in analyzing longitudinal productivity trends.
The EFFCH component of MPI reflects changes in a firm’s ability to allocate resources efficiently, capturing improvements or deteriorations in managerial effectiveness. A value greater than one indicates improved resource utilization, while a value less than one suggests managerial inefficiencies.
The TECHCH component measures shifts in the industry’s technological frontier, indicating whether innovation and advancements in production technology enhance overall efficiency. An increase in TECHCH suggests technological progress, whereas a decline indicates a lag in innovation adoption or industry stagnation.
EFFCH primarily reflects efficiency improvements or declines achieved through internal management optimization and resource allocation improvements.
TECHCH, on the other hand, describes shifts in the industry’s technological frontier, typically driven by R&D investment, innovation practices, and technology diffusion.
This decomposition analysis helps identify the respective contributions of internal management improvements and changes in the external technological environment to efficiency changes and assesses whether firms effectively transform technological innovation into actual production efficiency [
36].
By dynamically examining the evolution of efficiency, MPI provides robust evidence for understanding the long-term impacts of scale expansion or contraction on firm efficiency, as well as firms’ adaptability and adjustment capabilities in rapidly changing industrial contexts [
37].
The specific formula derivation is as follows:
MPI is expressed by the following formula, based on observations at time
t and
t + 1:
where
I denotes the orientation of the MPI model.
is the efficiency distance function at time
t, describing the efficiency level of a production unit relative to the technological frontier.
The geometric mean of the two MPIs in Equations (6) and (7) yields Equation (8).
The Malmquist Index decomposes efficiency changes into two components:
Efficiency change (EC) measures whether a firm is using its inputs more effectively over different periods.
Technical change (TC) measures the shift in the industry’s production frontier, reflecting the degree of technological progress within firms.
When M > 1, this indicates an improvement in the firm’s overall efficiency during the period, which may result from internal management optimization (increased EC), the expansion of the external technological frontier (increased TC), or a combination of both. When M < 1, it signifies a decline in the firm’s overall performance, necessitating a review of internal resource allocation strategies or the level of technology adoption and application.
The interpretation of MPI results is also influenced by the scale assumptions applied: under CRS, TECHCH primarily reflects pure technological advancements, as it assumes that firms operate at an optimal scale; under VRS, TECHCH also captures scale-dependent innovation effects, meaning that firms at different operational scales may derive varying benefits from technological improvements.
Given the heterogeneity in firm size and strategic orientation within the global seed industry, incorporating both CRS and VRS perspectives ensures a more nuanced and realistic assessment of productivity dynamics. The combined analysis of DEA and MPI provides a comprehensive understanding of efficiency drivers. For instance, if a firm exhibits high EFFCH but low TECHCH, this suggests that managerial improvements drive efficiency gains rather than technological advancements. Conversely, firms with high TECHCH but low EFFCH may struggle to translate innovation into efficiency gains due to a suboptimal scale or resource misallocation.
By utilizing the dynamic measurement results of MPI along with the scale efficiency (SE) indicators obtained from DEA, this study was able to explore the efficiency change trajectory and technological progress pathways during the process of scale expansion or contraction at a time-series level. By combining the dynamic efficiency evolution patterns from 2016 to 2022 with SE, a deeper analysis could be conducted on firms’ optimal resource utilization at different scale stages and performance improvements driven by innovation.
2.4. Applicability of DEA and MPI to Post-Merger Efficiency Analysis
The combined use of DEA and MPI enabled this study to comprehensively assess the evolution of firm-level efficiency within the context of large-scale mergers and acquisitions (M&As), which are common in the seed industry’s recent transformation.
Specifically, DEA allows for the decomposition of efficiency into pure technical efficiency (PTE) and scale efficiency (SE). Post-merger firms may operate under non-optimal scale conditions, and declining SE values can indicate diseconomies of scale or resource mismatches due to poorly integrated asset bases. For example, a firm expanding through acquisition may increase total assets without proportionate output growth, thus revealing scale-related inefficiencies. On the other hand, the Malmquist Productivity Index (MPI) is particularly effective in tracking year-over-year performance changes. Through its two components—efficiency change (EFFCH) and technical change (TECHCH)—MPI can isolate the sources of performance improvement or decline. High EFFCH values after a merger suggest successful post-merger integration and managerial coordination, whereas low or negative values indicate internal inefficiencies or restructuring delays.
The dynamic nature of MPI, when applied over a longitudinal panel (2016–2022), allows for the precise tracing of merger outcomes. For instance, if TECHCH improves but EFFCH declines, this reflects that while the firm is innovating, it fails to translate these advancements into efficiency—possibly due to post-merger organizational frictions or operational misalignment.
Together, DEA and MPI offer a powerful empirical lens through which the structural and temporal efficiency impacts of M&As can be evaluated. This approach is especially relevant to the seed industry, where mergers often involve cross-border complexity, heterogeneous R&D portfolios, and varied operational scales. By integrating these tools, this study not only measured performance outcomes but also provided insight into the mechanisms driving post-merger efficiency trajectories.
2.5. Data Sources and Sample Selection
For this study, we selected the top ten global seed-producing companies based on their substantial market share and influence. By 2020, the top ten firms accounted for a CR10 of 60%, underscoring their critical positions in the supply chain. As industry leaders, their decisions, resource allocation strategies, and changes in technological efficiency have significant spillover effects on industry-wide production structures and efficiency.
Analyzing these ten highly concentrated, resource-rich firms helped capture scale effects and technological evolution characteristics at the industry frontier. It also enhanced the generalizability of the study’s findings, offering strategic references to other firms and policymakers.
The chosen time frame of 2016–2022 coincides with the profound restructuring and turbulent rebalancing of the global seed industry. Starting in 2016, the third wave of M&As reshaped the sector’s competitive landscape and innovation ecosystem. For example, Bayer’s acquisition of Monsanto and the DuPont–Dow Chemical merger substantially increased market concentration and influenced both technology diffusion and efficiency improvements. Selecting this key turning point provided a time-series perspective to examine efficiency and technological dynamics post-merger and offered empirical evidence to understand sustainable competition and innovation models under high market concentration.
There are two main sources of data:
Intra-firm data: For this study, we collected official documents such as annual reports, financial statements, and investor relations announcements for the top 10 global seed companies, to obtain detailed firm-level input–output information. These data sources included public disclosures from Bayer, Corteva, Syngenta, BASF, Limagrain, KWS, DLF, Rijk Zwaan, Sakata Seeds, and Lupin High-Tech (LPHT).
Authoritative industry reports: This study also draws on data from International Seed Federation (ISF), Food and Agriculture Organization (FAO), Organisation for Economic Co-operation and Development (OECD), International Service for the Acquisition of Agri-biotech Applications (ISAAA), and other international organizations.
In addition, industry analysis data from market research organizations such as Mordor Intelligence, Research and Markets, and Phillips McDougall are also used to supplement the information related to market performance and policy environment. These reports are subject to rigorous statistical methods and review processes to ensure the integrity and reliability of the data.
2.6. Methodological Innovations and Model Limitations
This study integrated DEA model into the Malmquist Productivity Index to examine the efficiency–scale relationship from both static and dynamic perspectives. Such methodological integration facilitates a deeper understanding of how resource allocation efficiency and technological progress evolve as firms expand or contract, offering empirical insights for industry policymakers and corporate strategists.
However, the approach also has limitations. DEA assumes linearity and may not fully account for random disturbances such as market volatility, policy changes, or natural disasters [
38]. MPI relies on the construction of a technological frontier; rapid technological disruptions or drastic structural changes may cause MPI to underestimate actual technological progress or fail to capture true efficiency dynamic. Additionally, the study does not explicitly include external environmental factors like policy shifts, market dynamics, or environmental shocks, potentially limiting the interpretation of efficiency drivers.
3. Results Analysis
3.1. Overall Technical Efficiency (OTE)
Under the assumption of constant returns to scale (CRS), this section systematically examines the overall technical efficiency (OTE) of the world’s top ten seed-producing enterprises from 2016 to 2022. Unlike pure technical efficiency (PTE), which removes scale effects, OTE focuses on the comprehensive capacity to achieve maximum output under given inputs [
39]. In addition to reflecting how effectively a company’s internal resource allocation matches its production level, it is also impacted by several variables, including scale structure, the state of the market, and policy changes. By using DEA methods to measure annual OTE and comparing across time and firms, it becomes possible to more intuitively reveal the industry’s resource optimization flexibility and internal adaptability under external environmental shocks.
The industry’s total OTE showed a cyclical pattern over the research period, first dropping and then rising again but never entirely recovering (
Figure 1). The average OTE of all companies dropped from 0.7069 in 2016 to 0.5585 in 2019, and although it rebounded to approximately 0.5982 in 2022, it remained below the initial level. Increased pressures from the global economic crisis, growing tensions in international trade, supply chain disruptions, and rising costs were some of the external shocks that led to the apparent “turning point” in the industry’s efficiency around 2019 [
1]. These macro-level changes constrained firms’ ability to effectively match and promptly adjust their production factors, significantly hindering resource utilization efficiency. After 2020, as some enterprises accelerated internal integration, optimized supply chains, and gradually adapted to the new market landscape, the industry’s OTE showed a certain degree of restorative rebound. Nonetheless, the industry’s average OTE by 2022 had not reached its peak from 2016, which suggests that the global seed industry’s ability to optimize its resources remains structurally vulnerable in the face of growing external uncertainties.
There are noticeable variations in both OTE performance and evolutionary paths at the business level. Throughout the study period, DLF consistently remained at or near the efficiency frontier. In
Table 1, 2016, 2020, and 2022, DLF achieved OTE = 1.0, demonstrating its capacity to maintain optimal resource allocation in a volatile environment. Such “robust” companies often focus on their core crops and specific regional markets, achieving the precise matching of input and output through long-term brand accumulation and deep vertical integration [
40].
In contrast, other firms’ OTE trajectories reflect the complex interplay among merger integration, global expansion, market competition, and internal governance. Bayer’s OTE fell sharply from 0.7193 in 2016 to 0.3616 in 2022, indicating substantial challenges in resource reorganization and internal coordination following its acquisition of Monsanto; in contrast, Corteva exhibited countercyclical growth, with its OTE rising from 0.5696 in 2018 to 0.9131 in 2022. This example illustrates that by streamlining redundant assets, optimizing internal R&D investment, and using digital agricultural tools for the precise control of production and supply chains, businesses may increase the effectiveness of resource allocation in a comparatively short amount of time [
2].
In contrast to the previously stated businesses, Syngenta and BASF displayed consistently low OTE levels, indicating structural deficiencies in their internal resource allocation. Sakata’s average OTE is higher than 0.85, possibly due to its deep focus on a single niche market (e.g., vegetable seeds), which enabled it to maintain a high efficiency level close to 1.0000 between 2016 and 2019. However, its OTE began to decline after 2020 due to the COVID-19 pandemic, which may be related to supply chain disruptions, international market volatility, and limited agricultural production. Throughout the monitoring period, Syngenta’s OTE varied between 0.24 and 0.35; this poor efficiency might be caused by both a lack of internal coordination and excessively fragmented market layouts in developing countries. Although Longping High-Tech (LPHT) has been continuously advancing in the Asian market and focusing on staple crops, its OTE in 2022 was still only 0.72, indicating room for improvement in terms of cross-border competition and international adaptation.
Overall, OTE’s evolution from 2016 to 2022 indicates that enterprises’ ability to optimize resources and boost production cannot be improved overnight in the face of significant external changes. High-performing enterprises often possess a clear strategic orientation, stable supply chain systems, and deep cultivation capabilities targeting specific market niches; in contrast, low-performing firms reflect deficiencies in internal governance, international expansion strategies, and innovative arrangements. Although OTE is a comprehensive indicator for evaluating a firm’s output maximization relative to its inputs, it inherently encompasses both managerial efficiency and scale efficiency. By isolating pure technical efficiency (PTE), it is possible to analyze managerial efficiency without the interference of scale effects. This decomposition provides a clearer perspective for understanding resource optimization under diverse managerial conditions.
3.2. Pure Technical Efficiency (PTE)
The BCC model’s assumption of variable returns to scale (VRS) is used to estimate the pure technical efficiency (PTE), which assesses how well management techniques and resource allocation work at a specific production scale. By conducting a dynamic analysis of PTE for the world’s top ten seed companies from 2016 to 2022, we can gain deeper insights into the logic behind efficiency changes during R&D investment, organizational integration, market expansion, and digital transformation, thus providing an empirical basis for subsequent scale efficiency (SE) research. In
Figure 2, the study shows that Bayer’s PTE dropped from 0.9158 in 2016 to 0.5343 in 2022, and this significant decline not only reflects a failure to continuously transform its early accumulated technological advantages in genetically engineered seeds into long-term managerial efficiency but also indicates that when confronted with stricter global regulations and more diverse consumer demands [
1], the firm experienced substantial resistance in resource allocation and internal/external coordination. Organizational complexity and cultural integration issues following a merger, as well as obstacles integrating innovation results seamlessly into supply chains and production, increased internal coordination costs and led to a sustained drop in efficiency levels [
41].
In contrast, DLF reached or approached PTE = 1.0 in multiple years (e.g., 2016, 2020, and 2022), showing highly stable managerial efficiency. This excellence stems from its strategic focus on specialized segments, like forage and turf seeds, and building brand trust and localized networks [
42]. By substantially integrating vertically in specialized areas and decreasing regional transaction costs, DLF maximizes resource utilization and avoids common mismatches seen in diversification and rapid expansion.
Corteva improved from a PTE of 0.9323 in 2016 to 1.0 in 2022, leveraging mergers and digital agricultural practices. After the Dow–DuPont merger, Corteva integrated R&D and market resources, reduced redundancies, and adopted digital agriculture to enhance precise input–output control [
43]. This reduced information asymmetry and trial-and-error costs, enabling rapid responses to market changes and policies, thus ensuring sustained efficiency gains.
KWS has maintained a PTE of about 0.9812 since 2016, thanks to a focus on stable-demand crops (e.g., corn and sugar beets) and a diversified regional presence. This balanced configuration disperses risk and ensures orderly, efficient resource use. Syngenta’s PTE improved from 0.3770 in 2016 to 0.6122 in 2022 but remained volatile, reflecting internal coordination challenges during mergers and global expansion [
6]. Similarly, LPHT’s PTE fell from 1.0 in 2016 to 0.780 in 2022 despite expanding globally and increasing R&D, highlighting difficulties in improving global competitiveness and resource optimization [
44].
Overall, PTE analysis depicts strategy differences and managerial performance among seed companies as they confront globalization, technological iteration, and institutional changes. Bayer and Syngenta struggle with integration challenges, causing efficiency volatility, while DLF, Corteva, and KWS remain at the frontier through specialization, effective resource integration, and digital support. LPHT’s case shows that internationalization and R&D enhancements must be supported by integrated resource management and optimized processes.
These PTE insights provide a reference for subsequent SE analysis. Comparing PTE and SE can further clarify how scale expansion, organizational optimization, and managerial practices interact on a deeper level.
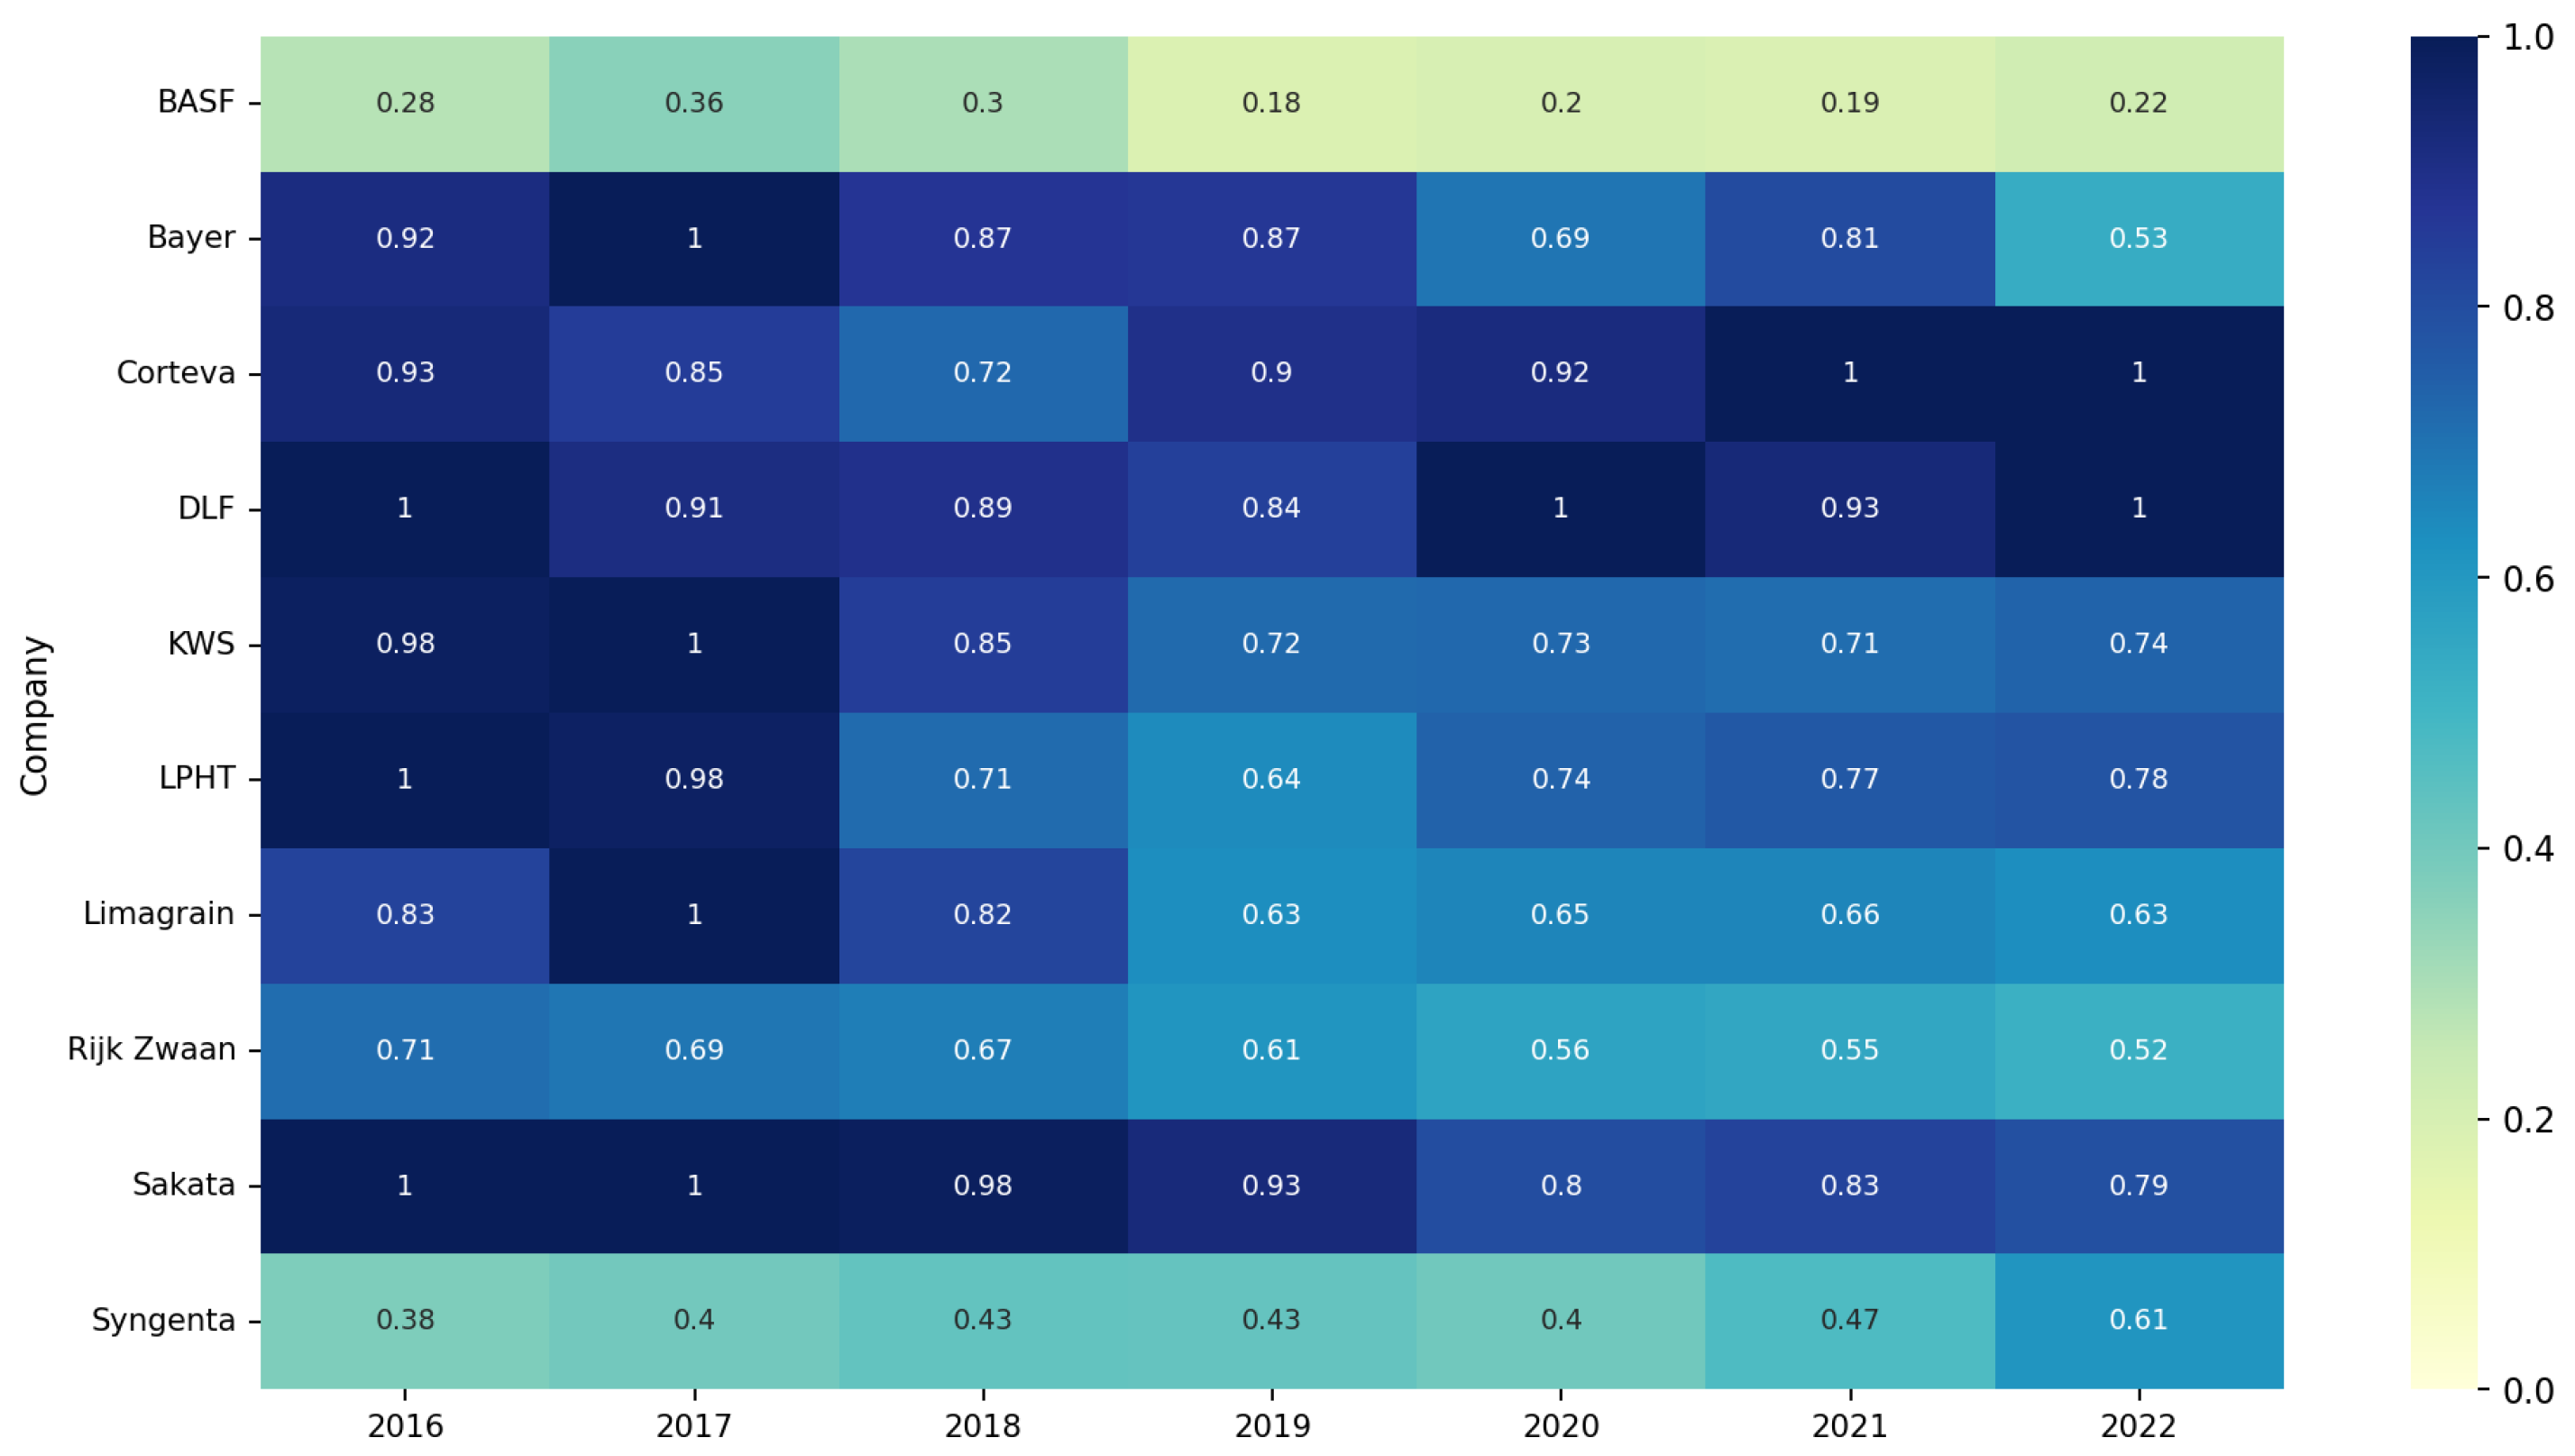
3.3. Scale Efficiency (SE)
SE reflects how well a firm aligns inputs and outputs at its current scale. Optimal alignment reduces costs and increases output, while deviation hinders resource utilization and overall performance. Since 2016, the global seed industry’s restructuring and resource reallocation have created a unique opportunity to observe SE changes [
19].
The results show that the scale efficiency (SE) of the top 10 seed companies shows a ‘W’-shaped fluctuation trend between 2016 and 2022 rather than a single ‘U’ shape (
Figure 3). Specifically, SE experienced a continuous decline from 2016 to 2019, reaching its lowest point in 2019, indicating that the scale and resource allocation of enterprises failed to optimally match at this stage. However, the SE rebounded sharply in 2020, which may be affected by enterprises adjusting their production layout, fluctuations in market demand, or changes in the external environment. Subsequently, the SE declined again in 2021, reflecting market uncertainty or adjustments in short-term management strategies, but picked up again in 2022, suggesting that enterprises gradually optimized their production scale and resource allocation after experiencing fluctuations, allowing them to recover their efficiency. Overall, this ‘W’-shaped trend suggests that the scale efficiency of enterprises is subject to multiple influences from market dynamics, the ability to integrate resources, and changes in the external environment and that the adjustment process is not unidirectional but rather undergoes multiple rounds of fluctuation and adaptation.
Over time, as firms integrated new segments and resources, lean management, digital agriculture, and targeted R&D investments helped them to find a balance between scale and efficiency after 2020, gradually restoring SE. Firms shifted from relying solely on scale expansion to focusing on streamlined structures, optimized supply chains, and precise input–output control [
45].
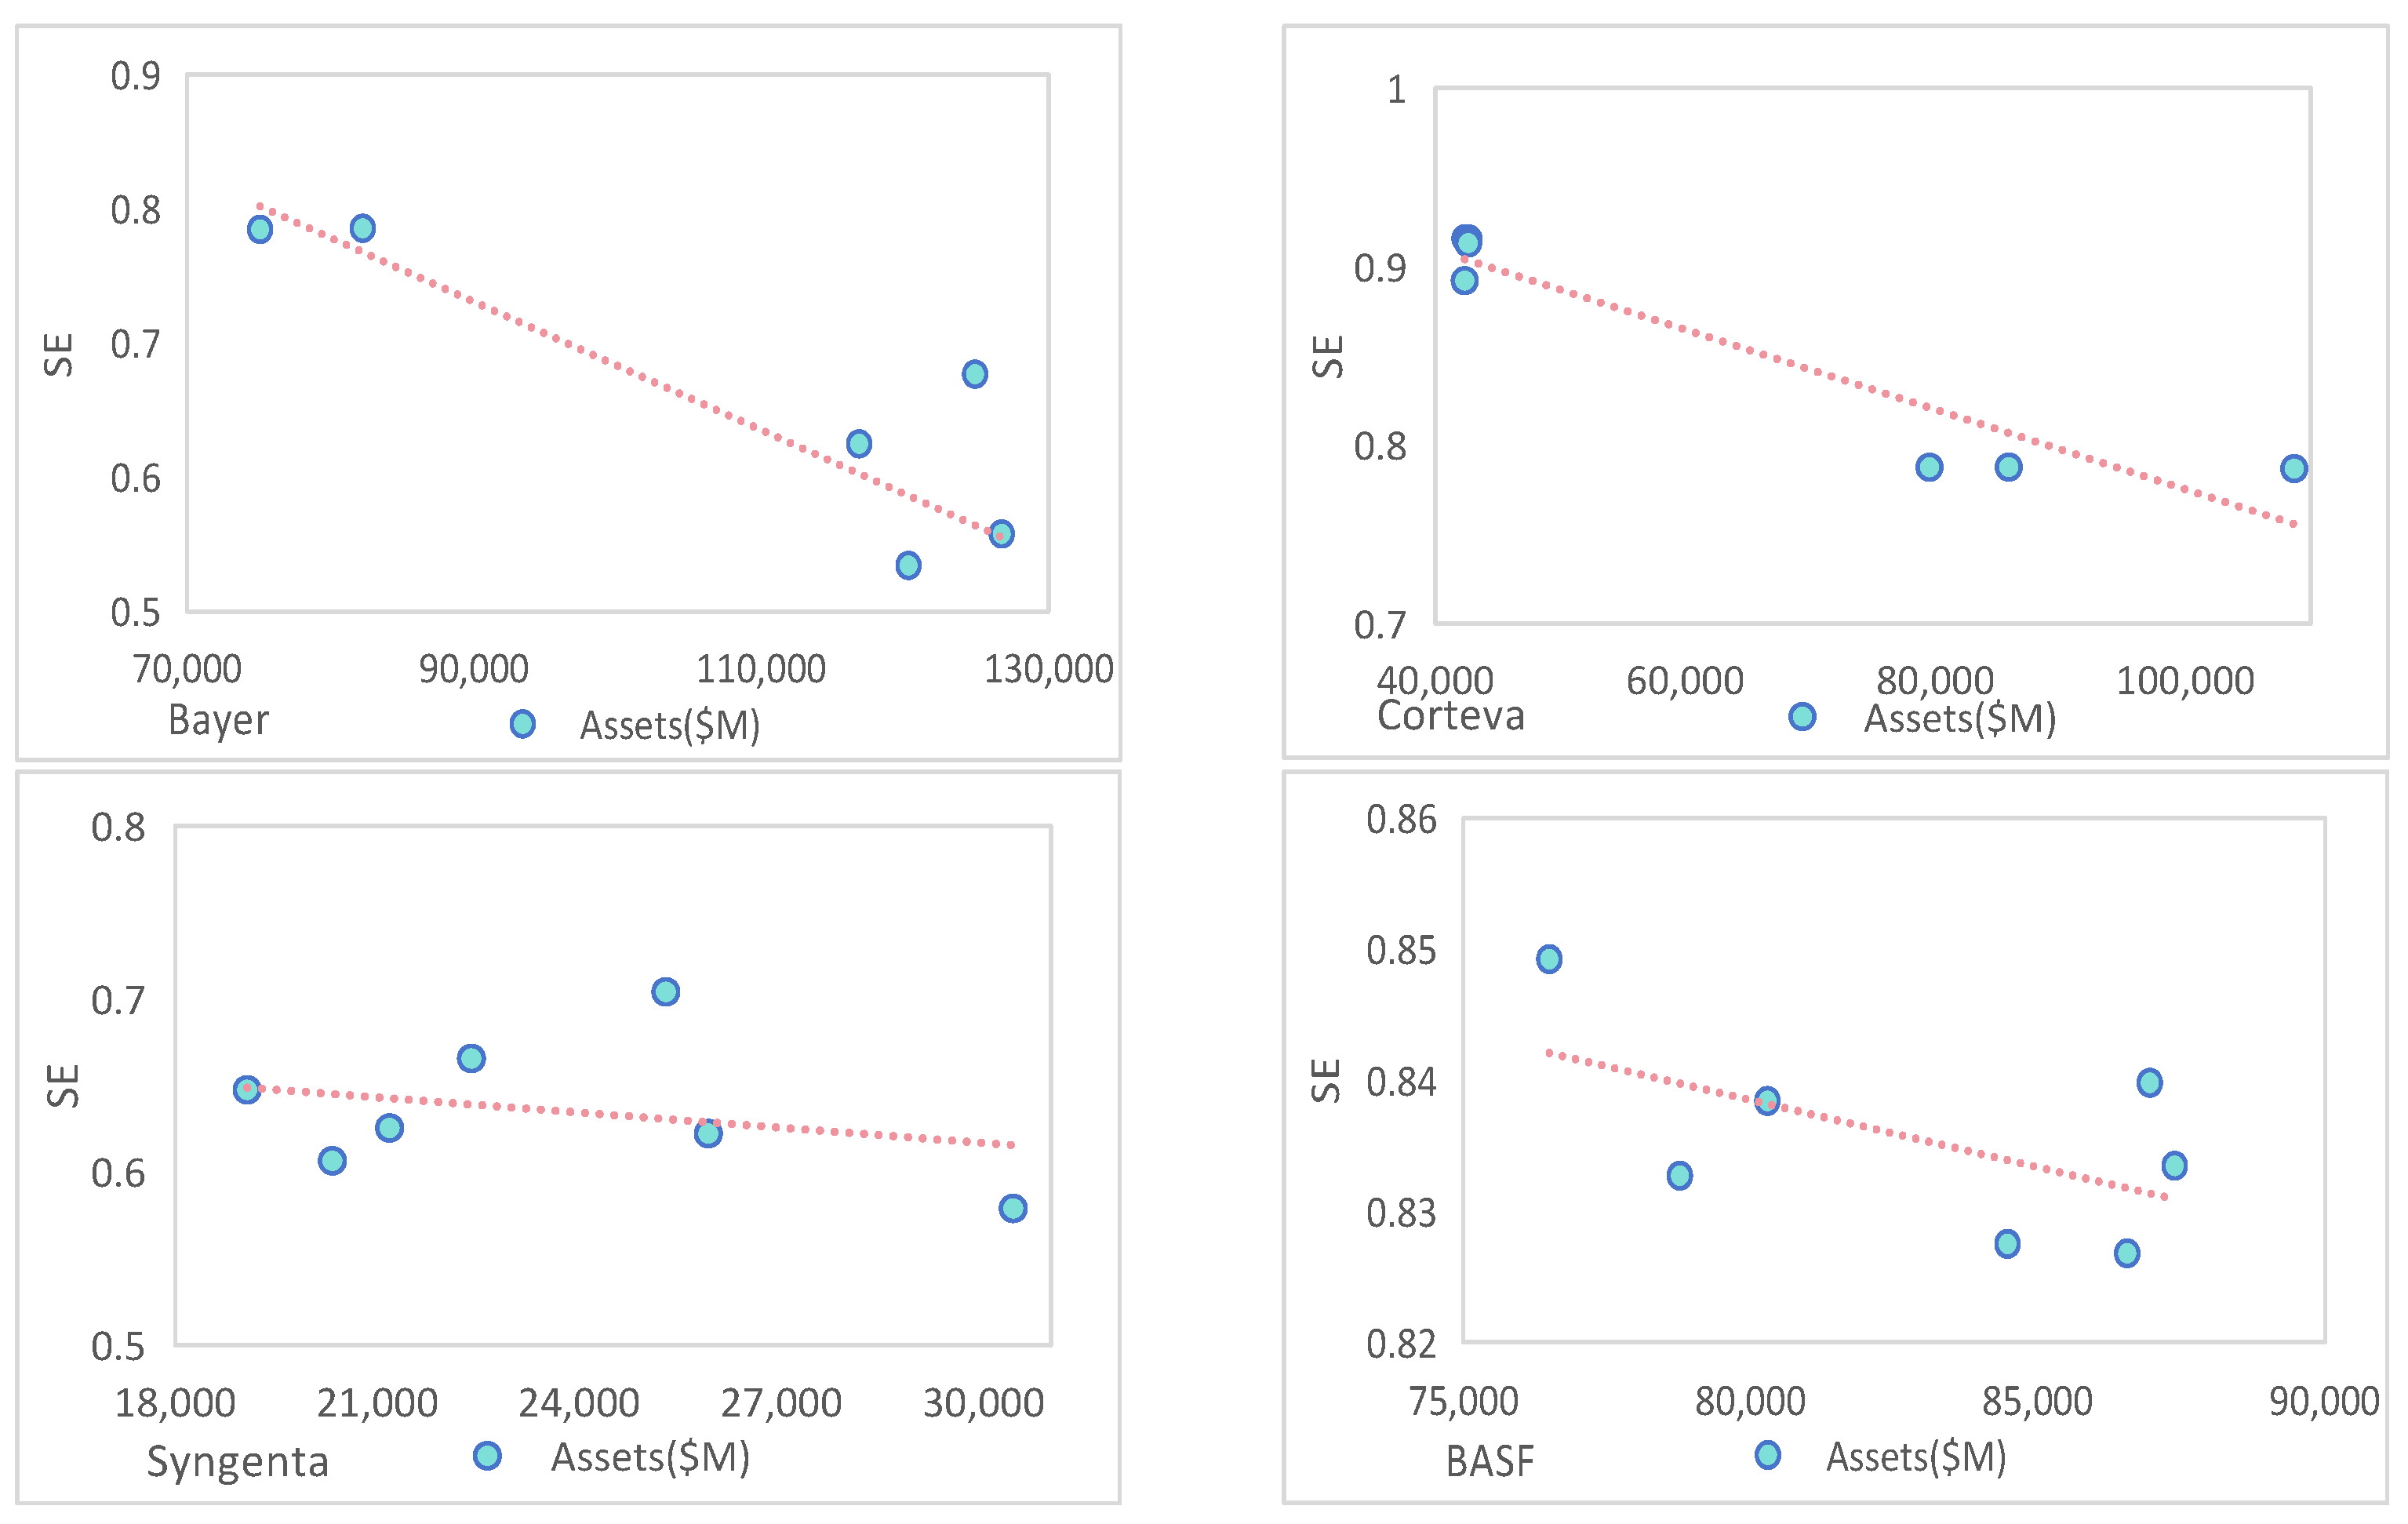
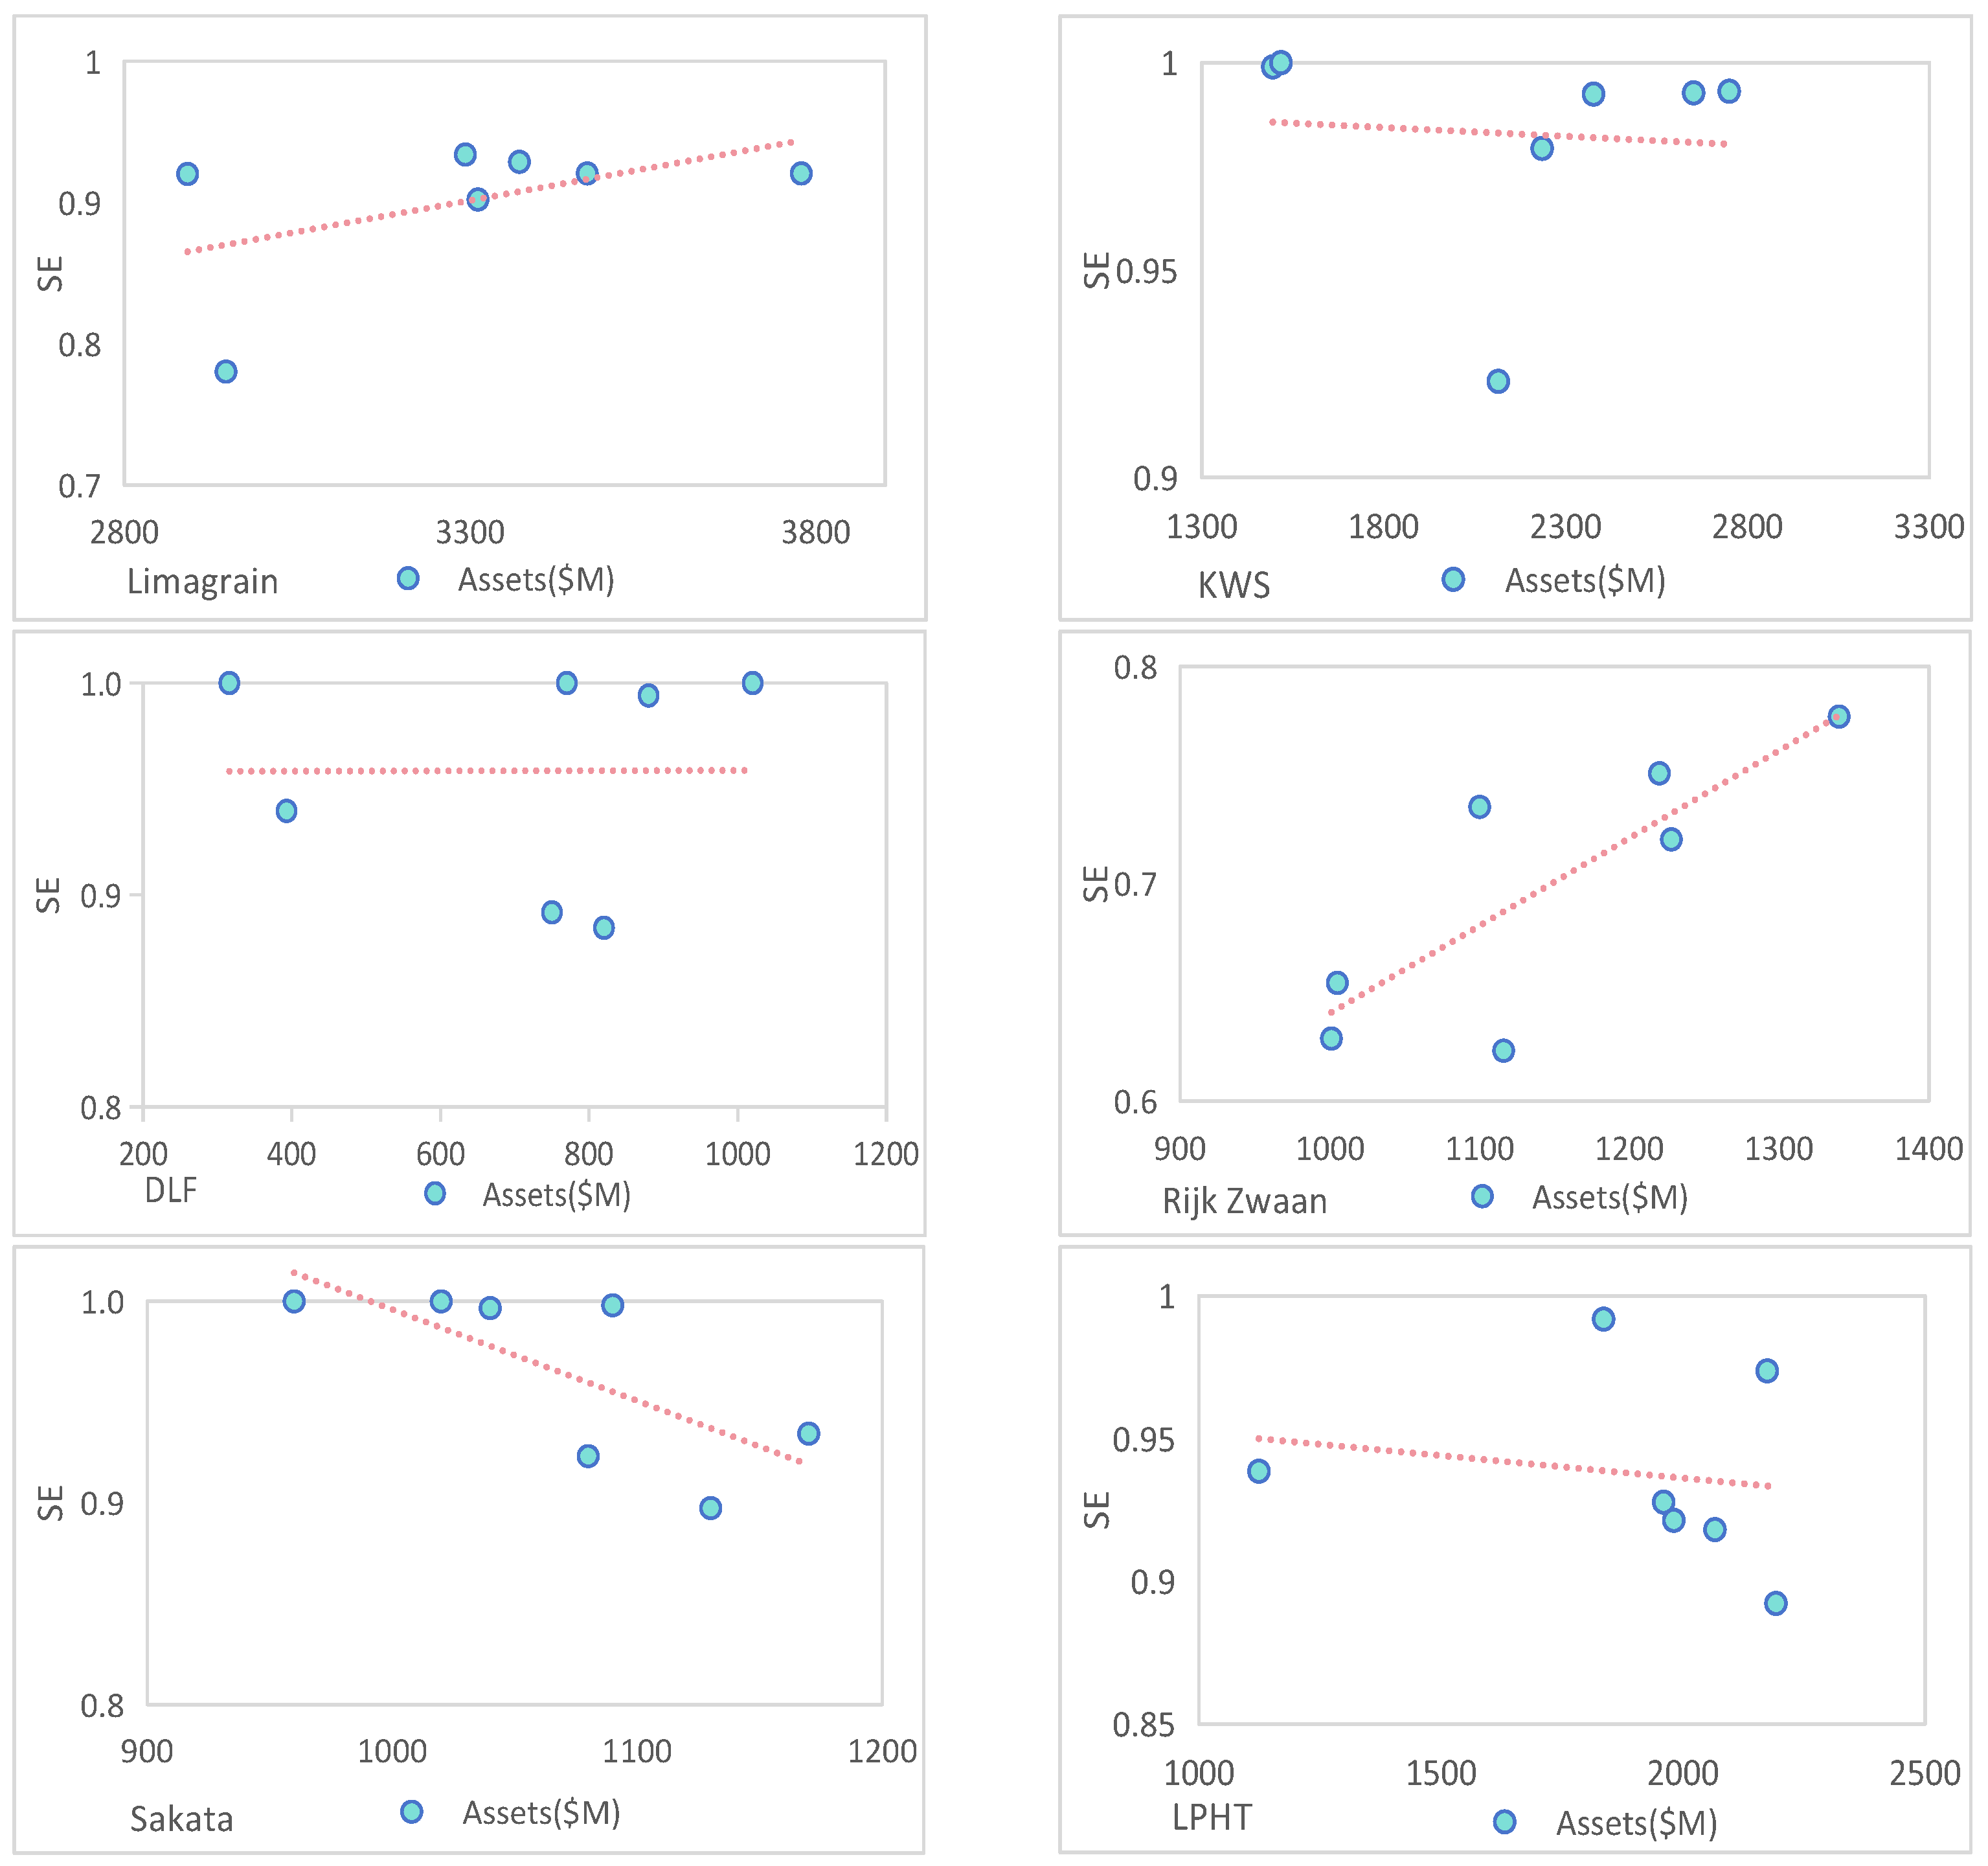
However, firms’ SE evolution varied (
Figure 4). Some (e.g., Bayer, Corteva) saw SE drops early in mergers due to mismatches between asset expansion and integration speed. Others (like DLF and KWS) aligned scale and resource capacity well, approaching CRS conditions and maintaining high SE during expansion via preemptive preparation—human capital training, flexible supply chains, and data-driven decisions. Still, others (Limagrain, Rijk Zwaan) showed increased SE trajectories, influenced by R&D maturity, market diversification, and supply chain partnerships [
46]. Furthermore, SE was maintained as firms adapted to external environments, policy changes, and IP regimes [
47]. In contrast, Syngenta and LPHT faced difficulties managing large-scale assets, resulting in efficiency declines. Overall, SE changes reflect complex interactions among restructuring, innovation diffusion, policies, and governance. Early SE declines stemmed from consolidation and mismatches, while later recoveries show the benefit of strategic asset allocation, lean models, and digital tools. Merely expanding the scale is insufficient in achieving a long-term advantage; firms must find the scale–efficiency balance and adjust resources dynamically.
3.4. Efficiency Change (EFFCH)
EFFCH measures a firm’s efficiency changes over time due to improved resource allocation and management. From 2016 to 2022, EFFCH patterns varied, reflecting how industry consolidation, technology diffusion, and firms’ strategic and operational capabilities shape resource utilization efficiency.
From 2016 to 2019, the average EFFCH rose from 1.0064 to 1.1592, as firms integrated resources, improved processes, and enhanced R&D collaboration while strengthening international mergers and competition [
1]. These gains stem from better adaptation to markets and regulations, economies of scale, and data-driven decisions. However, as shown in
Table 2, between 2020 and 2021, EFFCH fell to 0.9723, linked to pandemic-induced supply chain disruptions and uncertainties [
48]. Firms faced logistics issues, labor shortages, and delayed R&D, reducing resource allocation effectiveness. By 2021 and beyond, as supply chains recovered, policies stabilized, and internal strategies adapted, the average EFFCH rebounded slightly, showing regained adaptive capacity under complex conditions.
At the firm level, EFFCH trajectories relate closely to asset integration, innovation investments, and market strategies. Bayer’s efficiency improved in 2016–2017 and 2019–2020 due to cost optimization and lean management post-mergers [
49] but slowed in 2021 due to long investment return cycles, underscoring the importance of cost control and lean operations [
50]. Corteva’s EFFCH peaked at 1.70414 in 2018–2019, demonstrating that precision agriculture and asset integration yield significant efficiency leaps [
51]. Syngenta’s EFFCH fluctuated, peaking at 1.375 in 2017–2018 and then declining due to unclear priorities and dispersed management, but later stabilized with localized management, capital optimization, and a focus on key markets [
52].
KWS maintained a stable EFFCH by focusing on high-demand crops and market diversification, mitigating single-market volatility, and sustaining resource use efficiency. DLF’s neutral EFFCH reflects stable positioning in forage and turf seeds. With rising market expansion and management improvements, LPHT saw a brief improvement from 2019 to 2020. However, future growth is constrained by a lack of international competitiveness and technological reserves. Rijk Zwaan and Limagrain highlight that continuous innovation, R&D investment, and capacity expansion can optimize resource allocation and raise EFFCH.
In summary, trends in EFFCH across firms reflect the key impact of resource integration capabilities, market expansion strategies, and investment in technological innovation on changes in efficiency. Firms with an EFFCH consistently above 1 (e.g., Corteva, Syngenta, and Limagrain) are typically able to deliver efficiency gains through precision farming, technology upgrades, and asset consolidation, but this growth can fluctuate, suggesting challenges to the sustainability of resource optimization. In contrast, companies with an EFFCH close to 1 and less volatile (e.g., KWS, DLF) show stable operational management capabilities, relying on long-term robust market placement and focusing on specific crop categories to reduce the impact of fluctuations in the external environment. In addition, companies showing a decline in EFFCH after a phase of growth (e.g., Bayer, LPHT) face short-term gains from M&A integration or market expansion but fail to sustain efficiency gains in the long term, suggesting that there is still room to optimize management adjustments and international competitiveness. Overall, changes in EFFCH not only depend on short-term management optimization and market expansion but are also influenced by firms’ long-term resource allocation efficiency and the sustainability of technological innovation.
3.5. Technical Change (TECHCH)
Technical change (TECHCH) is the core driving force behind dynamic shifts in the production frontier, promoting effective resource allocation and enhancing overall efficiency through innovation, R&D advancements, and the adoption of advanced agricultural technologies. This section employs the Malmquist Productivity Index (MPI) to conduct a detailed analysis of TECHCH among the world’s top ten seed companies from 2016 to 2022, aiming to evaluate their performance and differences in technological progress while exploring the interaction between external environmental turbulence and internal innovation strategies.
Overall, the period from 2016 to 2017 represented a critical phase of accelerated expansion in the industry’s technological frontier. High TECHCH levels were attained by the global seed industry during this time, largely due to the quick commercialization of high-value crop varieties, advances in gene editing and transgenic technologies, and the rapid spread of big data tools and precision agriculture [
53,
54]. Between 2016 and 2017, Rijk Zwaan attained a TECHCH of 1.01874, reflecting its sustained investment in vegetable seed innovation, enabling a more accurate alignment between breeding processes and market demands. Although Corteva’s TECHCH slightly receded between 2017 and 2018 (from 0.99622 to 0.97453), its previously accumulated R&D capacity and the integration of advanced germplasm resources laid a foundation for subsequent technological enhancement. The technological optimization during this period stemmed not only from the accumulation of internal innovation factors but also from the relative stability of international regulatory environments and the effectiveness of policy incentives [
55].
In contrast, as shown in
Table 3, Bayer’s TECHCH dropped sharply from 0.93414 to 0.73952 between 2018 and 2020. In 2018, Bayer completed the acquisition of Monsanto, a transaction involving substantial financial and integration costs. The firm may have focused its resource allocation efforts on managing post-merger operational integration rather than sustaining high-level technological innovation, resulting in a significant decline in TECHCH. Worldwide supply chain disruptions and R&D limitations brought on by the COVID-19 pandemic caused a major increase in industry chain and worldwide economic concerns between 2019 and 2021, which had a major effect on TECHCH. Sakata’s and LPHT’s TECHCH values dropped to 0.77440 and 0.75598, respectively, during that time frame, indicating that delays in capital investment, limited testing conditions, and pandemic-induced disruptions to cross-border R&D collaboration caused bottlenecks in their technological frontier expansion. The pandemic also significantly affected DLF’s technological innovation: while its TECHCH was as high as 1.35579 in 2019–2020, it plummeted to 0.9182 in 2020–2021 following the outbreak.
As the world economy gradually steadied in 2021 and 2022, technical advancements also showed a modest rebound. Corteva’s TECHCH remained relatively balanced, and its post-pandemic restructuring of R&D strategies and in-depth collaboration with digital technology platforms began to yield results. Rijk Zwaan and KWS obtained TECHCH scores of 1.06933 and 1.06752, respectively, in 2021–2022, demonstrating the development of strong R&D chains and effective technology diffusion mechanisms in their respective crop areas through consistent R&D investment and strategic market positioning. In contrast, Sakata’s TECHCH decreased from 1.05579 in 2020–2021 to 0.97810 in 2021–2022, indicating that relying solely on early technological accumulation is insufficient to counter new challenges arising from market demand fluctuations and policy changes. According to Schuh et al. (2019) and Dereli (2017) [
56,
57], this scenario illustrates how businesses’ technological frontier development will not be sustainable if they are unable to adapt their strategies in real time to changing markets and environmental conditions.
Analyzing at the firm level, we can see that differences in TECHCH reflect the combined effects of strategic positioning, R&D depth, and external coordination. The difficulties of resource integration, especially Bayer’s slow conversion of long-term R&D expenditures into real efficiency improvements, are highlighted by the company’s notable TECHCH drop in the early post-merger period. This phenomenon highlights the importance of improving the efficiency and speed of integrating technological resources under turbulent external conditions in maintaining a firm’s technological competitiveness [
58]. In contrast, Corteva strengthened hybrid seed R&D and digital agriculture partnerships, providing momentum for subsequent technological recovery. Rijk Zwaan’s ongoing innovation and Limagrain’s investments in R&D and operational expansion demonstrate that focused specialization and resource commitment in particular areas can provide a stable foundation for advancing the technological frontier. Moreover, DLF’s specific technological breakthroughs in turf and forage seeds highlight that combining differentiated technological strategies with a well-defined market orientation can help maintain a high rate of technological change during periods of great uncertainty.
In conclusion, the dynamic performance of TECHCH is impacted by significant external environmental and market restrictions in addition to enterprises’ R&D capabilities and technical route choices. Firms with robust R&D foundations and flexible technological response mechanisms are better able to maintain or even enhance TECHCH under external shocks, while those with weak technological accumulation, severe path dependency, or unclear market positioning are more likely to struggle with frontier expansion during turbulent periods.
3.6. Interactive Analysis of TECHCH and SE
Technical change (TECHCH) and scale efficiency (SE) play complimentary roles in improving enterprises’ dynamic efficiency. TECHCH expands the production frontier through innovation and R&D, while SE evaluates a firm’s ability to optimize resources under various scale conditions, revealing whether it effectively leverages its operational scale. Drawing on TECHCH and SE data from the world’s top ten seed companies between 2016 and 2022, this study explored their interaction in dynamic efficiency and conducted an in-depth examination of firm performance at different stages using returns to scale (RTS).
The findings indicate that from 2016 to 2022, both TECHCH and SE exhibited significant fluctuations, and there were inherent connections among their changes during critical periods. While many companies greatly pushed frontier growth through R&D expenditure and technical innovation, the industry’s technological improvement surged between 2016 and 2018. However, scale efficiency performance varied greatly. For instance, Rijk Zwaan’s sustained innovation in the vegetable seed domain led to a TECHCH of 1.0187 between 2016 and 2017, and its SE was also upgraded, demonstrating the positive influence of technological change in improving scale efficiency. In contrast, although Bayer’s TECHCH remained stable between 2016 and 2018, its SE declined from 0.7854 to 0.5578, reflecting the lower adaptability of resource allocation under varying scale conditions (
Table 4).
The COVID-19 pandemic and economic uncertainty caused general losses in both TECHCH and SE between 2019 and 2021, with enterprises that saw declining returns to scale (DRS) being severely impacted. For instance, Bayer’s TECHCH dropped from 0.9341 in 2018–2019 to 0.7395 in 2019–2020, and SE was only 0.6249, suggesting that the external environment significantly limited the effectiveness of resource allocation and technical conversion in large-scale operations. In contrast, DLF achieved a TECHCH of 1.3558 in 2020 and remained near constant returns to scale (CRS), demonstrating highly coordinated technological innovation and resource allocation strategies in the turf and forage seed sectors. KWS maintained a consistent TECHCH (from 0.9328 to 1.0819) and SE (around 1.0) by concentrating on high-demand crops like maize and sugar beets. This suggests that, under growing returns to scale (IRS), technical progress successfully propels long-term gains in scale efficiency.
Between 2021 and 2022, as the global economy gradually recovered, TECHCH in the industry showed an upward trend, and improvements in SE mainly clustered in firms where technology and scale were highly compatible. For example, Corteva’s increased application of precision agricultural technologies and the promotion of digital tools kept its TECHCH stable at around 1, while its SE stabilized from 0.7876 in 2016 to 0.9. This performance reflects that under CRS conditions, the synergy between technology and scale can significantly improve overall efficiency. Through continuous innovation, Rijk Zwaan’s TECHCH reached 1.0693 in 2021–2022, while its SE steadily rose to 0.7769, demonstrating the ongoing contribution of technological breakthroughs to resource allocation efficiency. However, although Sakata and LPHT experienced slight fluctuations in TECHCH and SE, these remained relatively stable, further indicating that under conditions of high external uncertainty, these two companies adopted prudent development strategies. By maintaining technological investment and optimizing resource allocation, they avoided severe volatility in technical and scale efficiency.
Further analysis, incorporating RTS, shows that different firms display significant disparities in the combination of technological change and scale efficiency. Firms in the IRS stage (e.g., KWS) amplify the outcomes of technological change by continually expanding scale and optimizing resource allocation; those in the CRS stage (e.g., DLF and Corteva) adopt stable operating models to maximize the returns from technological innovation while maintaining scale optimization. In contrast, firms at the DRS stage (e.g., Bayer and Syngenta) face challenges in resource allocation and scale management that prevent the full translation of technological change achievements into efficiency gains.
4. Discussion
This study provides a comprehensive assessment of the efficiency trajectories of the top ten global seed companies between 2016 and 2022, highlighting how strategic decisions around scale expansion, innovation investment, and organizational adaptability shape firm performance. The results contribute to both academic inquiry and managerial strategy by elucidating how technical efficiency, scale economies, and innovation-driven productivity interact under conditions of consolidation and uncertainty.
The static DEA results reveal substantial heterogeneity in firm-level efficiency. While no company maintained an overall technical efficiency (OTE) above 0.85 across all years, KWS, DLF, and Sakata consistently ranked among the top performers. KWS, in particular, maintained an average OTE of 0.797 and reached a peak of 0.980 in 2017, reflecting effective alignment between managerial practices and scale management. In contrast, firms such as Bayer and Syngenta, which pursued aggressive post-merger growth, experienced marked OTE declines—over 10 percentage points in some years—likely due to integration frictions, structural redundancies, and difficulties in aligning heterogeneous assets. Notably, KWS and DLF improved their scale efficiency (SE) by transitioning from increasing returns to scale (IRS) to constant returns to scale (CRS) in a measured, incremental manner, enabling them to reach and maintain an optimal operational size. Conversely, Bayer and Syngenta exhibited declining SE and regressed to decreasing returns to scale (DRS), underscoring the risks of uncoordinated expansion.
These results provide empirical support for Hypothesis 1: large-scale mergers, in the absence of effective post-merger integration and managerial realignment, tend to erode scale efficiency in the short term. This observation is consistent with the concerns raised in Zhang’s 2025 study [
59]. The study points out the potential decline in financial performance after mergers and acquisitions, which may be related to operational integration issues [
60].
Dynamic analysis based on the Malmquist Productivity Index (MPI) further reveals how technological innovation interacts with organizational capacity. Corteva stands out for maintaining high technological change (TECHCH > 1.03) alongside consistent efficiency change (EFFCH), suggesting that strong R&D capabilities—especially in gene editing, digital farming, and smart breeding platforms—were effectively translated into operational performance. In contrast, firms such as BASF and LPHT exhibited a weak TECHCH and stagnant or declining EFFCH, indicating poor absorptive capacity and a limited ability to integrate innovation into scalable practices.
Bayer’s experience illustrates the limitations of innovation without adequate organizational alignment. Despite significant technological acquisition through the Monsanto merger, Bayer experienced declining EFFCH during the integration period (2018–2020), implying a failure to convert innovation assets into productivity gains. These patterns confirm Hypothesis 2: innovation contributes to efficiency only when supported by complementary capabilities such as managerial adaptability, system integration, and resource flexibility. This finding aligns with the work of Chen (2024), who points out that resource allocation efficiency is critical to the performance of technological innovation and that R&D investment can only be truly translated into efficiency gains if it is supported by complementary elements such as managerial adaptability, system integration capabilities, and flexible resource allocation [
60].
Some mid-sized firms, such as DLF and KWS, demonstrated a moderate but stable TECHCH (above 1.02) and improved SE without resorting to aggressive mergers. Their coordinated strategy, combining gradual expansion with digital seed platforms and automation, highlights the benefits of synchronized development between scale and innovation, confirming Hypothesis 3.
Efficiency outcomes were also influenced by firms’ ability to withstand external shocks. The COVID-19 pandemic exposed vulnerabilities in firms like Bayer and Syngenta, as reflected in sharp EFFCH volatility. In contrast, Corteva and Rijk Zwaan showed greater resilience due to their earlier digitalization and decentralized operational structures. These findings underscore the importance of operational resilience and real-time adaptability in maintaining efficiency under global uncertainty, regulatory shifts, and climatic volatility.
The results suggest several strategic implications for firm managers. First, for firms operating under increasing returns to scale (IRS), it is essential to build alignment between scale expansion and innovation absorption. One actionable strategy is to adopt a tiered R&D investment structure, which distributes innovation resources across upstream research, downstream commercialization, and digital infrastructure deployment. This structure enhances the scalability of R&D and minimizes bottlenecks during rapid expansion. Second, firms should institutionalize MPI-derived indicators—such as changes in EFFCH and TECHCH—into internal management dashboards to enable the real-time detection of emerging inefficiencies and strategic misalignments. Third, investing in modular innovation platforms, including precision agriculture systems and cloud-based breeding pipelines, allows firms to scale efficiently without creating organizational overload. Finally, growth-sensitive performance monitoring systems should be introduced to detect the efficiency inflection point beyond which further expansion leads to diminishing returns. This facilitates evidence-based decision-making on whether to consolidate, diversify, or decelerate expansion plans.
Moreover, this study demonstrates that interpreting efficiency scores such as OTE, SE, TECHCH, and EFFCH can provide practical guidance for resource allocation and performance management. For example, high SE values under IRS indicate that firms can expand operations without compromising productivity—provided that they synchronize innovation and integration. Conversely, a decline in EFFCH or persistent DRS flags up potential misallocation risks and management bottlenecks that require timely intervention. Understanding these implications enables companies to use DEA-MPI scores not merely as retrospective evaluations but as forward-looking diagnostic tools.
From a policy perspective, regulatory frameworks should not only prevent excessive market concentration but also support firms in building adaptive, sustainability-orientated capabilities through targeted R&D incentives, digitalization support programs, and cross-border innovation collaboration mechanisms.
Nevertheless, several limitations warrant caution in generalizing these results. First, this study focused exclusively on the top ten global seed companies, which benefit from substantial resource endowments, global supply chains, and access to advanced innovation systems. The findings may not be directly applicable to smaller, regionally focused firms operating under different resource, regulatory, or infrastructural constraints. Second, while DEA and MPI provide rigorous tools for assessing internal efficiency and tracking dynamic changes, these models do not explicitly account for external shocks such as climate variability, trade restrictions, or sudden policy shifts—factors that have become increasingly influential in global agriculture. Third, differences in crop specialization, target markets, and regulatory environments may further contribute to firm-level heterogeneity, which the current modeling framework only partially captures. These limitations underscore the need for caution when interpreting firm rankings or deriving strategic prescriptions, especially in highly volatile or institutionally diverse settings.
Ultimately, efficiency in the seed industry does not result from any single factor such as firm size or R&D intensity but rather from the coordinated development of technological capability, scale optimization, and organizational flexibility. Firms that internalize this multi-dimensional approach will be better positioned to enhance competitiveness while contributing to sustainable agricultural transformation.
5. Conclusions
This study evaluates the efficiency trajectories of the world’s top ten seed-producing companies from 2016 to 2022, applying a combined DEA–MPI framework to assess static and dynamic performance. The findings offer empirical insights into how firms navigate the trade-offs between scale expansion, technological innovation, and operational efficiency in the context of post-merger integration and sustainability-driven transformation.
The results reveal substantial heterogeneity across firms in terms of both scale efficiency and innovation adaptability. Companies such as DLF and KWS successfully transitioned from increasing returns to scale (IRS) to constant returns to scale (CRS), demonstrating prudent scale adjustments and effective resource deployment. In contrast, LPHT remained constrained during the IRS phase due to persistent input–output mismatches, while Syngenta exhibited decreasing returns to scale (DRS) following aggressive expansion. These patterns emphasize that scale expansion must be strategically coordinated to avoid efficiency losses—particularly in the context of rising environmental expectations and carbon reduction targets.
Dynamic analysis further confirms the central role of technological innovation in sustaining long-term productivity gains. Corteva achieved significant improvements in both technological change (TECHCH) and efficiency change (EFFCH) through integrated R&D, digital infrastructure, and post-merger alignment. However, firms like BASF and LPHT, which failed to match scale expansion with internal innovation absorption, consistently underperformed. Bayer’s experience further illustrates that technological acquisition without managerial alignment can erode efficiency. These observations underscore that only firms that synchronize innovation strategies with organizational processes and market responsiveness can achieve sustainable efficiency gains.
External volatility also plays a pivotal role in shaping efficiency outcomes. EFFCH fluctuations during the COVID-19 pandemic reveal that operational resilience, information responsiveness, and flexibility are critical in maintaining performance during global disruptions. Climate-related risks, regulatory shifts, and geopolitical uncertainty increasingly demand that firms adopt adaptive strategies—including supply chain diversification, climate-resilient breeding technologies, and sustainability-aligned risk management—to safeguard long-term competitiveness.
Despite offering a robust static–dynamic evaluation, this study has several limitations. The analysis does not explicitly incorporate external macro-environmental variables such as climate variability, policy changes, or geopolitical risk—factors that significantly influence strategic decisions and operational outcomes in the seed industry. Furthermore, while DEA–MPI provides valuable insights into internal efficiency, it assumes deterministic frontiers and does not account for stochastic disturbances or unobserved heterogeneity, which may lead to bias in the interpretation of firm-level dynamics.
Future research could develop hybrid analytical frameworks that combine internal efficiency model with external environmental indicators. For example, linking DEA–MPI results with climate indices, regulatory metrics, or geopolitical risk scores—via two-stage DEA or panel regressions—would allow for a more comprehensive understanding of how firms navigate internal optimization under external uncertainty. Expanding the analytical scope to include the effects of green financing, carbon pricing, and AI-enabled breeding platforms would also help bridge the gap between operational efficiency and sustainable transformation, offering guidance to both industry leaders and policymakers.


