3. Results
Inequalities in average per-capita emissions persist across world regions [
20]. We first characterized the CO
2 emissions per capita across the AIM, IMAGE, and POLES models under a no-policy scenario and a 1.5 °C warming limit scenario (
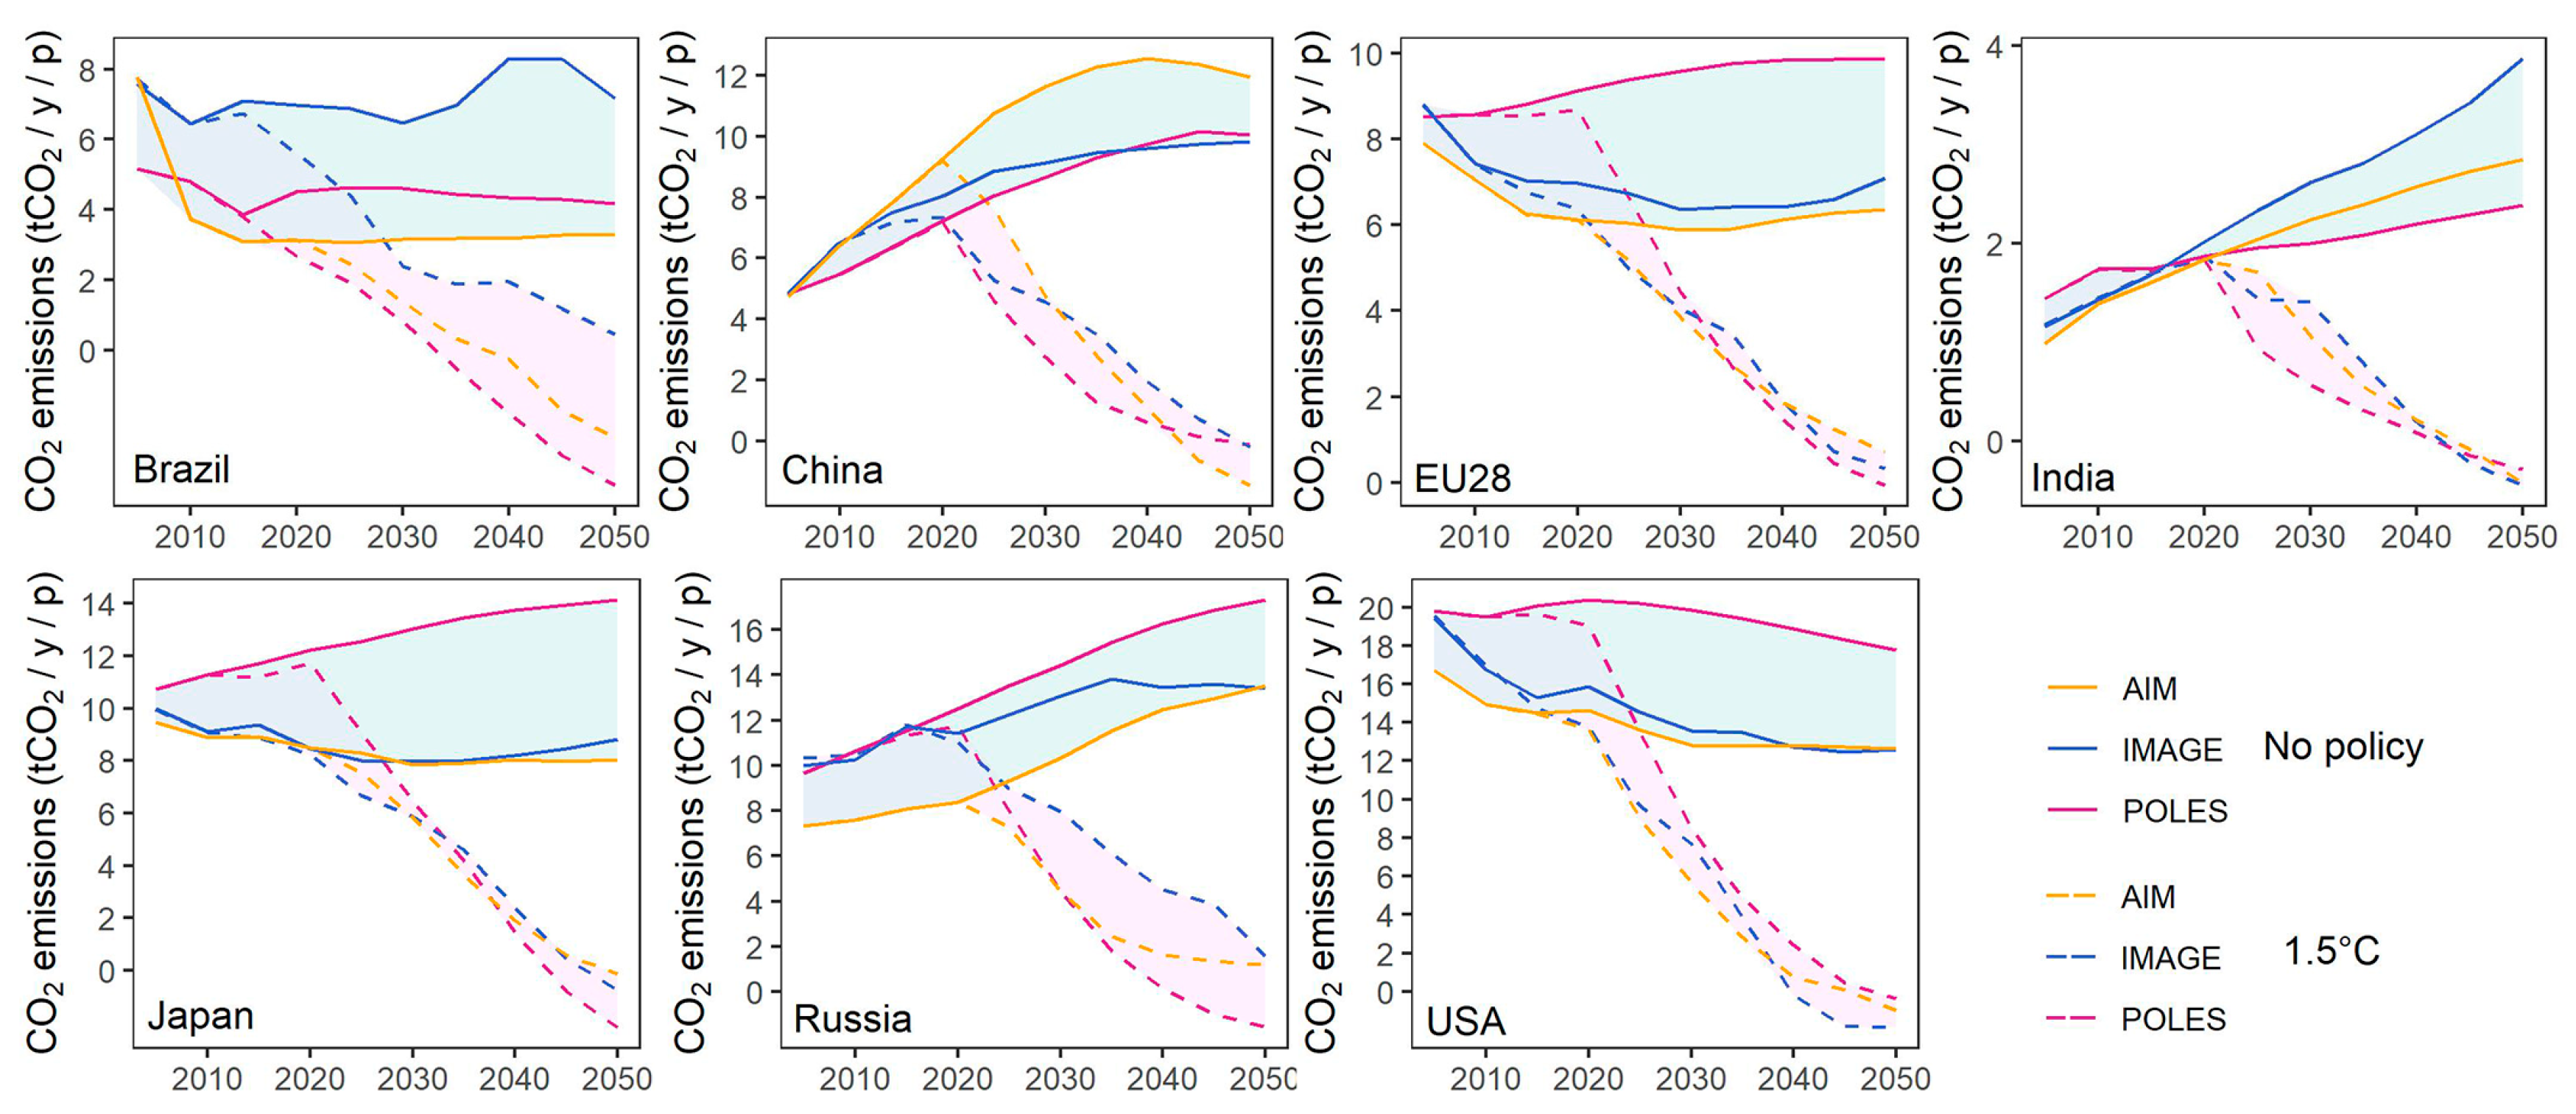
Figure 1). In 2005, the average annual per-capita CO
2 emissions were recorded as 6.8 tons for Brazil, 4.8 tons for China, 8.4 tons for EU28, 1.2 tons for India, 10.1 tons for Japan, 9.0 tons for Russia, and 18.6 tons for the USA. To ensure a high likelihood of limiting the global temperature rise to below 1.5 °C, average per-capita emissions are predicted below zero tCO
2 after 2050.
Brazil’s energy structure is relatively clean, relying heavily on hydropower. In 2050, without any policy interventions, Brazil’s per-capita emissions are projected to be between 4.2 and 7.2 tCO
2. Although the deforestation rate has decreased by 76% over the past 13 years, the incidence of fires increased by 36% during the drought in 2015. Emissions solely from forest fires were more than half higher than the total emissions caused by primary forest deforestation in drought years [
21].
The range of the per-capita emissions of China in 2050 is 9.8 to 11.9 tons of CO
2 under no policy. Due to coal consumption decreasing, China’s per-capita CO
2 emissions peak between 2030 and 2040, even without policy intervention [
22]. Under the 1.5 °C warming limit policy, the reduction rate of per-capita CO
2 emissions accelerates.
The per-capita carbon emissions of EU28 are lower compared to other industrialized countries, which vary between 6.4 and 9.9 tCO
2 in 2050 without policy intervention. The EU has set regulations and standards to boost energy efficiency and reduce carbon emissions per production unit. Furthermore, the EU’s carbon trading system prices emissions for the industrial and power sectors [
23].
India’s per-capita emissions are relatively low, which range from 2.4 to 3.9 tCO
2 in 2050 under no policies. India relies on coal but is also actively developing other energy sources. India has many low-income and rural residents with lower energy use, reducing per-capita emissions. With rapid urbanization, transportation-related emissions are rising [
24].
Japan has relatively high per-capita carbon emissions, which are from 8.0 to 14.1 tCO
2 in 2050, due to its high level of industrialization. After the nuclear disaster, Japan’s reliance on nuclear energy decreased, but the country continues its efforts to adopt renewable energy sources [
25].
Russia is a major producer of natural gas and oil, leading to the capita carbon emissions, which are from 13.4 to 17.3 tCO
2 without policies in 2050. The economic structure and cold climate are also reasons for the elevated carbon emissions [
26].
High industrialization and consumerism in the USA have led to a higher per-capita carbon emissions [
27], which are predicted to fluctuate between 12.6 and 17.8 tCO
2 in 2050. There is a dependence on fossil fuels, especially oil. The high-consumption lifestyle leads to a carbon footprint, and the cumulative effect leads to higher per-capita emissions. The carbon emissions of the top 0.1% of households by income in the USA are 57 times higher than those of the bottom 10% of US households and 597 times higher than the average household in low-income countries [
28].
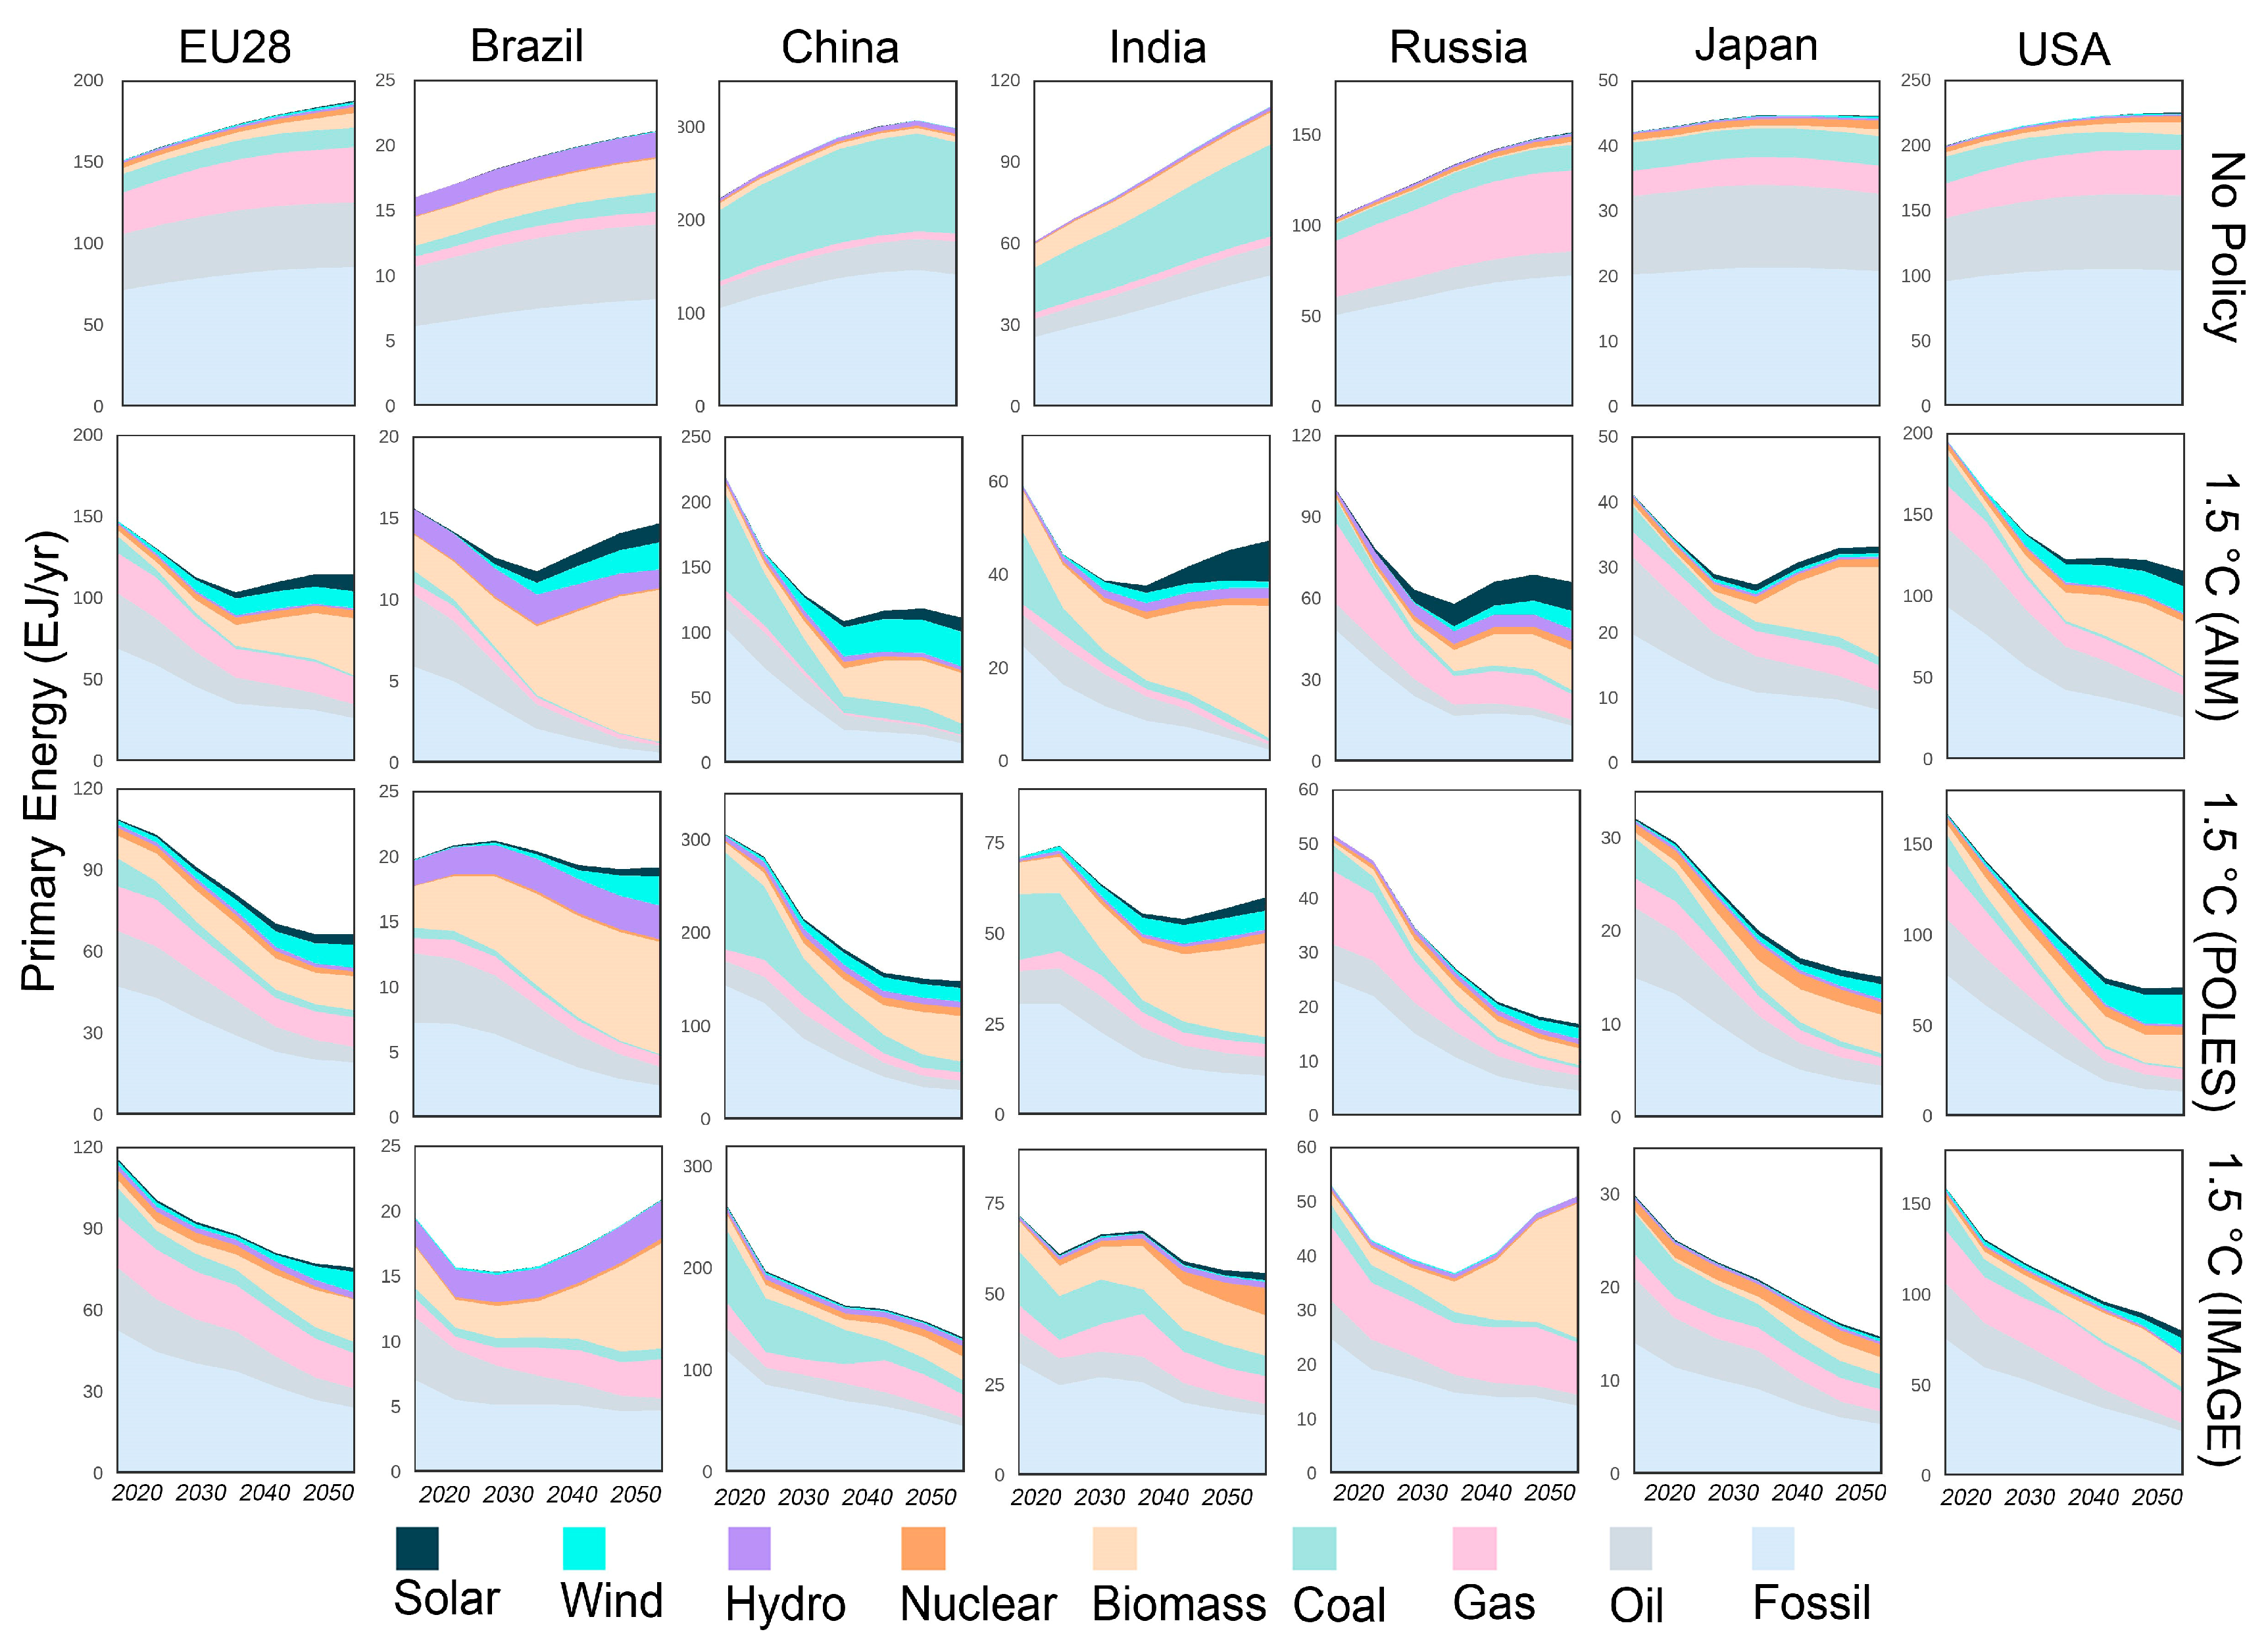
Carbon intensity is a metric that measures the amount of carbon dioxide emissions per unit of product, activity, or energy. Carbon intensity of energy refers to the amount of CO
2 emitted for every unit of energy consumed. The target of limiting warming to 1.5 °C requires a marked drop in carbon intensity, which would be decreasing 61%, 72%, 85%, 65%, 37%, and 71% by 2050 for Brazil, China, India, Japan, Russia, and the USA according to IMAGE (
Figure 2). The declines will be 79%, 84%, 84%, 78%, 81%, and 85% for Brazil, China, India, Japan, Russia, and the USA in POLES, the value of which is higher than the IMAGE predicted. There are three major driving factors that decrease carbon intensity. The primary measures to reduce carbon intensity include improving energy efficiency, renewable energy, carbon capture and storage, and so on. Carbon capture and storage (CCS) is perceived as a critical technology for climate mitigation [
29]. Bioenergy combined with carbon capture and storage functions can result in net-negative emissions. The effectiveness of these negative emissions is influenced by where the biomass is grown, how the original vegetation is managed, and the type of energy product ultimately produced [
30,
31].
Under a “no-policy” scenario, it is expected that by 2050, Japan, the United States, EU28, and Brazil will continue to rely primarily on oil and other fossil fuels for their energy needs. Meanwhile, China, India, and Russia are anticipated to remain dependent on coal and other fossil fuels (
Figure 3). According to the carbon-neutral projections of the AIM, POLES, and IMAGE models, these seven countries and regions will still predominantly use biomass or fossil fuels as their primary energy source by 2025. This reflects that these economies may continue to rely on traditional high-carbon energy sources, highlighting the urgency and challenges of transitioning to sustainable energy systems.
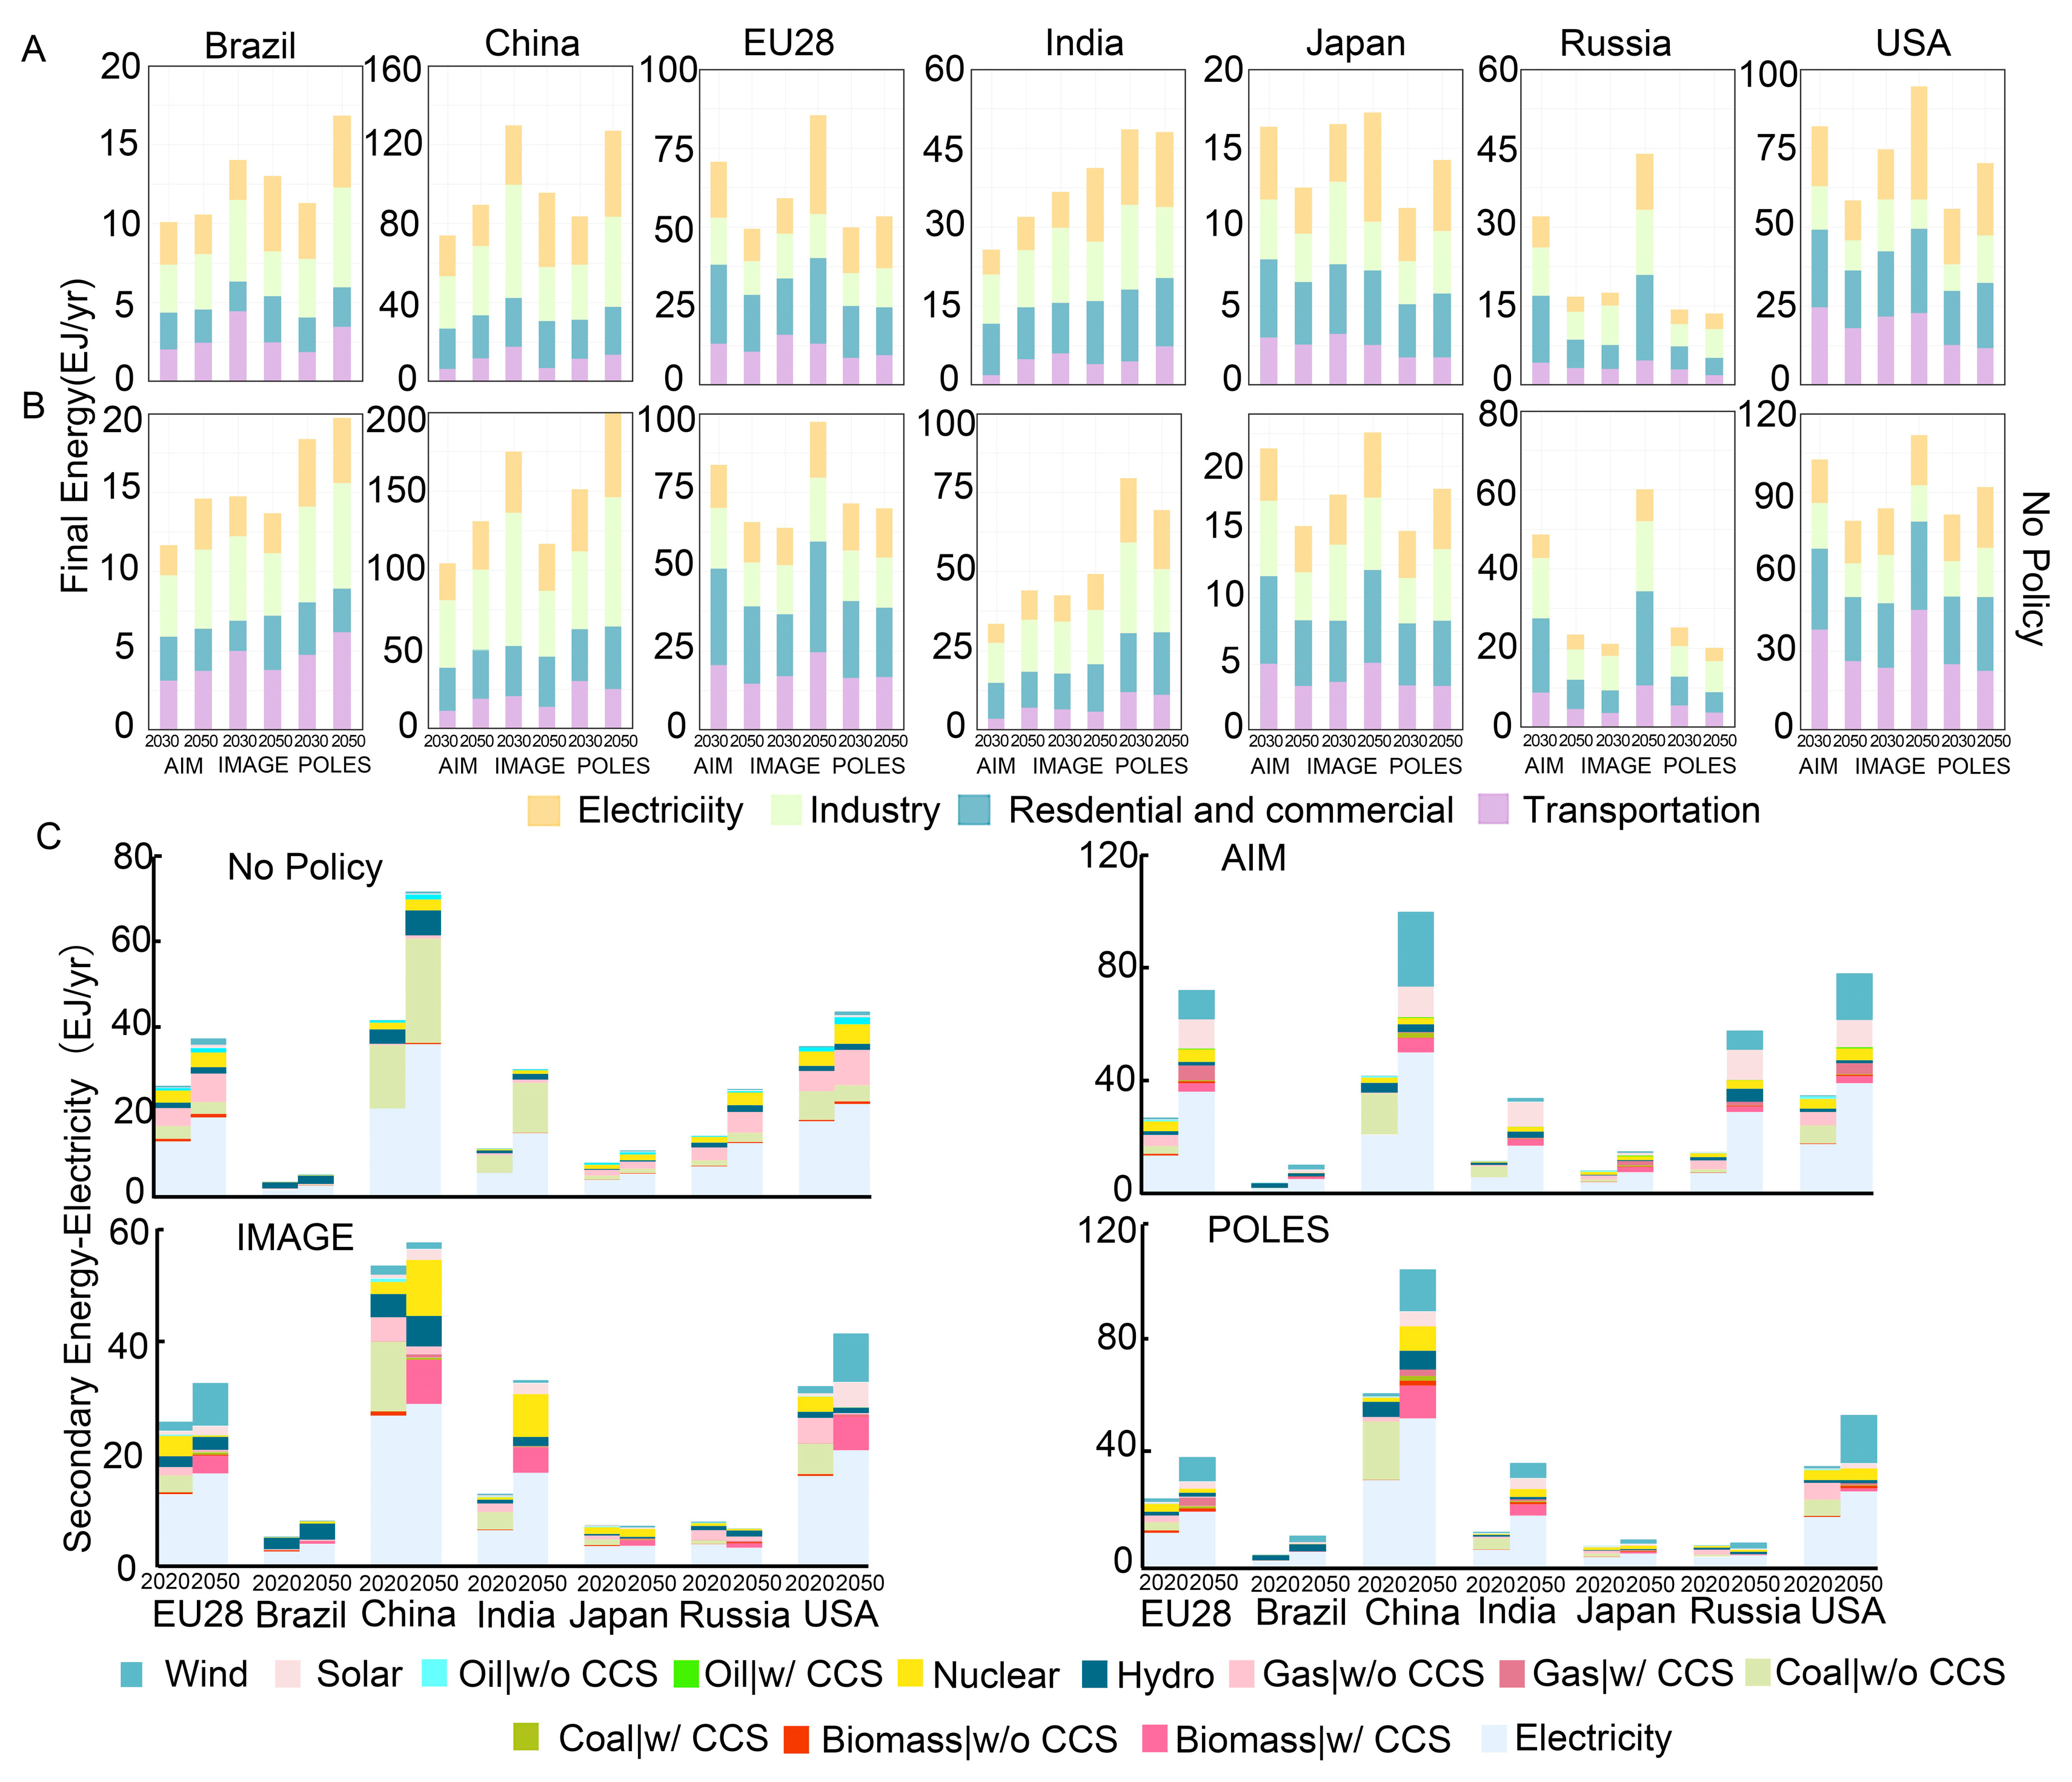
Based on the IMAGE model projections, it is evident that carbon neutrality policies will have a profound impact on the final energy consumption across various sectors by 2050. For countries like Brazil, China, EU28, India, Japan, Russia, and the United States, significant reductions in the electricity component of their final energy consumption are forecasted. These reductions are expected to be 17%, 38%, 4%, 30%, 5%, 41%, and 1% compared with 2005, respectively, indicating a shift towards more efficient and renewable energy sources in electricity generation (
Figure 4A).
Additionally, there is an anticipated substantial decrease in overall industry consumption by 60%, 50%, 27%, 73%, 12%, 20%, and 36%, respectively, in these regions. This suggests a broader trend towards energy efficiency and possibly a shift in consumption patterns due to advancements in technology and changing consumer behaviors.
In the residential and commercial sectors, the projected reductions are 33%, 40%, 32%, 27%, 29%, 40%, and 32%, respectively. This reflects the impact of carbon neutrality policies in promoting energy-efficient buildings and appliances, along with a transition to greener energy sources for heating and cooling.
The transportation sector is also expected to undergo significant changes, with decreases in energy consumption projected at 61%, 62%, 48%, 62%, 48%, 46%, and 50%, respectively. This indicates a major shift towards the electrification of transportation, increased use of public transit, and more efficient vehicles, driven by carbon neutrality goals.
These figures, based on a scenario projected for 2050 without any policy intervention (
Figure 4B), highlight the potential of carbon neutrality policies to transform energy consumption patterns significantly, contributing to a sustainable and low-carbon future.
In the absence of carbon neutrality policies, the primary sources of secondary energy electricity in those seven countries and regions are coal and electricity (
Figure 4C). In this scenario, the pattern of energy production and consumption is more traditional, relying on high-carbon emission energy forms, which impose a greater environmental burden. However, with carbon emission reduction prediction models, the regions gradually shift towards cleaner and more sustainable energy forms such as wind power, electricity, biomass, and nuclear for electricity production.
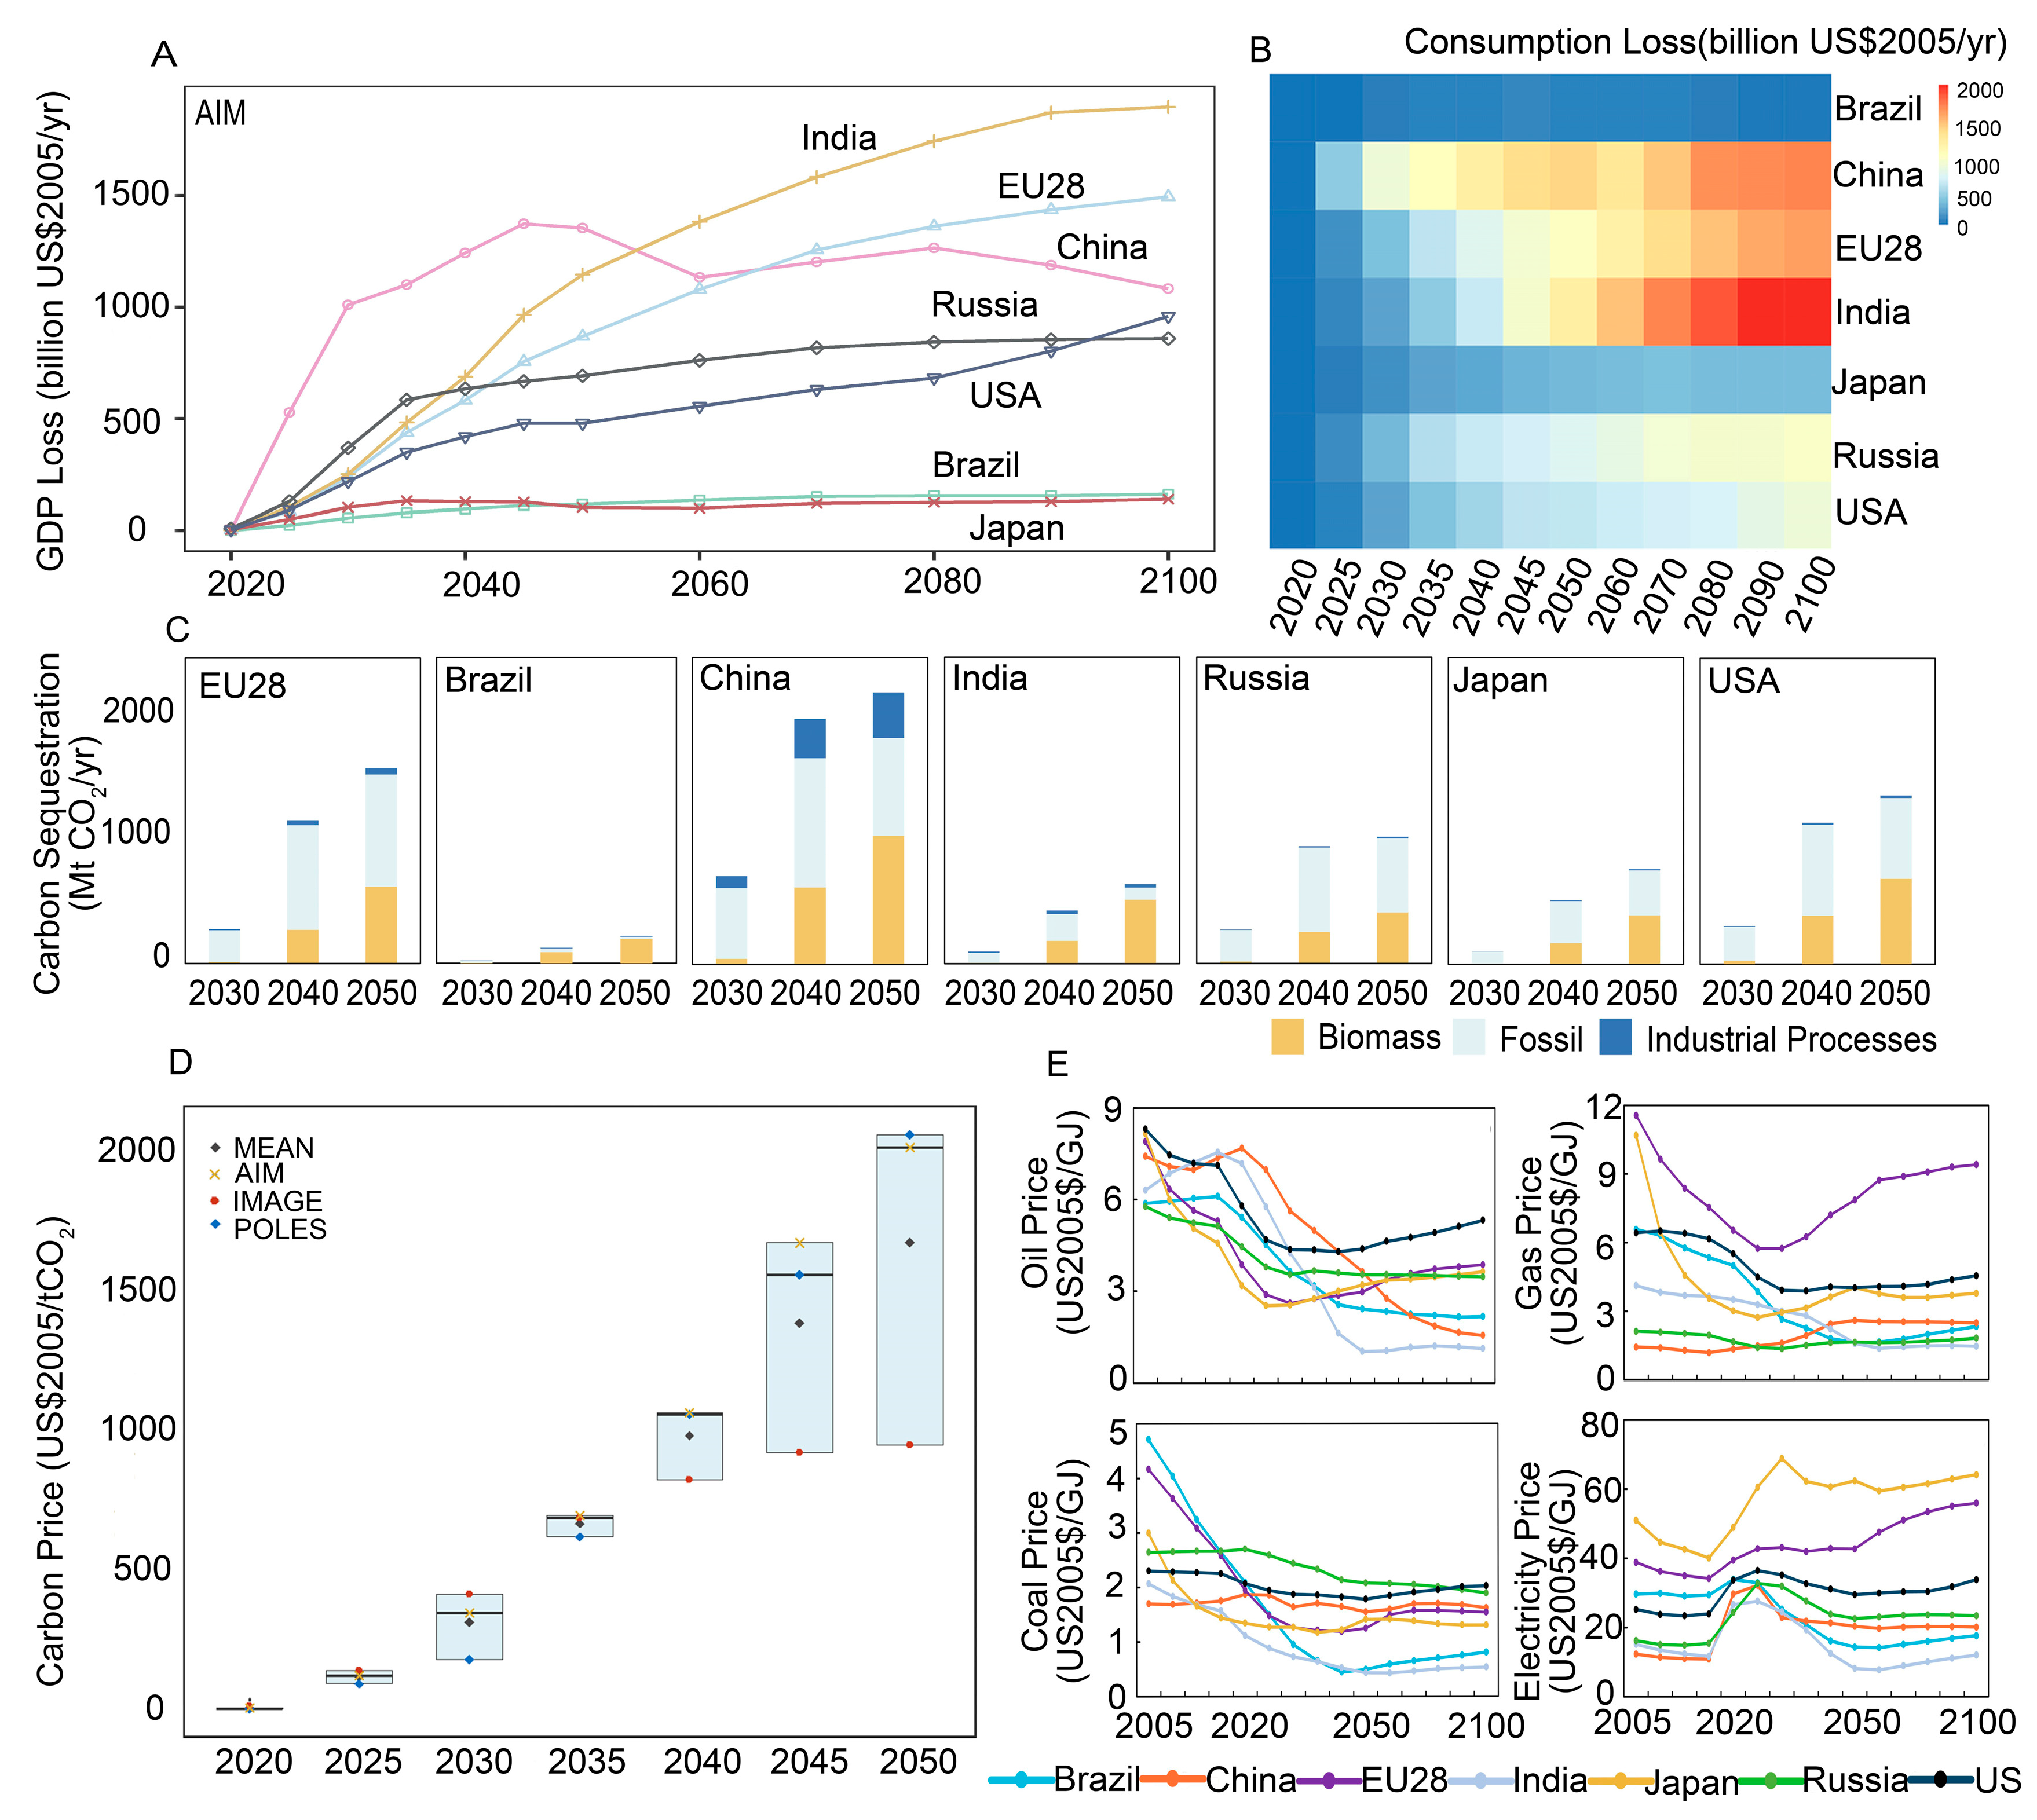
In a scenario of continued carbon emission mitigation towards 2100, economic projections indicate substantial GDP loss in several major economies. Brazil is anticipated to incur a loss of USD 160.4 billion, China USD 1082.2 billion, the collective EU28 USD 1494.8 billion, India USD 1898.4 billion, Japan USD 138.2 billion, Russia USD 859 billion, and the United States USD 958.7 billion, all quantified in 2005 US dollars annually (
Figure 5A). Reducing carbon emissions can initially lead to GDP losses due to the costs of transitioning from fossil fuels to renewable energy, industry adjustments, international trade impacts, policy implementation, and investment in innovation. However, these short-term economic challenges are likely to be offset by long-term sustainable growth and new economic opportunities in green technologies and energy sectors.
Projected carbon consumption losses by the year 2100 reveal a concerning global trend, with significant implications for both environmental and economic sectors. According to recent studies, Brazil is anticipated to incur a loss of 25.4 billion, expressed in 2005 US dollars per year, while China is anticipated to face a loss of 1811.1 billion. Similarly, the EU28 is expected to experience a loss of 1701.6 billion, with India’s projected loss even higher at 2141.2 billion. Japan, Russia, and the USA are also projected to face substantial losses, estimated at 351.9 billion, 1026.6 billion, and 906.6 billion, respectively (
Figure 5B).
Carbon consumption losses stem from several key factors: escalating greenhouse gas emissions driving climate change, resulting in damaging weather events and supply chain disruptions. The transition from fossil fuels to renewable energy sources, while environmentally critical, brings economic challenges. Regulatory measures like carbon pricing disrupt market dynamics, impacting industries and consumers. Economic dependence on fossil fuel industries exacerbates these transitions. Technological advancements and public behavioral shifts towards sustainability also play significant roles, as do international climate policies shaping national emissions management strategies. Carbon sequestration involves three key areas: biomass, fossil fuels, and industrial processes. By 2050, in the realm of fossil carbon sequestration, the EU28 is projected to contribute 57%, Brazil 8%, China 36%, India 15%, Russia 58%, Japan 47%, and the USA 48%. In contrast, when it comes to biomass carbon sequestration, the EU28 is anticipated to account for 39% of its total carbon sequestration efforts, Brazil a notable 89%, China 47%, India an impressive 80%, Russia 40%, Japan more than half at 52%, and the USA 51% (
Figure 5C). These figures indicate a significant reliance on utilizing biological resources, like forests and agricultural lands, to capture and store carbon, highlighting the varied approaches to carbon sequestration across these regions.
Biomass carbon sequestration capitalizes on the natural photosynthetic capacity of plants to capture atmospheric CO2, subsequently storing it in soils, thus enhancing terrestrial carbon sinks. Conversely, fossil fuel carbon sequestration employs advanced Carbon Capture and Storage (CCS) technologies to intercept CO2 emissions at combustion points, such as power plants and industrial facilities, and sequester them in geological formations, effectively reducing the atmospheric carbon load. Industrial carbon sequestration parallels this approach, targeting CO2 emissions inherent in manufacturing processes, notably in cement and steel production, and facilitates their capture and secure subterranean storage.
Based on the AIM, POLES, and IMAGE models, the projected carbon prices for 2050 are estimated at USD 2000, USD 2045, and USD 940 per ton of CO
2, measured in 2005 US dollars, respectively (
Figure 5D). This variation is largely due to differences in each model’s assumptions about technological advancements, global economic growth, and climate policy implementation. Factors such as the pace of renewable energy adoption, the efficacy of carbon taxes, and the dynamics of carbon trading markets also play a significant role.
According to the AIM model, the integration of carbon sequestration is anticipated to impact global oil markets significantly, with a projection of oil prices ranging between 1.0 and 4.3 US dollars per gigajoule (2005 currency value) by 2050 for seven countries and regions. Notably, from 2020 to 2050, the trend in oil prices is expected to show a continuous decline (
Figure 5E). As investment in clean energy technologies increases and carbon capture and storage (CCS) technology is adopted, oil prices may decline due to reduced demand. In the long term, if alternative sources of energy, such as electric vehicles, become more widespread and economical, the oil demand could decrease further.
The projected gas price in 2050 is expected to range from 1.6 to 7.8 US dollars per gigajoule (2005 currency value) across seven countries and regions. For the EU28 specifically, the trend is an ongoing increase in gas prices, particularly noticeable from 2030 to 2050. This continual rise can be attributed to several factors, including the depletion of easy-to-access natural gas reserves, increased demand in the face of limited supply, and stricter environmental regulations that may lead to higher production and delivery costs. Additionally, the global shift towards a greener economy may drive investments in renewable energy, further influencing gas prices as the market adapts to these changes.
The AIM model predicted coal price in 2050 is estimated to be 0.4–2.0 US dollars per gigajoule (2005 currency value) for seven countries and regions, amid global strides towards carbon neutrality. The projected electricity prices in 2050 range between 8.2 and 62 US dollars per gigajoule (2005 currency value) across seven countries and regions, with a notable trend of initially increasing and then decreasing prices from 2020 to 2050. This fluctuation is attributed to the initial costs of transitioning to renewable energy sources, which are expected to be high but will decrease over time as technology improves and becomes more widespread. Additionally, investments in energy efficiency and the gradual phasing out of fossil fuels will contribute to the eventual decrease in prices. Among the regions analyzed, Japan is projected to have the highest electricity prices, which can be attributed to its high dependency on imported fuels, stringent environmental regulations, and the costs associated with transitioning to a low-carbon economy.
4. Discussions
The persisting inequalities in per-capita CO
2 emissions across different world regions underscore a significant challenge in the global effort to mitigate climate change [
32]. The data from AIM, IMAGE, and POLES models reveal a stark contrast in emissions among countries, with the USA, for instance, having significantly higher per-capita emissions compared to India [
33]. This discrepancy not only highlights the differences in energy consumption patterns and economic structures but also raises questions about global equity and responsibility in addressing climate change. Countries with higher emissions have a larger carbon footprint and, arguably, a greater responsibility to lead in reducing emissions and investing in clean energy technologies.
Brazil’s reliance on hydropower illustrates a success story in utilizing renewable energy resources, showcasing a pathway for other nations rich in natural resources to develop cleaner energy infrastructures. However, the increased incidence of forest fires, partly due to droughts exacerbated by climate change, serves as a reminder of the vulnerabilities and complexities in maintaining sustainable energy and environmental policies [
34]. This scenario underscores the need for comprehensive strategies that encompass not only energy production but also forest management, land use, and climate resilience [
35].
China’s and India’s significant reliance on coal, despite a gradual decrease in consumption, presents a formidable challenge in transitioning to lower-carbon energy systems. The projected peak in China’s per-capita CO
2 emissions between 2030 and 2040, even without policy interventions, suggests a turning point that could be expedited with more aggressive policies and investments in renewable energy [
36]. For India, the challenge is twofold: expanding energy access to support economic growth while also transitioning to cleaner energy sources, a task that requires substantial investment and innovation in energy technologies [
37].
The role of policy interventions in accelerating the transition to low-carbon economies cannot be overstated [
38]. The European Union’s regulatory framework and carbon trading system serve as prime examples of how policy can drive change, encouraging energy efficiency and reducing emissions in industrial and power sectors [
39]. The projections for 2050 indicate that, without such policy interventions, reliance on fossil fuels will continue in many regions, underscoring the critical need for comprehensive climate policies that include carbon pricing, investment in renewable energy, and support for carbon capture and storage technologies [
40]. These measures are essential not only for reducing emissions but also for spurring economic transformations that align with sustainable and resilient development goals.
Regional disparities in per-capita emissions and carbon intensity reductions remain subject to model-specific structural biases, particularly in representing renewable adoption rates and CCS feasibility (e.g., Brazil’s 61% vs. 79% carbon intensity decline in IMAGE vs. POLES). Aggregated national averages mask subnational inequalities, such as extreme socioeconomic emission gaps, while oversimplified sectoral dynamics understate feedback between urbanization, energy demand, and policy efficacy. Critical factors like biomass sustainability and geopolitical energy dependencies are inadequately quantified, potentially overestimating net-negative emission pathways.
The AIM, IMAGE, and POLES models differ in scope, temporal focus, and analytical strengths: AIM, a dynamic general equilibrium model, emphasizes short-term (annual) sectoral production and emission linkages with granular industrial and regional detail, making it ideal for tracking energy- and land-use-related pollutants. IMAGE, an integrated assessment framework, prioritizes long-term (up to 2100) human–environment interactions, evaluating cross-sectoral sustainability trade-offs and ecological feedback like resource depletion and climate impacts. In contrast, POLES, a partial equilibrium model, specializes in energy market dynamics, simulating price-driven technological transitions, carbon pricing impacts, and lagged supply–demand adjustments. No model is inherently superior: AIM suits short-term emission analyses, IMAGE excels in systemic long-term scenarios, and POLES is optimal for energy-specific policy testing, with the “best” choice depending on whether the goal is sectoral precision, holistic sustainability, or energy–market realism.
5. Conclusions
The analysis of CO2 emissions per capita across various global regions, utilizing the AIM, IMAGE, and POLES models, highlights significant disparities that persist under scenarios with no policy interventions as well as those aiming to limit warming to 1.5 °C. In 2005, the average annual per-capita CO2 emissions were recorded as 6.8 tons for Brazil, 4.8 tons for China, 8.4 tons for EU28, 1.2 tons for India, 10.1 tons for Japan, 9.0 tons for Russia, and 18.6 tons for the USA. These disparities are projected to continue into 2050, albeit with an overall trend toward lower emissions under the 1.5 °C warming limit scenario. Brazil, with its relatively clean energy structure relying heavily on hydropower, contrasts with countries like China and India, where coal remains a significant energy source despite efforts to diversify. The EU’s proactive regulatory environment and carbon trading system exemplify policy-driven approaches to reducing emissions, while the USA’s high consumerism and reliance on fossil fuels present substantial challenges to reducing per-capita emissions.
The transition towards carbon neutrality, as modeled, has profound implications for energy consumption patterns, economic outcomes, and carbon intensity across key sectors. The target of limiting warming to 1.5 °C requires a marked drop in carbon intensity, which would be decreases of 61%, 72%, 85%, 65%, 37%, and 71% by 2050 for Brazil, China, India, Japan, Russia, and the USA according to IMAGE, improving energy efficiency, and implementing carbon capture and storage technologies. However, the projected economic losses associated with this transition, totaling billions of dollars annually for major economies, highlight the economic challenges of shifting away from fossil fuels. The varying degrees of reliance on biomass and fossil carbon sequestration in these regions illustrate the diverse approaches to mitigating carbon emissions. Notably, the anticipated changes in final energy consumption across the electricity, residential, commercial, and transportation sectors by 2050 signify a move towards more sustainable energy practices.
Continued carbon mitigation efforts could lead to significant annual GDP losses by 2100, with Brazil losing USD 160.4 billion, China USD 1082.2 billion, EU28 USD 1494.8 billion, India USD 1898.4 billion, Japan USD 138.2 billion, Russia USD 859 billion, and the USA USD 958.7 billion. Additionally, carbon consumption losses could reach USD 25.4 billion for Brazil, USD 1811.1 billion for China, USD 1701.6 billion for EU28, and USD 2141.2 billion for India, with Japan, Russia, and the USA facing losses of USD 351.9 billion, USD 1026.6 billion, and USD 906.6 billion, respectively. Based on the AIM, POLES, and IMAGE models, the projected carbon prices for 2050 are estimated at USD 2000, USD 2045, and USD 940 per ton of CO2, measured in 2005 dollars, respectively.
For countries like Brazil, China, EU28, India, Japan, Russia, and the United States, significant reductions in the electricity component of their final energy consumption are forecasted. These reductions are expected to be 17%, 38%, 4%, 30%, 5%, 41%, and 1%, respectively, indicating a shift towards more efficient and renewable energy sources in electricity generation. Additionally, there is an anticipated substantial decrease in overall industry consumption by 60%, 50%, 27%, 73%, 12%, 20%, and 36%, respectively, in these regions. In the residential and commercial sectors, the projected reductions are 33%, 40%, 32%, 27%, 29%, 40%, and 32%, respectively. The transportation sector is also expected to undergo significant changes, with decreases in energy consumption projected at 61%, 62%, 48%, 62%, 48%, 46%, and 50%, respectively.


