Article

Disaster Resilience Assessment and Key Drivers of Resilience Evolution in Mountainous Cities Facing Geo-Disasters: A Case Study of Disaster-Prone Counties in Western Sichuan

1
School of Architecture and Civil Engineering, Xihua University, Chengdu 610039, China
2
College of Environment and Civil Engineering, Chengdu University of Technology, Chengdu 610059, China
*
Author to whom correspondence should be addressed.
Sustainability 2025, 17(8), 3291; https://doi.org/10.3390/su17083291
Submission received: 17 March 2025 / Revised: 30 March 2025 / Accepted: 7 April 2025 / Published: 8 April 2025
(This article belongs to the Section Sustainable Urban and Rural Development)

Abstract

:
With global population growth and accelerated technological innovation, human activities have expanded, leading to worsening ecological degradation and more frequent disasters, particularly in vulnerable and underdeveloped mountainous areas. Western Sichuan, predominantly consisting of mountainous cities, has unique geographical conditions that not only hinder socioeconomic development but also create an environment conducive to disaster occurrence. This study, therefore, investigates the disaster resilience of mountainous cities in western Sichuan. Using support vector machine (SVM), this study predicts geo-disaster risks. Shapley values from cooperative game theory are employed to optimize three evaluation methods, TOPSIS, Grey Relational Analysis (GRA), and Rank Sum Ratio (RSR), to calculate social resilience values. Finally, disaster resilience values are determined by integrating geo-disaster risk with socioeconomic resilience. Kernel density estimation and GeoDetector are then used to analyze the disaster resilience values. The findings reveal that (1) the disaster resilience of mountainous cities is generally improving, with a gradual decrease in the number of cities with low resilience, though the overall level remains low; (2) resilience disparities among cities are evident, showing an “east-high, west-low” distribution, primarily due to the eastern region’s proximity to developed cities and the socioeconomic support it has received; (3) the proliferation of information technology and the development of tourism are key drivers of resilience development, while human activities exacerbate geo-disaster risks; (4) the enhancement of disaster resilience is more dependent on the interaction of multiple driving factors than on any single factor. This study, aligned with the United Nations Sustainable Development Goals (SDG3, SDG4, SDG8, SDG9, SDG11, and SDG15), offers recommendations for disaster resilience development and provides theoretical support for policy formulation in mountainous cities.

1. Introduction

Natural hazards are typically driven by multiple factors, exhibiting high levels of complexity and uncertainty [1]. Globally, rapid population growth and accelerating technological advancements have led to an unprecedented expansion of human activity, exacerbating environmental pollution and inflicting damage on natural ecosystems that cannot be readily restored in the short term [2,3]. Such environmental degradation has not only contributed to an increase in extreme weather events [4,5,6] but has also escalated both the frequency and magnitude of natural hazards [7]. According to statistics, disasters push approximately 26 million people into poverty annually [8], posing a severe threat to sustainable human development and hindering socioeconomic and cultural progress. Prominent examples include the 2008 Wenchuan Earthquake [9], the 2010 Zhouqu Debris Flow [10], the 2011 Great East Japan Earthquake [11], and the 2022 floods in southern China [12]. These catastrophic events have had profound material and psychological impacts on affected populations.
Notably, natural hazards in specific regions often occur as multi-hazard events rather than isolated incidents [13], and only a few areas are exclusively affected by a single disaster type. Moreover, underdeveloped regions tend to be more vulnerable to these risk events [14]. China, with its vast territory and one of the most diverse geographical and climatic landscapes in the world [15,16], reports the highest number of natural disaster occurrences globally [17]. Between 2018 and 2022, China recorded approximately 631 million people affected by disasters, with direct economic losses amounting to CNY 1.53437 trillion [18]. Among China’s 34 provincial-level regions, Sichuan Province bears a disproportionately high burden, accounting for approximately 6.8% of the affected population and 10.88% of the direct economic losses nationwide. As one of the most disaster-prone provinces in China, Sichuan is predominantly mountainous, encompassing terrains such as mountains, hills, and rugged plateaus. The unique geographical environment of mountainous cities renders them susceptible to distinct disaster-inducing factors compared to cities located in plains or basins, with significantly more complex risk dynamics. Additionally, in most developing countries, mountainous cities lag behind their lowland counterparts in socioeconomic development, exacerbating the adverse impacts of disasters on local communities [19]. Given these challenges, there is an urgent need to conduct in-depth research on disaster risk mitigation strategies tailored to mountainous cities under multi-hazard conditions.
Early research predominantly emphasized disaster prediction and real-time response as the core focus of disaster prevention and mitigation efforts [20]. However, given the current limitations in precisely and reliably forecasting natural hazards, the focus should gradually shift toward enhancing city disaster resilience and reducing vulnerability [21]. Resilience endows systems with the ability to recover and continuously adapt under conditions of uncertainty, thereby enabling effective responses to unforeseen changes and challenges. Disaster resilience has been defined as the capacity of individuals or organizations to implement timely response measures in the face of risks, thereby minimizing losses and facilitating rapid adaptation and recovery [17,22]. A comprehensive analysis of regional disaster resilience dynamics is essential for formulating proactive strategies to effectively mitigate disaster risks [23]. Lu et al. [24] examined cities across the Yangtze River Delta in China and identified social resilience as a critical determinant of overall disaster resilience. Similarly, Zhao et al. [25] investigated the spatiotemporal evolution of disaster losses in Shanghai, providing insights for the development of a robust disaster resilience framework. Woodall et al. [23] conducted a comparative study of disaster resilience across developed countries, concluding that proactive adaptation measures are more effective in strengthening resilience than reactive approaches. However, existing studies predominantly focus on the national, provincial, or municipal levels in economically, educationally, and culturally advanced regions. Consequently, resilience assessment frameworks are often constructed around socioeconomic, demographic, and other social dimensions while overlooking critical environmental factors, rendering their findings of limited applicability to mountainous cities. Moreover, research on disaster resilience in developed regions has advanced rapidly, extending beyond regional-scale assessments to examine resilience at the individual, community, and infrastructure levels [26,27]. Mabrouk et al. [28] highlighted the importance of nature-based disaster response strategies in enhancing city resilience. Building on this, Liang et al. [29] proposed that strengthening the integration and interaction of blue, green, and gray infrastructure can not only improve urban flood resilience but also enhance public disaster preparedness. These studies offer valuable recommendations for disaster resilience in major metropolitan areas [30], which, in turn, exhibit stronger resilience compared to remote regions [31].
Extensive literature has explored disaster risks in remote mountainous regions, primarily employing classification and recognition algorithms in machine learning for disaster susceptibility analysis [32,33,34,35] and investigations into disaster-inducing mechanisms [36,37,38]. However, these studies predominantly focus on natural characteristics while often neglecting the critical role of socioeconomic factors in disaster response. In reality, the fundamental challenge to human safety and economic stability is not the disaster itself but the resilience and vulnerability of exposed populations. In mountainous regions, the population distribution is more concentrated than in lowland areas, and strong place attachment often deters residents from relocating, even when facing high disaster risks [39]. Additionally, these regions tend to have a higher proportion of vulnerable populations, making post-disaster recovery significantly more challenging [40].
Recognizing this, numerous scholars have begun to study the capacity of mountainous societies to respond to disasters. Li et al. [41] conducted a survey of rural households in mountainous regions and found that approximately 30% of households exhibited a high vulnerability to disasters. Ochir et al. [42] focused on nomadic communities in high-altitude regions, revealing that climate change has significantly weakened their traditional disaster mitigation skills, reducing their ability to cope with disasters and thereby exacerbating their vulnerability. Existing research on disaster resilience primarily emphasizes socioeconomic characteristics [41,42] and spatial dimensions [43], while often overlooking temporal dynamics and the integration of historical disaster data into analytical frameworks. Regarding infrastructure, mountainous areas lack the systemic connectivity found in major metropolitan regions. Large cities benefit from highly integrated internal systems that enable rapid resource allocation and service coordination in crises [28]. In contrast, mountainous areas suffer from weak infrastructural connectivity and limited access to disaster management resources [44], leading to significant delays in response capabilities and increased vulnerability to disasters. Therefore, investigating disaster resilience in mountainous cities and identifying its key driving factors are of paramount importance.
In summary, in terms of the research framework, there remains a significant gap between studies on city resilience and geological hazard risk, as these two aspects are often treated as independent research subjects. However, geological hazard risk inherently undermines resilience, and under the same socioeconomic development conditions, lower hazard risk contributes to enhancing city disaster resilience [23]. Therefore, incorporating hazard risk factors into resilience studies is crucial, as it not only enables a more accurate assessment of city resilience levels but also ensures that the research findings better reflect real-world conditions. At the methodological level, most scholars commonly employ the entropy weight method to determine indicator weights in resilience assessment [24,25,29]. This study also adopts this approach, primarily due to the advantages of the entropy weight method in objective weighting. Furthermore, compared to directly weighting the normalized indices, multi-criteria decision-making (MCDM) methods that incorporate weighted calculations demonstrate superior performance in quantifying disaster resilience [
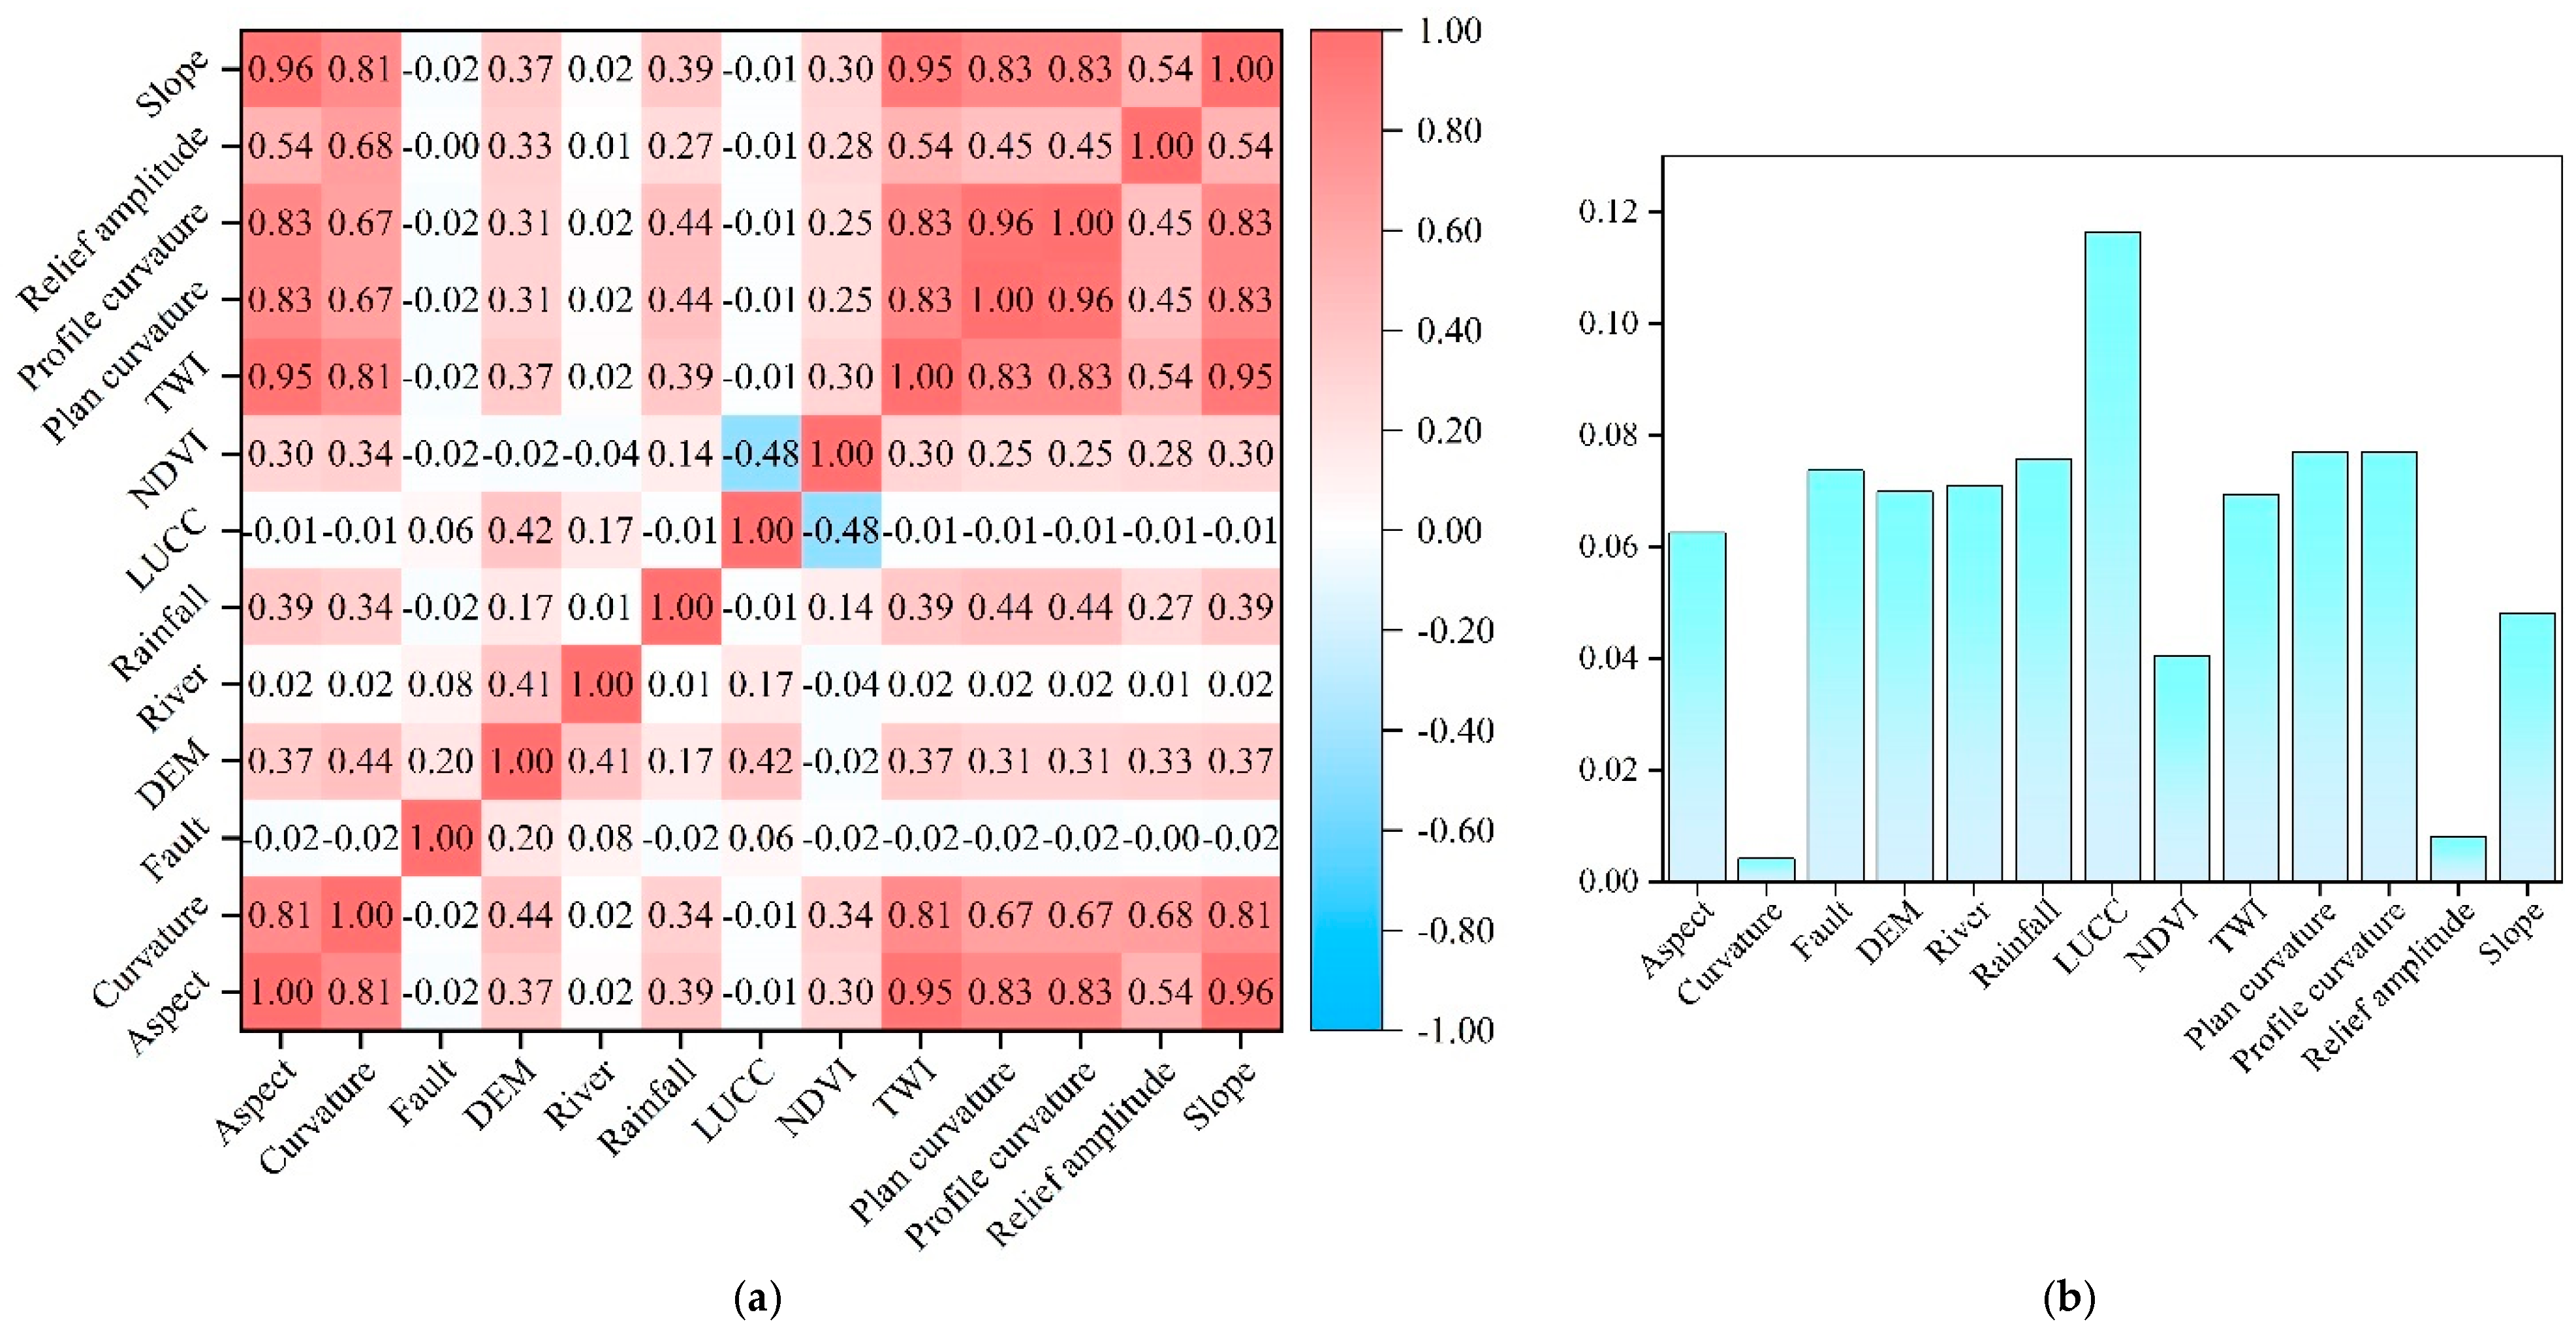
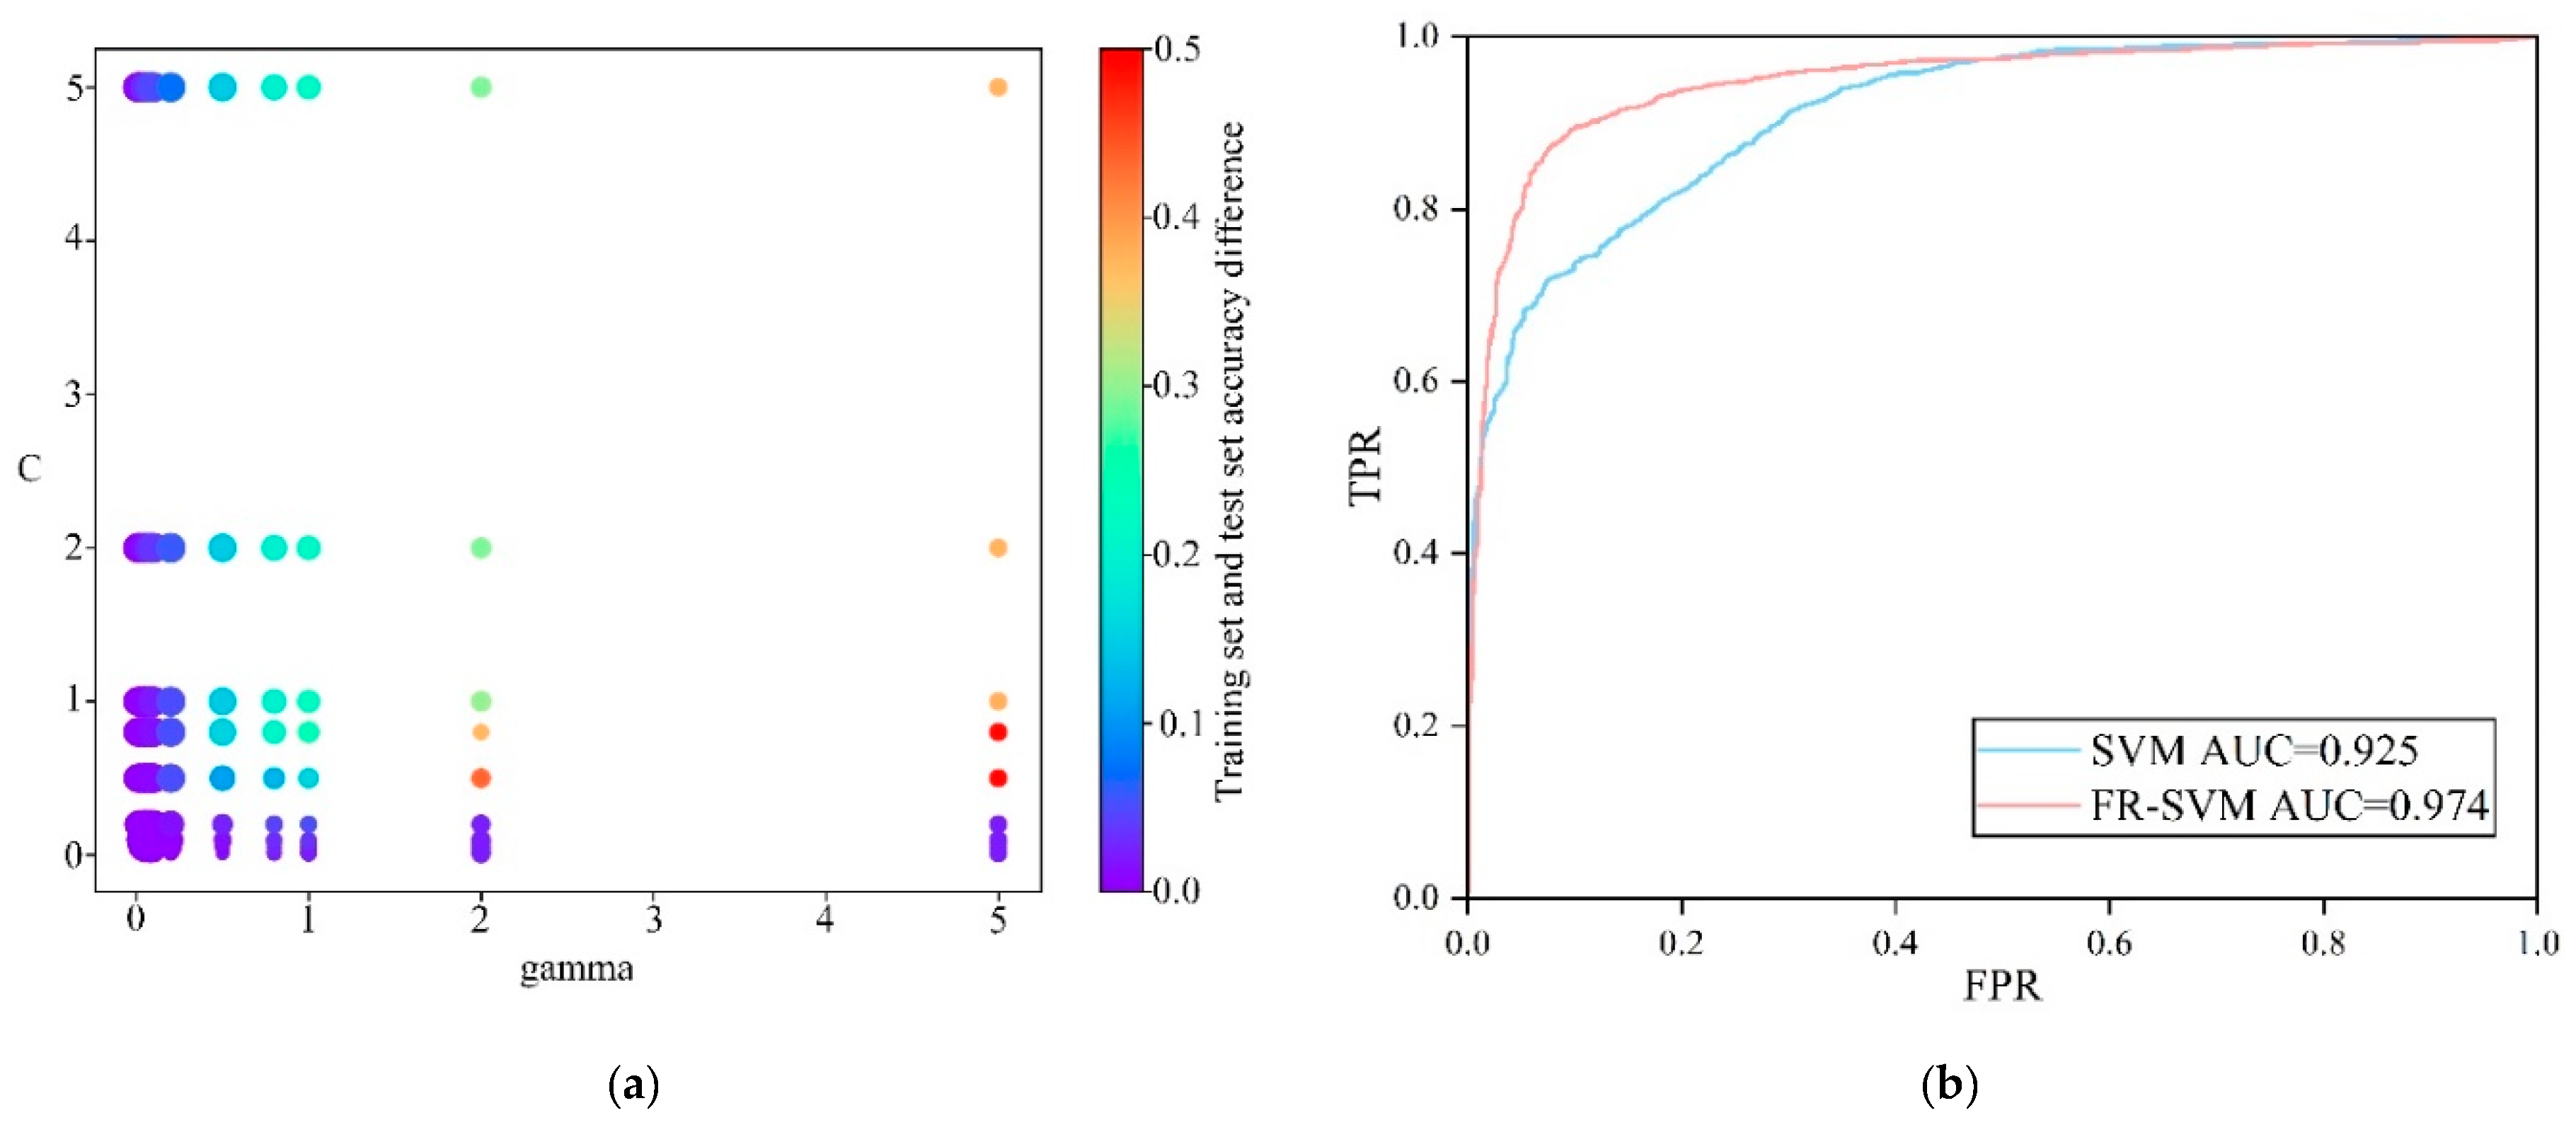
28]. However, different MCDM methods exhibit certain limitations when handling multi-objective computations and comparisons. To address this issue, this study considers multiple evaluation methods as cooperative players within a game-theoretic framework and introduces the Shapley value from cooperative game theory to optimize the results. This integration leverages the strengths of different methods, thereby enhancing the scientific rigor and accuracy of the assessment. Meanwhile, for disaster risk assessment, this study employs the support vector machine (SVM) algorithm for risk classification. This choice is primarily based on the comparative study by Huang et al. [45], which evaluated the classification speed and accuracy of three machine learning methods—random forest (RF), support vector machine (SVM), and decision tree (DT). The results indicated that SVM outperformed the other methods in both classification speed and accuracy. Therefore, SVM is prioritized in this study to ensure the precision and reliability of geological hazard risk identification.
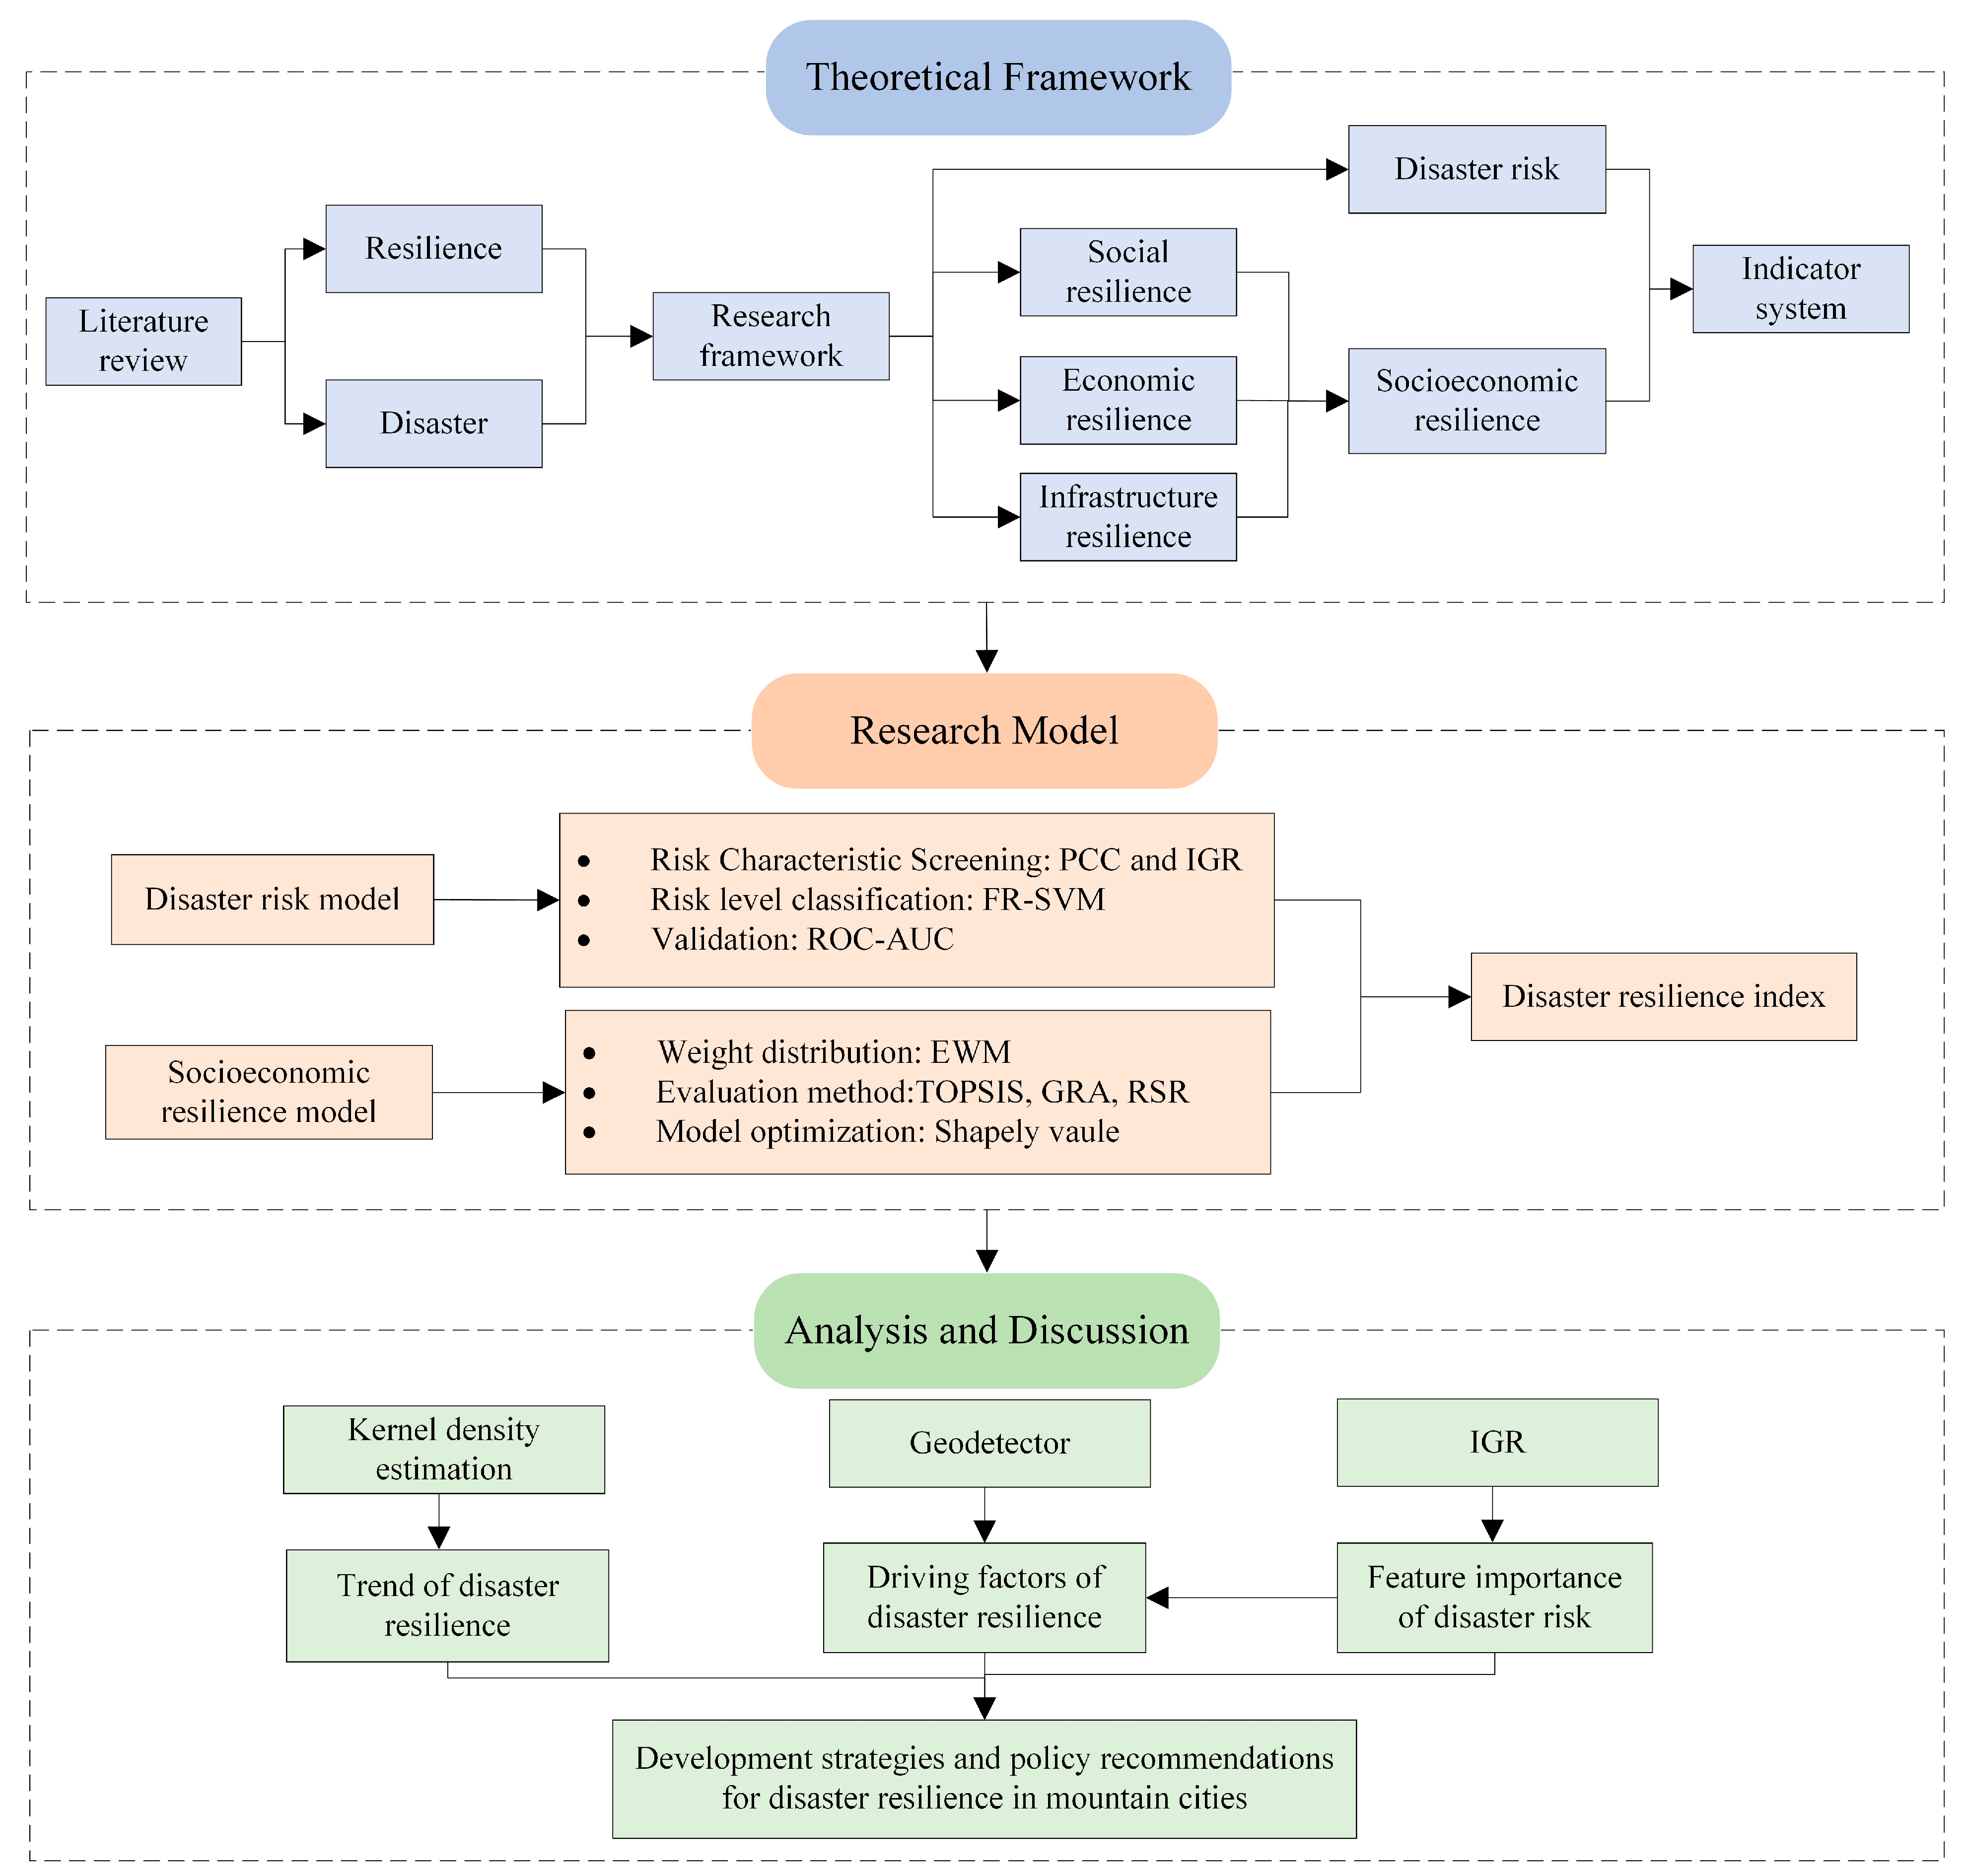
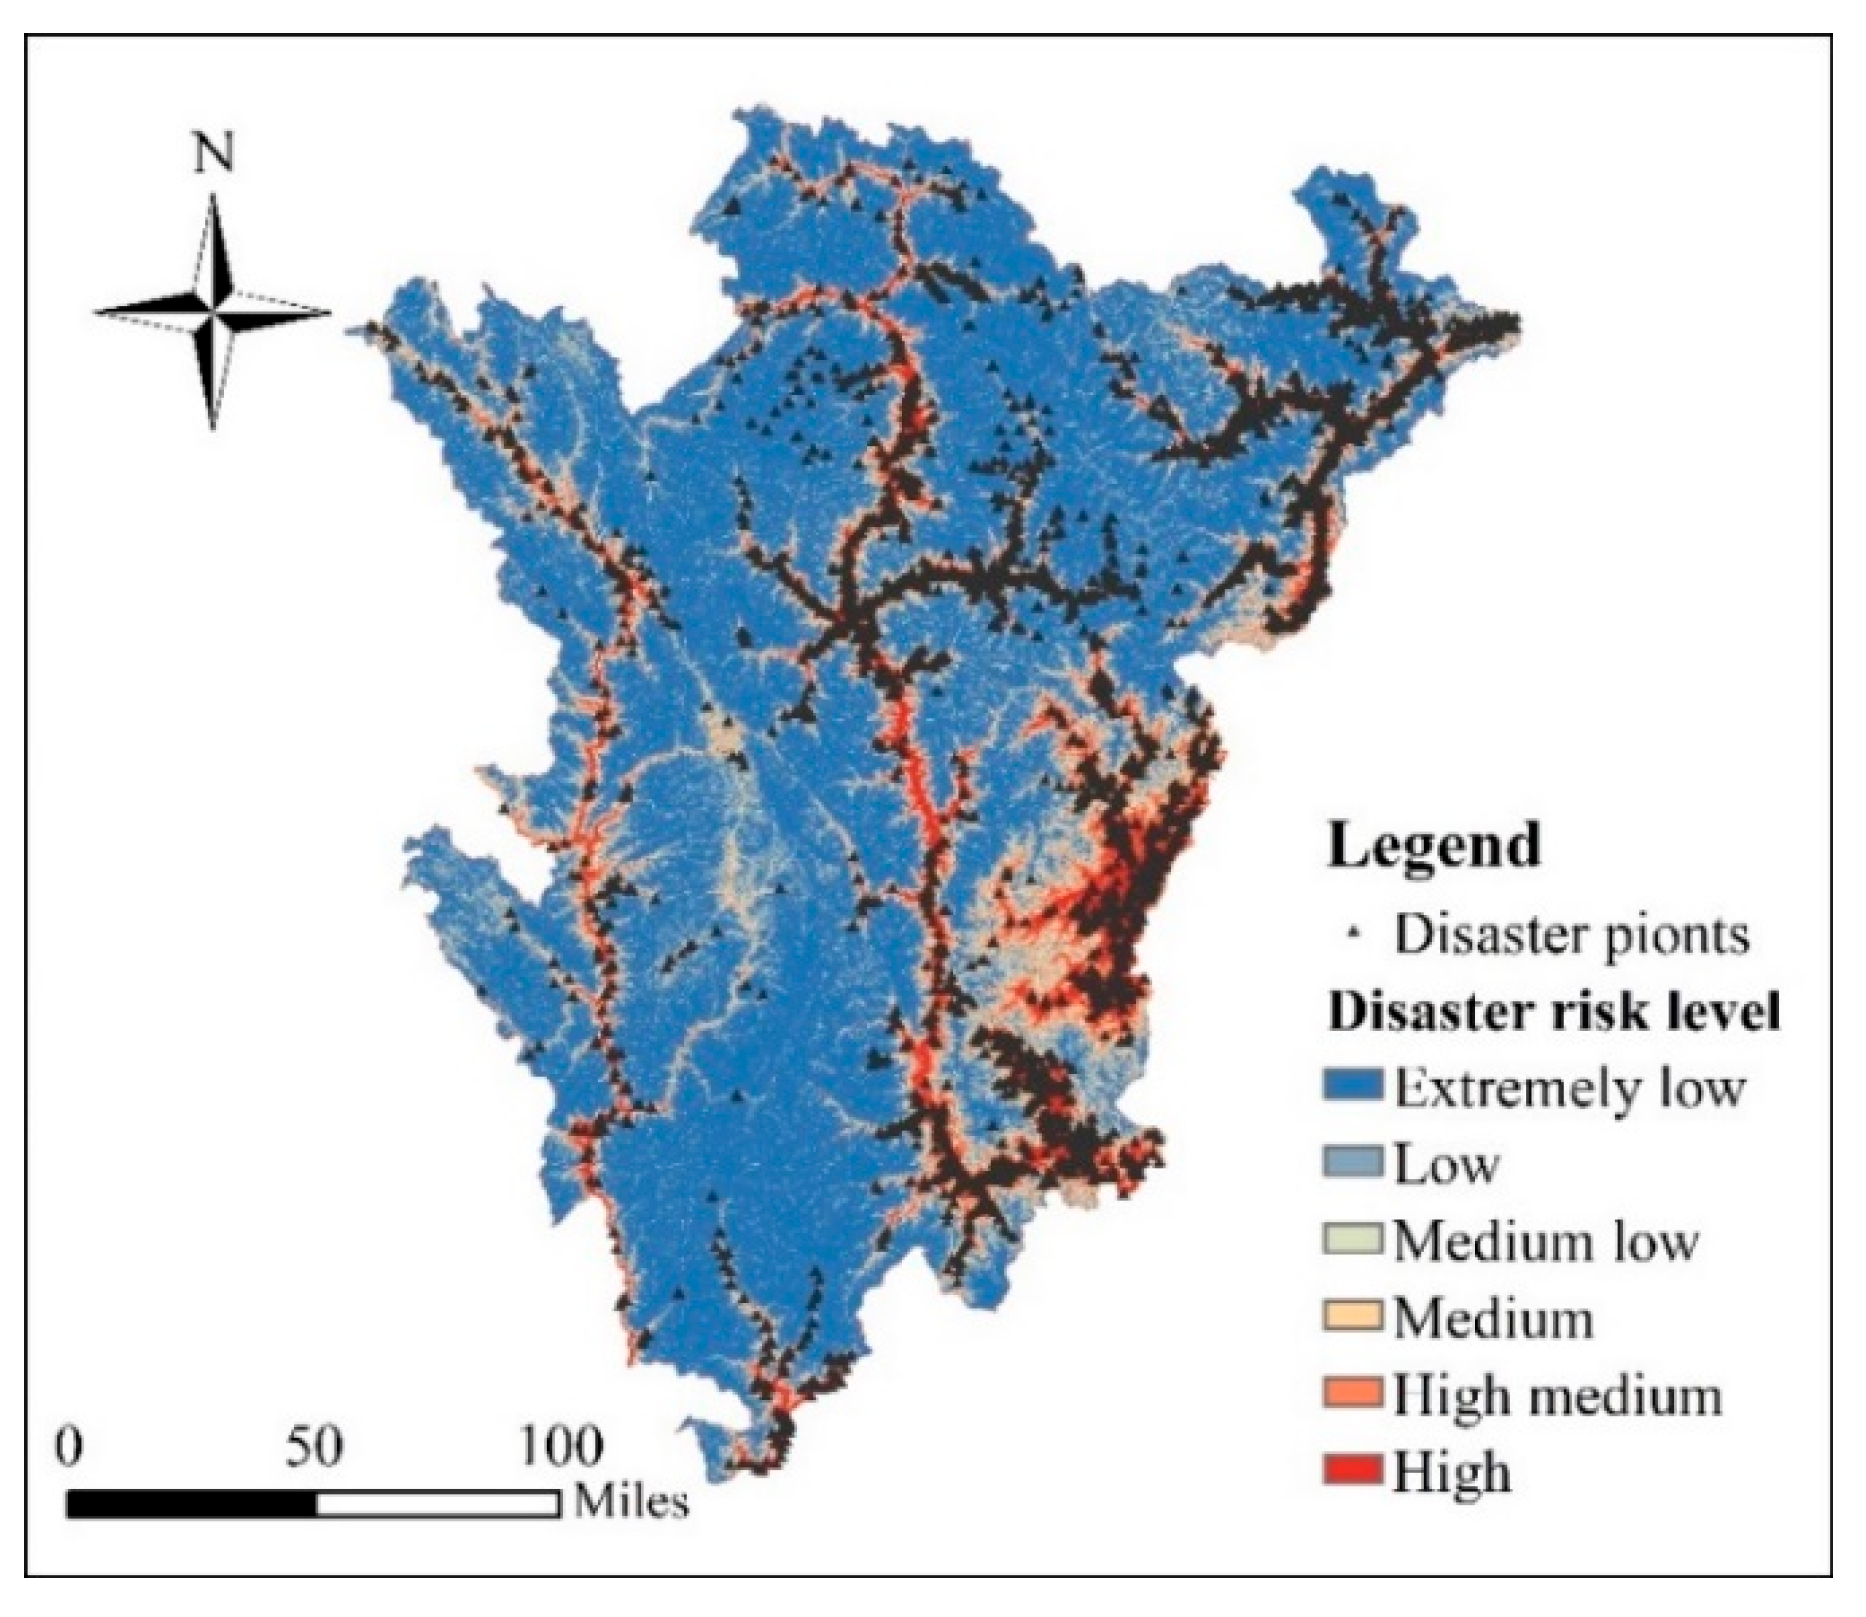
The research process is illustrated in Figure 1 and consists of the following key steps: (1) Developing a comprehensive disaster resilience framework, dividing it into two components: geo-disaster risk and socioeconomic resilience. (2) Identifying risk features through PCC and IGR to determine relevance and risk contribution, followed by constructing a geo-disaster risk classification model based on the FR-SVM method, with model performance validated via ROC-AUC analysis. (3) Assessing socioeconomic resilience by computing indicator weights using the entropy weight method, evaluating resilience scores through TOPSIS, GRA, and RSR approaches, and optimizing the results using the Shapley value from cooperative game theory to integrate the advantages of multiple evaluation methods. (4) Overlaying geo-disaster risk classification maps with socioeconomic resilience spatial distributions in a GIS system to analyze the spatial patterns of disaster resilience. (5) Employing the Geodetector method to identify key driving factors of disaster resilience, followed by a comprehensive discussion to inform disaster resilience development strategies and policy recommendations for mountainous cities.
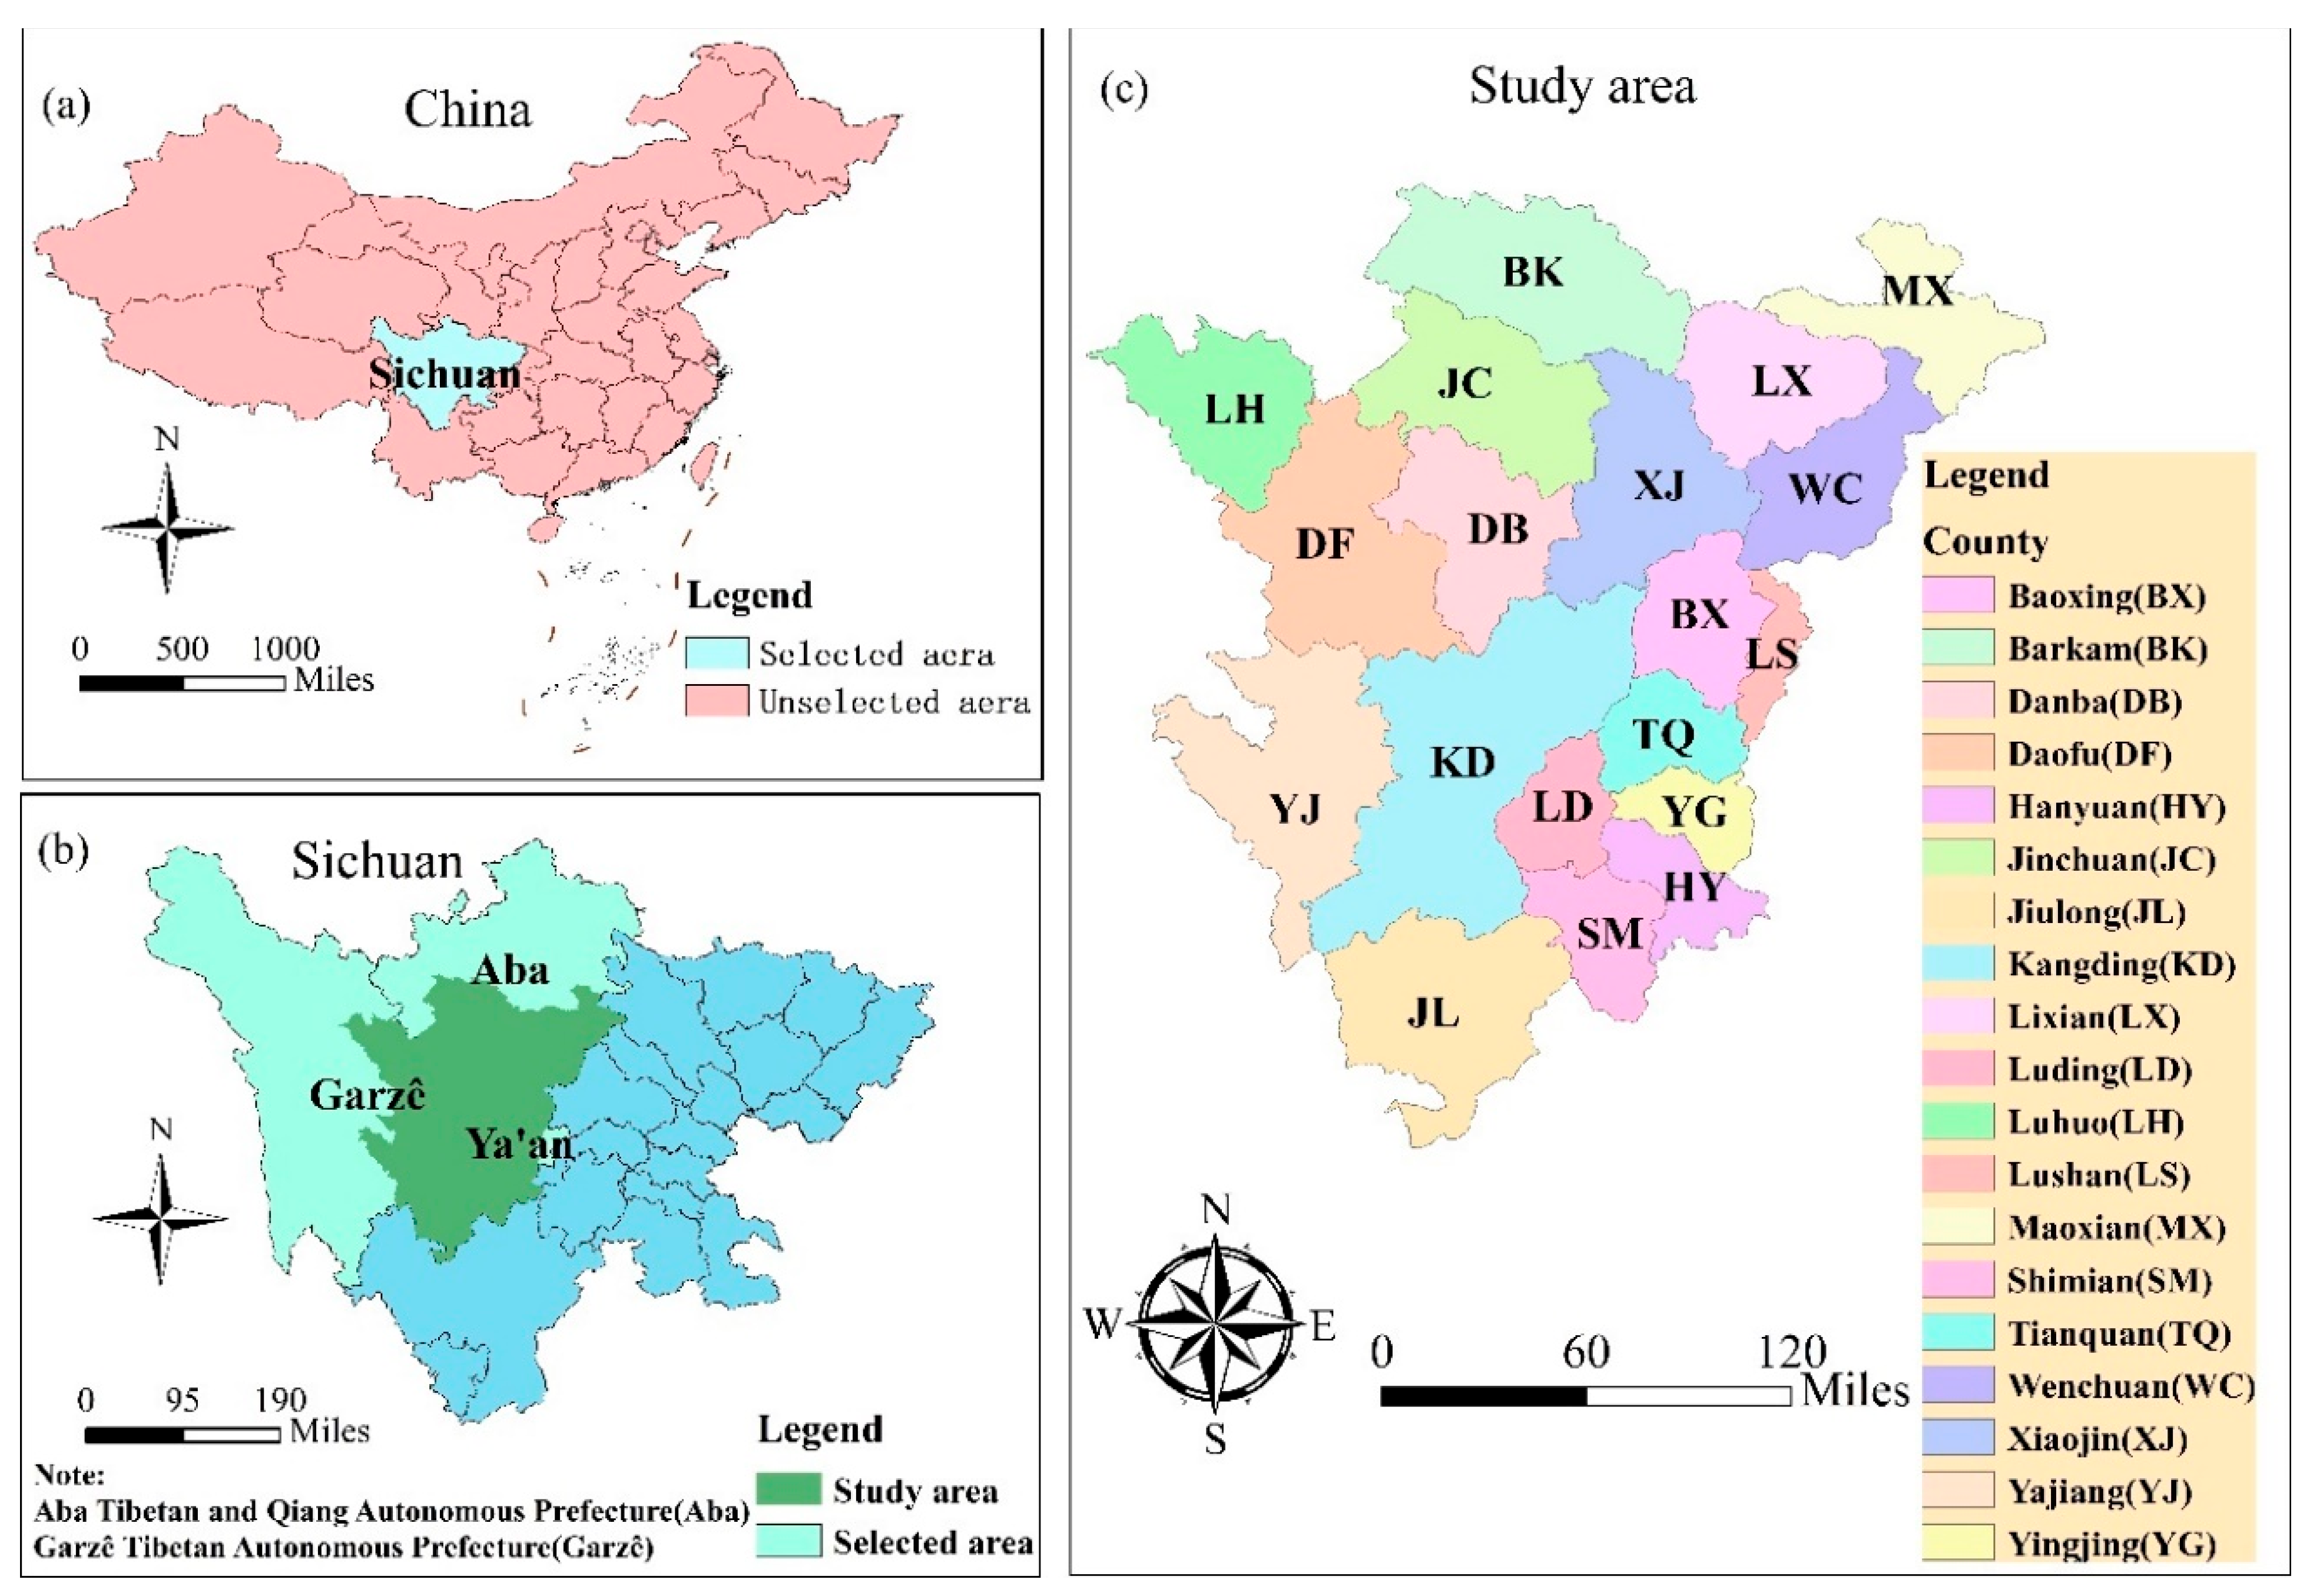
2. Study Area

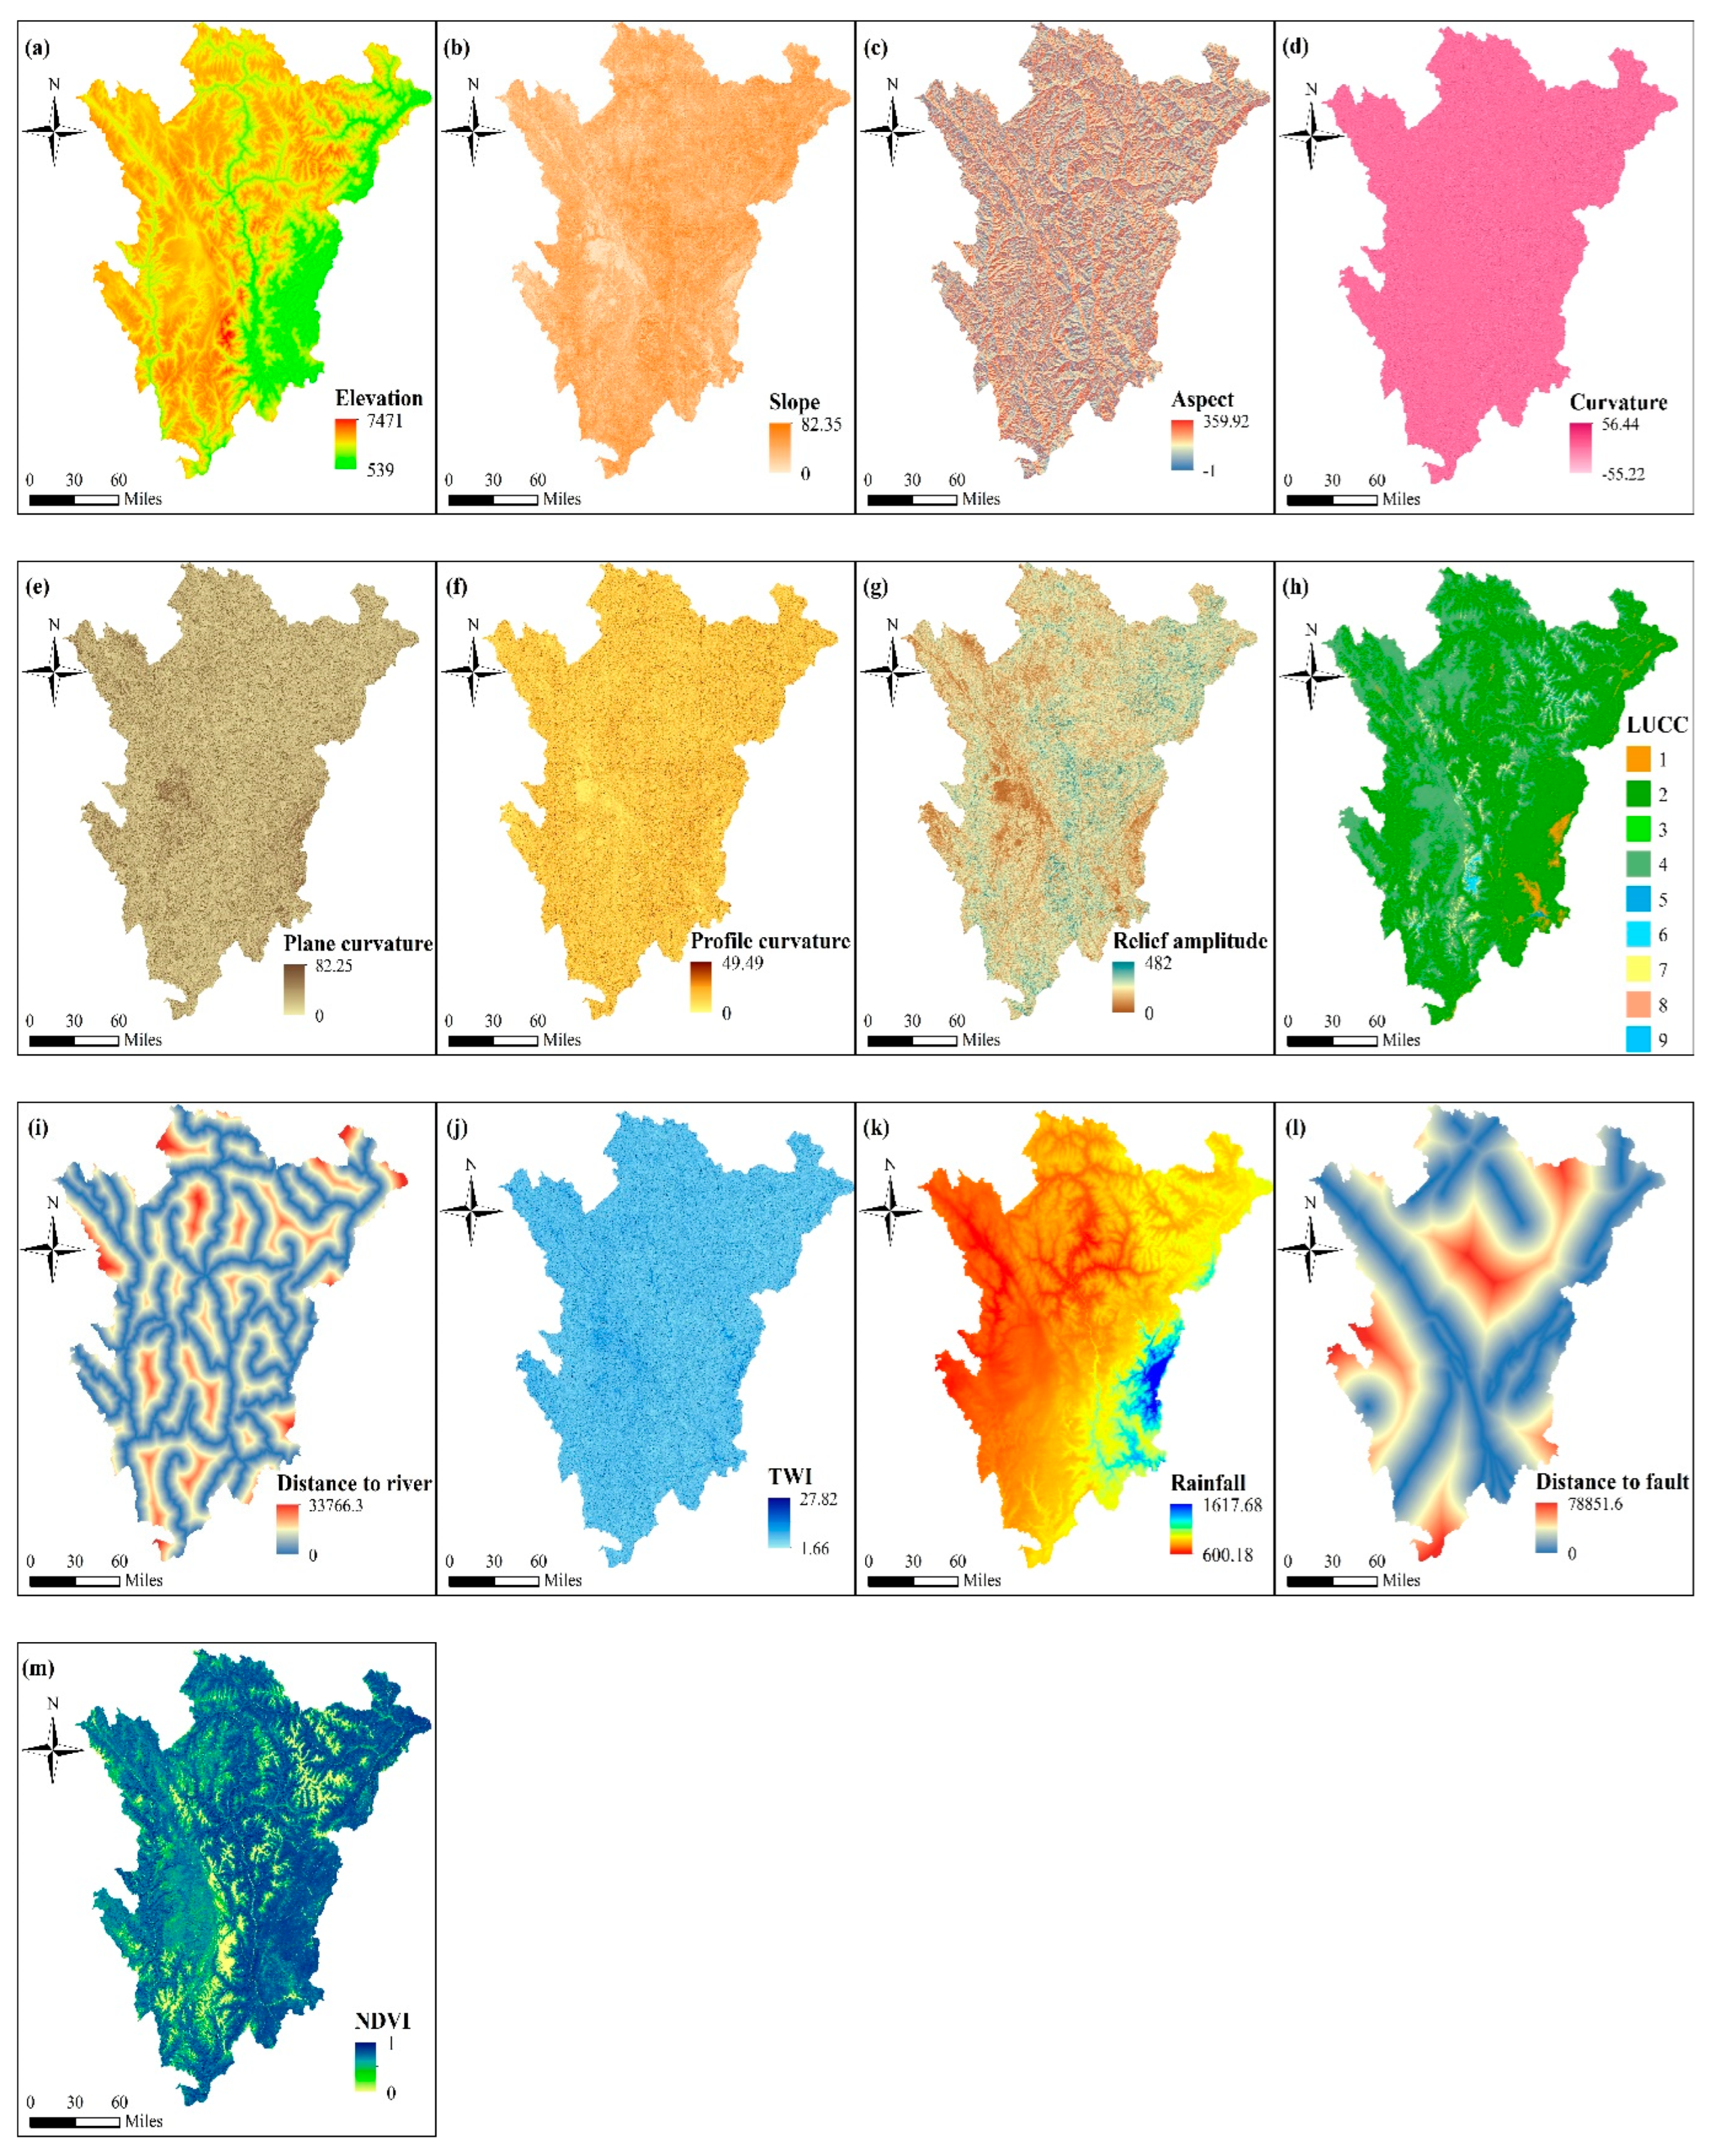
Geological disasters constitute the predominant hazard type in Sichuan Province, with the region ranking among the highest in China in terms of mountain-related disasters [46]. Located in western Sichuan, the prefectures of Garzê, Aba, and Ya’an exhibit complex and diverse topographical features, characterized by extensive mountainous terrain, significant elevation variations, and a high density of active fault zones. Collectively, these three administrative divisions encompass 39 county-level jurisdictions. Given the challenges associated with obtaining research data from remote mountainous areas, this study focuses on 19 selected counties, as illustrated in Figure 2. These selected regions are representative of other mountainous cities in terms of geographical conditions, disaster characteristics, and socioeconomic attributes. The selection rationale is as follows:
First, Garzê is situated at the intersection of the Hengduan Mountains and the Qinghai–Tibet Plateau. It is home to prominent mountain ranges such as Gongga Mountain and Zheduo Mountain, with its northern region forming part of the Qinghai–Tibet Plateau, characterized by vast and elevated terrain. Furthermore, major rivers—including the Dadu River, Yalong River, and Jinsha River—flow through Garzê, sculpting deep-cut gorge landforms. Aba, located at the eastern margin of the Qinghai–Tibet Plateau, is dominated by the Minshan and Qionglai mountain ranges, which create a classic alpine landscape, while rivers such as the Min River and Zagunao River contribute to the distinct valley topography. Ya’an, positioned at the transition zone between the Sichuan Basin and the Qinghai–Tibet Plateau, features steep mountain ranges, including the Daxiangling and Jiajin Mountains, alongside prominent river valleys formed by the Dadu and Qingyi Rivers. However, its eastern region consists of low hills and a rolling terrain, exhibiting a a relatively gentler topography. The 19 study areas encompass these diverse landforms, thereby allowing for a comprehensive investigation of disaster resilience across various natural environments. Given this geographical diversity, the findings of this study hold significant reference value for research on disaster resilience in other mountainous cities.
Second, the geological conditions of western Sichuan create a highly conducive environment for disaster occurrence, making Garzê, Aba, and Ya’an among the most disaster-prone regions in Sichuan Province [44]. Collectively, the 19 selected county-level administrative units account for approximately 70% of all disaster events within these three prefectures, as shown in Figure A1. The frequent occurrence of natural hazards not only poses severe threats to local residents’ lives and livelihoods but also exerts profound negative impacts on the regional socioeconomic structure. These realities further underscore the urgent need for research and intervention in disaster resilience within these areas.

3. Methods

3.1. Geo-Disaster Risk Assessment Model

The geo-disaster risk assessment was conducted based on historical disaster occurrences, incorporating multiple risk factors such as topography, geomorphology, natural environment, and geological–hydrological conditions to evaluate risk levels and classify hazard severity. The specific risk factor data utilized in this analysis are presented in Figure 3. Data sources include the Resource and Environment Science and Data Center of the Chinese Academy of Sciences (http://www.resdc.cn), the Geospatial Data Cloud (https://www.gscloud.cn), NASA [47], and the EM-DAT database [48].

3.1.1. Pearson Correlation Coefficient and Information Gain Ratio

To enhance the accuracy of geo-disaster risk classification and reduce computational pressure in machine learning algorithms, this study employs the Pearson Correlation Coefficient (PCC) and Information Gain Ratio (IGR) to evaluate the correlation and importance of 13 geo-disaster risk analysis features. The results guide the selection of risk factors for further analysis.
PCC quantifies the linear relationship between two risk factors, with absolute values closer to 1 indicating stronger correlations. PCC values range from [−1, 1], and its mathematical formulation is given in Equation (1):
r = ( x x ¯ ) ( y y ¯ ) ( x x ¯ ) 2 ( y y ¯ ) 2 = l x y l x x × l y y
where lxx represents the sum of squared deviations of x from its mean, lyy denotes the sum of squared deviations of y from its mean, and lxy is the sum of the product of deviations of x and y. The terms lxx and lyy reflect the variability of individual features, while lxy captures their co-variability.
The IGR quantifies the contribution of different features to disaster occurrence by measuring their relative importance. First, the Information Gain IG(D, Ai) is computed, representing the reduction in entropy of dataset D when split based on feature Ai. Next, the Split Information SI(D, Ai) is determined, which measures the entropy introduced by the partitioning of D using Ai, reflecting the inherent dispersion of the feature. Finally, the IGR is obtained by normalizing Information Gain with Split Information, as shown in Equation (2):
I G R ( D , A i ) = I G ( D , A i ) S I ( D , A i )

3.1.2. Frequency Ratio—Support Vector Machine

In geo-disaster risk classification, when randomly generating non-disaster sample points, a two-step approach is adopted: first, high-risk areas are preliminarily screened using the Frequency Ratio (FR) method, followed by geo-disaster risk classification employing the Support Vector Machine (SVM) algorithm. The FR method is an effective technique for assessing the distribution characteristics of disaster-related grid cells within specific factor classification intervals. Specifically, it quantifies the proportion of disaster grid cells within a given classification interval relative to the total number of disaster grid cells, compared to the proportion of grid cells within that classification interval relative to the total number of grid cells in the study area. When generating non-disaster sample points, the FR method is leveraged to prioritize the exclusion of high-risk areas, thereby enhancing the classification accuracy of the algorithm. The calculation formula is expressed as follows:
F R = N i j / D T i j / T
In the equation, Dij denotes the number of disaster grid cells in category j of risk factor i. D represents the total number of disaster grid cells across the study area. Tij refers to the total number of grid cells in category j of risk factor i. T signifies the total number of grid cells within the study area.
SVM is a machine learning method widely used for classification tasks, particularly effective in handling nonlinearly separable data. In this study, the SVM algorithm was implemented using Python 3.12.0. By incorporating the Gaussian kernel function (Radial Basis Function, RBF kernel), SVM maps data that are not linearly separable in a low-dimensional space into a higher-dimensional feature space, where they become linearly separable. This capability has led to its extensive application in risk classification and prediction. To evaluate the performance of SVM in risk classification, the dataset was divided into a training set and a test set in a 7:3 ratio. Additionally, this study employed the Receiver Operating Characteristic (ROC) curve and the Area Under the Curve (AUC) value as evaluation metrics to effectively assess the classification performance of the model.

3.2. Socioeconomic Resilience Assessment Model

The assessment of socioeconomic resilience covers three key dimensions: social, economic, and infrastructure resilience. Infrastructure resilience is included because it consists of the assets, networks, and systems that provide essential services for social and economic activities, such as energy, water, electricity, transportation, and communication. The data span from 2018 to 2022. Social resilience is evaluated based on indicators related to social security, vulnerable populations, and social development, while economic resilience is assessed through measures of economic vitality, economic structure, and the extent of government and industrial support. Infrastructure resilience is determined by examining road and transportation networks, water supply and drainage systems, healthcare facilities, and construction capacity. The indicator weights are shown in Table 1, and the specific selection reasons are detailed in Table A2. The data for this section were sourced from the China Urban Construction Statistical Yearbook, China County Construction Statistical Yearbook, China County Statistical Yearbook, Aba Statistical Yearbook, Garzê Statistical Yearbook, and Ya’an Statistical Yearbook, as well as national economic and social development statistical reports published on the official websites of county governments.

3.2.1. Data Processing and Weight Determination

To eliminate the influence of different measurement units, the data were normalized using Equation (4), ensuring all values fall within the range of [0, 1]. The specific normalization formula is as follows:
z i j = f i j min ( f i j ) max ( f i j ) min ( f i j ) ,   f o r   p o s i t i v e   i n d i c a t o r s z i j = max ( f i j ) f i j max ( f i j ) min ( f i j ) ,   f o r   n e g a t i v e   i n d i c a t o r s
where fij represents the original matrix, and zij denotes the normalized matrix.
The entropy weight method is based on the theory of information entropy and measures the relative importance of indicators in decision-making by analyzing the distribution of information across the indicators. First, based on the normalized data, the weight of each indicator is calculated using Equation (5). Then, applying the entropy theory, the information entropy of each indicator is computed using Equation (6), and the indicator’s weight is determined based on the entropy value using Equation (7). Finally, the calculated weights are applied to the normalized matrix through Equation (8).
P i j = z i j i = 1 n z i j , ( j = 1 , 2 , , m )
E j = i = 1 n P i j ln P i j ln n , ( j = 1 , 2 , , m )
w j = 1 E j j = 1 m ( 1 E j )
x i j = w j × z i j
In this context, Pij represents the proportion of the normalized value for city i under indicator j, Ej refers to the information entropy, and xij denotes the weighted normalized matrix.

3.2.2. Evaluation Method

Given that each evaluation method has its own unique characteristics, this study employs methods such as TOPSIS (Technique for Order of Preference by Similarity to Ideal Solution), GRA (Grey Relational Analysis), and RSR (Rank Sum Ratio) to calculate socioeconomic resilience. The calculated values from each method are treated as independent game players, allowing for analysis from the perspective of cooperative game theory. The specific formulas, as well as the advantages and disadvantages, are presented in Table 2.

3.2.3. The Optimization of Evaluation Based on Cooperative Game Theory

Based on cooperative game theory, the Shapley value is computed to integrate and optimize the numerical outcomes obtained by different game participants. In evaluating the overall benefits of cooperative processes, the Shapley value not only accounts for the independence of each participant and the collective benefits of collaboration but also facilitates a fair distribution of weights among multiple decision-making methods, such as TOPSIS, GRA, and RSR. By effectively quantifying their marginal contributions, the Shapley value prevents any single method from disproportionately influencing the decision-making process. Moreover, it identifies interactions among methods, mitigates biases introduced by individual approaches, and enhances the robustness and adaptability of decision-making. Its interpretable weight allocation mechanism improves transparency and optimizes the integration of multiple methodologies, thereby ensuring the scientific rigor, reliability, and fairness of resilience assessments across various dimensions. The specific combination of game participants and the determination of the comprehensive evaluation values are presented in Table A2.
Once the comprehensive evaluation values are determined, the marginal contribution of each method can be calculated using Formula (15), and the Shapley value for each method can be further obtained using Formula (16). The specific formulas are as follows:
Δ v m ( S ) = v ( S { m } ) v ( S )
ϕ m = S N / { m } | S | ! ( n | S | 1 ) ! n ! Δ v m ( S )
In the formulas, v(S ∪ {m}) represents the payoff of the subset S ∪ {m}, which is the payoff after adding method m, where m refers to TOPSIS, GRA, and RSR. v(S) denotes the payoff of subset S; S ⊆ N/{m} represents all subsets that do not include method m; |S| is the number of methods in subset S; and n denotes the total number of methods.
Based on the importance index calculated from the Shapley values of each method, as shown in Formula (17), the optimized socioeconomic resilience value can then be derived using Formula (18).
w m = ϕ m ϕ m
V i = w T O P S I S × T O P S I S i + w G R A × G R A i + w R S R × R S R i
Finally, the socioeconomic resilience value data are imported into ArcGIS, and layer overlay is performed with the generated geo-disaster risk map using Formula (19). This results in the creation of a disaster resilience distribution map along with the specific indices.
D R i = S i D i
In the formula, Si represents the socioeconomic resilience value for city i; Di refers to the corresponding city’s geo-disaster risk raster data; and DRi is the disaster resilience for city i.

3.3. GeoDetector

GeoDetector is a statistical method for analyzing spatial data, aiming to uncover spatial relationships and influence mechanisms between geographical variables, using univariate and bivariate interaction detection [52]. Based on spatial distribution models, it quantifies the explanatory power of independent variables on the spatial variation of dependent variables, with the core statistic, q-value, reflecting the strength of their association, as shown in Formula (20). GeoDetector can handle spatial variance decomposition and multiple independent variables, without requiring normality assumptions. It is effective for exploring nonlinear relationships and identifying key drivers in complex geographical phenomena. In this study, after performing k-means classification in SPSS Statistics 27, GeoDetector is used to analyze the driving factors of disaster resilience, examining their independent effects and potential interactions in enhancing or weakening resilience. This approach reveals the hierarchical heterogeneity of disaster resilience across different temporal and spatial contexts.
q = 1 h = 1 L N h σ h 2 N σ 2
In the formula, h represents the partition of variables or factors; Nh and N are the number of units in the specific region and the entire region, respectively; σ2h and σ2 denote the variance of Y values within the specific region and the whole region. The q-value ranges from 0 to 1, with higher values indicating more significant spatial differentiation of Y. If the stratification is caused by the independent variable X, a larger q-value implies that X has a stronger explanatory power for Y, while a smaller q-value indicates weaker explanatory power.

4. Results

4.1. Geo-Disaster Risk Classification Results

The correlation and relative importance of each risk characteristic were calculated using PCC and IGR, with the specific results presented in Figure 4. As shown in the correlation heatmap in Figure 5a, significant correlations were observed between the slope, aspect, and curvature in the mountainous regions of western Sichuan. Additionally, a strong correlation was found between the planar curvature and profile curvature, as well as between the TWI and these two sets of features. In Figure 5b, the results indicate that aspect has a significantly higher importance than slope and curvature, while the importance of the planar curvature and profile curvature is nearly identical, with both being higher than the TWI. Based on the dual analysis of the correlation and importance, the slope, curvature, TWI, and planar curvature were excluded to reduce redundancy and computational complexity in the model.
The model was trained based on the selected risk features, and the optimal parameter combination (gamma = 0.08, C = 5, AUC = 0.974) was determined. As shown in Figure 5a, the model demonstrated strong robustness during the parameter tuning process and exhibited good generalization ability, effectively avoiding overfitting. Furthermore, a comparison was made between the optimal SVM model and the FR-SVM model. The results revealed that after FR optimization, the FR-SVM model showed significant improvements in the accuracy, precision, recall, and F1 score, with all four performance indicators exceeding 0.9, as detailed in Table 3. A comparison of the ROC curve classification performance between FR-SVM and SVM showed an increase in the AUC by 0.05, indicating an enhanced classification accuracy and generalization ability during data processing. Notably, under varying thresholds, the stability of FR-SVM in distinguishing positive and negative samples was improved, as shown in Figure 5b. Therefore, the geo-disaster risk spatial distribution map was generated based on the optimal FR-SVM parameter combination, as shown in Figure 6. It can be observed that most disaster points are located in medium-to-high- or high-risk areas, further confirming the model’s high performance and reliability. Additionally, comparing the geo-disaster risk distribution map with Figure 3 reveals that the medium-to-high- or high-geo-disaster-risk areas are mostly concentrated in lower-elevation human activity zones, regions with higher or lower rainfall, areas closer to rivers, and areas near fault lines.
Combining the above analysis with Figure 4b, it can be concluded that the LUCC, rainfall, elevation, and fault distance are the main factors influencing geo-disaster risk in mountainous areas. Among these, the LUCC has the most significant impact on the geo-disaster risk, and high-risk disaster areas and historical disaster points are primarily concentrated in regions with frequent human activity, indicating that human factors are the key drivers of increased geo-disaster risk in mountainous areas. Rainfall also provides triggering conditions for disasters, especially in geologically fragile areas affected by disturbances, where heavy rainfall may trigger landslides, collapses, and other disasters. Faults have a significant impact on the stress conditions within mountains, and the closer the proximity to a fault, the greater the tectonic stress, making the mountain more prone to disaster under external disturbances. Rivers gradually weaken the stability of the mountains through erosion and infiltration, especially in areas near rivers, where the water flow exacerbates the erosion of the mountain, thus increasing the geo-disaster risk.

4.2. Disaster Resilience Analysis

After generating the geo-disaster risk distribution map, a cooperative game optimization evaluation method was applied to calculate the socioeconomic resilience, resulting in the creation of a socioeconomic resilience distribution map in ArcGIS software, as shown in Figure A2. Subsequently, geo-disaster risk was incorporated into the socioeconomic resilience distribution map, and the two layers were overlaid in ArcGIS for the regional statistical analysis. The resilience values for each region were calculated, and a disaster resilience distribution map was generated, as detailed in Table 4 and Figure 7.
The results reveal an overall increasing trend in disaster resilience for cities in the western mountainous region of Sichuan, rising from 0.336 to 0.413. However, the standard deviation and coefficient of variation have increased annually. Between 2018 and 2022, seven cities—Luhuo, Jinchuan, Daofu, Lixian, Maoxian, Baoxing, and Yingjing—showed no improvement in disaster resilience, while Kangding improved from medium to high disaster resilience. Other cities experienced an increase of one level in resilience. Overall, the gap in disaster resilience between regions has gradually widened, presenting an “east high, west low” trend. This disparity mainly stems from the proximity of the eastern region to developed cities such as Chengdu and Deyang, which have a radiative effect on surrounding areas, particularly in terms of the economic, transportation, and cultural dimensions. In terms of transportation, newly constructed infrastructure has shortened the spatiotemporal distance between developed cities and their surrounding areas, facilitating resource flow and market integration, and enhancing the ability to cope with market fluctuations and post-disaster recovery. Culturally, the sharing of educational resources and tourism promotion have fostered social innovation and cultural integration in local areas. At the same time, the radiative effect of developed cities on surrounding areas demonstrates a “distance decay effect”, meaning that their influence on the western part of the study area is relatively limited. In the eastern region, cities with strong geographical and resource complementarities to developed cities exhibit more significant radiative effects.
Furthermore, a comparison between Figure A2 and Figure 7 reveals some differences between disaster resilience and socioeconomic resilience in cities with relatively higher geo-disaster risk. Cities such as Hanyuan, Shimian, Wenchuan, Tianquan, Maoxian, Lushan, Danba, and Baoxing have exhibited lower disaster resilience than socioeconomic resilience for most of the observed period. However, Hanyuan and Shimian, despite facing a high geo-disaster risk, demonstrated substantial adaptive capacity due to their strong socioeconomic resilience, with disaster resilience levels ranking only second to those of Kangding and maintaining a medium-high level. This suggests that while geo-disaster risk has hindered the resilience-building process, the degree of socioeconomic resilience development remains the key determinant of the variation in disaster resilience among mountainous cities.
The kernel density curve estimation of disaster resilience reveals the fluctuations in resilience differences among cities during the study period, as shown in Figure 8. In 2018, the resilience distribution was relatively dispersed, with a flatter curve, indicating significant resilience disparities between cities. By 2019, the curve shifted to the right on the left side, becoming more concentrated, suggesting that low-resilience cities made progress, narrowing the gap between cities to some extent. However, in 2020, the distribution significantly widened, with an expansion in the low-resilience interval, indicating that many cities’ resilience may have been impacted, resulting in substantial negative effects and further exacerbating resilience differences. In 2021 and 2022, the curve shifted rightward overall, with a more pronounced shift on the left side. This suggests that policy interventions and resilience-building measures facilitated the recovery of disaster resilience; however, high-resilience cities recovered more quickly than low-resilience cities, leading to a widening disparity in resilience between cities.
To further explore the specific causes of regional disparities, this study calculates and presents the resilience values for each dimension of socioeconomic resilience, as shown in Table A3. In the social, economic, and infrastructure dimensions, the annual average growth rates of the resilience values are 10.56%, 20.98%, and 14.89%, respectively, indicating a continuous enhancement of regional social stability and response capacity. Notably, the growth of economic resilience and infrastructure resilience has been relatively rapid, a trend closely linked to China’s ongoing support for the economic and infrastructure development of mountainous cities in recent years. However, the analysis based on the standard deviation (SD) and coefficient of variation (CV) reveals that while the resilience disparities among cities in the three dimensions decreased in 2019, from 2020 to 2022, these disparities expanded, with increasing volatility. Specifically, regions such as Daofu, Danba, Luhuo, Jinchuan, Jiulong, and Yajiang have generally lagged in social, economic, and infrastructure development, with slow progress and negative growth in at least one dimension. Baoxing, Barkam, Maoxian, Wenchuan, and Lixian have experienced slow development in social resilience, particularly Lixian and Wenchuan, where negative growth was observed in some years. The growth of economic resilience in Xiaojin has been relatively slow, and infrastructure development in Luding has lagged behind. In contrast, the three county-level cities of Kangding, Shimian, and Hanyuan have shown outstanding performance in social, economic, and infrastructure resilience, particularly Kangding, which exhibits high social resilience and low geo-disaster risk, reflecting a balanced development approach, thus maintaining a high level of disaster resilience. However, although Lushan, Tianquan, and Yingjing also show relatively balanced development across dimensions and maintain a medium-high level of socioeconomic resilience, their disaster resilience remains at a moderate level due to higher geo-disaster risks. In comparison, regions such as Luhuo, Daofu, and Jinchuan, despite having low geo-disaster risks, still face limitations in disaster resilience due to relatively weak social, economic, and infrastructure resilience. In conclusion, the overall development of disaster resilience in mountainous cities has been slow, and significant disparities exist between cities. To effectively enhance disaster resilience, balanced development must be achieved in social, economic, infrastructure construction, and geo-disaster risk management.

4.3. Analysis of the Driving Factors of Resilience Development

After evaluating the resilience indicators using GeoDetector, this study selected nine indicators based on significance (p < 0.01) to ensure the reliability of the results. These include the following: in the social dimension, X4 Urbanization Level, X7 Public Health Level, and X9 Information Dissemination; in the economic dimension, X12 Local Fiscal Capacity, X14 Scale of the Tourism Industry, and X16 Industrial Structure; and in the infrastructure dimension, X22 Park Green Space Level, X24 Medical Resource Capacity, and X26 Streetlight Coverage. The specific results are shown in Table 5. According to the univariate detection results of geographic detectors, it can be observed that, in 2018 and 2020, Medical Resource Capacity (0.78) was the key driving force for disaster resilience, highlighting the importance of the mountain city’s healthcare system’s capacity to withstand disaster impacts. For the years 2019, 2021, and 2022, Information Dissemination (0.82, 0.83, 0.85) was identified as the key driving force, emphasizing the importance of information flow and the speed at which individuals receive information for the disaster resilience of mountain cities. From 2018 to 2022, the top three driving forces on average were: Information Dissemination (0.82), Medical Resource Capacity (0.79), and Urbanization Level (0.70). Information Dissemination enhanced disaster early warning and emergency response capabilities; Medical Resource Capacity improved post-disaster recovery and public health security; and Urbanization Level, through optimizing infrastructure and resource allocation, enhanced the regional disaster response capacity. These factors played a central role in improving regional disaster resilience.
To explore whether the interaction between two factors enhances or diminishes the driving forces of resilience, interaction factor detection was performed following the single-factor analysis. The results are presented in Figure 9, with the left side showing the interaction factors for 2018 and the right side showing those for 2022. The findings indicate that, in 2018, the interaction between industrial structure and Medical Resource Capacity accounted for an explanatory power of 0.95, suggesting that the synergistic effect between economic development and healthcare resources significantly enhanced the region’s disaster response capacity. In 2022, the interaction between the information penetration rate and tourism industry scale showed an explanatory power of 0.96, indicating that the combined effect of information communication and the strong growth of the tourism economy effectively strengthened the region’s disaster resilience through both technological and economic means. Notably, the interaction effects on disaster resilience between various driving factors were significantly stronger in 2022 compared to in 2018, highlighting the necessity of balanced development across these factors for further advancing disaster resilience.

5. Discussion

5.1. Discussion of Research Findings in Relation to Existing Studies

This study proposes a comprehensive research framework for disaster resilience, integrating multiple dimensions such as social, economic, and infrastructure resilience, along with geo-disaster risk. Geo-disaster risk is assessed using machine learning algorithms, combined with historical disaster data and key triggering factors. These factors are then incorporated into resilience calculations. Compared to the frameworks proposed by Wang et al. [53] and Guo et al. [54], this approach offers two key advantages. First, it accounts for the high frequency of disasters in mountainous cities, a critical factor often overlooked. Second, it uses machine learning to enhance the accuracy of geo-disaster risk prediction.
Despite these strengths, the framework has limitations. The current geo-disaster risk prediction relies primarily on historical disaster data. Future improvements should incorporate real-time monitoring and longitudinal studies to refine risk assessments as information systems advance in mountainous regions. In terms of socioeconomic resilience, prior studies have included organizational resilience [53]. However, in western Sichuan’s mountainous cities, disaster prevention and policy implementation are typically managed at the municipal level. This study focuses on county-level cities, where disaster management systems and emergency response organizations are underdeveloped. Limited data availability and transparency further constrain the feasibility of studying organizational resilience in this context.
The overall disaster resilience of mountainous cities in western Sichuan has shown a steady upward trend, aligning with previous findings on city development in China [24]. This growth is largely attributed to supportive provincial policies, particularly those promoting socioeconomic development and ecological protection [55]. Additionally, the shift from rapid city expansion to sustainable, high-quality development [56] has enhanced the region’s capacity to address complex natural hazards and environmental changes. However, an analysis of the development rate, standard deviation, and coefficient of variation reveals persistent disparities. The resilience development rate in mountainous cities lags behind that of plain cities [55], influenced by factors such as rugged terrain, limited industrial diversification, and high geo-disaster risks [57]. The increasing standard deviation and coefficient of variation indicate growing spatial heterogeneity. There are pronounced differences in the disaster response capacity, infrastructure quality, and socioeconomic conditions. Unlike plain cities, where resilience disparities are diminishing [24,29], mountainous cities face geographic and economic constraints that hinder infrastructure expansion. These limitations restrict the intercity connectivity, impeding socioeconomic exchange and resource flow. To address these challenges, future efforts should prioritize regional disaster response coordination and infrastructure development to enhance the overall resilience [58].
Nevertheless, some mountainous cities have maintained relatively high and stable resilience levels. Between 2018 and 2022, seven cities—Kangding, Shimian, Yingjing, Hanyuan, Wenchuan, Barkam, and Tianquan—consistently outperformed the regional average. Their progress reflects advancements in social, economic, and infrastructure resilience. As central cities in Aba and Garze, Kangding and Barkam benefit from favorable geographic locations and lower geo-disaster risks. Kangding has made significant progress in urbanization, healthcare, and fiscal growth, reinforcing social stability and economic resilience [59]. In contrast, Barkam lags in healthcare, income levels, and infrastructure, suggesting that adopting Kangding’s development model could accelerate its resilience growth. Shimian and Yingjing, historically reliant on asbestos and coal industries, have diversified into agriculture, industry, and tourism, strengthening economic resilience [59]. Similarly, Hanyuan and Wenchuan, particularly after the 2008 earthquake, have leveraged resettlement policies, strategic city planning, and sustained investment in fixed assets to enhance resilience and economic potential [60].
From a temporal perspective, the number of low-resilience cities declined from seven in 2018 to three in 2022, indicating steady improvement. However, the impact of COVID-19 significantly disrupted resilience development in 2020, as observed by Peng et al. [55]. The widening kernel density curve during this period reflects the uneven recovery among cities. Social resilience was particularly affected, increasing only marginally from 0.341 in 2019–2020 to 0.343. This highlights the pandemic’s disruption of social systems and delayed resilience progress. As epidemic control measures were implemented, the resilience levels gradually rebounded. High-resilience cities recovered faster due to stronger social security, economic stability, and infrastructure. These findings underscore the necessity of strengthening disaster resilience, aligning closely with Sustainable Development Goal (SDG) 11 on sustainable cities and communities.
Key factors influencing disaster resilience development in mountainous cities warrant further exploration. Consistent with Lu et al. [24], this study identifies social resilience as a critical weak point. Unlike plain cities, where employment security plays a central role, mountainous cities face challenges such as lower education levels and a scarcity of skilled labor. Social development in these cities depends more on urbanization and improvements in healthcare services. Therefore, investing in education and healthcare is essential for enhancing human capital and social security. This directly contributes to SDG 3 (Good Health and Well-Being) and SDG 4 (Quality Education). Additionally, resilience development in these cities is closely tied to industrial structure and social welfare policies. Previous studies [61,62] have shown that optimizing industrial structures and expanding tourism can generate fiscal revenue, supporting improvements in transportation, communication, and healthcare infrastructure. This aligns with recent trends in western Sichuan, where economic diversification has driven substantial growth [63]. The expansion of information networks and digital infrastructure has further reinforced resilience by promoting tourism and enhancing economic adaptability. Moreover, efficient information dissemination during emergencies can mitigate disaster impacts, strengthening city resilience [64]. To sustain this progress, future strategies should focus on economic growth, infrastructure modernization, and social security enhancements, aligning with SDG 8 (Decent Work and Economic Growth) and SDG 9 (Industry, Innovation, and Infrastructure).
However, certain resilience-building measures have also introduced negative impacts. This study highlights the role of anthropogenic factors in exacerbating geo-disaster risks. Infrastructure expansion, tourism development, and other human activities have significantly altered the natural environment, increasing both the frequency and intensity of disasters. For instance, excessive construction can destabilize ecosystems, reducing natural disaster mitigation capacity. Similarly, mismanaged tourism and environmental degradation amplify vulnerabilities. These human-induced factors not only trigger disasters but also exacerbate their cascading effects by disrupting ecological and social systems. To mitigate these risks, disaster resilience strategies must incorporate sustainable land use and environmental protection measures, aligning with SDG 15 (Life on Land).

5.2. Development Suggestions

Based on the specific findings of the study and the SDGs, and considering the particular circumstances of mountain cities, the following recommendations are summarized:
(1)
Strengthen Medical Security and Promote Disaster Education. The government should improve medical infrastructure and emergency response systems in remote, disaster-prone areas to enhance healthcare accessibility and quality (SDG 3). This includes setting up mobile medical units and providing telemedicine services. Additionally, targeted health education should raise awareness of disease prevention and health management in mountainous regions (SDG 4). Disaster prevention education should be integrated into community activities, such as displaying prevention posters and establishing disaster response teams, while training local leaders as first responders to strengthen community resilience and adaptability.
(2)
Optimize industrial structure and enhance vocational skills. Cities in western Sichuan’s mountainous areas should diversify their industrial structure, focusing on green agriculture, tourism, and renewable energy to reduce reliance on a single economic model and promote sustainable development (SDG 8). Specifically, tourism can benefit from digital marketing via social media and short videos to enhance its competitiveness. Additionally, vocational skills training should be provided to improve employment and income, boosting economic independence (SDG 4 and SDG 8).
(3)
Improve Infrastructure Connectivity and Promote Green Sustainable Development. Mountain cities should optimize regional transportation networks and enhance the connectivity of infrastructure (SDG 9), facilitating the efficient circulation of economic and healthcare resources and fostering cross-regional disaster prevention and mitigation cooperation. Furthermore, during the construction of infrastructure, there should be an emphasis on promoting low-carbon, smart, and sustainable green building practices, minimizing the impact of human activities on ecosystems, and preserving biodiversity and ecosystem services (SDG 9 and SDG 15).
(4)
Regional Disaster Collaborative Governance. Mountain cities in western Sichuan should establish a cross-regional disaster emergency management cooperation mechanism, share emergency supplies and resource reserves, and build a joint disaster early warning and response system. Particularly, joint drills should be conducted for disasters such as earthquakes, mountain floods, and landslides, with a focus on testing modern emergency measures like airdrops and drone transport. Additionally, based on the findings of this study, differentiated post-disaster recovery plans should be further developed to facilitate the rapid restoration of production and daily life (SDG 11).
In conclusion, during the city development process, priority should be given to SDG 3 and SDG 4. While promoting social and economic growth and infrastructure development, SDG 8 and SDG 9 should be followed to guide development models and reduce ecological damage. In contrast to natural factors, these human-made factors are generally controllable, and should therefore be managed in alignment with SDG 15 to strengthen ecological monitoring and protection, preventing increased geo-disaster risks due to over-exploitation. Ultimately, these measures will contribute to achieving SDG 11, fostering comprehensive sustainable city development and enhancing overall resilience.

6. Conclusions

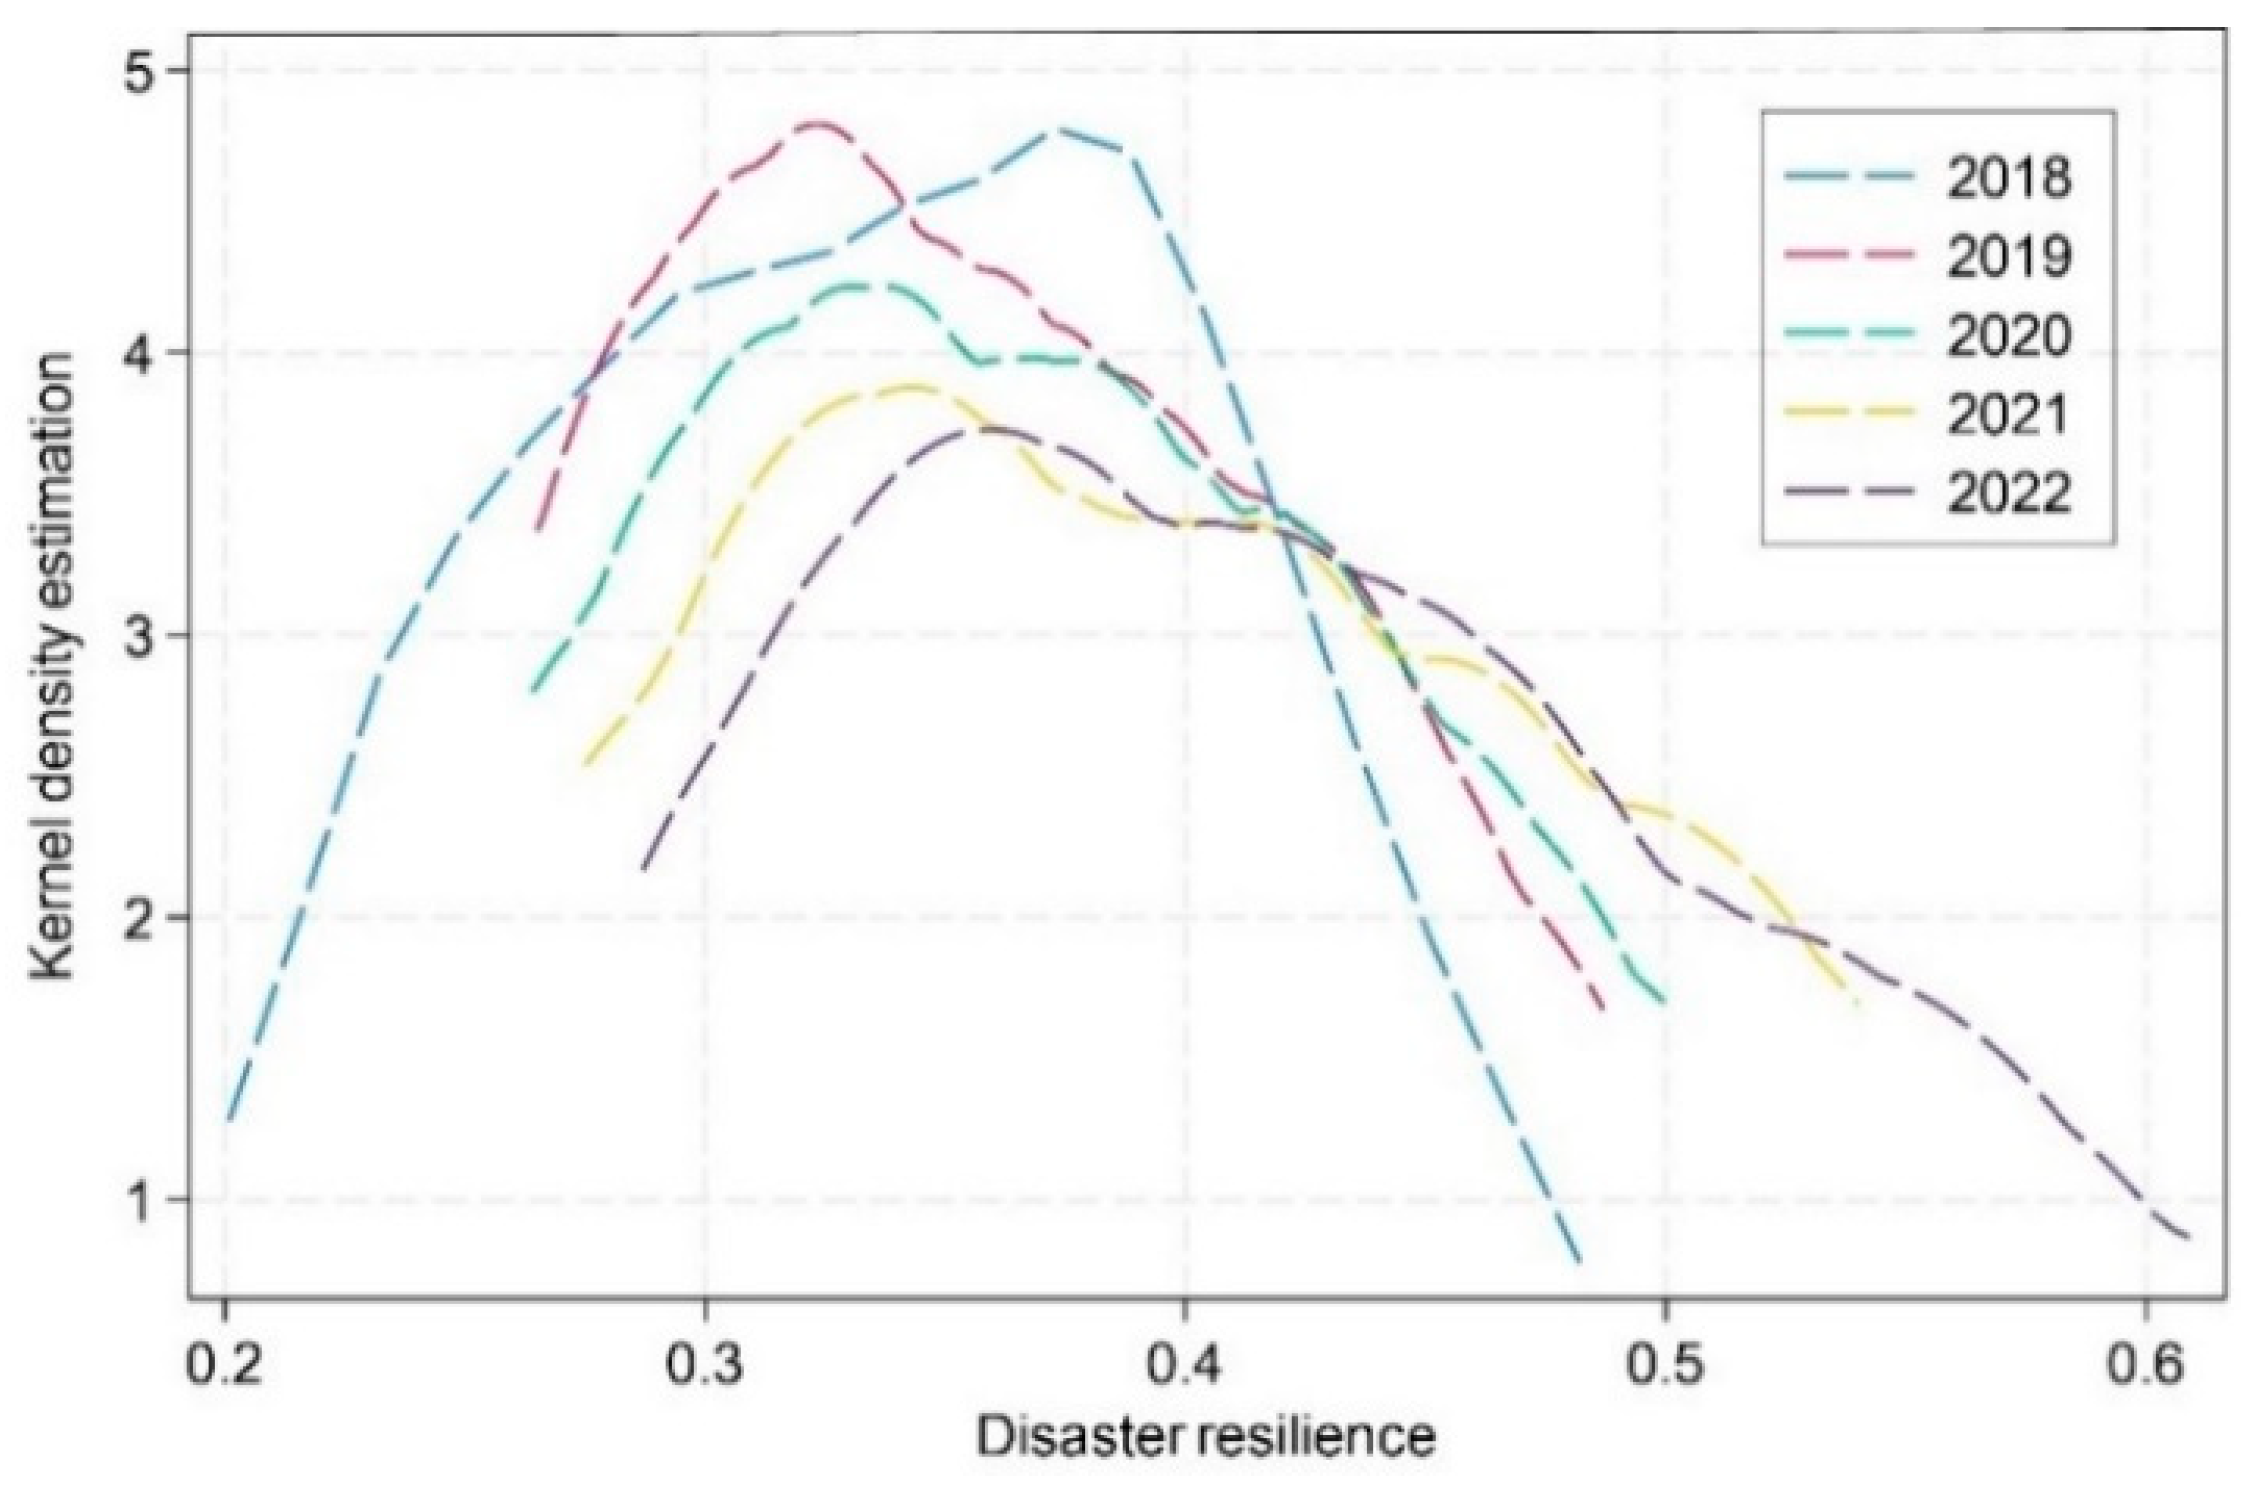
This study takes the mountain counties in the western part of Sichuan Province as a case study and constructs a comprehensive disaster resilience assessment framework suitable for mountain cities, covering both socioeconomic components (society, economy, and infrastructure) and geo-disaster risk components. Using PCC and IGR, the risk characteristics were screened to determine their importance, and the geo-disaster risk was predicted through FR-SVM, generating a geo-disaster risk map. The entropy weight method was applied to assign weights to socioeconomic resilience indicators, with the socioeconomic resilience values computed using TOPSIS, GRA, and RSR as game theory participants. Shapley values from cooperative game theory were used for optimization. In ArcGIS 10.8, geo-disaster risk maps were overlaid with socioeconomic resilience maps to calculate disaster resilience, which was further analyzed through geographic detectors and kernel density curves. The spatial evolution characteristics and key driving factors of disaster resilience development were deeply explored. In light of the unique characteristics of mountain cities, targeted development recommendations were proposed to support and provide references for enhancing disaster response capabilities and improving comprehensive resilience in mountain cities. The main conclusions are as follows:
(1)
The disaster resilience level in mountain cities shows an upward trend, but the overall resilience remains relatively low and fluctuates. Mountain cities still face challenges in disaster management and resilience building, requiring further enhancement of disaster response and stability.
(2)
The diffusion effect of resilience across mountain cities is weak, leading to significant spatial disparities, with a “high east, low west” spatial distribution. This is due to the influence of more developed cities located in the eastern part of the study area. Future efforts should focus on promoting regional cooperation and exchanges to strengthen the diffusion effect of high-resilience cities, thereby facilitating the development of low-resilience cities and reducing the gap between regions.
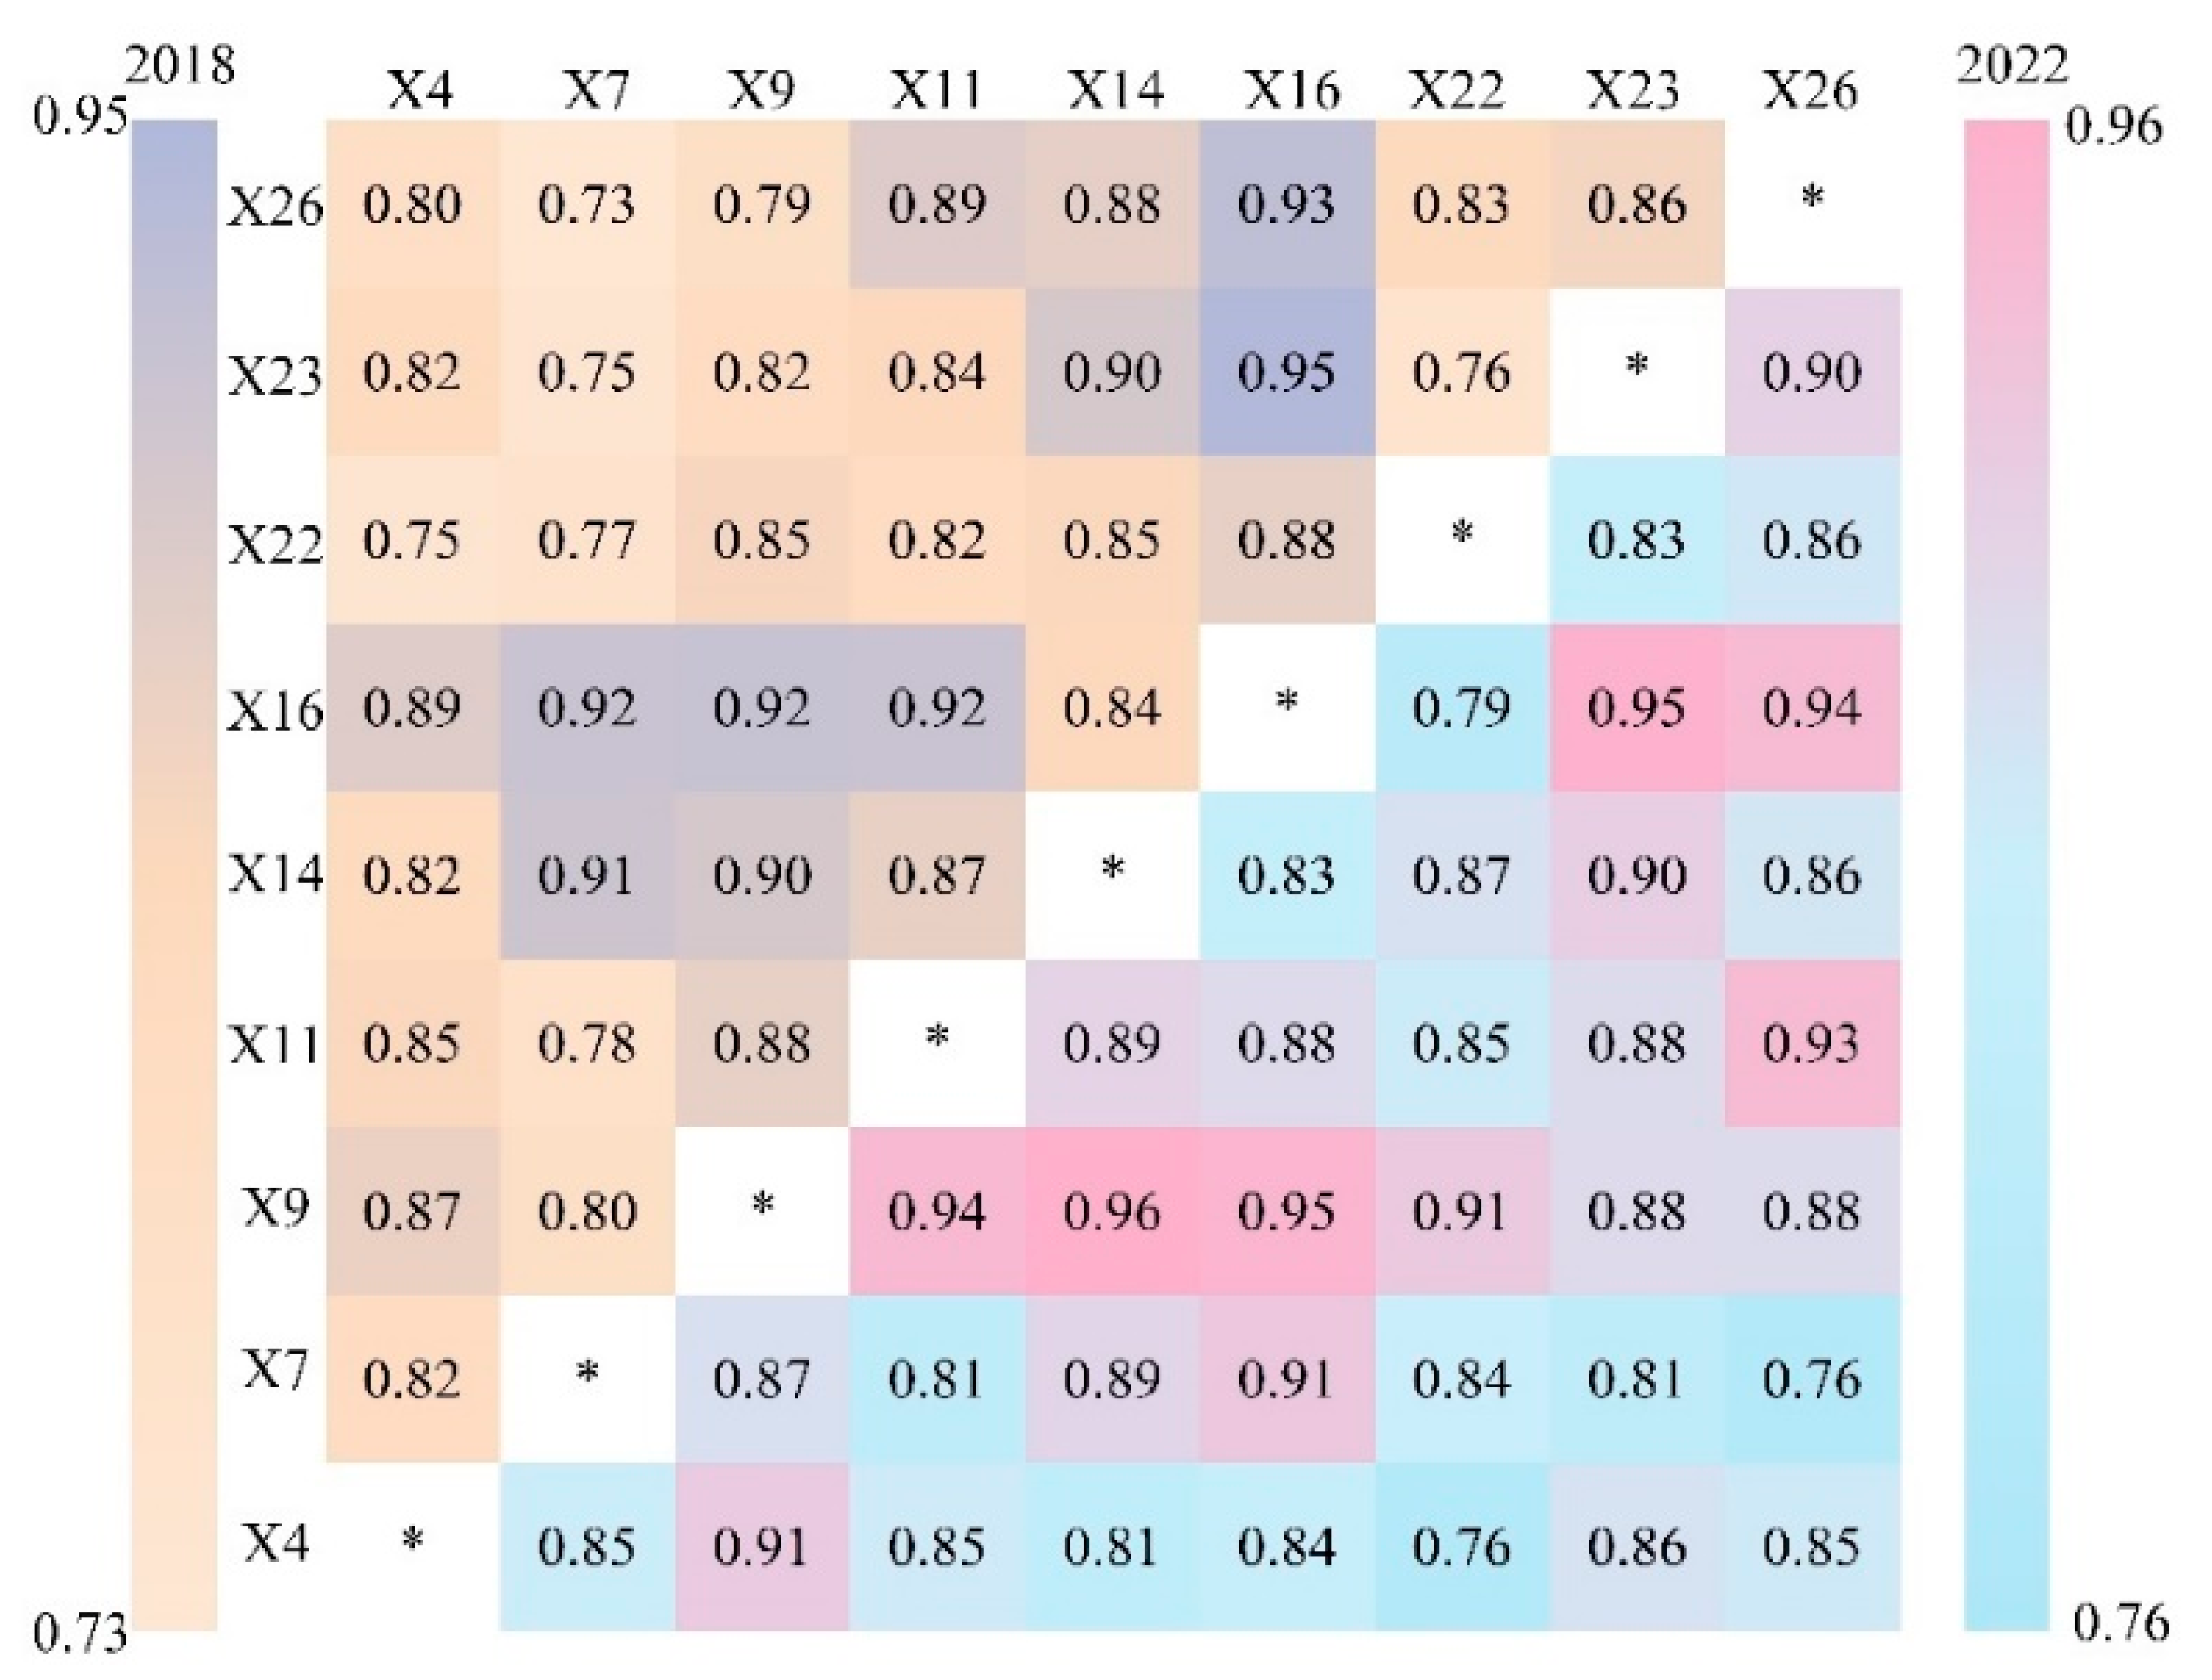
(3)
The joint influence of the level of information dissemination and the scale of tourism development is a key driver of city resilience development, while human activities are a critical factor exacerbating geo-disaster risks. By enhancing information infrastructure, mountain cities can not only improve disaster response capabilities but also stimulate tourism development, collectively strengthening city resilience. However, attention must be paid to mitigating the impact of human activities on the ecological environment.
(4)
The explanatory power of the collaborative effect among driving factors in disaster resilience is increasing. The development of resilience primarily depends on the synergy among these driving factors. Further progress in disaster resilience requires not only strengthening the role of individual driving factors but also ensuring a balanced development among them.
Future research should delve deeper into the influence of social factors on disaster resilience in mountain cities, such as ethnic cultural diversity, residents’ willingness to engage in social participation, and the status of left-behind populations in mountain areas. Moreover, it is essential to consider the responsiveness and efficiency of government organizations in emergency situations, i.e., organizational resilience. In terms of geo-disaster risk assessment, due to data limitations, the current study primarily relies on historical disaster data; however, incorporating longitudinal data would enhance the accuracy of disaster resilience assessments. Future research should integrate these factors into the disaster resilience research framework for mountain cities, offering scientific references for improving their disaster resilience.

Author Contributions

Conceptualization, Y.X. and Y.A.; Methodology, Y.X. and Y.A.; Software, H.Y. and D.C.; Investigation, H.Y.; Data curation, Q.F.; Writing—original draft, H.Y., Y.X., Q.F., Y.A. and D.C.; Writing—review & editing, H.Y., Y.X. and Q.F.; Visualization, H.Y.; Project administration, Y.X. All authors have read and agreed to the published version of the manuscript.

Funding

This research was supported by the Youth Project of the Sichuan Provincial Philosophy and Social Science Foundation (SCJJ24ND197), the Postgraduate Innovative Cultivation Program of Chengdu University of Technology (2024BJCX013), the Project of Sichuan Center for Disaster Economic Research (ZHJJ2024YJS001), the Project of Sichuan Research Center for Meteorological Disaster Prediction, Early Warning and Emergency Management (ZHYJ24-YB05), and the Project of Smart Emergency Management Key Laboratory (2024ZHYJGL-9).

Institutional Review Board Statement

Not applicable.

Informed Consent Statement

Not applicable.

Data Availability Statement

The data presented in this study are available on request from the authors.

Conflicts of Interest

The authors declare no conflicts of interest.

Appendix A

Table A1. Rationale for indicator selection.
IndicatorsRationale for SelectionReferences
Social Resilience [24,25,55]
X1 Population densityHigh population density increases the pressure on city resources, making emergency management more difficult during disasters.
X2 Female proportionFemale proportion: women in mountainous areas are more vulnerable to disasters due to constraints on economics, education, and decision-making power.
X3 Rural population proportionRural populations in mountainous areas rely more on city social support and resources.
X4 Urbanization levelHigher levels of urbanization typically lead to better infrastructure and higher living standards.
X5 Population growth rateRapid population growth increases pressure on resources, the environment, and services.
X6 Gas coverage rateA higher gas coverage rate improves energy supply and living standards.
X7 Public health levelPublic health is crucial for disaster response; more healthcare resources improve post-disaster recovery capacity.
X8 Health insurance coverage rateThe proportion of people covered by health insurance affects access to disaster-related healthcare services, indirectly boosting social resilience.
X9 Information technology penetrationThe penetration of information technology improves information flow, enhancing disaster forecasting and response capabilities.
Economic Resilience
X10 Household income levelHigher income levels reflect better economic conditions for residents, providing stronger capacity for recovery post-disaster.[29,42,54]
X11 Economic vitalityA more vibrant economy offers more resources and services, strengthening post-disaster recovery.
X12 Local fiscal capacityThe local fiscal capacity directly influences the allocation of resources for disaster response and post-disaster reconstruction.
X13 Loan dependenceOver-reliance on loans may lead to financial constraints during post-disaster recovery, thus affecting economic resilience.
X14 Tourism industry scaleThe scale of the tourism industry affects regional economic vitality, and tourism income can assist in post-disaster recovery.
X15 Industrial scaleA larger industrial base reflects a region’s economic structure and output, contributing to economic recovery after a disaster.
X16 Industrial structureA diverse industrial structure helps to resist the impact of disasters on single industries, enhancing economic resilience.
X17 Fixed investment levelHigher levels of fixed investment contribute to long-term economic development and infrastructure improvement, supporting post-disaster recovery.
X18 Economic densityEconomic density reflects the concentration of production activities, which helps mobilize resources quickly for post-disaster recovery.
Infrastructure Resilience
X19 Construction capacityRegions with strong construction capacity can restore infrastructure more quickly, enhancing the speed of recovery after a disaster.[28,29]
X20 Road coverage rateRoads are essential for post-disaster rescue and material transportation; a higher road coverage rate facilitates recovery efforts.
X21 Drainage capacityAn effective drainage system helps prevent flooding and ensures the normal operation of the city after a disaster.
X22 Urban green space levelThe quantity and quality of urban green spaces enhance ecological recovery, increasing the city’s resilience to disasters.
X23 Medical resource capacityThe availability of medical resources affects the emergency medical response and health recovery capacity post-disaster.
X24 Road network densityA dense road network facilitates the rapid movement of goods and rescue efforts after a disaster.
X25 Water supply facility coverageHigh coverage of water supply facilities ensures that residents’ basic water needs are met during and after a disaster.
X26 Streetlight coverage rateA higher streetlight coverage rate increases safety after a disaster, particularly in terms of visibility and security management during emergencies.
Table A2. Combinations of game participants.
Combination FormsPossible SubsetsComprehensive Evaluation Value
Single Form { T O P S I S } v ( { T O P S I S } ) = T O P S I S
{ G R A } v ( { G A E } ) = G A E
{ R S R } v ( { R S R } ) = R S R
Pairwise Combination { T O P S I S , G R A } v ( { T O P S I S , G R A } ) = 1 2 × T O P S I S + 1 2 × G R A
{ T O P S I S , R S R } v ( { T O P S I S , R S R } ) = 1 2 × T O P S I S + 1 2 × R S R
{ G R A , R S R } v ( { G R A , R S R } ) = 1 2 × G R A + 1 2 × R S R
All Combinations { T O P S I S , G R A , R S R } v ( T O P S I S , G R A , R S R } ) = 1 3 × T O P S I S + 1 3 × G R A + 1 3 × R S R
Table A3. Resilience values of social, economic, and infrastructure dimensions.
Social ResilienceEconomic ResilienceInfrastructure Resilience
201820192020202120222018201920202021202220182019202020212022
Baoxing0.3360.3430.3220.3390.3430.4290.4000.4090.4620.5010.2160.2150.2300.2450.310
Danba0.2650.2730.2710.2850.3160.1940.2270.2470.2730.2780.2240.2630.2360.2440.246
Daofu0.2700.2890.2570.2510.2780.1610.1820.1880.2170.2090.2010.2060.2220.2390.239
Hanyuan0.4980.5140.5080.5370.5470.4840.5820.5910.6500.7060.4640.4890.5560.5330.609
Jinchuan0.2600.2720.2730.2900.2790.1750.2260.2180.2380.2530.1870.1980.2040.2020.216
Jiulong0.2660.2680.2590.2710.3040.2450.2390.2450.2680.2920.1730.2390.1930.1990.203
Kangding0.4900.4630.4660.5170.7260.3380.4280.4440.5040.5180.4460.5320.5470.5590.593
Lixian0.2910.2620.2600.2410.2520.3190.2620.3030.3310.3270.2760.3030.3130.3750.384
Lushan0.3670.3810.4020.4050.4090.4980.5210.5390.5900.6130.3250.3280.3650.3980.441
Luhuo0.2510.2540.2540.2490.2790.1600.1680.1740.1790.1920.2400.2520.2520.2630.268
Luding0.3310.3370.3310.3390.3990.2620.3020.2900.3500.3520.3810.3810.3740.3840.391
Barkam0.3520.3620.3690.3700.3690.2670.3050.3330.3740.3770.2880.2930.2900.3080.314
Maoxian0.3600.3640.3480.3300.3590.2600.2880.3090.3320.3470.3780.3900.3990.3810.363
Shimian0.4270.3590.4240.4560.4570.5600.5940.6350.7120.7140.3600.3740.4190.4310.442
Tianquan0.4090.4240.4270.4470.4500.4230.4310.4600.4870.5270.4100.4210.4380.5390.561
Wenchuan0.3380.3620.3660.3630.3610.3860.4230.4280.5110.5220.3480.3600.3740.4330.460
Xiaojin0.2840.2870.2830.3290.3300.1890.2030.2220.2400.2530.2480.2510.2730.2860.354
Yingjing0.3980.3910.4140.4270.4340.5340.5690.5660.6130.6770.3990.4480.4670.4840.508
Yajiang0.2740.2760.2810.2580.2770.2750.2580.3250.3300.3320.1930.3120.3130.2810.288
Mean0.3400.3410.3430.3530.3770.3240.3480.3650.4030.4210.3030.3290.3400.3570.378
SD0.0760.0730.0790.0910.1140.1420.1310.1430.1600.1720.0970.0940.1110.1170.127
CV0.2240.2140.2300.2580.3020.4380.3760.3920.3970.4090.3200.2860.3260.3280.336
Figure A1. Distribution of historical disaster points.
Sustainability 17 03291 g0a1
Figure A2. Spatiotemporal distribution of socioeconomic resilience.
Sustainability 17 03291 g0a2

References

  1. Gu, W.; Qiu, J.; Hu, J.; Tang, X. A Bayesian decision network–based pre-disaster mitigation model for earthquake-induced cascading events to balance costs and benefits on a limited budget. Comput. Ind. Eng. 2024, 191, 110161. [Google Scholar] [CrossRef]
  2. Li, Y.; Liu, W.; Feng, Q.; Zhu, M.; Yang, L.; Zhang, J.; Yin, X. The role of land use change in affecting ecosystem services and the ecological security pattern of the Hexi Regions, Northwest China. Sci. Total Environ. 2023, 855, 158940. [Google Scholar] [CrossRef]
  3. Dong, W.; Zhou, Y.; Guo, D.; Chen, Z.; Wang, J. Evaluation of Urban Infrastructure Resilience Based on Risk–Resilience Coupling: A Case Study of Zhengzhou City. Land 2025, 14, 530. [Google Scholar] [CrossRef]
  4. van der Wiel, K.; Bintanja, R. Contribution of climatic changes in mean and variability to monthly temperature and precipitation extremes. Commun. Earth Environ. 2021, 2, 1. [Google Scholar] [CrossRef]
  5. Xu, W.; Lin, T.; Lei, X.; Chen, Y.; Gao, L. Anthropogenic emissions and land use/cover change contributions to extreme temperature changes over China. Atmos. Res. 2023, 292, 106845. [Google Scholar] [CrossRef]
  6. Li, S.; Zhang, J. Landscape Character Identification and Zoning Management in Disaster-Prone Mountainous Areas: A Case Study of Mentougou District, Beijing. Land 2024, 13, 2191. [Google Scholar] [CrossRef]
  7. Luo, K.; Zhang, X. Increasing urban flood risk in China over recent 40 years induced by LUCC. Landsc. Urban Plan. 2022, 219, 104317. [Google Scholar] [CrossRef]
  8. Hallegatte, S.; Vogt-Schilb, A.; Bangalore, M.; Rozenberg, J. Unbreakable: Building the Resilience of the Poor in the Face of Natural Disasters; World Bank Publications: Washington, DC, USA, 2016. [Google Scholar]
  9. Yang, Y.; Li, Z.; Wen, J. Long term impact of Wenchuan earthquake on population mental and behavioral disorders in heavily-stricken areas: An ecological study based on big data. J. Affect. Disord. 2024, 361, 589–595. [Google Scholar] [CrossRef] [PubMed]
  10. Tang, C.; Rengers, N.; van Asch, T.W.J.; Yang, Y.H.; Wang, G.F. Triggering conditions and depositional characteristics of a disastrous debris flow event in Zhouqu city, Gansu Province, northwestern China. Nat. Hazards Earth Syst. Sci. 2011, 11, 2903–2912. [Google Scholar] [CrossRef]
  11. Maly, E.; Suppasri, A. The Sendai Framework for Disaster Risk Reduction at Five: Lessons from the 2011 Great East Japan Earthquake and Tsunami. Int. J. Disaster Risk Sci. 2020, 11, 167–178. [Google Scholar] [CrossRef]
  12. Fu, X.; Liu, Y.; Xie, Z.; Jiang, F.; Xu, J.; Yang, Z.; Deng, Z.; Wang, Q.; Liao, M.; Wu, X.; et al. A coupled PSR-based framework for holistic modeling and flood resilience assessment: A case study of the 2022 flood events in five southern provinces of China. J. Hydrol. 2024, 636, 131255. [Google Scholar]
  13. Šakić Trogrlić, R.; Reiter, K.; Ciurean, R.L.; Gottardo, S.; Torresan, S.; Daloz, A.S.; Ma, L.; Padrón Fumero, N.; Tatman, S.; Hochrainer-Stigler, S.; et al. Challenges in assessing and managing multi-hazard risks: A European stakeholders perspective. Environ. Sci. Policy 2024, 157, 103774. [Google Scholar] [CrossRef]
  14. Filho, W.L.; Balogun, A.-L.; Olayide, O.E.; Azeiteiro, U.M.; Ayal, D.Y.; Muñoz, P.D.C.; Nagy, G.J.; Bynoe, P.; Oguge, O.; Yannick Toamukum, N.; et al. Assessing the impacts of climate change in cities and their adaptive capacity: Towards transformative approaches to climate change adaptation and poverty reduction in urban areas in a set of developing countries. Sci. Total Environ. 2019, 692, 1175–1190. [Google Scholar] [CrossRef] [PubMed]
  15. Cartier, C. Origins and evolution of a geographical idea: The macroregion in China. Mod. China 2002, 28, 79–112. [Google Scholar]
  16. Liu, X.; Guo, H.; Lin, Y.-R.; Li, Y.; Hou, J. Analyzing Spatial-Temporal Distribution of Natural Hazards in China by Mining News Sources. Nat. Hazards Rev. 2018, 19, 04018006. [Google Scholar]
  17. UNDRR. Human Cost of Disasters: An Overview of the Last 20 Years 2000–2019, 2020; UNDRR: Brussels, Belgium, 2022. [Google Scholar]
  18. China Statistical Yearbook; Various Years 2018–2022; Zhongguo Tongji Chubanshe: Beijing, China, 2023.
  19. Hallegatte, S.; Rentschler, J.; Walsh, B. Building Back Better: Achieving Resilience Through Stronger, Faster, and More Inclusive Post-Disaster Reconstruction; World Bank: Washington, DC, USA, 2018. [Google Scholar]
  20. Mileti, D. Disasters by Design: A Reassessment of Natural Hazards in the United States; The National Academies Press: Washington, DC, USA, 1999; p. 371. [Google Scholar]
  21. Zhang, W.; Xu, X.; Chen, X. Social vulnerability assessment of earthquake disaster based on the catastrophe progression method: A Sichuan Province case study. Int. J. Disaster Risk Reduct. 2017, 24, 361–372. [Google Scholar]
  22. Shaw, R.; Izumi, T.; Shi, P. Perspectives of science and technology in disaster risk reduction of Asia. Int. J. Disaster Risk Sci. 2016, 7, 329–342. [Google Scholar]
  23. Woodall, B.; Amekudzi-Kennedy, A.; Inchauste, M.O.; Sundararajan, S.; Medina, A.; Smith, S.; Popp, K. Institutional resilience and disaster governance: How countries respond to Black Swan events. Prog. Disaster Sci. 2024, 22, 100329. [Google Scholar]
  24. Lu, H.; Lu, X.; Jiao, L.; Zhang, Y. Evaluating urban agglomeration resilience to disaster in the Yangtze Delta city group in China. Sustain. Cities Soc. 2022, 76, 103464. [Google Scholar]
  25. Zhao, L.; Wen, J.; Wan, C.; Li, L.; Chen, Y.; Zhang, H.; Liu, H.; Yan, J.; Liu, J.; Tian, T.; et al. Disaster loss index development and comprehensive assessment: A case study of Shanghai. Ecol. Indic. 2024, 166, 112497. [Google Scholar]
  26. Zhai, W.; Hu, W.Y.; Yuan, Z.H.; Li, Y.T. Examining disaster resilience perception of social media users during the billion-dollar hurricanes. Nat. Hazards 2024, 120, 701–727. [Google Scholar] [CrossRef]
  27. Shen, Z.F.; Ji, C.J.; Lu, S.C. Transportation network resilience response to the spatial feature of hazards. Transp. Res. Part D-Transp. Environ. 2024, 128, 104121. [Google Scholar]
  28. Mabrouk, M.; Haoying, H. Urban resilience assessment: A multicriteria approach for identifying urban flood-exposed risky districts using multiple-criteria decision-making tools (MCDM). Int. J. Disaster Risk Reduct. 2023, 91, 103684. [Google Scholar] [CrossRef]
  29. Liang, Y.; Wang, C.; Chen, G.; Xie, Z. Evaluation framework ACR-UFDR for urban form disaster resilience under rainstorm and flood scenarios: A case study in Nanjing, China. Sustain. Cities Soc. 2024, 107, 105424. [Google Scholar] [CrossRef]
  30. Hung, C.-H.; Hung, H.-C.; Hsu, M.-C. Linking the interplay of resilience, vulnerability, and adaptation to long-term changes in metropolitan spaces for climate-related disaster risk management. Clim. Risk Manag. 2024, 44, 100618. [Google Scholar]
  31. Parsons, M.; Reeve, I.; McGregor, J.; Hastings, P.; Marshall, G.R.; McNeill, J.; Stayner, R.; Glavac, S. Disaster resilience in Australia: A geographic assessment using an index of coping and adaptive capacity. Int. J. Disaster Risk Reduct. 2021, 62, 102422. [Google Scholar] [CrossRef]
  32. Wang, J.; Zhu, S.; Luo, X.; Chen, G.; Xu, Z.; Liu, X.; Li, Y. Refined micro-scale geological disaster susceptibility evaluation based on UAV tilt photography data and weighted certainty factor method in Mountainous Area. Ecotoxicol. Environ. Saf. 2020, 189, 110005. [Google Scholar] [CrossRef]
  33. Zhou, M.; Yuan, M.; Yang, G.; Mei, G. Risk analysis of road networks under the influence of landslides by considering landslide susceptibility and road vulnerability: A case study. Nat. Hazards Res. 2024, 4, 387–400. [Google Scholar] [CrossRef]
  34. Sun, D.; Wang, J.; Wen, H.; Ding, Y.; Mi, C. Landslide susceptibility mapping (LSM) based on different boosting and hyperparameter optimization algorithms: A case of Wanzhou District, China. J. Rock Mech. Geotech. Eng. 2024, 16, 3221–3232. [Google Scholar] [CrossRef]
  35. Wang, X.; Zhang, C.; Wang, C.; Liu, G.; Wang, H. GIS-based for prediction and prevention of environmental geological disaster susceptibility: From a perspective of sustainable development. Ecotoxicol. Environ. Saf. 2021, 226, 112881. [Google Scholar] [CrossRef]
  36. Wang, Y.C.; Liu, Y.; Zhao, N.; Jiang, W. Investigation on the evolution mechanism of water and mud inrush disaster in fractured rock mass of mountain tunnel. Geomat. Nat. Hazards Risk 2022, 13, 1780–1804. [Google Scholar] [CrossRef]
  37. Li, C.; Wang, M.; Chen, F.; Coulthard, T.J.; Wang, L. Integrating the SLIDE model within CAESAR-Lisflood: Modeling the ‘rainfall-landslide-flash flood’ disaster chain mechanism under landscape evolution in a mountainous area. Catena 2023, 227, 107124. [Google Scholar] [CrossRef]
  38. Wang, X.; Hu, S.; Lian, B.; Wang, J.; Zhan, H.; Wang, D.; Liu, K.; Luo, L.; Gu, C. Formation mechanism of a disaster chain in Loess Plateau: A case study of the Pucheng County disaster chain on August 10, 2023, in Shaanxi Province, China. Eng. Geol. 2024, 331, 107463. [Google Scholar] [CrossRef]
  39. Blondin, S. Staying despite disaster risks: Place attachment, voluntary immobility and adaptation in Tajikistan’s Pamir Mountains. Geoforum 2021, 126, 290–301. [Google Scholar] [CrossRef]
  40. Wisner, B.; Blaikie, P.; Cannon, T.; Davis, I. At Risk: Natural Hazards, People’s Vulnerability, and Disasters; Routledge: London, UK, 2003. [Google Scholar]
  41. Li, H.; Zhao, X.; Wang, W. Evaluation and formation mechanism of rural social vulnerability under natural hazard: A case study of the eastern Qinghai-Tibetan Plateau, China. Habitat Int. 2023, 138, 102871. [Google Scholar] [CrossRef]
  42. Ochir, A.; Lee, W.-K.; Wang, S.W.; Demberel, O.; Enkhsaikhan, U.; Turbat, B.; Lamchin, M.; Munkhbat, B.; Namsrai, O. Assessment of nomadic pastoralists’ livelihood vulnerability to the changing climate in the Third Pole region: Case study in the Altai Mountains of western Mongolia. Ecol. Inform. 2024, 83, 102835. [Google Scholar] [CrossRef]
  43. Jiang, F.; Xie, Z.; Xu, J.; Yang, S.; Zheng, D.; Liang, Y.; Hou, Z.; Wang, J. Spatial and component analysis of urban flood Resiliency of kunming city in China. Int. J. Disaster Risk Reduct. 2023, 93, 103759. [Google Scholar] [CrossRef]
  44. Guo, X.; Kapucu, N. Assessing social vulnerability to earthquake disaster using rough analytic hierarchy process method: A case study of Hanzhong City, China. Saf. Sci. 2020, 125, 104625. [Google Scholar] [CrossRef]
  45. Huang, W.; Ding, M.; Li, Z.; Zhuang, J.; Yang, J.; Li, X.; Meng, L.E.; Zhang, H.; Dong, Y. An Efficient User-Friendly Integration Tool for Landslide Susceptibility Mapping Based on Support Vector Machines: SVM-LSM Toolbox. Remote Sens. 2022, 14, 3408. [Google Scholar] [CrossRef]
  46. Shifang, Z.; Yufen, W.; Bei, J.I.A.; Shangmin, Z. Spatial-temporal Changes and Influencing Factors of Geologic Disasters from 2005 to 2016 in China. J. Geo-Inf. Sci. 2017, 19, 1567–1574. [Google Scholar]
  47. Space, N.A. “National Aeronautics and Space Administration.” Retrieved from National Aeronautics and Space Administration. 1977. Available online: www.nasa.gov (accessed on 6 April 2025).
  48. Delforge, D.; Wathelet, V.; Below, R.; Sofia, C.L.; Tonnelier, M.; van Loenhout, J.; Speybroeck, N. EM-DAT: The Emergency Events Database. 2023. Available online: https://www.emdat.be/ (accessed on 23 December 2024).
  49. Zavadskas, E.K.; Mardani, A.; Turskis, Z.; Jusoh, A.; Nor, K.M.D. Development of TOPSIS Method to Solve Complicated Decision-Making Problems: An Overview on Developments from 2000 to 2015. Int. J. Inf. Technol. Decis. Mak. 2016, 15, 645–682. [Google Scholar] [CrossRef]
  50. Zhang, Q.; Lu, Z.H.; Jing, S.S.; Guo, D.; Wang, L.J. Comprehensive evaluation of the implementation of close-type county medical alliance in Shandong Province using entropy weight TOPSIS method and non-integer rank sum ratio method. BMC Health Serv. Res. 2024, 24, 1193. [Google Scholar]
  51. Yang, W.G.; Wu, Y.J. A Novel TOPSIS Method Based on Improved Grey Relational Analysis for Multiattribute Decision-Making Problem. Math. Probl. Eng. 2019, 2019, 8761681. [Google Scholar]
  52. Wang, J.; Xu, C.D. Geodetector: Principle and prospective. Acta Geogr. Sin. 2017, 72, 116–134. [Google Scholar]
  53. Wang, Y.; Shu, J.; Yuan, Y. Navigating urban risks for sustainability: A comprehensive evaluation of urban vulnerability based on a pressure–sensitivity–resilience framework. Sustain. Cities Soc. 2024, 117, 105961. [Google Scholar] [CrossRef]
  54. Guo, Z.; Li, Z.; Lu, C.; She, J.; Zhou, Y. Spatio-temporal evolution of resilience: The case of the Chengdu-Chongqing urban agglomeration in China. Cities 2024, 153, 105226. [Google Scholar]
  55. Peng, P.; Li, M.; Ao, Y.; Deng, S.; Martek, I. Spatial-temporal evolution of driving mechanisms of city resilience: A Sichuan-based case study. Land Use Policy 2024, 143, 107210. [Google Scholar]
  56. Li, Q.; Yang, Z.; Tian, Z.; Yin, Q. Multidimensional measurement of the High-Quality development of city Clusters: Dynamic Evolution, regional differences and trend forecasting--based on the basic connotation of Chinese-style modernization. Ecol. Indic. 2024, 161, 111989. [Google Scholar]
  57. Wang, J.; Kang, Y.; Feng, B. Disaster resilience in the geohazard-prone mountainous areas: Evidence from the Hengduan Mountain, Southwest China. Int. J. Disaster Risk Reduct. 2025, 119, 105331. [Google Scholar]
  58. Xing, H.; Xing, L. Key Factors and Coupling Relationships of Collaborative Governance for Disaster Prevention in China’s Coastal Cities. Risk Anal. 2021, 41, 895–910. [Google Scholar]
  59. Wang, R.; Zou, Y.; Dong, S.; Li, J.; Dong, X.; Zhang, Y. The relationship between snow disasters and the human well-being of farmers and herders in the Dadu River Basin. Ecol. Inform. 2024, 81, 102596. [Google Scholar]
  60. Bahmani, H.; Ao, Y.; Zhang, W.; Xu, Q.; Zhu, H.; Ren, D.; Yu, H. From policy implementation to public perception: A dual approach to assessing disaster recovery success in the Wenchuan and Bam earthquake recovery projects. Int. J. Disaster Risk Reduct. 2025, 117, 105162. [Google Scholar] [CrossRef]
  61. Yin, Z.; Tang, Y.; Liu, H.; Dai, L. Coupling coordination relationship between tourism economy-social welfare-ecological environment: Empirical analysis of Western Area, China. Ecol. Indic. 2023, 155, 110938. [Google Scholar] [CrossRef]
  62. Tang, D.; Li, J.; Zhao, Z.; Boamah, V.; Lansana, D.D. The influence of industrial structure transformation on urban resilience based on 110 prefecture-level cities in the Yangtze River. Sustain. Cities Soc. 2023, 96, 104621. [Google Scholar] [CrossRef]
  63. Wu, B.; Geng, B.; Wang, Y.; Scott, M.; Liao, L.; Zeng, L.; Deng, B. Reverse entrepreneurship and integration in poor areas of China: Case studies of tourism entrepreneurship in Ganzi Tibetan Region of Sichuan. J. Rural Stud. 2022, 96, 358–368. [Google Scholar] [CrossRef]
  64. Feng, W.; Yuan, H. The impact of medical infrastructure on regional innovation: An empirical analysis of China’s prefecture-level cities. Technol. Forecast. Soc. Change 2023, 186, 122125. [Google Scholar] [CrossRef]
Figure 1. Research flowchart of disaster resilience.
Sustainability 17 03291 g001
Figure 2. Study area.
Sustainability 17 03291 g002
Figure 3. Geo-disaster risk characteristic indicators.
Sustainability 17 03291 g003
Figure 4. Screening of risk characteristic indicators: (a) Heatmap of natural environmental characteristics. (b) Importance of geo-disaster risk characteristics.
Sustainability 17 03291 g004
Figure 5. Model validation: (a) Accuracy variation of SVM under different parameter combinations. (b) Comparison of ROC curves.
Sustainability 17 03291 g005
Figure 6. Geo-disaster risk distribution in mountainous cities.
Sustainability 17 03291 g006
Figure 7. Spatiotemporal distribution of disaster resilience.
Sustainability 17 03291 g007
Figure 8. Kernel density estimation of disaster resilience.
Sustainability 17 03291 g008
Figure 9. Two-factor interaction detection Heatmap.
Sustainability 17 03291 g009
Table 1. Socioeconomic resilience indicator system.
ResilienceIndicatorsDescriptionWeight
Social resilience 0.236
X1 Population densityHigher population density increases pressure on city resources. (−)0.011
X2 Female proportionMountain women are more vulnerable due to economic, educational, and decision-making constraints. (−)0.018
X3 Rural population proportionRural populations from mountainous areas need cities to provide more social support and resources. (−)0.023
X4 Urbanization levelHigher urbanization in mountain areas improves residents’ quality of life, infrastructure, and services. (−)0.034
X5 Population growth ratePopulation growth in mountainous areas strains resources, environment, and services. (+)0.006
X6 Gas coverage rateA higher gas coverage rate improves energy access and living standards. (+)0.014
X7 Public health levelMeasured by the number of healthcare professionals. (+)0.078
X8 Health insurance coverage rateMeasured by the proportion of people enrolled in social health insurance. (+)0.002
X9 Information technology penetrationMeasured by the proportion of mobile phone users. (+)0.050
Economic resilience 0.377
X10 Household income levelMeasured by per capita income level. (+)0.037
X11 Economic vitalityMeasured by per capita GDP. (+)0.052
X12 Local fiscal capacityMeasured by local fiscal revenue. (+)0.033
X13 Loan dependenceMeasured by per capita loan level. (−)0.007
X14 Tourism industry scaleMeasured by tourism economic income. (+)0.046
X15 Industrial scaleMeasured by the number of large-scale industrial enterprises. (+)0.064
X16 Industrial structureMeasured by the proportion of secondary and tertiary industries. (+)0.007
X17 Fixed investment levelMeasured by the amount of fixed capital investment. (+)0.043
X18 Economic densityMeasured by the ratio of regional production total to area. (+)0.088
Infrastructure resilience 0.393
X19 Construction capacityMeasured by the number of construction enterprises in the region. (+)0.084
X20 Road coverage rateMeasured by the road area ratio in the built-up area. (+)0.038
X21 Drainage capacityMeasured by the drainage pipeline density. (+)0.041
X22 Urban green space levelMeasured by the area of park green space. (+)0.024
X23 Medical resource capacityMeasured by the number of beds in healthcare institutions. (+)0.046
X24 Road network densityThe ratio of the total road length to the area of the region. (+)0.053
X25 Water supply facility coverageMeasured by the density of water supply pipelines. (+)0.054
X26 Streetlight coverage rateMeasured by the number of streetlights per kilometer. (+)0.053
Table 2. Formulations of evaluation methods and their advantages and limitations.
MethodsFormulations Advantages and LimitationsReferences
TOPSIS D i + = j = 1 m ( A j + x i j ) 2 D i = j = 1 m A j x i j 2 , A + = max 1 j m x i j j = 1 , 2 , , m , A = min 1 j m x i j j = 1 , 2 , , m (9)The method simultaneously assesses the proximity to the ideal solution and the distance from the worst-case scenario, offering an intuitive ranking. However, it is sensitive to weight assignments, and improper weights can affect the results.[49,50,51]
T i = D i D i + + D i (10)
GRA ζ i j = min i min j A + x i j + ρ max i max j A + x i j A + x i j + ρ max i max j A + x i j (11)This method is suitable for small sample sizes and uncertain data, without the need for large-scale data support. However, it primarily focuses on trends and does not fully capture the absolute quality of the data.
G R A i = 1 m j = 1 m ζ i j (12)
RSR R i j = 1 + ( n 1 ) x i j min ( x 1 j , x n j , , x n j ) max ( x 1 j , x n j , , x n j ) min ( x 1 j , x n j , , x n j ) (13)The computation is straightforward, not dependent on data distribution or weight settings. It is based solely on ranking information, disregarding the absolute values of the indicators.
R S R i = 1 n j = 1 m R i j (14)
Table 3. Model performance evaluation metrics and confusion matrix results.
TPFPFNTNAccuracyPrecisionRecallF1
SVM112818223211180.8440.8600.8300.843
FR-SVM12711057912050.9310.9230.9410.932
Table 4. Regional statistical values of disaster resilience.
Disaster Resilience
20182019202020212022
Baoxing0.3270.3170.3220.3520.393
Danba0.2470.2790.2760.2940.305
Daofu0.2500.2680.2690.2890.293
Hanyuan0.4180.4620.4860.5040.553
Jinchuan0.2340.2650.2640.2770.287
Jiulong0.2770.3070.2850.3010.325
Kangding0.4250.4870.5000.5400.609
Lixian0.3490.3280.3500.3860.392
Lushan0.3330.3450.3660.3930.415
Luhuo0.2570.2660.2690.2750.292
Luding0.3500.3680.3590.3900.408
Barkam0.3690.3920.4060.4340.438
Maoxian0.3590.3760.3850.3820.388
Shimian0.4490.4510.4990.5400.543
Tianquan0.3790.3890.4050.4550.477
Wenchuan0.3870.4130.4220.4800.495
Xiaojin0.2850.2930.3120.3390.377
Yingjing0.4050.4330.4430.4680.499
Yajiang0.2870.3340.3650.3470.356
Mean0.3360.3560.3680.3920.413
SD0.0660.0700.0790.0870.096
CV0.1970.1970.2140.2230.231
Table 5. Single-factor detection results.
X4X7X9X11X14X16X22X23X26
q-vaule20180.720.620.770.610.570.720.640.780.61
20190.730.690.820.650.510.590.600.800.71
20200.660.710.810.620.470.570.590.820.66
20210.680.640.830.590.550.650.610.790.61
20220.730.670.850.600.620.610.600.790.66
mean0.700.660.820.610.540.630.610.790.65
Disclaimer/Publisher’s Note: The statements, opinions and data contained in all publications are solely those of the individual author(s) and contributor(s) and not of MDPI and/or the editor(s). MDPI and/or the editor(s) disclaim responsibility for any injury to people or property resulting from any ideas, methods, instructions or products referred to in the content.

