Article

The Arctic Permafrost Vulnerability Index

1
Department of Physical Geography, Stockholm University, 114 19 Stockholm, Sweden
2
Regional Center for Nordic Development, Nordregio, 111 86 Stockholm, Sweden
3
Bolin Center for Climate Research, Stockholm University, 114 18 Stockholm, Sweden
4
“Cultures, Environments, Arctic, Representations, Climate Research Center” (CEARC), Université de Versailles Saint-Quentin, 78035 Saint-Quentin en Yvelines, France
5
Department of Environmental Sciences, Informatics and Statistics, Scientific Campus, Ca’ Foscari University of Venice, Via Torino, 155, 30172 Venice, Italy
6
Department of Geosciences, University of Oslo, 0313 Oslo, Norway
7
Stefansson Arctic Institute, University of Akureyri, 600 Akureyri, Iceland
*
Author to whom correspondence should be addressed.
Sustainability 2025, 17(8), 3288; https://doi.org/10.3390/su17083288
Submission received: 12 February 2025 / Revised: 14 March 2025 / Accepted: 4 April 2025 / Published: 8 April 2025
(This article belongs to the Section Sustainable Urban and Rural Development)

Abstract

As permafrost thaw accelerates, Arctic communities living on permafrost face new challenges that require the development of local adaptation policies. Vulnerability assessments have not yet been applied in the context of permafrost thaw. We develop a conceptual framework to assess vulnerabilities related to permafrost thaw in the Arctic Circumpolar Permafrost Region (ACPR). The Arctic Permafrost Vulnerability Index (APVI) combines a set of physical and social indicators to reflect the levels of exposure to permafrost thaw and the adaptive capacities to respond in Arctic subregions. Using available indicators, we applied the APVI in 260 subregions on permafrost in the ACPR. Our results show that most subregions (97%, n = 253) are moderately vulnerable to permafrost thaw. This overall vulnerability score reflects large differences in the levels of exposure and adaptive capacities. While most subregions (67%, n = 174) had a high exposure to permafrost thaw, 75% (n = 194) had moderate adaptive capacities to adjust. Alarmingly, a quarter of the subregions (25%, n = 66) had low adaptive capacities to respond to permafrost thaw. The APVI remains conceptual as some limitations related to data quality, access, and availability apply. Thus, the interpretation of the vulnerability results should be evaluated with caution and put into local contexts.

1. Introduction

Approximately five million people live on permafrost in the circumpolar north, with estimates indicating that three million live in areas where permafrost may degrade or disappear by 2050 [1]. Permafrost, defined as frozen ground at or below 0 °C for at least two consecutive years, covers about 15 million km2 of land in the Northern Hemisphere [2]. Because of the unprecedented and amplified increase in air temperature in the Arctic, permafrost thaws, which inevitably leads to a reduction in permafrost extent [3,4,5]. Thawing permafrost causes important modifications in permafrost landscapes (e.g., subsidence, coastal erosion, and landslides) that are widely observed [6,7,8,9] and heavily impact permafrost ecosystems and biogeochemical cycles [10,11,12]. Thawing permafrost also affects the lives and well-being of communities living on permafrost in various ways, depending on the type of underlying permafrost, the infrastructure in place, the culture, and the socioeconomic profiles [13,14,15,16]. While these communities are already facing major socioeconomic changes [17,18,19], adapting to permafrost thaw adds additional challenges, especially in communities where thawing is expected to increase in magnitude and frequency [9,16]. Thus, there is a need for comprehensive and spatially explicit studies to assist decision-makers in prioritizing adaptation actions and allocating resources for adaptation measures. Vulnerability assessments are widely used to assess the risks posed by climate change and to identify opportunities for adaptation [20,21,22]. Vulnerability indexes are essential tools for assessing the susceptibility of communities to various risks, including environmental hazards, socioeconomic challenges, and health crises. One of the strengths of vulnerability indexes is their ability to integrate diverse indicators, such as demographic data, economic conditions, and environmental factors, to provide a comprehensive assessment of vulnerability. This holistic approach allows policymakers to identify at-risk populations and prioritize interventions effectively. Additionally, vulnerability indexes can be applied across different scales, from local to global, making them versatile tools for various contexts.
However, there are notable weaknesses in vulnerability indexes. One significant limitation is the reliance on secondary data, which may not always be accurate or up to date. This can lead to inaccuracies in the assessment and potentially misguide policy decisions. Furthermore, many vulnerability indexes use a deductive approach, selecting indicators based on existing frameworks rather than context-specific needs. This can result in a lack of sensitivity to local conditions and unique vulnerabilities. Despite these weaknesses, vulnerability indexes remain valuable tools for understanding and mitigating risks, provided they are continuously refined and validated through ground-truthing and community engagement.
Although critical for community planning, vulnerability assessments in the context of permafrost thaw are limited [23,24] and missing at the circum-Arctic scale. In this study, we define and evaluate the “Arctic Permafrost Vulnerability Index” (APVI) as an indicator-based assessment tool to explore the vulnerabilities of Arctic permafrost subregions to permafrost thaw. This exploratory index combines nineteen physical and socioeconomic indicators to reflect the differences in exposure and adaptive capacities in the context of permafrost thaw. The APVI is an exploratory exercise to inform scientists and policymakers about the impacts of permafrost thaw and to facilitate decision-making in terms of prioritizing adaptation actions or allocating resources to adapt to permafrost thaw at the pan-Arctic scale. Bringing a wide range of perspectives on the differences in vulnerability to permafrost thaw across Arctic subregions, the APVI allows comparisons across different geographic areas.

2. Materials and Methods

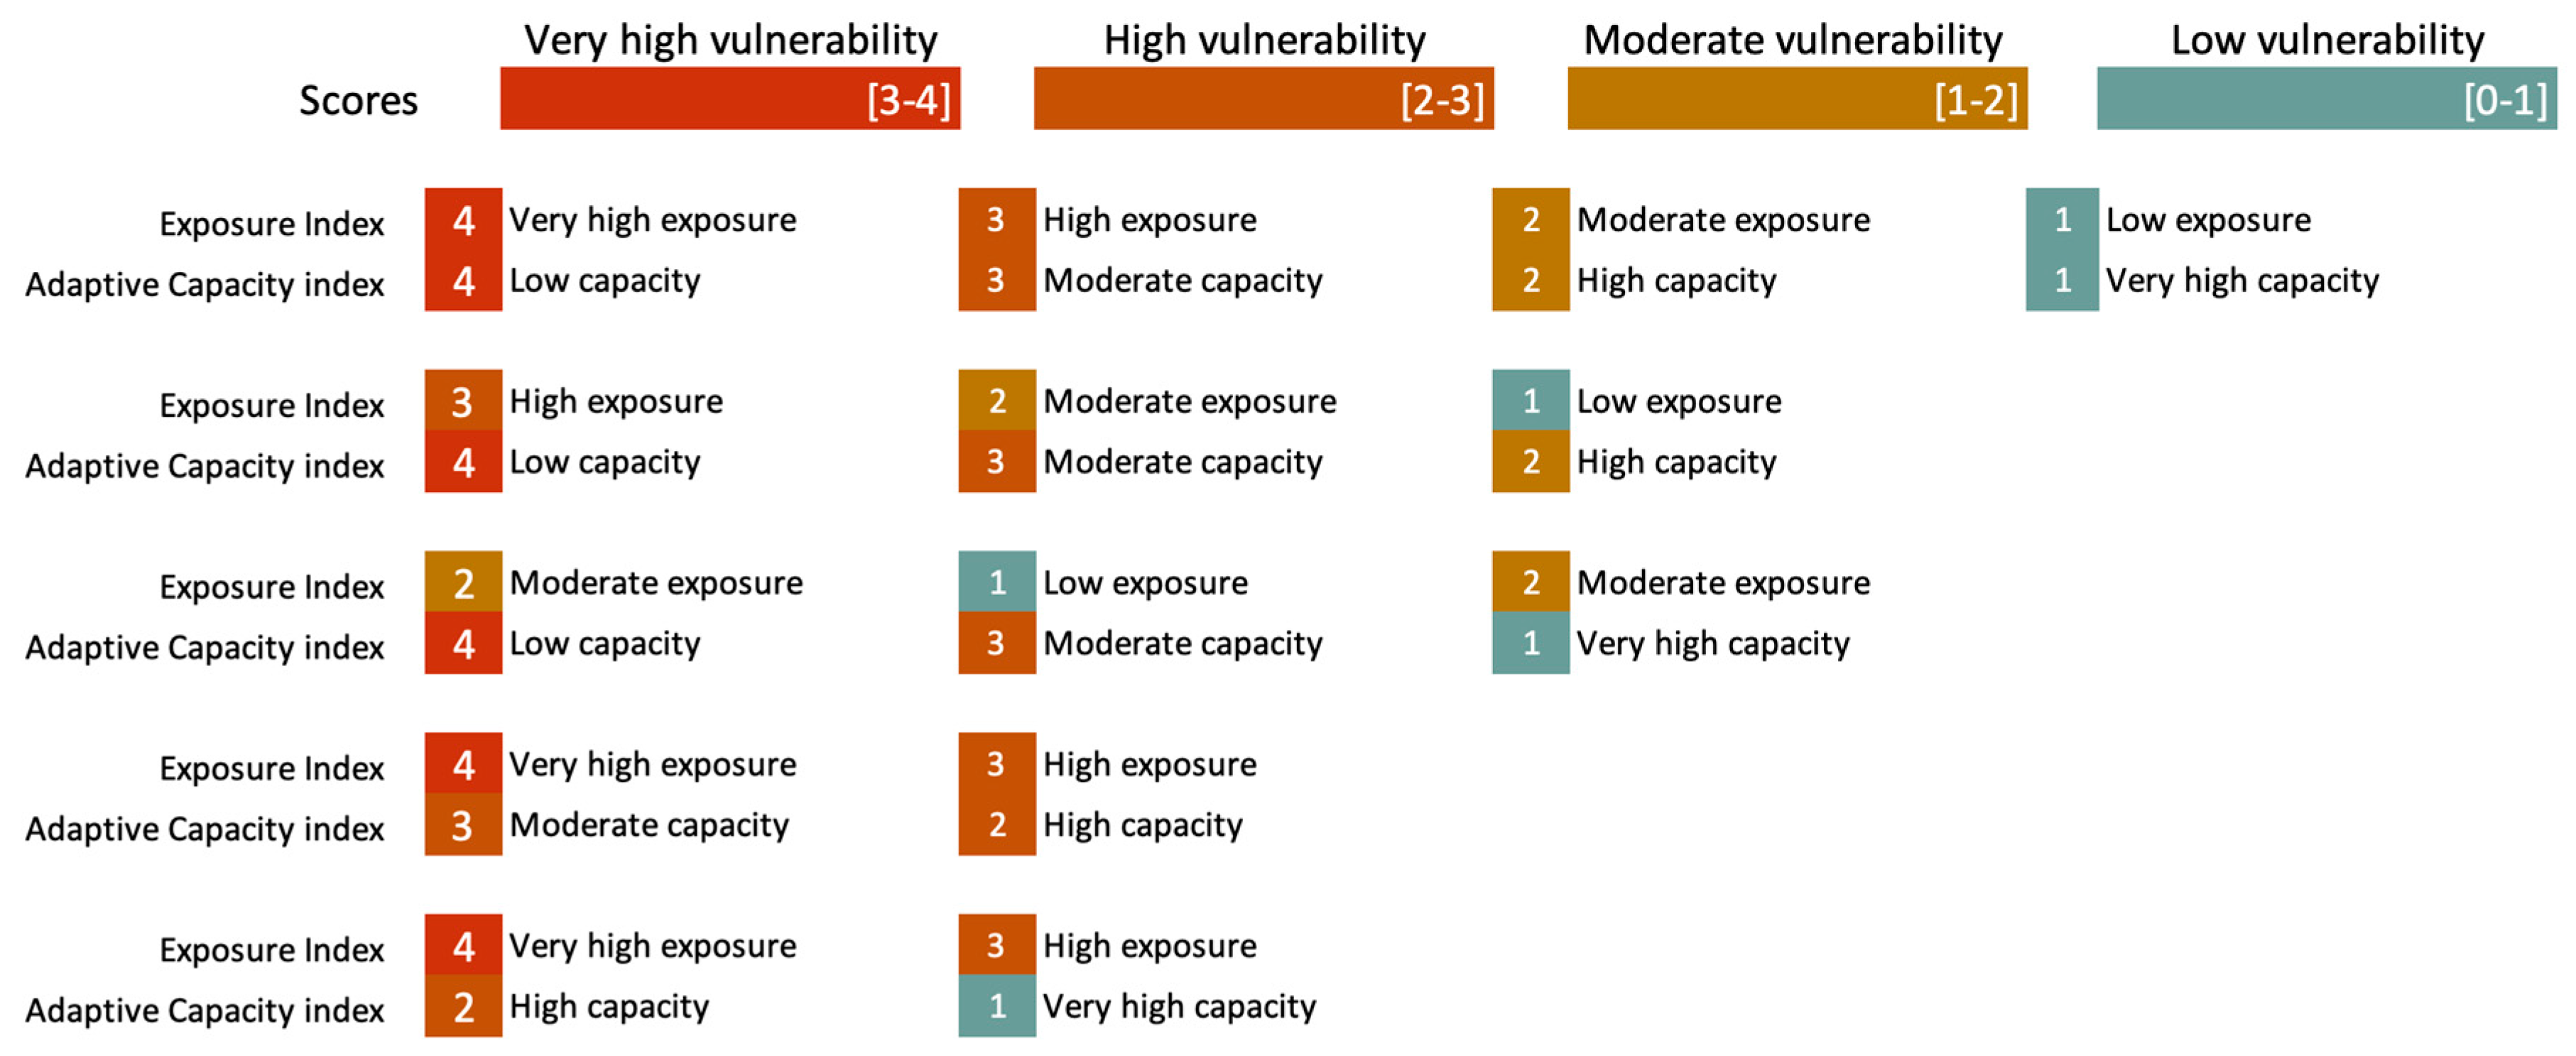
2.1. Defining Vulnerability, Exposure, and Adaptive Capacity

We used a vulnerability-based approach to design the APVI model, defining the vulnerability of an Arctic subregion as follows:
Vst = f (Est, ACst);
where the vulnerability (V) of an Arctic subregion (s) at time (t) is a function of its exposure to permafrost thaw (E) and adaptive capacity (AC). Combined, we obtain a vulnerability score. Exposure and adaptive capacity scores range from low (1) to very high (4) vulnerability to permafrost thaw (Figure 1).
We adopt the following definitions of exposure as “the potential occurrence of a natural or human-induced physical event or trend that may cause loss of life, injury, or other health impacts, as well as damage and loss to property, infrastructure, livelihoods, service provision, ecosystems and environmental resources”. (Annex II, IPCC WGII Sixth Assessment Report) [25] and adaptive capacity as “the ability of systems, institutions, humans and other organisms to adjust to potential damage, to take advantage of opportunities, or to respond to consequences” [26].

2.2. Choosing Pertinent Indicators in the Context of Vulnerability to Permafrost Thaw

While conceptualizing the APVI, the development, collection, and measurement of the physical and social indicators were key methodological steps. Indicators are measures that estimate the conditions and trends of a system, simplifying complex realities into manageable and meaningful information. Indicators are useful for planning, informing policy, and guiding decisions and actions. Groups such as governments and non-governmental organizations are increasingly using indicators—social, environmental, and economic—to monitor trends in physical and human systems.
The selection of indicators for the APVI was based on a range of criteria such as data availability, affordability, robustness, scalability, and inclusiveness. As described in the Arctic Social Indicator report [27], data availability is concerned with whether the data that an indicator will use as a measure exist, and whether they are retrievable. Data affordability considers the ongoing costs of data collection and monitoring. Indicators that can be garnered from datasets that are regularly collected, for example, during government censuses, are more affordable than those requiring special tabulation or primary data collection. Robustness considers aspects of the temporal stability of the indicator over time. Scalability is concerned with the extent to which the data used to measure the chosen indicator can be collected at different geographical scales. Inclusiveness considers whether the indicator considers all aspects of the Arctic population, e.g., genders, ages, origins, geographies, etc. Additionally, we also favoured indicators that reflected the interests and views of different stakeholders living on permafrost.

2.3. Implementing the APVI

We calculated the Arctic Provisional Vulnerability Index (APVI) scores for each exposure and adaptive capacity indicator at the subregional level. To achieve this, we overlapped the spatial layers of these indicators using ArcGIS Pro 2.9 software. We then computed the mean values of the scores for exposure and adaptive capacity for each subregion. Exposure datasets were available as raster data, which are gridded data where each pixel is associated with a specific geographical location. To obtain a value for an entire subregion, we calculated the mean value of the pixels within one subregion. In contrast, the adaptive capacity indicators consist of discrete variables that are available at either regional or subregional scales. The implementation of the APVI only included indicators that were available at the Arctic subregional scale. For most (17) indicators (Supplementary Table S1), data were available and retrieved for all Arctic subregions. Some adjustments to the data were made in Greenland where a new administrative division took place in 2018, separating the region of Qaasuitsup into two new divisions: Avanaata in the north and Qeqertalik in the south. The available data were anterior to the new division; thus, we attributed the data from the former Qaasuitsup region to Avanaata and Qeqertalik.
For some of the selected indicators, data were not available at a subregional scale or were simply non-existent. These indicators were not included during the implementation of the APVI. Indicators were not weighted since some indices might be more relevant in some subregions than in others.

3. Results and Discussion

3.1. Selected Indicators

The combination of a set of nineteen existing physical and social indicators in this framework provides a way for Arctic permafrost subregions to assess their levels of exposure to permafrost thaw and their adaptive capacity to adjust to these changes. The indicators and the thresholds that we set for each are described below and in Table 1. A list of data sources is presented in Supplementary Table S1.

3.1.1. Exposure Indicators

The exposure index (E) includes seven indicators chosen to assess the level of exposure of a subregion to permafrost thaw (Table 1). These indicators are grouped into four types of exposure: soils, landscapes, infrastructure, and health.
Soils
The coverage of permafrost indicates the percentage coverage of permafrost in 2019. The data are a product from the European Space Agency Climate Change Initiative (ESA_CCI), named Permafrost_cci [29]. The Permafrost_cci product models several ground parameters (e.g., ground temperature, active layer thickness, and permafrost fraction and zone) and results from a seven-model ensemble that account for the spatial variability of land cover and ground stratigraphy, as well as snow depth, to compute a permafrost fraction [2]. We used the estimated coverage of permafrost for the year 2019 and grouped permafrost types as sporadic, discontinuous, and continuous.
We set thresholds to reflect the potential of an area to be exposed to permafrost thaw, assuming that the more coverage of permafrost in a subregion, the more exposed to changes related to permafrost thaw this subregion is.
Changes in the permafrost’s extent reflect the variability in permafrost stability. The same Permafrost_cci product was used, and thresholds were defined to reflect trends in the permafrost extent between 1997 and 2019, assuming that exposure increases with the number of ensemble members that have shifted from permafrost to non-permafrost.
We established thresholds to reflect the shifts in the number of ensemble members from permafrost to non-permafrost conditions: a shift in one ensemble member (1/7) from permafrost to non-permafrost between the first (1997) and last (2019) years resulted in a change of 13%, a shift in two ensemble members (2/7) resulted in a change of 26%, and three or more ensemble members resulted in a change of 39% or more.
Ground ice is a key environmental predictor of rapid changes in the permafrost landscape, and its distribution controls specific processes and impacts of thaw on permafrost terrain. The ground ice dataset used in the APVI is from [28], where the relative abundance of ground ice was established based on qualitative estimates of the percentage of ice in the upper 10–20 m of the ground, including the volume of segregation ice, injection ice, and reticulate ice. In the APVI, the ground ice type assigned within a subregion is the one covering the largest part of the subregion (the highest percent coverage of a ground ice type, from 1 to 4).
We set thresholds to reflect variations in the amount of ground ice, overburden thickness, and permafrost extent (Figure 2), assuming that areas with a higher ice content and a thin overburden are more exposed to thawing.
Landscapes
Thermokarst refers to landforms resulting from ice-rich ground thawing and causes substantial land subsidence and lateral soil transport that can affect infrastructure, heritage sites, and hunting grounds [13,17,30,31]. The dataset used in the APVI describes the probability of three types of thermokarst occurring in the northern boreal and tundra circumpolar permafrost regions: wetlands, lakes, and hillslope features [32].
We adapted the thresholds defined by [32] into four thresholds by merging two of the five levels of exposure to thermokarst (low probability, <10% coverage and no probability, 0% coverage). Thus, subregions with a 60–100% probability of thermokarst are defined as being very highly exposed to permafrost thaw. Subregions with a 30–60% probability have high exposure, 10–30% have moderate exposure, and less than 10% have low exposure.
Coastal erosion is one of the main causes of land loss in the Arctic [8]. Communities exposed to high rates of coastal erosion are facing relocalization and a loss of cultural and subsistence grounds [17,33]. The APVI uses estimates of coastal erosion rates from the Arctic Coastal Dynamic Database (ACD, [34]). Exceptions were made for Greenland, where the ACD only covers the northern coast and for Svalbard, where coastal erosion rates are missing. For Greenland, we assumed similar rates for the entire coast; while for Svalbard we complemented the ACD with the erosion rates from [35]. We calculated the average coastal erosion rate for each coastal subregion by multiplying the length of each coastline affected by erosion by its erosion rate and then dividing by the total length of the coastline. Exposure thresholds for coastal erosion follow the ACD classification from stable or aggrading (at or below 0 m/y−1) to rapid erosion rates (above 2 m/y−1).
Infrastructure
The exposure of a subregion to permafrost thaw depends on the presence or absence of infrastructure in an area. The APVI uses an indicator of infrastructure zonation hazard, characterizing areas of varying potential for damage to infrastructure related to near-surface permafrost degradation [30,35]. More specifically, the APVI uses the consensus of geohazard indices (Ic) that distinguish between areas with low (0) to high (4) hazard potential [36]. We applied the same as [36], using a nested-mean approach, where subregions with a low hazard potential are assumed to have a low exposure to permafrost thaw, and the ones with a high hazard potential have a very high exposure to permafrost thaw.
Health
The potential of anthrax outbursts results from a model by [37], who investigated the spatial suitability of the Arctic region for the re-emergence of anthrax. This study relies on the Maxent statistical learning tool [38,39,40] and analyzes the probability of finding anthrax given a set of chosen environmental drivers. We further implemented the results and, instead of the raw values obtained by [37], chose a logistic outcome [41] that returns the percentage of anthrax presence. We then set thresholds to classify anthrax risk and calculated them considering the entire study area used in [37]. We calculated the 1st and 3rd quartile to define, respectively, ‘low’ and ‘high’ exposure (i.e., from ‘low’ to ‘moderate’ and from ‘high’ to ‘very high’). The intermediate threshold, from ‘moderate’ to ‘high’ exposure, was set by computing the overall average. The obtained values are listed in Table 1. These values should be considered as the first attempt to define anthrax risk in the Arctic; therefore, they still do not quantify the effective risk of potential outbreaks. In fact, the results obtained by [37] should be considered preliminary, and their interpretation should be evaluated with caution, as also stressed by the authors, because of the lack of more accurate data.

3.1.2. Adaptive Capacity Indicators

Current and future climate change impacts are closely linked to the adaptive capacity of affected regions and populations. The APVI adaptive capacity (AC) index is designed to assess this capacity by combining social indicators to identify the socioeconomic ability of populations to respond to changes in permafrost conditions. The index integrates twelve indicators, grouped into four main categories: demographic, knowledge, and economic capacities. These categories are the principal drivers of a population’s ability to prepare for, respond to, cope with, and recover from the impacts of climate change. The thresholds set for the APVI are aligned with overall Arctic trends and are detailed in Table 1. The scores do not directly reflect an incapacity or full capacity to adapt to changes related to permafrost thaw. Instead, they identify vulnerable populations from demographic, knowledge, and economic perspectives.
Demographic capacity: The demographic capacity refers to the characteristics and dynamics of a population that influence its ability to adapt to climate change. This includes factors such as age distribution, population density, migration patterns, and health status. Younger populations may have greater physical resilience and adaptability, while older populations might face more challenges in coping with climate impacts. Migration patterns also play a crucial role, as populations moving away from vulnerable areas can reduce risk but may also lead to challenges in integrating into new regions. Understanding demographic capacity is essential for developing targeted strategies to enhance resilience and ensure that all segments of the population can effectively respond to climate change.
The APVI includes two stock indicators and two flow indicators to assess demographic vulnerability to permafrost thaw. The two stock indicators are age structure and gender balance, while the two flow indicators are natural change and net migration. A risk or set of risks is identified if the demographic profile of the population is significantly skewed in one direction or another.
The age structure is represented by the youth dependency ratio (0–14 years old), working-age population ratio, and old-age dependency ratio (above 64 years old). From a demographic perspective, to ensure slow growth, communities should have balanced ratios [42], with a young population of 25 percent of the total population, a working-age population of 60 percent, and an old-age population of 15 percent. Below or above these, communities become more demographically vulnerable to sustain growth; thus, they might have a lower capacity to adapt to climate change.
The gender balance is defined as the ratio of males to females, with a balanced ratio set at 100 (the number of males divided by the number of females, multiplied by 100). In the context of the APVI, we believe that an equal gender balance is essential for strengthening a population. We have established capacity thresholds based on this principle. Subregions with a gender ratio between 99 and 101 are classified as having very high capacity. Conversely, any subregion with a significantly skewed gender ratio is considered more vulnerable and less able to adapt to changes.
The natural change is the number of births minus the number of deaths. Thresholds set in the APVI reflect the optimal natural increase in a population [43], with levels above 2.5 (births minus deaths per thousand persons) ensuring slow but steady population growth. Levels above this reflect a fast-growing population, and levels below this reflect a stagnating population or even a declining population when the ratio is negative. The rate of population increase is largely determined by age structure and, to a lesser extent, by levels of fertility and mortality.
The net migration rate is the ratio of migrants to out-migrants. The balanced ratio is 0 (defined as in-migrants minus out-migrants per thousand people). If it is negative, it can deprive the community of resources; if it is positive, it can overwhelm the community. Migration responses to climate change may be treated as a range of possible responses that people take when sensitive systems are exposed to stressed or changing environmental conditions. The thresholds set in the APVI reflect balanced levels of net migration around 0 and identify subregions with high levels of in or out migration as having less capacity to adapt to changes. Arctic communities often have wide swings in migration because of their small population size and their narrow economic bases [44]. In the Arctic, women pursue higher education to a greater extent than men; consequently, they out-migrate at a higher rate [45].
Knowledge capacity: there is a growing agreement that knowledge and education contribute to reducing vulnerabilities and enhancing adaptive capacities [42,46,47,48,49]. Different types of knowledge exist and are represented in the APVI. Societies with higher educational attainment are reported to have better preparedness and response capacity to disasters and are able to recover faster [49]. Traditional knowledge is a major determinant of vulnerability reduction in the Arctic, as it reinforces the capacity to adapt to changes at the local scale [50,51]. Traditional knowledge increases one’s capacity to understand the surrounding environment and facilitates adaptation to environmental changes occurring in this environment [52]. This capacity is reinforced through sharing mechanisms, strong social links, increased mobility on land, and flexibility [33,52,53]. Local knowledge—the type of knowledge gained from having lived in a certain area for many years—is recognized as crucial in increasing adaptive capacity to climate change [53]. Local knowledge is considered important to adapt to climate change in Arctic communities without Indigenous people.
The tertiary education level reflects the proportion of the working-age population with a degree obtained three years after high school. The thresholds that we set in the APVI consider that communities with 30% or more of their population holding tertiary degrees have a higher capacity to adapt [27].
The traditional knowledge in the APVI is represented by the share of the Indigenous population in a community. There is no agreement on a circumpolar definition of indigeneity and no available dataset at a subregional scale. The APVI uses the number of Indigenous people based on various national definitions of indigeneity [54]. The thresholds set in the APVI rely on the hypothesis that the Indigenous population carries traditional knowledge that is highly valuable and that it facilitates adaptation to changes [52,55], defining communities with less than 20% of Indigenous people as more vulnerable to change in permafrost conditions.
The APVI uses the residency length as an indicator of local knowledge. The residency length refers to the number of years people live within a community. There is no dataset available at a subregional scale for this indicator. When available, thresholds of residency length consider that people living for at least 10 years in the same community have a better understanding of its social functions and surrounding environment and therefore might have a better capacity to adapt to any changes. The higher the number of inhabitants with at least ten years of residency, the better the capacity to adapt to changes. A limitation of this threshold is that the longer people live in a community, the lower their capacity to relocate, which might make them more vulnerable when environmental change is irreversible [56].
Economic capacity: the economic capacity in the APVI is represented by three indicators; the income per capita, the share of employment by economic activity, and the share of subsistence income within a subregion.
The average income per capita is represented by the Gross Regional Product (GRP) per capita in Purchasing Power Parity (PPP) in EUR at the 2017 prices. We established thresholds based on the statistical profiles of all Arctic regions following the natural break method. The Jenks Natural Breaks method identifies actual breaks to preserve the clustering of data value subjects [57]. Social transfers were not included in the calculations.
Employment by economic activity provides information on employment within economic branches and allows the identification of subregions with unbalanced employment profiles. Subregions that do not have a balanced profile are considered more vulnerable to shocks related to political, economic, or climatic changes. The APVI uses employment as a branch of economic activity following the International Standard Industrial Classification (ISIC-Rev. 4) that identifies six branches: agriculture (A); manufacturing (C); construction (F); mining and quarrying; electricity, gas, and water supply (B-E); market services (G-N); non-market services (O-U). We hypothesize that a balanced employment profile is achieved at the national level, and from there, we compare the balance of employment by the economic activity of a subregion to its national level. The threshold values set in the APVI reflect the divergence of regional or subregional levels from the national level. The shares of employment in each branch from a region or subregion were compared to the national shares of employment and classified as follows: high vulnerability (less than two out of six of economic branches are balanced), moderate vulnerability (three out of six of economic branches are balanced), moderate capacity (four out of six of economic branches are balanced), and high capacity (more than five out of six of economic branches are balanced).
The share of subsistence income is the percentage of value obtained through subsistence activities (hunting, fishing, harvesting, and gathering) in the total individual income. This indicator reflects the capacity of a community to be self-sufficient and to maintain food security [51,58]. Data availability for this indicator is scarce and not available for all subregions. We established thresholds based on the idea that having either too low or too high a proportion of subsistence activities in a community can increase vulnerability. This dependency on, or lack of, subsistence activities can hinder a community’s ability to respond to economic or environmental changes. While permafrost thaw has a relative negative influence over the vulnerability of the food systems in communities with a high subsistence economy, these communities are so far highly resilient and have shown a capacity to adapt by changing hunting and fishing grounds and techniques [22,59,60]. Maintaining some subsistence income can compensate for the shocks and uncertainties of imports in food supply due to damaged infrastructure.

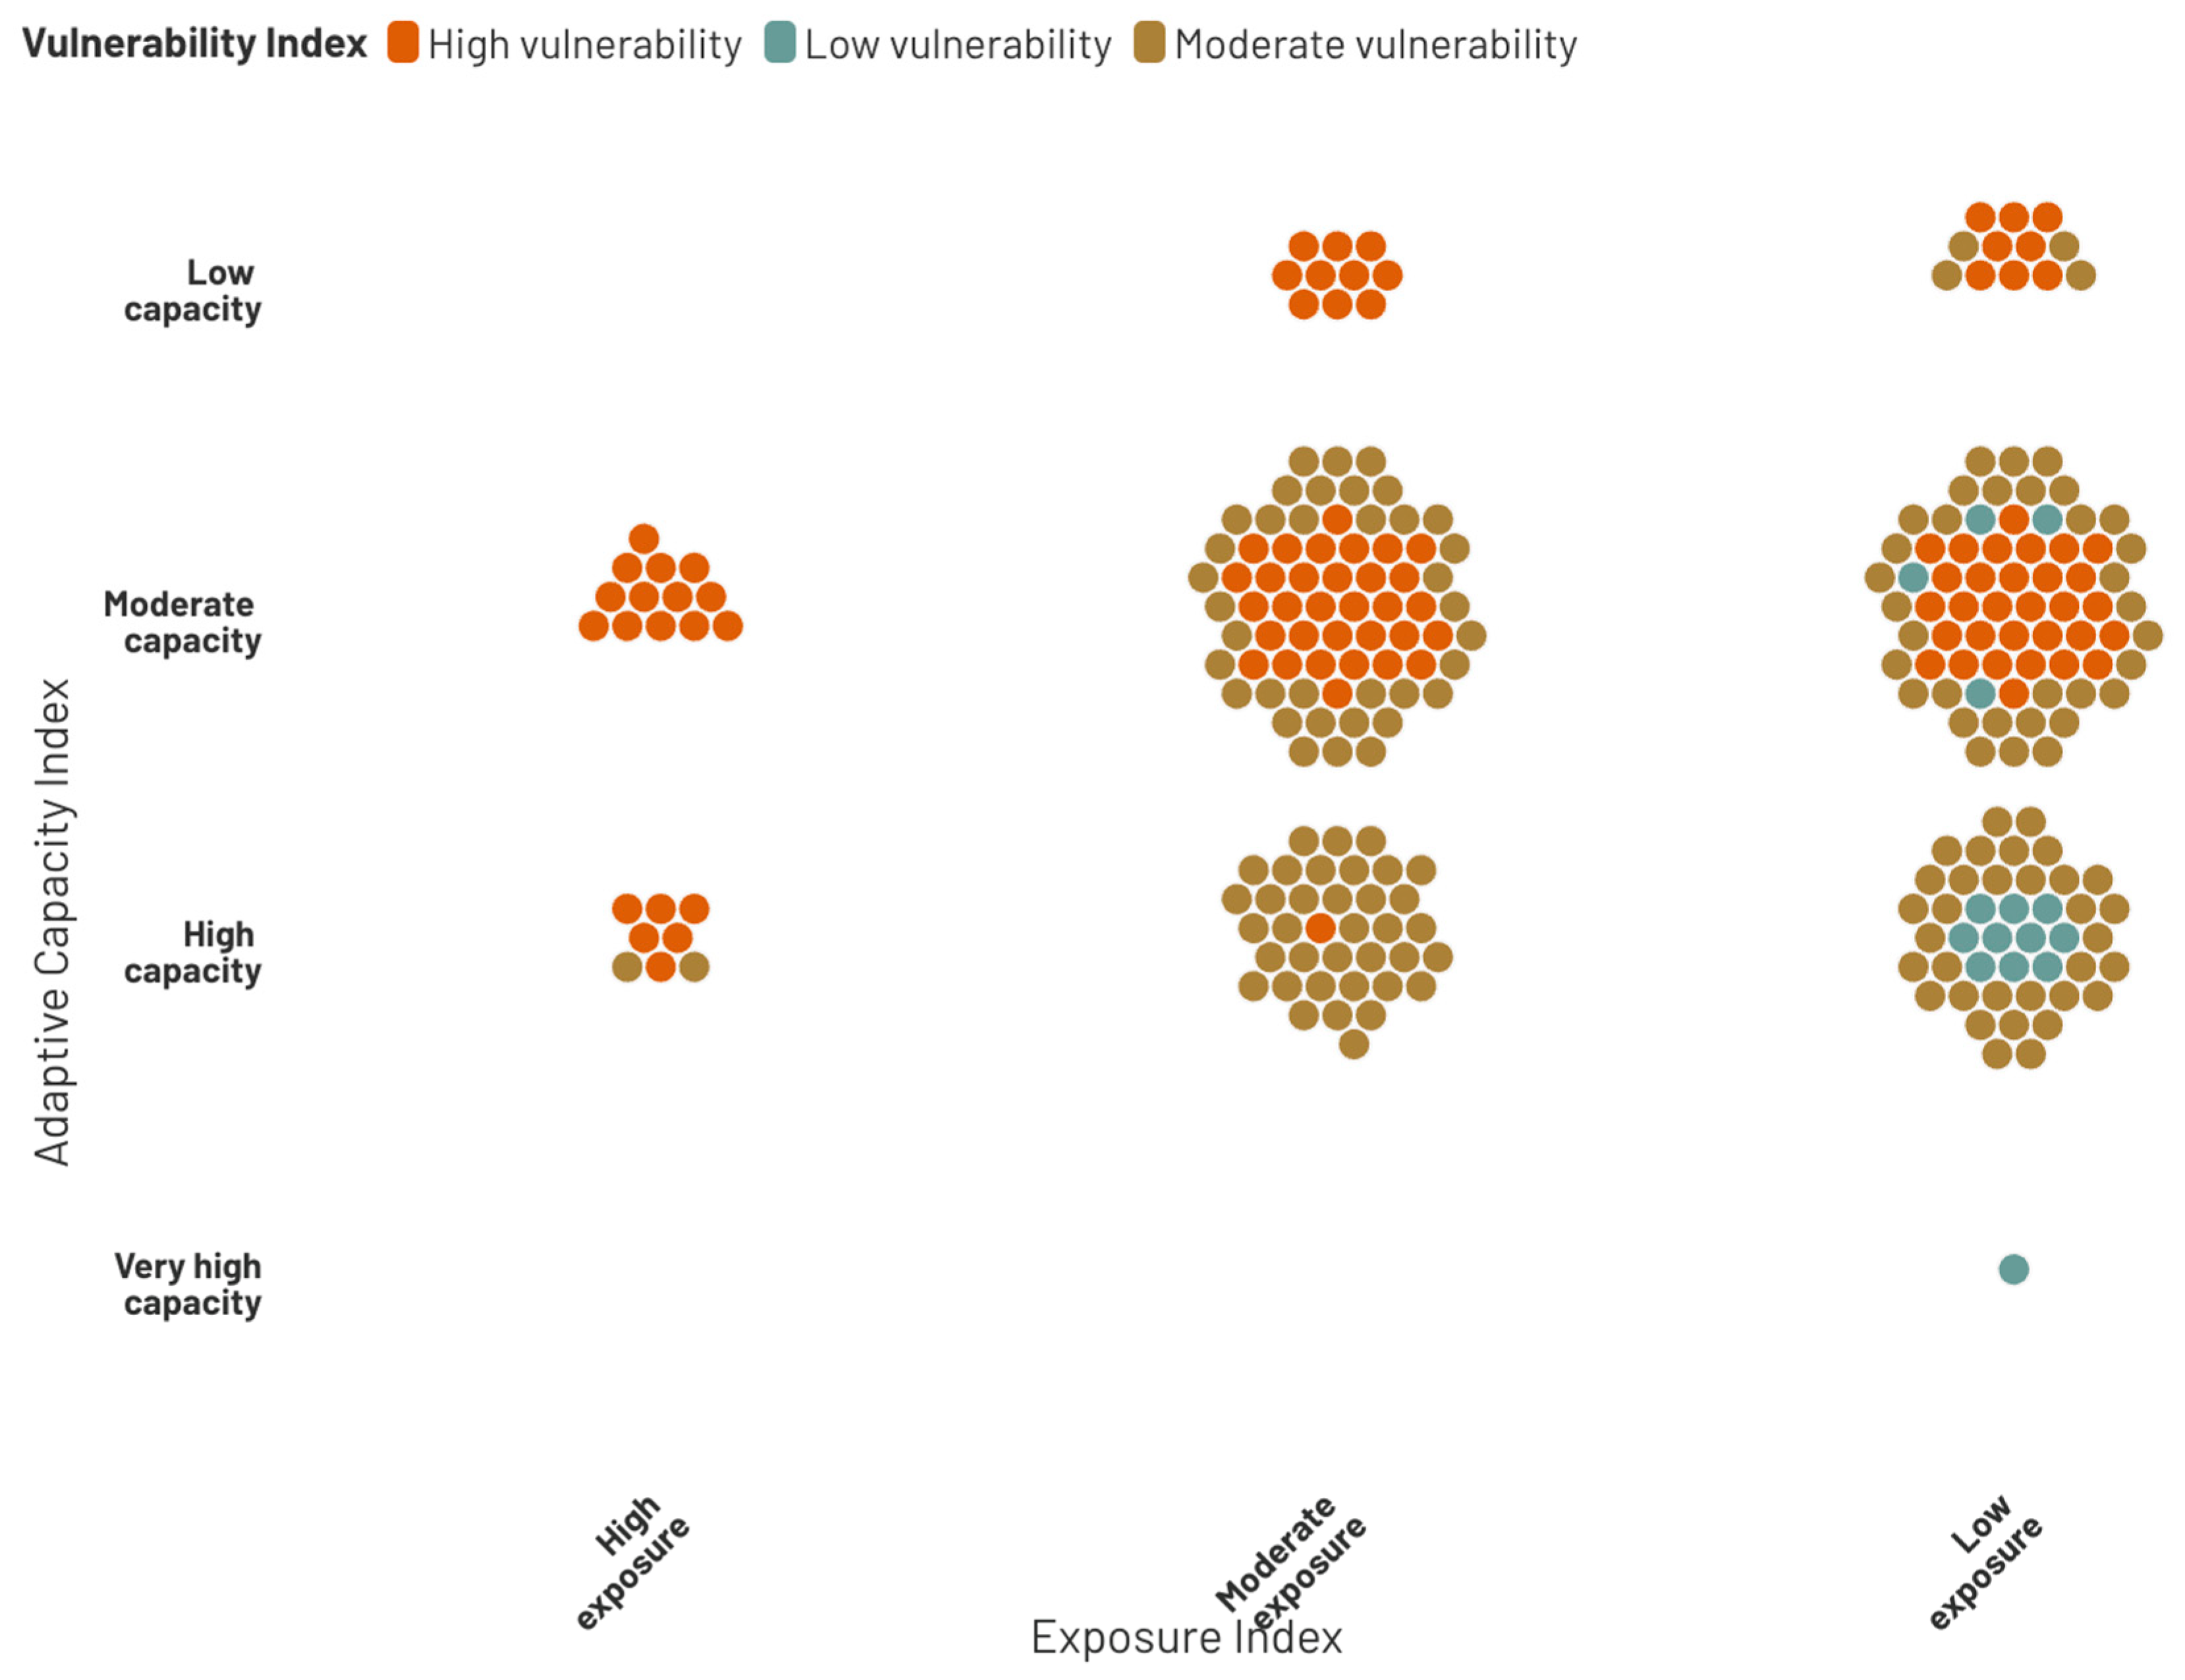
3.2. Difference in Vulnerability to Permafrost Thaw

In this section, we describe the results of the APVI implementation. These results should be considered exploratory in regard to the limitations described in Section 3.3. Within the Arctic Circumpolar Permafrost Region, 147 subregions (36%) had a percentage coverage of permafrost that was less than 1% and were thus considered not vulnerable to permafrost thaw and not included in the analysis.
Figure 3 summarizes the results of the Arctic Permafrost Vulnerability Index implemented for the 260 subregions on permafrost in the ACPR. The detailed scores for each indicator and subregion and maps illustrating the exposure and vulnerability scores are available in Supplementary Table S2 and Figure S1, respectively. Most of the subregions (99%, n = 258) had a moderate vulnerability to permafrost thaw, with a mean vulnerability score of 2.5. Only two subregions, located on the southern fringe of the ACPR, had a low vulnerability to permafrost thaw (vulnerability scores < 2; Djúpavogshreppur in Iceland and Kondinskiy Rayon in the Russian Federation). Five subregions, all located in the Russian Federation, were identified as highly vulnerable to permafrost thaw (vulnerability scores between 3.0 and 3.1; Novaya Zemlya, Yagodninsky, Srednekansky, Vorkuta, and Pevek).
Seventy percent of the subregions in the ACPR (n = 182) had a high exposure to permafrost thaw (Figure 3), whereas 28% (n = 73) had a moderate exposure to permafrost thaw. While none of the subregions had a low exposure to permafrost thaw, four subregions had a very high exposure to permafrost thaw (Regions 2 and 4 in Canada; Zapoljarn and Yamal Peninsula in the Russian Federation). There, the exposure scores reflected the critical changes in permafrost coverage in the past few decades (medians of −22%, −33%, −33%, and −17%, respectively), large ground ice contents, and high probabilities for thermokarst (medians of 46%, 34%, 62%, and 95%, respectively). Additionally, the infrastructure within these four subregions was at high risk due to permafrost thaw (scores of 3 and 4).
The adaptive capacity scores indicate that 74% (n = 193) of the subregions had a moderate adaptive capacity to respond to permafrost thaw, whereas 26% (n = 67) had a low adaptive capacity to permafrost thaw (Figure 3). Most of the subregions with a low adaptive capacity are in the Nordic Region or the Russian Federation, and these scores were driven by skewed old-age dependency ratios, an absence of Indigenous populations, and low rates of natural increase. These subregions also had weak economic capacities due to low GRP and disbalanced employment profiles with a lack of representation of employment in some economic sector due to the narrow economic base of local economies. The adaptive capacity scores resulting from the APVI suggest that none of the subregions have a high or very high adaptive capacity to respond to permafrost thaw. Adaptive capacity indicators tend to be indirect and are generally intertwined with other factors, complicating the task of isolating the impact caused by thawing permafrost.

3.3. Limitations to the APVI

Indexes are a way to measure, simplify, and communicate the complex reality of a situation. While useful for comparisons across different entities in space and time, and for conveying complex issues, they have their set of limitations.

3.3.1. Subjectivity and Lack of Indicators

The subjectivity introduced at each step of the APVI conceptualization (e.g., indicator selection, variable transformation, definition of thresholds, scaling, and aggregation) should be acknowledged.
Differences in data protocols, quality, availability, and access between regions and nations complicate comparisons and limit the use of some relevant indicators. Data challenges may require a need to deviate from the technical definition of an indicator and may necessitate adjustments in the analysis to meet the regional availability of data. In some cases, proxies or alternative indicators are used to address the lack of data availability. This is the case in the APVI when selecting GRP as the main economic indicator. While GRP per capita is a relatively straightforward statistic to measure, it has certain limitations, among which it includes all sources of income, whether it remains in the subregion or not. A more accurate way to represent the economic capacity of a subregion would be to include the household income and the monetary value of subsistence harvest, but such measures may require primary data collection and are, therefore, more costly [27].
Uncertainties related to indicators derived from models are a significant challenge in environmental and climate research. This is the case with many exposure indicators used in the APVI. These uncertainties arise from various sources, including model structure, input data, and parameter estimation. Structural uncertainties stem from the simplifications and assumptions made during model development, which can introduce biases and limit the model’s ability to represent complex real-world systems. Input data uncertainties are due to the variability and potential inaccuracies in the data used to drive the models. This can include measurement errors, incomplete datasets, and temporal or spatial inconsistencies. Parameter uncertainties occur when the values used for model parameters are not well constrained, leading to a range of possible outcomes. It is important to recognize that these uncertainties are inherent to the APVI.
The lack of data availability for some of the APVI indicators in a few subregions may also affect the final vulnerability scores drastically. For example, some subregion’s adaptive capacity scores were lowered due to the absence of Indigenous populations. However, the absence of Indigenous knowledge can be compensated by local knowledge, which is not taken into account in the APVI due to a lack of data on, e.g., residency time.
Finally, in the present APVI, the lack of indicators reflecting the institutional capacities of Arctic subregions to address the impacts of permafrost thaw is a weakness that we acknowledge. Although institutional capacity is one of the key factors influencing the adaptive capacity in the context of climate change [61], indicators are often context-specific and thus not easily available at a pan-Arctic level.

3.3.2. Top-Down and Static Approach

Indicator-based assessments are often criticized for not being context specific and too static, thus not able to represent the dynamic nature of adaptation capacities on different spatial and temporal scales.
As with many indicator-based assessments, the APVI introduce a top-down approach that hides a complex reality [62,63]. The APVI does not reflect landscape heterogeneities or socioeconomic disparities at the local scale because most selected indicators are only available for the Arctic at the subregional or regional level. Yet, they prove to be useful to make comparisons across scales and carry valuable information to inform adaptation, risk management, and development policies.
Many APVI indicators are static and do not consider recent or future changes that reflect trends in the physical and socioeconomic environments. Only one set of selected indicators brings a temporal aspect to expressing the exposure to permafrost thaw. None of the selected indicators consider future changes. In this regard, the APVI does not evaluate or provide scenarios regarding future vulnerability to permafrost thaw but reflects the current vulnerability to permafrost thaw.
The APVI is an exploratory exercise; thus, we recommend using the APVI as an informative tool to obtain an initial overview of the current level of vulnerability across the Arctic Permafrost region. The interpretation of the APVI scores needs to be made in dialogue locally with local and/or Indigenous communities as place-based approaches deliver more accurate assessments of vulnerability [64].

4. Conclusions

The APVI is a conceptual index that aims to explore the vulnerability of Arctic subregions to permafrost thaw. The APVI provides a way forward to evaluate differences in vulnerability to permafrost thaw, considering both the exposure to permafrost thaw and the capacity of a subregion to adapt to changes. It highlights interactions between complex exposure–sensitivity indices at regional or subregional scales, although it does not provide detailed analysis for adaptive strategies to address these interactions at the community and individual/family level. Applied to 260 subregions in the Arctic Circumpolar Permafrost Region, the APVI indicates that most of the subregions (97%, n = 253) have a moderate vulnerability to permafrost thaw. However, this overall vulnerability score overlooks differences in exposure and adaptive capacity indices. The majority of the subregions (70%, n = 183) had a high exposure to permafrost thaw, whereas 28% (n = 73) had a moderate exposure to permafrost thaw. The adaptive capacity index shows that 74% (n = 193) of the subregions had a moderate adaptive capacity, whereas 26% (n = 67) had a low adaptive capacity to respond to permafrost thaw. Owing to limitations in data availability, the APVI can be applied at a regional or subregional scale, but not at the municipal or community level. Thus, the APVI does not reflect heterogeneities in vulnerabilities at the local scale and might blur differences between rural and urban areas. The APVI should be used as a base index but needs to be completed with an in-depth analysis of the physical and social characteristics of each subregion and interpreted in consultation with local populations. More effort in producing Arctic-specific indicators and improving the availability of the existing ones should be prioritized.

Supplementary Materials

The following supporting information can be downloaded at: https://www.mdpi.com/article/10.3390/su17083288/s1, Table S1: List of datasets used to measure the vulnerability scores based on the APPVI at the subregional level in the Arctic [28,31,34,54,65,66,67,68]; Table S2: Results of the adaptive capacity or exposure scores for each indicators used in the Arctic Permafrost Vulnerability Index. The adaptive capacity index is calculated as a result of the scores of social indicators (AC_sum, AC_med, AC_av). The exposure capacity index is calculated as a result of the scores of the physical indicators (EX_sum, EX_med, EX_av). The vulnerability index combines the results of the adaptive capacity and the exposure indexes (VI_sum, VI_med, VI_av). Figure S1: Scores from the Arctic Permafrost Vulnerability Iindex (C) applied to Arctic subregions within the Arctic Circumpolar Permafrost Region (ACPR). The population vulnerability index aggregates the scores of the exposure (A) and adaptive capacity (B) indices.

Author Contributions

Conceptualization, J.R.; methodology, J.R., L.J., T.H., J.N.L., M.C., S.W. and E.S.; formal analysis, J.R. and A.V.; writing—original draft preparation, J.R.; writing—review and editing, J.R., L.J., T.H., J.N.L., M.C., S.W. and E.S.; visualization, A.V.; funding acquisition, J.R. All authors have read and agreed to the published version of the manuscript.

Funding

This study received funding from the European Union’s Horizon Program for the projects Nunataryuk (no. 773421) and ILLUQ (no. 101133587). J.R. received additional funding from the Swedish Academy of Science (Formas) under the grant number FR-2021/0004. S.W. acknowledges financial support by the ESA Permafrost CCI project (4000123681/18/I-NB, 2023).

Institutional Review Board Statement

Not applicable.

Informed Consent Statement

Not applicable.

Data Availability Statement

The original contributions presented in this study are included in the article/Supplementary Material. Further inquiries can be directed to the corresponding author.

Conflicts of Interest

The authors declare no conflicts of interest. The funders had no role in the design of the study; in the collection, analyses, or interpretation of data; in the writing of the manuscript; or in the decision to publish the results.

Abbreviations

The following abbreviations are used in this manuscript:
APVIArctic Permafrost Vulnerability Index
ACPRArctic Circumpolar Permafrost Region
ASIArctic Social Indicators

References

  1. Ramage, J.; Jungsberg, L.; Wang, S.; Westermann, S.; Lantuit, H.; Heleniak, T. Population living on permafrost in the Arctic. Popul. Environ. 2021, 43, 22–38. [Google Scholar] [CrossRef]
  2. Obu, J. How much of the earth’s surface is underlain by permafrost? J. Geophys. Res. Earth Surf. 2021, 126, e2021JF006123. [Google Scholar] [CrossRef]
  3. Rantanen, M.; Karpechko, A.Y.; Lipponen, A.; Nordling, K.; Hyvärinen, O.; Ruosteenoja, K.; Vihma, T.; Laaksonen, A. The Arctic has warmed nearly four times faster than the globe since 1979. Commun Earth Environ 2022, 3, 168. [Google Scholar] [CrossRef]
  4. Biskaborn, B.K.; Smith, S.L.; Noetzli, J.; Matthes, H.; Vieira, G.; Streletskiy, D.A.; Schoeneich, P.; Romanovsky, V.E.; Lewkowicz, A.G.; Abramov, A.; et al. Permafrost is warming at a global scale. Nat. Commun. 2019, 10, 1–11. [Google Scholar] [CrossRef] [PubMed]
  5. Li, G.; Zhang, M.; Pei, W.; Melnikov, A.; Khristoforov, I.; Li, R.; Yu, F. Changes in permafrost extent and active layer thickness in the Northern Hemisphere from 1969 to 2018. Sci. Total Environ. 2022, 804, 150182. [Google Scholar] [CrossRef]
  6. Nitze, I.; Grosse, G.; Jones, B.M.; Romanovsky, V.E.; Boike, J. Remote sensing quantifies widespread abundance of permafrost region disturbances across the Arctic and Subarctic. Nat. Commun. 2018, 9, 5423. [Google Scholar] [CrossRef] [PubMed]
  7. Walter Anthony, K.; Schneider von Deimling, T.; Nitze, I.; Frolking, S.; Emond, A.; Daanen, R.; Anthony, P.; Lindgren, P.; Jones, B.; Grosse, G. 21st-century modeled permafrost carbon emissions accelerated by abrupt thaw beneath lakes. Nat. Commun. 2018, 9, 3262. [Google Scholar] [CrossRef]
  8. Irrgang, A.M.; Bendixen, M.; Farquharson, L.M.; Baranskaya, A.V.; Erikson, L.H.; Gibbs, A.E.; Ogorodov, S.A.; Overduin, P.P.; Lantuit, H.; Grigoriev, M.N.; et al. Drivers, dynamics and impacts of changing Arctic coasts. Nat. Rev. Earth Environ. 2022, 3, 39–54. [Google Scholar] [CrossRef]
  9. Abass, K.; Doloisio, N.; Gartler, S.; Ingeman-Nielsen, T.; Ingimundarson, J.H.; Jungsberg, L.; Meyer, A.; Rautio, A.; Scheer, J.; Timlin, U.; et al. Thawing Permafrost in Arctic Coastal Communities: A Framework for Studying Risks from Climate Change. Sustainability 2021, 13, 2651. [Google Scholar] [CrossRef]
  10. Vonk, J.E.; Tank, S.E.; Bowden, W.B.; Laurion, I.; Vincent, W.F.; Alekseychik, P.; Amyot, M.; Billet, M.F.; Canário, J.; Cory, R.M.; et al. Reviews and syntheses: Effects of permafrost thaw on Arctic aquatic ecosystems. Biogeosciences 2015, 12, 7129–7167. [Google Scholar]
  11. Christensen, T.R.; Lund, M.; Skov, K.; Abermann, J.; López-Blanco, E.; Scheller, J.; Scheel, M.; Jackowicz-Korczynski, M.; Langley, K.; Murphy, M.J.; et al. Multiple Ecosystem Effects of Extreme Weather Events in the Arctic. Ecosystems 2021, 24, 122–136. [Google Scholar] [CrossRef]
  12. Ramage, J.; Kuhn, M.; Virkkala, A.M.; Voigt, C.; Marushchak, M.E.; Bastos, A.; Biasi, C.; Canadell, J.G.; Ciais, P.; López-Blanco, E.; et al. The net GHG balance and budget of the permafrost region (2000–2020) from ecosystem flux upscaling. Glob. Biogeochem. Cycles 2024, 38, e2023GB007953. [Google Scholar]
  13. Hjort, J.; Streletskiy, D.; Doré, G.; Wu, Q.; Bjella, K.; Luoto, M. Impacts of permafrost degradation on infrastructure. Nat. Rev. Earth Environ. 2022, 3, 24–38. [Google Scholar] [CrossRef]
  14. Gibson, C.M.; Brinkman, T.; Cold, H.; Brown, D.; Turetsky, M. Identifying increasing risks of hazards for northern land-users caused by permafrost thaw: Integrating scientific and community-based research approaches. Environ. Res. Lett. 2021, 16, 064047. [Google Scholar]
  15. Lytkin, V.; Suleymanov, A.; Vinokurova, L.; Grigorev, S.; Golomareva, V.; Fedorov, S.; Kuzmina, A.; Syromyatnikov, I. Influence of permafrost landscapes degradation on livelihoods of Sakha Republic (Yakutia) rural communities. Land 2021, 10, 101. [Google Scholar] [CrossRef]
  16. Ramage, J.; Jungsberg, L.; Meyer, A.; Gartler, S. ‘No longer solid’: Perceived impacts of permafrost thaw in three Arctic communities. Polar Geogr. 2022, 45, 1–14. [Google Scholar]
  17. Ford, J.D.; Pearce, T.; Canosa, I.V.; Harper, S. The rapidly changing Arctic and its societal implications. Wiley Interdiscip. Rev. Clim. Chang. 2021, 12, e735. [Google Scholar]
  18. Sokolickova, Z.; Meyer, A.; Vlakhov, A. Changing Svalbard: Tracing interrelated socio-economic and environmental change in remote Arctic settlements. Polar Rec. 2022, 58, E23. [Google Scholar] [CrossRef]
  19. Larsen, J.N.; Huskey, L. The Arctic Economy in a Global Context. In The New Arctic; Evengaard, B., Larsen, J.N., Paasche, Ø., Eds.; Springer International Publishing: Berlin/Heidelberg, Germany, 2015; ISBN 978-3-319-17601-7. [Google Scholar]
  20. Ford, J.D.; Champalle, C.; Tudge, P.; Riedlsperger, R.; Bell, T.; Sparling, E. Evaluating climate change vulnerability assessments: A case study of research focusing on the built environment in northern Canada. Mitig. Adapt. Strateg. Glob. Change 2015, 20, 1267–1288. [Google Scholar]
  21. Debortoli, N.S.; Sayles, J.S.; Clark, D.G.; Ford, J.D. A systems network approach for climate change vulnerability assessment. Environ. Res. Lett. 2018, 13, 104019. [Google Scholar]
  22. Naylor, A.W.; Ford, J.D.; Pearce, T.; Fawcett, D.; Clark, D.; van Alstine, J. Monitoring the dynamic vulnerability of an Arctic subsistence food system to climate change: The case of Ulukhaktok, NT. PLoS ONE 2021, 16, e0258048. [Google Scholar] [CrossRef] [PubMed]
  23. Kliskey, A.; Williams, P.; Abatzoglou, J.T.; Alessa, L.; Lammers, R.B. Enhancing a community-based water resource tool for assessing environmental change: The arctic water resources vulnerability index revisited. Environ. Syst. Decis. 2019, 39, 183–197. [Google Scholar]
  24. Spence, C.; Norris, M.; Bickerton, G.; Bonsal, B.R.; Brua, R.; Culp, J.M.; Dibike, Y.; Gruber, S.; Morse, P.D.; Peters, D.L.; et al. The Canadian water resource vulnerability index to permafrost thaw (CWRVIPT). Arct. Sci. 2020, 6, 437–462. [Google Scholar] [CrossRef]
  25. IPCC Annex II: Glossary. In Climate Change 2022: Impacts, Adaptation and Vulnerability; Pörtner, H.-O., Roberts, D.C., Tignor, M., Poloczanska, E.S., Mintenbeck, K., Alegría, A., Craig, M., Langsdorf, S., Löschke, S., Möller, V., et al., Eds.; Contribution of Working Group II to the Sixth Assessment Report of the Intergovernmental Panel on Climate Change; Cambridge University Press: Cambridge, UK; New York, NY, USA, 2022; pp. 2897–2930. [Google Scholar] [CrossRef]
  26. Millennium Ecosystem Assessment. Synthesis Report; Island Press: Washington, DC, USA, 2005; Volume 748. [Google Scholar]
  27. Larsen, J.N.; Schweitzer, P.; Fondahl, G. Arctic Social Indicators (ASI)—A follow-up to the Arctic Human Development Report. In TemaNord; Nordic Council of Ministers: Copenhagen, Denmark, 2010; Volume 519. [Google Scholar] [CrossRef]
  28. Brown, J.; Ferrians, O.; Heginbottom, J.A.; Melnikov, E. Circum-Arctic Map of Permafrost and Ground-Ice Conditions, Version 2; NASA National Snow and Ice Data Center Distributed Active Archive Center: Boulder, CO, USA, 2002. [Google Scholar] [CrossRef]
  29. Westermann, S.; Barboux, C.; Bartsch, A.; Delaloye, R.; Grosse, G.; Heim, B.; Hugelius, G.; Irrgang, A.; Kääb, A.M.; Matthes, H.; et al. ESA Permafrost Climate Change Initiative (Permafrost_cci): Permafrost Version 4 Data Products. NERC EDS Centre for Environmental Data Analysis. 2024. Available online: http://catalogue.ceda.ac.uk/uuid/7479606004d9465bad949671501e5f21 (accessed on 30 January 2022).
  30. Nelson, F.E.; Anisimov, O.A.; Shiklomanov, N.I. Subsidence risk from thawing permafrost. Nature 2001, 410, 889–890. [Google Scholar] [PubMed]
  31. Hjort, J.; Karjalainen, O.; Aalto, J.; Westermann, S.; Romanovsky, V.E.; Nelson, F.E.; Etzelmüller, B.; Luoto, M. Degrading permafrost puts Arctic infrastructure at risk by mid-century. Nat. Commun. 2018, 9, 1–9. [Google Scholar] [CrossRef]
  32. Olefeldt, D.; Goswami, S.; Grosse, G.; Hayes, D.; Hugelius, G.; Kuhry, P.; McGuire, A.D.; Romanovsky, V.E.; Sannel, A.B.K.; Schuur, E.A.G.; et al. Circumpolar distribution and carbon storage of thermokarst landscapes. Nat. Commun. 2016, 7, 13043. [Google Scholar] [CrossRef] [PubMed]
  33. Ford, J.D.; McDowell, G.; Pearce, T. The adaptation challenge in the Arctic. Nat. Clim. Chang. 2015, 5, 1046–1053. [Google Scholar]
  34. Lantuit, H.; Overduin, P.P.; Couture, N.; Wetterich, S.; Aré, F.; Atkinson, D.; Brown, J.; Cherkashov, G.; Drozdov, D.; Forbes, D.L.; et al. The Arctic coastal dynamics database: A new classification scheme and statistics on Arctic permafrost coastlines. Estuaries Coasts 2012, 35, 383–400. [Google Scholar]
  35. Jaskólski, M.W.; Pawłowski, Ł.; Strzelecki, M.C. High Arctic coasts at risk—The case study of coastal zone development and degradation associated with climate changes and multidirectional human impacts in Longyearbyen (Adventfjorden, Svalbard). Land. Degrad. Dev. 2018, 29, 2514–2524. [Google Scholar] [CrossRef]
  36. Karjalainen, O.; Aalto, J.; Luoto, M.; Westermann, S.; Romanovsky, V.E.; Nelson, F.E.; Etzelmüller, B.; Hjort, J. Circumpolar permafrost maps and geohazard indices for near-future infrastructure risk assessments. Sci. Data 2019, 6, 190037. [Google Scholar] [CrossRef]
  37. Stella, E.; Mari, L.; Gabrieli, J.; Barbante, C.; Bertuzzo, E. Permafrost dynamics and the risk of anthrax transmission: A modelling study. Sci. Rep. 2020, 10, 16460. [Google Scholar] [CrossRef] [PubMed]
  38. Phillips, S.J.; Dudík, M.; Schapire, R.E. A maximum entropy approach to species distribution modeling. In Proceedings of the Twenty-First International Conference on Machine Learning, Banff, AB, Canada, 4–8 July 2004. [Google Scholar]
  39. Phillips, S.J.; Anderson, R.P.; Schapire, R.E. Maximum entropy modeling of species geographic distributions. Ecol. Model. 2006, 190, 231–259. [Google Scholar] [CrossRef]
  40. Phillips, S.J.; Anderson, R.P.; Dudík, M.; Schapire, R.E.; Blair, M.E. Opening the black box: An open-source release of Maxent. Ecography 2017, 40, 887–893. [Google Scholar] [CrossRef]
  41. Merow, C.; Smith, M.J.; Silander, J.A. A practical guide to MaxEnt for modeling species’ distributions: What it does and why inputs and settings matter. Ecography 2013, 36, 1058–1069. [Google Scholar]
  42. Muttarak, R. Vulnerability to Climate Change and Adaptive Capacity from a Demographic Perspective. In International Handbook of Population and Environment. International Handbooks of Population; Hunter, L.M., Gray, C., Véron, J., Eds.; Springer: Cham, Switzerland, 2022; Volume 10. [Google Scholar] [CrossRef]
  43. Weeks, J.R. Population: An Introduction to Concepts and Issues, 10th ed.; Thompson Wadsworth: Belmont, CA, USA, 2008. [Google Scholar]
  44. Heleniak, T. The future of the Arctic populations. Polar Geogr. 2021, 44, 136–152. [Google Scholar]
  45. Emelyanova, A. Population projections of the Arctic by levels of education. In IIASA Working Paper; IIASA: Laxenburg, Austria, 2017; WP-17-022. [Google Scholar]
  46. Williams, C.; Fenton, A.; Huq, S. Knowledge and adaptive capacity. Nat. Clim. Chang. 2015, 5, 82–83. [Google Scholar] [CrossRef]
  47. Jones, L.; Ludi, E.; Levine, S. Towards a Characterisation of Adaptive Capacity: A Framework for Analysing Adaptive Capacity at the Local Level; Overseas Development Institute: London, UK, 2010. [Google Scholar]
  48. Adger, W.L.; Brooks, N.; Bentham, G.; Agnew, M.; Eriksen, S.E. New indicators of vulnerability and adaptive capacity. Tycall Centre for Climate Change Resarch. Tech. Rep. 2004, 7, 1–128. [Google Scholar]
  49. Muttarak, R.; Lutz, W. Is education a key to reducing natural vulnerability to natural distaters and hence unvoidable climate change? Ecol. Soc. 2014, 19, 42. [Google Scholar] [CrossRef]
  50. Granderson, A.A. The role of traditional knowledge in building adaptive capacity for climate change: Perspectives from Vanuatu. Weather. Clim. Soc. 2017, 9, 545–561. [Google Scholar] [CrossRef]
  51. Pearce, T.; Smit, B.; Duerden, F.; Ford, J.; Goose, A.; Kataoyak, G. Inuit vulnerability and adaptive capacity to climate change in Ulukhaktok, Northwest Territories, Canada. Polar Rec. 2009, 46, 157–177. [Google Scholar] [CrossRef]
  52. Berkes, F.; Armitage, D. Co-management institutions, knowledge, and learning: Adapting to change in the Arctic. Études/Inuit/Stud. 2010, 34, 109–131. [Google Scholar] [CrossRef]
  53. Ford, J.D.; Labbé, J.; Flynn, M.; Araos, M. Readiness for climate change adaptation in the Arctic: A case study from Nunavut, Canada. Clim. Chang. 2017, 145, 85–100. [Google Scholar]
  54. Jungsberg, L.; Turunen, E.; Heleniak, T.; Wang, S.; Ramage, J.; Roto, J. Atlas of Population, Society and Economy in the Arctic; Nordregio: Stockholm, Sweden, 2019. [Google Scholar]
  55. Pearce, T.; Ford, J.; Willox, A.C.; Smit, B. Inuit traditional ecological knowledge (TEK), subsistence hunting and adaptation to climate change in the Canadian Arctic. Arctic 2015, 68, 233–245. [Google Scholar] [CrossRef]
  56. McLeman, R. Impacts of population change on vulnerability and the capacity to adapt to climate change and variability: A typology based on lessons from “a hard country”. Popul. Environ. 2010, 31, 286–316. [Google Scholar]
  57. Liu, S.; Crossman, N.D.; Nolan, M.; Ghirmay, H. Bringing ecosystem services into integrated water resources management. J. Environ. Manag. 2013, 129, 92–102. [Google Scholar]
  58. Scaggs, S.A.; Gerkey, D.; McLaughlin, K.R. Linking subsistence harvest diversity and productivity to adaptive capacity in an Alaskan food sharing network. Am. J. Hum. Biol. 2021, 33, e23573. [Google Scholar]
  59. Lebel, L. Local knowledge and adaptation to climate hange in natural resource-based societies of the Asia-Pacific. Mitig. Adapt. Strategy Glob. Chang. 2013, 18, 1057–1076. [Google Scholar]
  60. Herman-Mercer, N.M.; Laituri, M.; Massey, M.; Matkin, E.; Toohey, R.C.; Elder, K.; Schuster, P.F.; Mutter, E. Vulnerability of subsistence systems due to social and environmental change. Arctic 2019, 72, 258–272. [Google Scholar]
  61. Juhola, S.; Kruse, S. A framework for analysing regional adaptive capacity assessments: Challenges for methodology and policy making. Mitig. Adapt. Strateg. Glob. Chang. 2015, 20, 99–120. [Google Scholar] [CrossRef]
  62. Engle, N.L. Adaptive capacity and its assessment. Glob. Environ. Chang. 2011, 21, 647–656. [Google Scholar]
  63. Feldmeyer, D.; Birkmann, J.; McMillan, J.M.; Stringer, L.; Leal Filho, W.; Djalante, R.; Pinho, P.F.; Liwenga, E. Global vulnerability hotspots: Differences and agreement between international indicator-based assessments. Clim. Chang. 2021, 169, 1–22. [Google Scholar]
  64. Turner, B.L.; Kasperson, R.E.; Matson, P.A.; McCarthy, J.J.; Corell, R.W.; Christensen, L.; Eckley, N.; Kasperson, J.X.; Luers, A.; Martello, M.L.; et al. A framework for vulnerability analysis in sustainability science. Proc. Natl. Acad. Sci. USA 2003, 100, 8074–8079. [Google Scholar] [CrossRef] [PubMed]
  65. ESA Permafrost Climate Change Initiative (Permafrost_cci): Permafrost Extent for the Northern Hemisphere, v3.0. 2021. Available online: https://catalogue.ceda.ac.uk/uuid/6e2091cb0c8b4106921b63cd5357c97c (accessed on 30 January 2022).
  66. Olefeldt, D.; Goswami, S.; Grosse, G.; Hayes, D.J.; Hugelius, G.; Kuhry, P.; Sannel, B.; Schuur, E.A.G.; Turetsky, M.R. Arctic Circumpolar Distribution and Soil Carbon of Thermokarst Landscapes; ORNL DAAC: Oak Ridge, TN, USA, 2015. [Google Scholar] [CrossRef]
  67. Stella, E.; Mari, L.; Gabrieli, J.; Barbante, C.; Bertuzzo, E. Mapping environmental suitability for anthrax reemergence in the Arctic. Environ. Res. Lett. 2021, 16, 105013. [Google Scholar]
  68. OECD, Regional Economy Dataset. Available online: http://stats.oecd.org/Index.aspx?DataSetCode=REGION_ECONOM (accessed on 30 January 2022).
Figure 1. Schematic illustrating the range of vulnerabilities within the Arctic Permafrost Vulnerability Index (APVI). The APVI combines the scores from the exposure and adaptive capacity indicators. A vulnerability score that falls between 3 and 4 indicates a high vulnerability, between 2 and 3, a moderate vulnerability, 1 and 2, a low vulnerability, and less than 1, no vulnerability to permafrost thaw.
Sustainability 17 03288 g001
Figure 2. Exposure thresholds for ground ice content and permafrost type. Ground ice coverage is classified after [28] using permafrost conditions (C, continuous; D, discontinuous; S sporadic; and I, Isolated), ground ice contents (h, high; m, moderate; l, low), and landform and overburden type (f, lowlands, highlands, and intra- and intermontane depressions with a thick overburden (>5–10 m); r, mountains, highlands ridges, and plateaus with thin overburden (>5–10 m) and exposed bedrock).
Sustainability 17 03288 g002
Figure 3. Diagram showing exposure and adaptive capacity scores for each subregion. Each dot represents a subregion, and the colour indicates its final vulnerability score.
Sustainability 17 03288 g003
Table 1. List of the exposure and adaptive capacity indicators used to design the Arctic Permafrost Vulnerability Index (APVI). Exposure and adaptive capacity scores were established using the thresholds developed in the APVI.
Exposure Index Very High ExposureHigh ExposureModerate ExposureLow Exposure
Scores 4321
SoilsPermafrost coverage% coverage>5025–505–25<5
Change in permafrost extent% change<−26−13–260–13>0
Ground ice coverage 1IndexChf, Dhf, Cmr, DmrCmf, Dmf, Shf, Clr, Dlr, Smr, ImrClf, Dlf, Smf, Ihf, SlrSlf, Ilf, Imf, Ilr
LandscapesThermokarst coverage% coverage60–10030–6010–300–10
Coastal erosion ratem/y−1>21–20–10
InfrastructureInfrastructure riskindice3210
HealthRisk of anthrax outbreak%>5020–505–200–5
Adaptive capacity index Low capacityModerate capacityHigh capacityVery high capacity
scores 4321
Demographic capacityYouth dependency ratio (0–14 years)Ratio<10 or >4010–14 or 36–4015–21 or 29–3522–28
Working-age populationRatio<45 or >7045–49 or 66–7050–55 or 62–6556–61
Old-age dependency ratio (>64 years)Ratio<5 or >255–9 or 21–2510–12 or 18–2013–17
Gender ratioRatio<80 or >12080–89 or 111–12090–98 or 102–11099–101
Rate of natural increaseRatio<0 or >105.1 to 9.92.6 to 50 to 2.5
Net migration%<−2 or >2−2–(−1) or 1–2−1–0 or 0–10
Knowledge capacityTertiary education%<20 or >4015–20 or 36–4021–27 or 33–3528–32
% of Indigenous population%<20 20–4950–7980–100
10+ years of residency %<20 20–4950–7980–100
Economic capacityGRP per capitaEUR PPP at 2017 prices0–30,00030,001–50,00050,001–70,000>70,001
Employment by economic activityBalance<2/63/64/6>5/6
Share of subsistence income%<20 or >8020–35 or 70–8036–44 or 56–6945–55
1 ground ice coverage is classified after [28] using permafrost conditions (C, continuous; D, discontinuous; S sporadic; I, Isolated), ground ice contents (h, high; m, moderate; l, low), and landform and overburden type: f, lowlands, highlands, and intra- and intermontane depressions with thick overburden (>5–10 m); r, mountains, highlands ridges, and plateaus with thin overburden (>5–10 m) and exposed bedrock.
Disclaimer/Publisher’s Note: The statements, opinions and data contained in all publications are solely those of the individual author(s) and contributor(s) and not of MDPI and/or the editor(s). MDPI and/or the editor(s) disclaim responsibility for any injury to people or property resulting from any ideas, methods, instructions or products referred to in the content.

