Article

Characteristics of Soil and Plant Ecological Stoichiometry of Carbon, Nitrogen, and Phosphorus in Different Wetland Types of the Yellow River

1
Institute of Geographical Sciences, Henan Academy of Sciences, Zhengzhou 450052, China
2
School of Agricultural Sciences, Zhengzhou University, Zhengzhou 450001, China
*
Author to whom correspondence should be addressed.
Sustainability 2025, 17(7), 3276; https://doi.org/10.3390/su17073276
Submission received: 26 December 2024 / Revised: 27 March 2025 / Accepted: 28 March 2025 / Published: 7 April 2025
(This article belongs to the Section Soil Conservation and Sustainability)

Abstract

:
Clarifying carbon (C), nitrogen (N), and phosphorus (P) ecological stoichiometry helps us to understand the ecological functions of wetland ecosystems. This study investigated the variations in ecological stoichiometry and their driving factors in the Yellow River wetland. Soil and plant samples were collected and analyzed from riparian lower-beach wetland (LBW), riparian higher-beach wetland (HBW), and depressional wetland (DW) at the junction of the middle and lower reaches of the Yellow River, respectively. Compared with HBW, DW exhibited higher soil C/N (9.15 ± 0.13), C/P (11.17 ± 0.52), and N/P (1.08 ± 0.09) (p < 0.01), indicating its stronger C and N storage capacity. At the community level, higher plant C/N and C/P in LBW (21.47 ± 1.61 and 206.80 ± 1.75, respectively) and HBW (22.91 ± 0.90 and 241.04 ± 3.28, respectively) compared to DW (14.44 ± 1.02 and 115.66 ± 2.82, respectively) (p < 0.01) suggested that plants in LBW and HBW had greater C assimilation and nutrient use efficiency. Soil electrical conductivity (EC) and hydrolyzed N (SHN) positively affected soil ecological stoichiometry (p < 0.01). In contrast, soil EC, soil organic C, dissolved organic C, and SHN negatively altered plant stoichiometric ratios (p < 0.05), which were regulated by plant functional groups. When pooling all wetlands, stoichiometric ratios of plants were closely correlated with those of soil (p < 0.05). These findings demonstrate that wetland types notably affect soil and plant stoichiometry. Wetland types exerted opposite effects on soil and plant stoichiometry due to the different influences of soil physicochemical properties and the coupling effects of nutrient and stoichiometry between soil and plants. Therefore, the interactions between plant and soil stoichiometry should be considered to explore the C and nutrient cycles in riverine wetlands. Our research emphasizes the necessity of considering wetland type differences and intricate plant–soil stoichiometric interactions in formulating management strategies and maintaining the sustainability of wetlands.

1. Introduction

Carbon (C), nitrogen (N), and phosphorus (P) cycles are inseparably bound with the ecological structures, processes, and functions in wetland ecosystems [1,2]. Soil C, N, and P stoichiometric ratios reflect the cyclic process of soil biogenic elements and their mineralization and immobilization. Generally, soil C/N, C/P, and N/P characterize the degree of organic matter decomposition and humification [3,4,5], indicate the potential of soil P mineralization, and anticipate soil nutrient restriction [6,7], respectively. Analogously, plant C/N, C/P, and N/P are important parameters reflecting nutrient use efficiency and the nutrient limitations of plants [8,9]. Hence, exploring the variations in C, N, and P ecological stoichiometry is crucial for further understanding C and nutrient cycling processes and the ecological functions of wetland ecosystems under climate change [3]. Riverine wetlands are distinctive and intricate ecosystems, playing a vital role in sustaining ecological functions, providing ecological services, and safeguarding biodiversity [10,11]. However, previous studies on wetland ecological stoichiometry have predominantly focused on lakes, estuaries, and coastal wetlands [12,13,14,15,16,17,18,19], while riverine wetlands, particularly those in the middle and lower reaches of the Yellow River, remain poorly researched.
Different riverine wetlands exhibit particular hydrological and soil characteristics [20]. Hydrological regimes, including submergence duration and water table fluctuation, could alter soil aeration and substrate particle size, further affecting microbial activity, organic matter decomposition, nutrient concentrations, and plant absorption [15,16,21]. The distances of riverine wetlands from the river channel impact their hydrological environments, resulting in corresponding variations in soil stoichiometric characteristics [4,6]. Furthermore, soil properties, including pH, water content, salinity, and available nutrients, can affect the immobilization, mineralization, and transfer of soil C and nutrients by modifying microbial activity and plant absorption [15,21,22]. Additionally, matter and elements are coupled between plant and soil systems [12,23,24], which influences the ecological stoichiometric balance of soil and plants in riverine wetlands. These processes ultimately shape the soil stoichiometric characteristics of C, N, and P. Therefore, wetland types of riverine wetlands affect soil C, N, P, and their stoichiometric ratios through disparate hydrological conditions, soil physicochemical properties, and the coupling between soil and plant systems [4,6,15,23].
Investigating C, N, and P stoichiometric patterns of plants and their driving factors can provide valuable insights into plant adaptation strategies and ecological functions in riverine wetlands [8,20]. Changes in hydrological regime and soil physicochemical properties (pH, salinity, water content, available nutrients, etc.) impact microbial activity and migration, organic matter decomposition, and soil nutrient release in different wetland types [15,16,25,26]. These processes influence C assimilation capacity and the nutrient uptake and utilization of plants [19,21,23,27], ultimately altering the ecological stoichiometry of wetland plants. Thus, C, N, and P stoichiometric characteristics of wetland plants are closely related to hydrological regime and soil physicochemical properties in different wetlands [17,20]. Moreover, plant functional group is also a major factor regulating changes in plant C nutrient stoichiometry in riverine wetlands [20,23]. Nevertheless, existing research often neglects the spatial heterogeneity of wetland types shaped by riverine hydrological processes, limiting our ability to predict ecosystem responses to environmental changes. The variations in soil and plant C nutrient stoichiometry with wetland types and their coupling relationships in riverine wetlands, especially in the middle and lower reaches of the Yellow River, remain indistinct and require further investigation.
The Yellow River wetland in the Zhengzhou area, situated at the transition point between the middle and lower reaches of the Yellow River in Henan Province, China [28], features a gradually widening riverbed with reduced flow velocity. Influenced by the annual flood season, the river’s wandering creates extensive mud flats and floodplains, making it an important wetland distribution area in China [29]. To address the above gaps, this study investigates C, N, and P ecological stoichiometry in three distinct wetland types of the Yellow River: riparian lower-beach wetland (LBW), riparian higher-beach wetland (HBW), and depressional wetland (DW). Our goals were to (1) investigate C, N, and P stoichiometric characteristics within the soil–plant systems in the LBW, HBW, and DW of the Yellow River; (2) quantify how wetland-specific hydrology and soil properties influence the C, N, and P ecological stoichiometry of soil and plants; and (3) explore the coupling relationships between soil and plant ecological stoichiometry. We hypothesized that (1) soil and plant ecological stoichiometry would vary with wetland type due to different hydrologic conditions and soil physicochemical properties [6,20]; (2) soil and plant ecological stoichiometry would analogously respond to wetland types or soil physicochemical properties given the tight link in soil–plant element cycles [14,23]; and (3) soil and plant ecological stoichiometry are strongly coupled in the Yellow River wetland [12,13,24]. Our study can deepen the understanding of wetland ecosystem processes, offer theoretical support for formulating scientific wetland conservation strategies, facilitate rational wetland resource management, and promote the balance between wetland ecological protection and human activities, thus ensuring the sustainable health of wetland ecosystems.

2. Methods and Materials
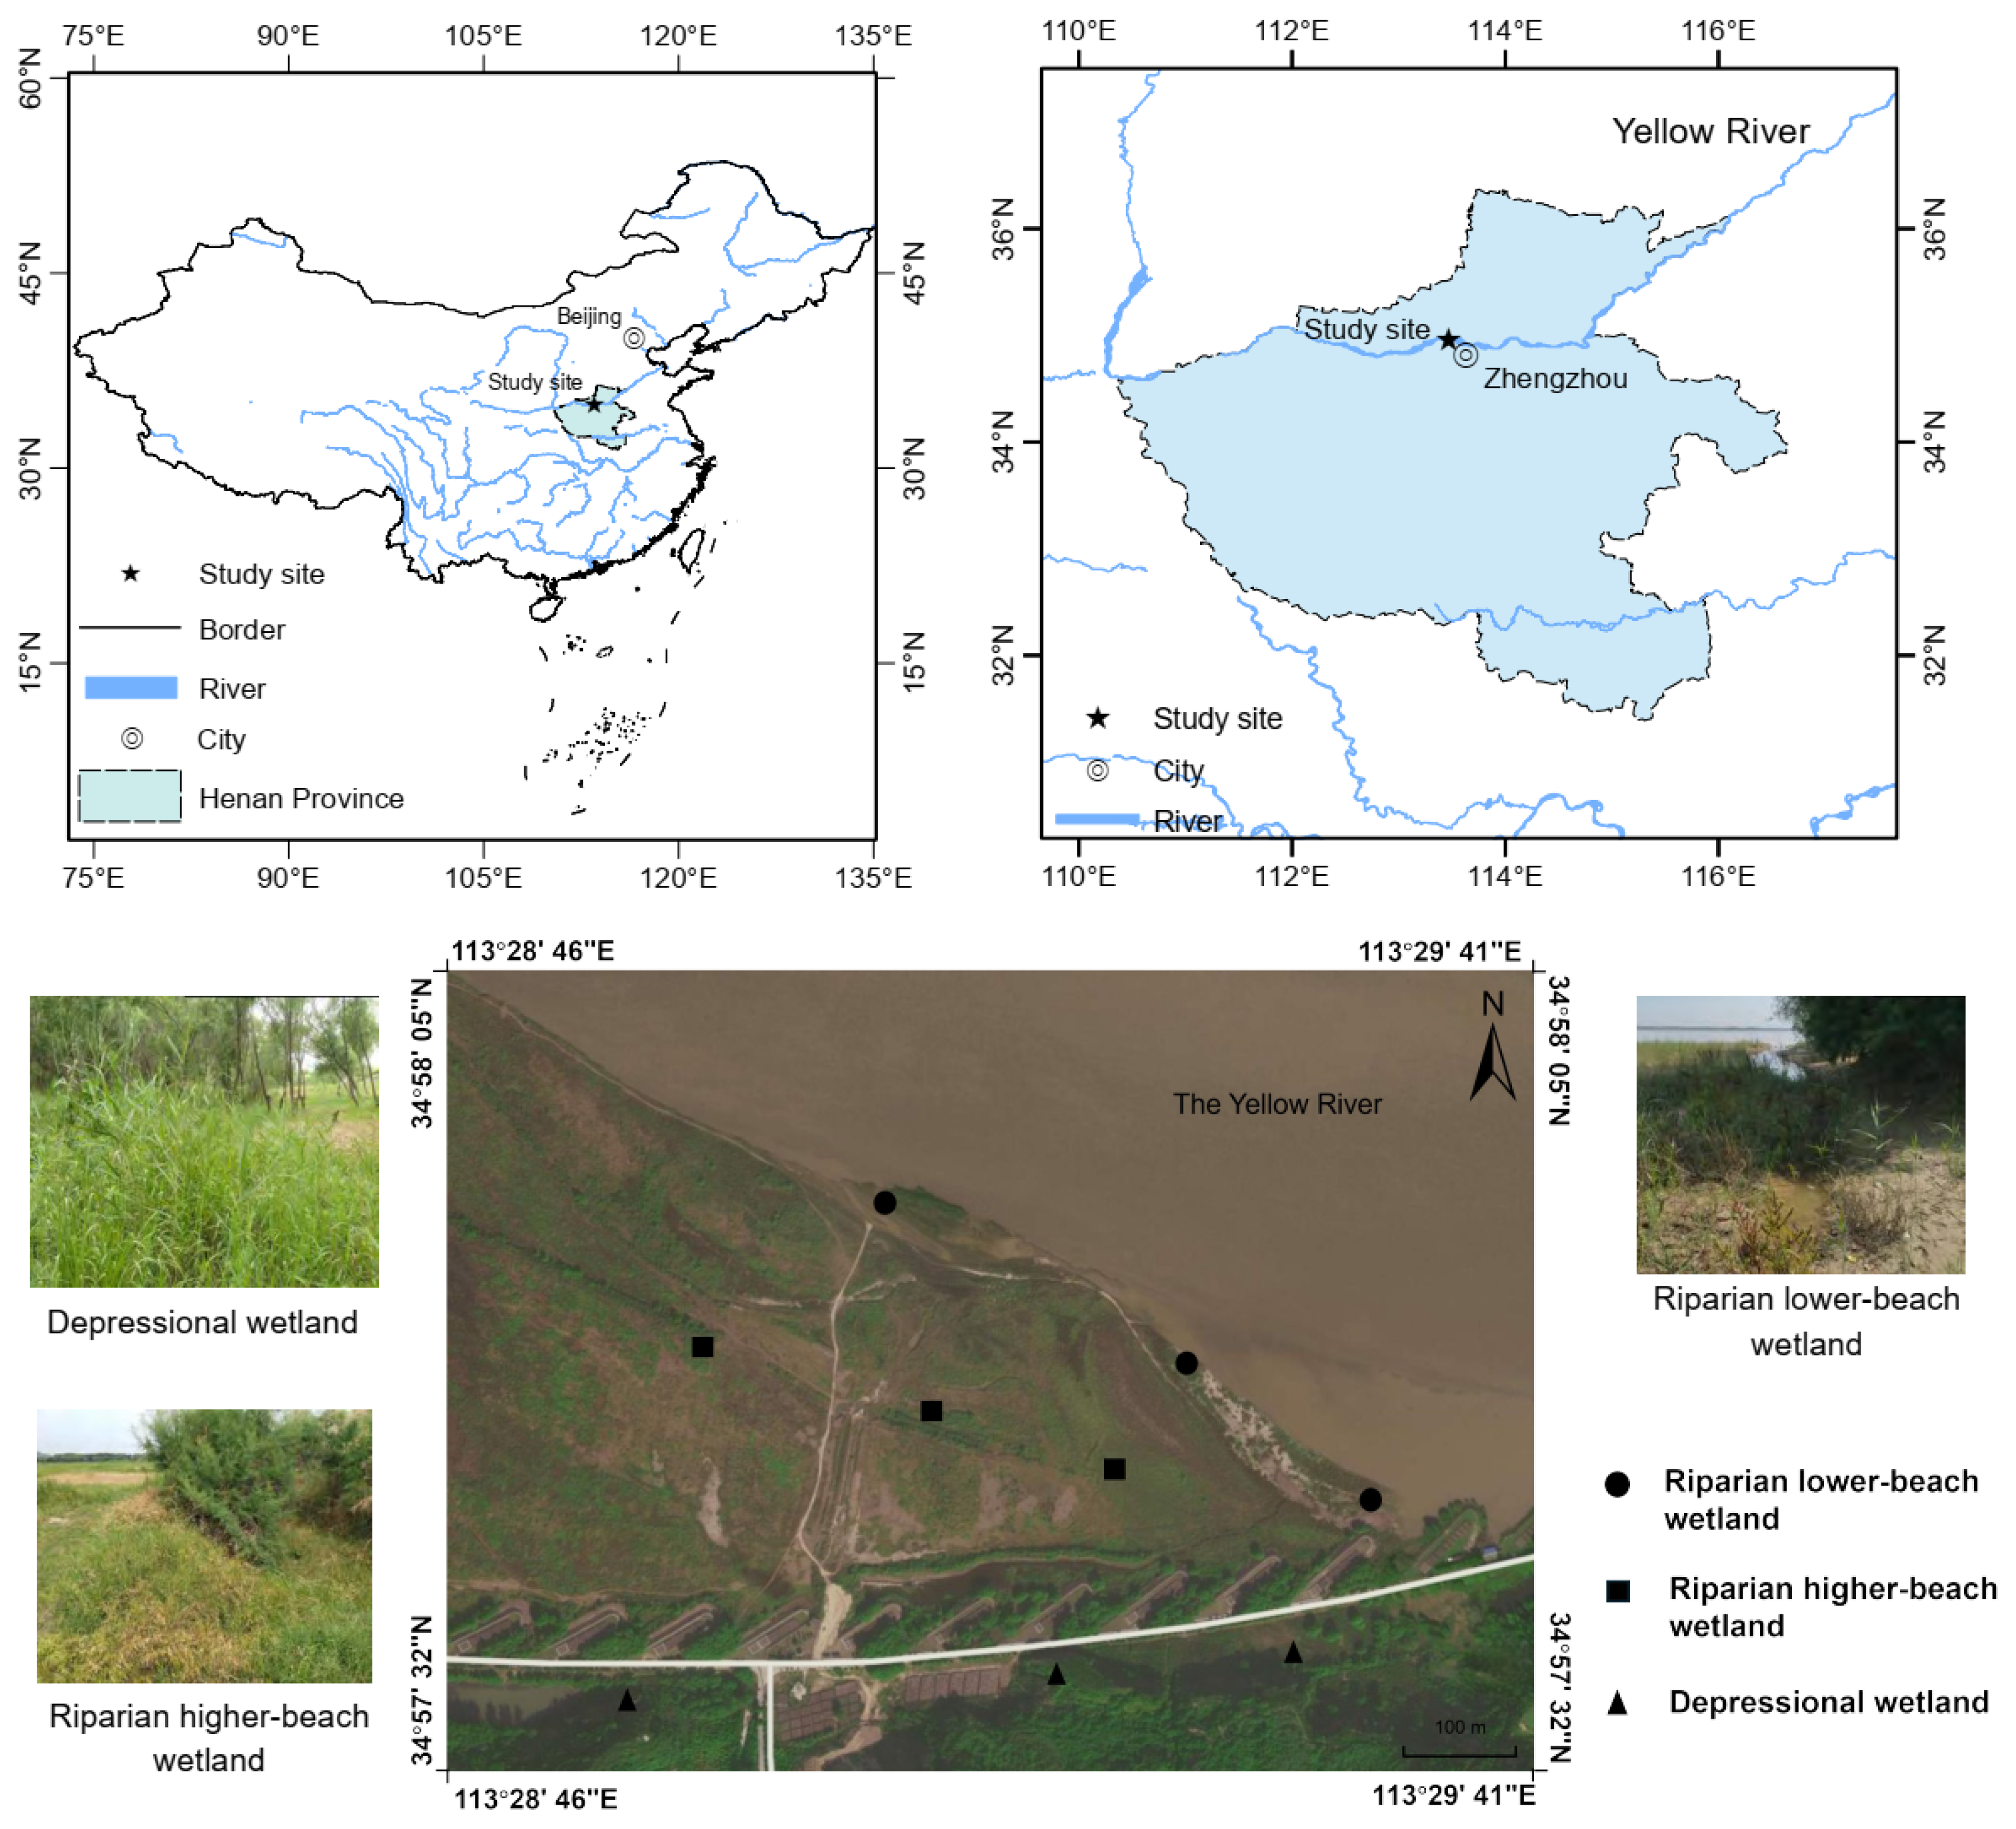
2.1. Study Area

The study was carried out at the south bank of the Yellow River (113°28′ E, 34°57′ N) in Zhengzhou City, Henan Province, China. The study area is located at the junction of the middle and lower reaches of the Yellow River, with a warm temperate continental climate. Mean annual temperature and precipitation in this region are 14.8 °C and 608.8 mm, respectively. This region is situated at the apex of the Yellow River’s alluvial fan and the rate of river flow reduces here. We classified the studied wetlands as riparian lower-beach wetland (LBW), riparian higher-beach wetland (HBW), and depressional wetland (DW) according to the hydrogeomorphic classification method (Figure 1) [30]. The river’s lateral migration and overbank sedimentation contribute to the formation of large floodplains, including the LBW and HBW. The floodplain area immediately adjacent to the river is LBW, which has a relatively long and narrow area and is frequently eroded by river water. So, the losses of soil and nutrients are serious in LBW, leading to relatively short and sparse vegetation. The HBW, with a relatively wide area, is far from the river channel at relatively high terrain and is not easily inundated by floods during flood seasons. Thus, HBW is covered with thick vegetation. During the flood season, the Yellow River water replenishes the groundwater on both sides. This process elevates the groundwater level and forms long and narrow depressional wetland outside the dyke. The water in DW is relatively closed. DW accumulates water during the flood season and discharges it as the water recedes in autumn and winter. The dominant plants in LBW are Phragmites australis, Persicaria lapathifolia, Eleusine indica, and Tamarix chinensis. The dominant plants include P. australis, Typha orientalis, T. chinensis, and P. lapathifolia in HBW. In DW, the plants are dominated by P. australis, T. chinensis, Cynodon dactylon, and Salix matsudana. Riparian beach wetlands and depressional wetland play an important role in purifying water quality, sequestering soil organic C (SOC), resisting floods, maintaining the biodiversity of the Yellow River wetland, and regulating the local climate of the region along the Yellow River [11,31,32].

2.2. Sampling Methods

Three wetland types, including riparian lower-beach wetland, riparian higher-beach wetland, and depressional wetland, were selected in the study area. For each wetland type, three sample plots were chosen for sampling, with an interval of at least 100 m. During the plant growth season in mid-June 2022, the mature green leaves of plants that were present in each plot were collected and put into paper bags by species (Table 1). The plant samples were dried at 65 °C to a constant weight in the laboratory and then ground for measurement. Three soil cores were taken using a soil auger with a 5 cm diameter at soil depths of 0–15 cm and 15–30 cm in each plot. After removing plant roots and stones, the soil samples from the same layer were combined into one complete sample. After being taken to the laboratory as soon as possible, one part of each soil sample was kept at 4 °C for measuring soil dissolved organic C (DOC). The rest were air-dried for chemical analysis.

2.3. Sample Measurement

Soil pH and electrical conductivity (EC) were measured with a pH meter and conductometer, respectively. Fresh soil samples were weighed both before and after being dried at 105 °C to calculate the soil water content (SWC). The oil bath–K2Cr2O7 titration approach and the semi-micro Kjeldahl method were employed separately to assess the concentrations of organic C and total N in the soils and plants, respectively [33]. To determine soil total P concentration, the soil samples were liquated with NaOH, and then colorimetric assays were carried out [34]. Plant P concentration was determined by molybdenum–antimony absorbance spectrophotometry. Soil DOC concentration was measured via deionized water extraction followed by the oil bath–K2Cr2O7 titration method. Soil hydrolyzed N concentration was determined via NaOH solution extraction and standard acid titration. Soil available P concentration was determined via NaHCO3 extraction followed by colorimetric analysis [35].

2.4. Data Analysis

The C, N, and P concentrations and stoichiometric ratios of herbaceous and woody plants were obtained by calculating the average values of herbaceous and woody species, respectively. The C, N, and P concentrations and stoichiometric ratios of plant community levels were obtained by calculating the average values of herbaceous and woody plants. One-way ANOVA with Tukey’s post hoc tests were conducted to examine the differences among different wetland types. Discrepancies between soil depths or plant functional groups were detected using paired t tests. A linear mixed effects model was performed using the “lme4” package. Then, a two-way ANOVA was conducted to assess the main and interactive effects of wetland type and soil depth or plant functional group. Correlation analysis with the method of ordinary least squares was used to identify relationships between soil pH, SWC, EC, SOC, and soil nutrients and C, N, and P stoichiometric ratios. Redundancy analysis was used to explore the main influencing factors of soil and plant stoichiometry and their contributions. All statistical analyses were performed using R software (Version 4.2.1, https://www.r-project.org/, accessed on 3 February 2023). Origin 2021 (OriginLab Corporation, Northampton, MA, USA) was used to plot figures.

3. Results

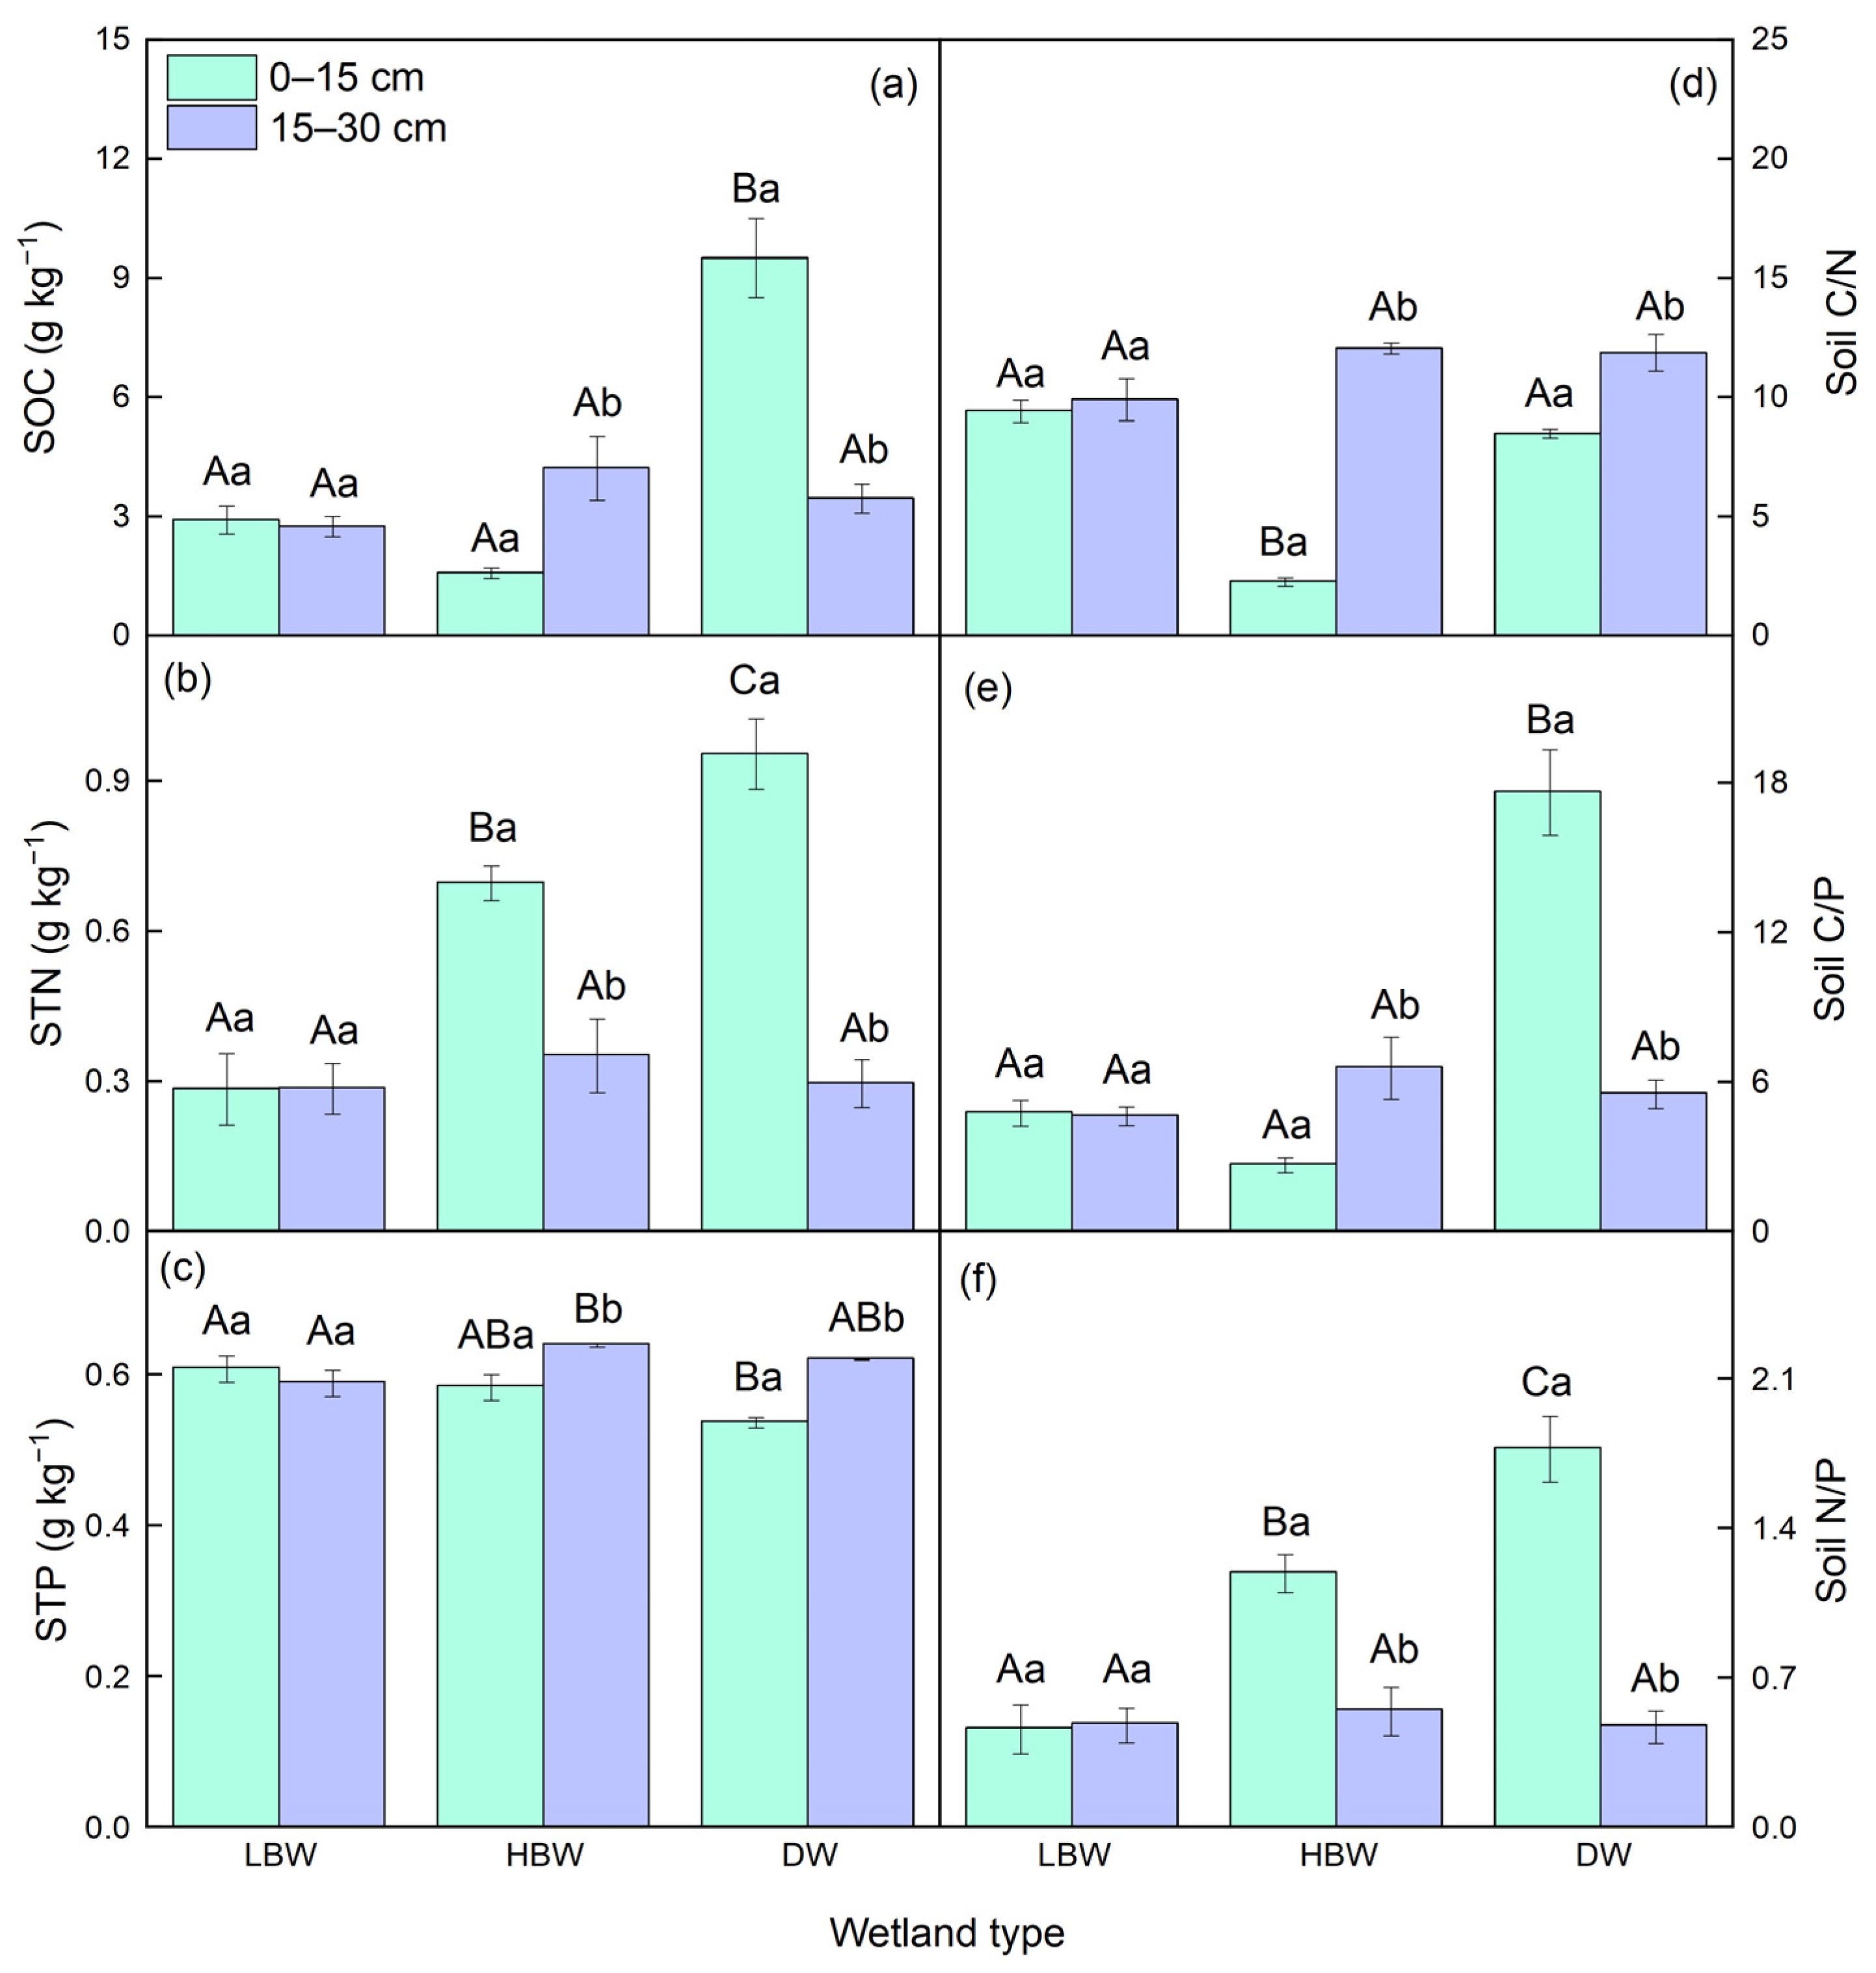
3.1. Soil Physicochemical Properties in Diverse Wetlands of the Yellow River

Wetland type and soil depth both exhibited significant effects on soil pH (both p < 0.001). Soil water content (SWC) varied obviously among wetland types (p < 0.001), whereas soil depth had only a small impact. However, soil electrical conductivity (EC) was not affected by wetland type, but it varied obviously between soil depths (p < 0.01) (Table 2). Soil water content was 264.15% higher in riparian lower-beach wetland (LBW) and 158.73% higher in depressional wetland (DW) than in riparian higher-beach wetland (HBW). Soil pH was 4.40% higher in LBW than in DW. Soil EC was 19.21% and 5.61% higher in DW than in LBW and HBW, respectively (Table 3).
Only wetland type affected soil dissolved organic C (DOC) concentration (p < 0.001), whereas wetland type and soil depth exhibited significant effects on soil hydrolyzed N (SHN) and available P (SAP) concentrations (p < 0.01) (Table 2). The soil DOC concentration in DW was 4.46% and 144.90% higher than that in LBW and HBW. The SHN concentrations in DW and HBW were 379.04% and 112.33% higher than that in LBW, respectively. The SAP concentration in HBW was 44.54% and 84.04% higher than that in LBW and DW, respectively (Table 3).

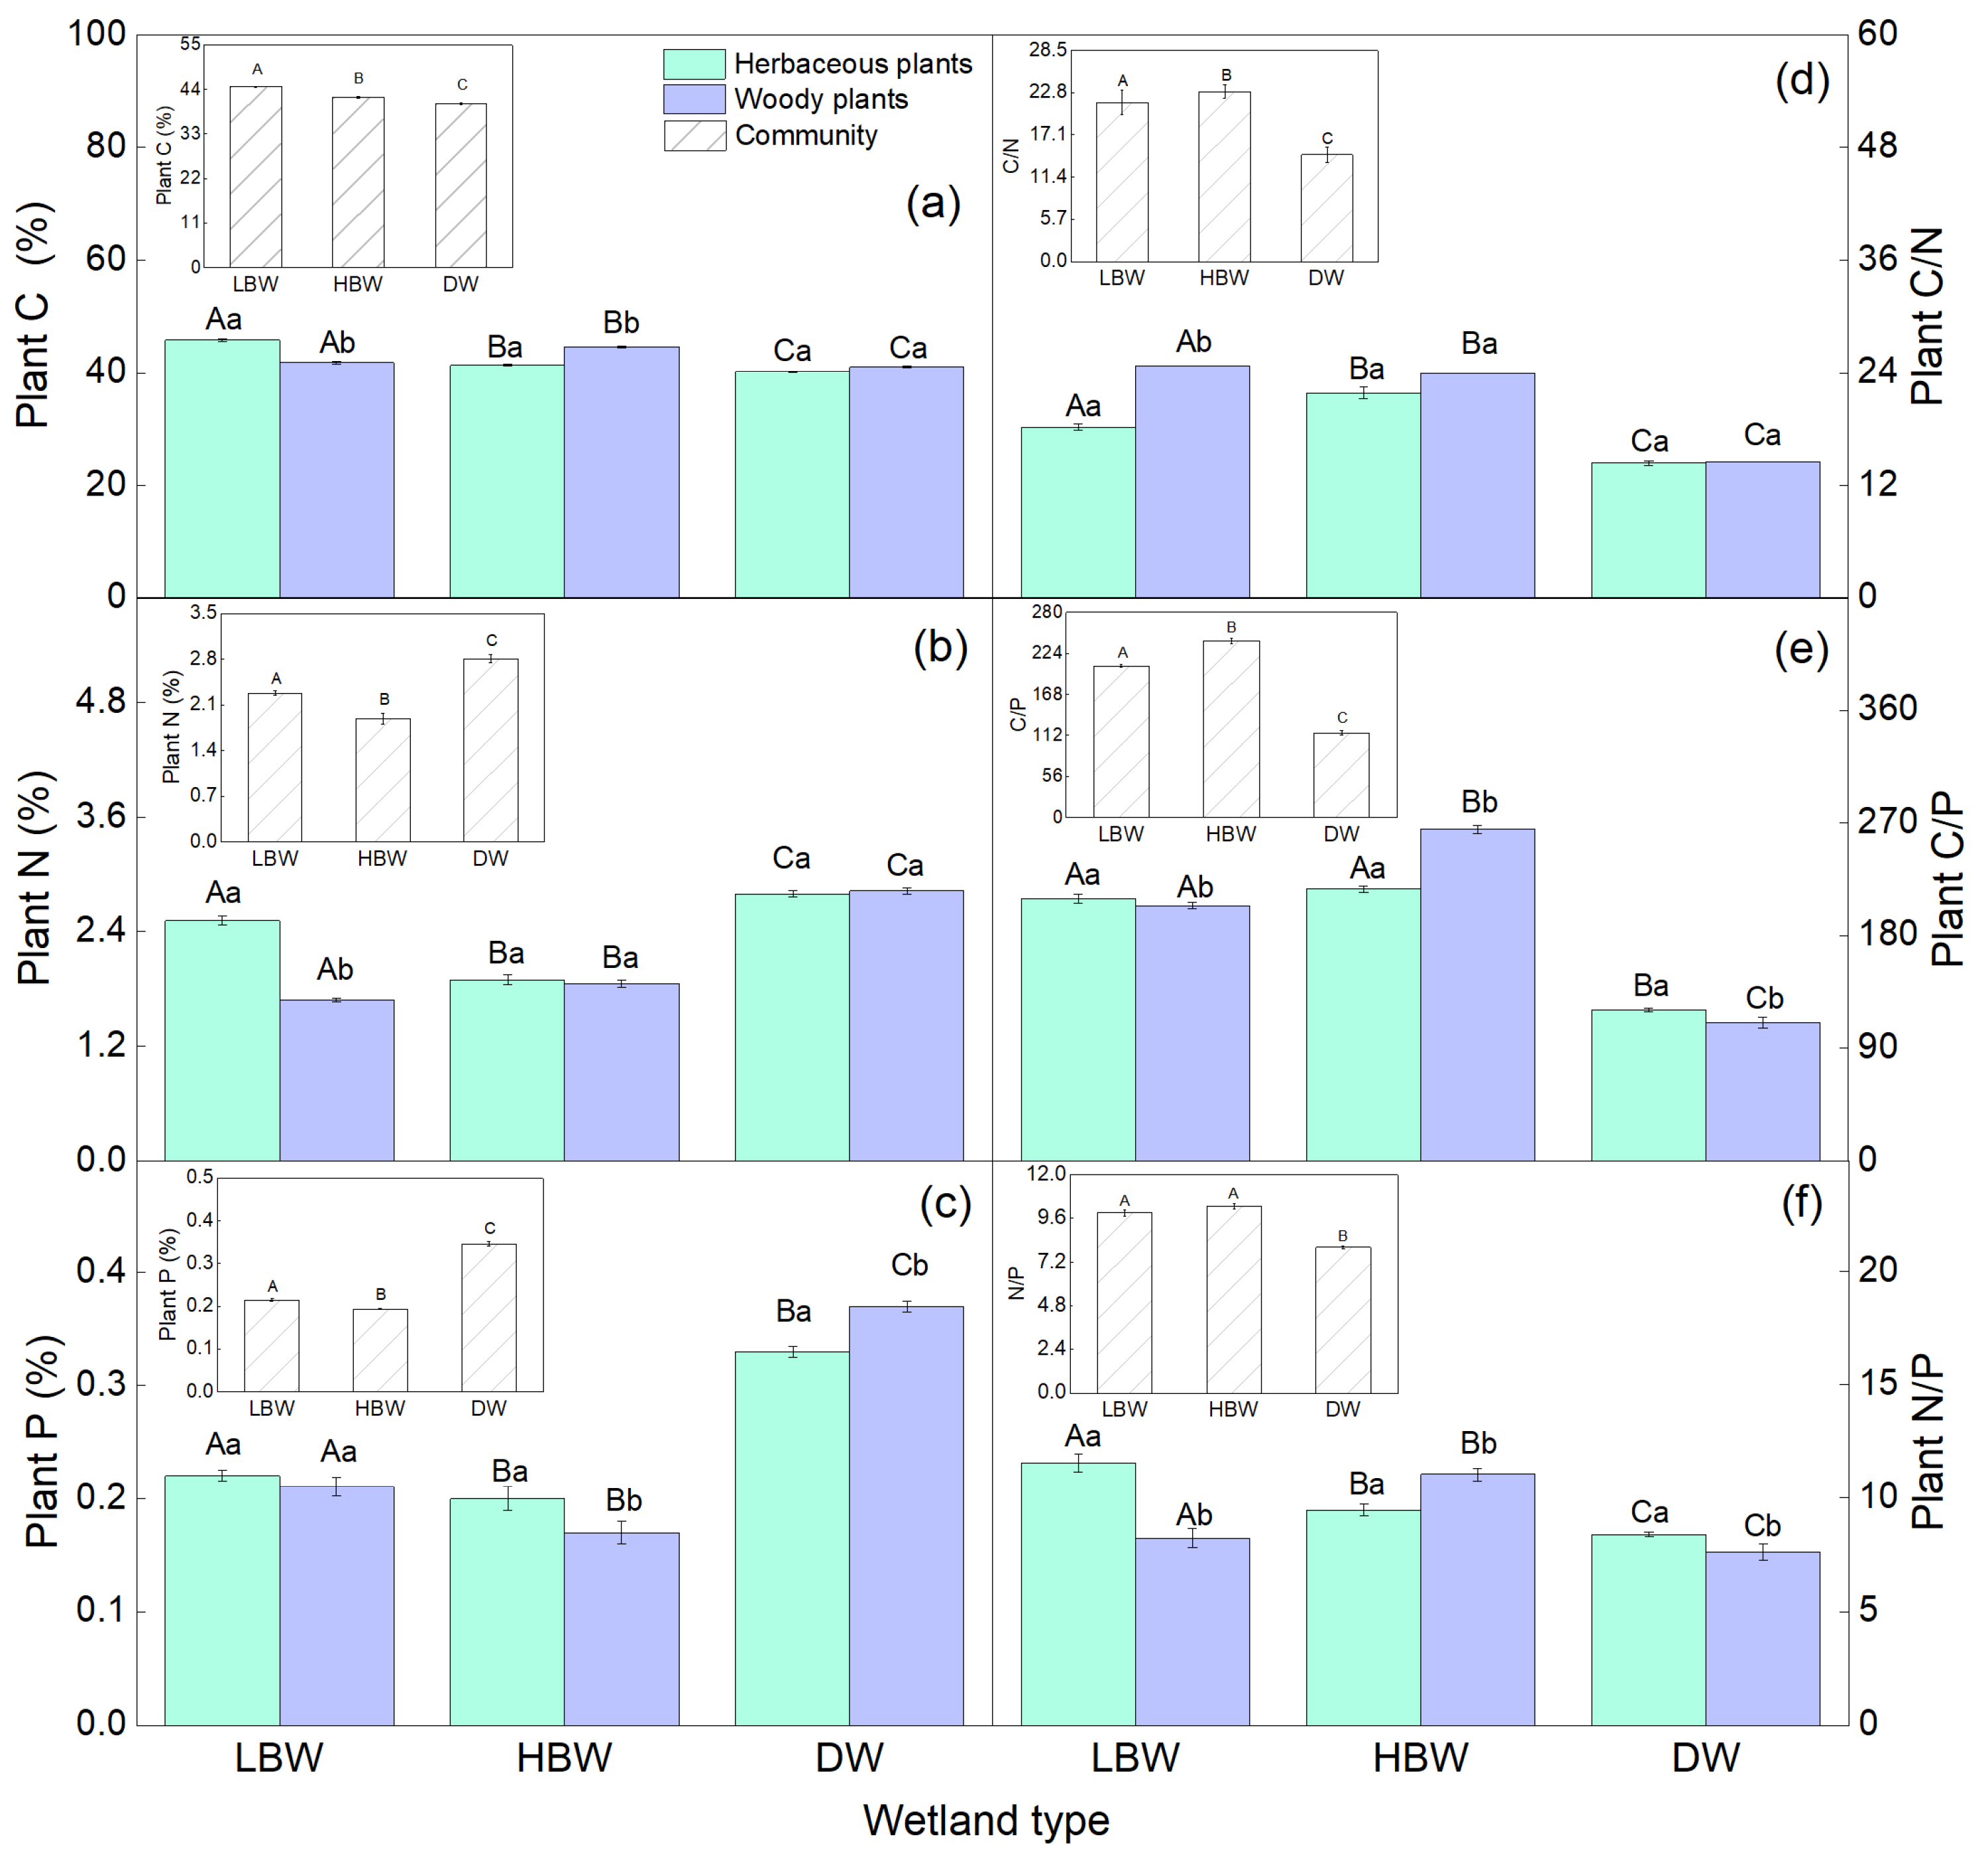
3.2. Soil and Plant C, N, and P Concentrations in Different Wetlands of the Yellow River

Wetland type exhibited a significant influence on SOC and soil total N (STN) concentrations (both p < 0.001), but affected soil total P (STP) concentration only marginally (p < 0.1). Soil depth exhibited remarkable effects on SOC, STN, and STP concentrations (all p < 0.05) (Table 2). Soil organic C concentration was 128.18% and 123.41% higher in DW than in LBW and HBW. Soil total N concentration was 83.17% and 19.25% higher in DW than in LBW and HBW. However, STP concentration was 2.16% and 5.67% lower in LBW and DW than in HBW (Figure 2a–c).
Wetland type obviously influenced plant C, N, and P concentrations (p < 0.001), whereas plant functional groups only influenced plant N concentration (p < 0.001) (Table 4). At the community level, LBW (average: 43.00%) had the highest and DW (average: 40.62%) had the lowest plant C concentration among the three wetlands, respectively. Nevertheless, plant N and P concentrations gradually increased in HBW (average: 1.88% and 0.18%), LBW (average: 2.10% and 0.21%), and DW (average: 2.81% and 0.35%). At the functional group level, the C concentration of herbaceous plants in LBW (average: 45.81%) was higher than that in HBW (average: 41.36%) and DW (average: 40.20%). However, N and P concentrations of herbaceous plants were higher in DW (average: 2.80% and 0.33%) than in LBW (average: 2.52% and 0.22%) and HBW (average: 1.90% and 0.20%). The C concentration in woody plants was the highest in HBW among the three wetlands (average: 41.79%, 44.64%, and 41.04% in LBW, HBW, and DW, respectively), whereas N and P concentrations of woody plants were higher in DW (average: 2.83% and 0.37%) than in LBW (average: 1.69% and 0.21%) and HBW (average: 1.86% and 0.17%) (Figure 3a–c).

3.3. Soil and Plant Stoichiometry of C, N, and P in Different Wetlands of the Yellow River

Wetland type and soil depth demonstrated remarkable effects on soil C/N, C/P, and N/P (p < 0.001) (Table 2). In the 0–15 cm soil layer, soil C/N in LBW (range: 8.63–10.23) and DW (range: 8.16–8.83) was greater than that in HBW (range: 2.08–2.59), and soil C/P and N/P in DW (range: 14.47–20.38 and 1.51–2.05) were greater than those in LBW (range: 4.00–5.79 and 0.28–0.67) and HBW (range: 2.18–3.21 and 1.03–1.32). In the 15–30 cm soil layers, no differences in soil C/N, C/P, and N/P were detected among LBW, HBW, and DW (Figure 2d–f).
Wetland type and plant functional group both influenced plant C/N, C/P, and N/P obviously (p < 0.001) (Table 4). At the community level, HBW (range: 22.32–23.28, 238.82–243.27, and 10.07–10.49, respectively) had the highest and DW (range: 13.89–14.99, 114.25–117.09, and 8.01–8.11, respectively) had the lowest plant C/N, C/P, and N/P, respectively. At the functional group level, herbaceous plant C/N gradually reduced in HBW (range: 20.64–22.60), LBW (range: 17.60–18.68), and DW (range: 13.96–14.77). However, herbaceous plant C/P and N/P were the highest in LBW (range: 202.94–214.49 and 10.86–12.19) and the lowest in DW (range: 117.84–123.53 and 8.20–8.60). The C/N of woody plants gradually decreased in LBW (range: 24.13–25.32), HBW (range: 24.38–23.54), and DW (range: 14.12–14.90). Nevertheless, woody plant C/P and N/P were the highest in HBW (range: 262.59–267.22 and 10.75–11.33), whereas they were the lowest in DW (range: 109.56–111.75 and 6.95–8.30) (Figure 3d–f).

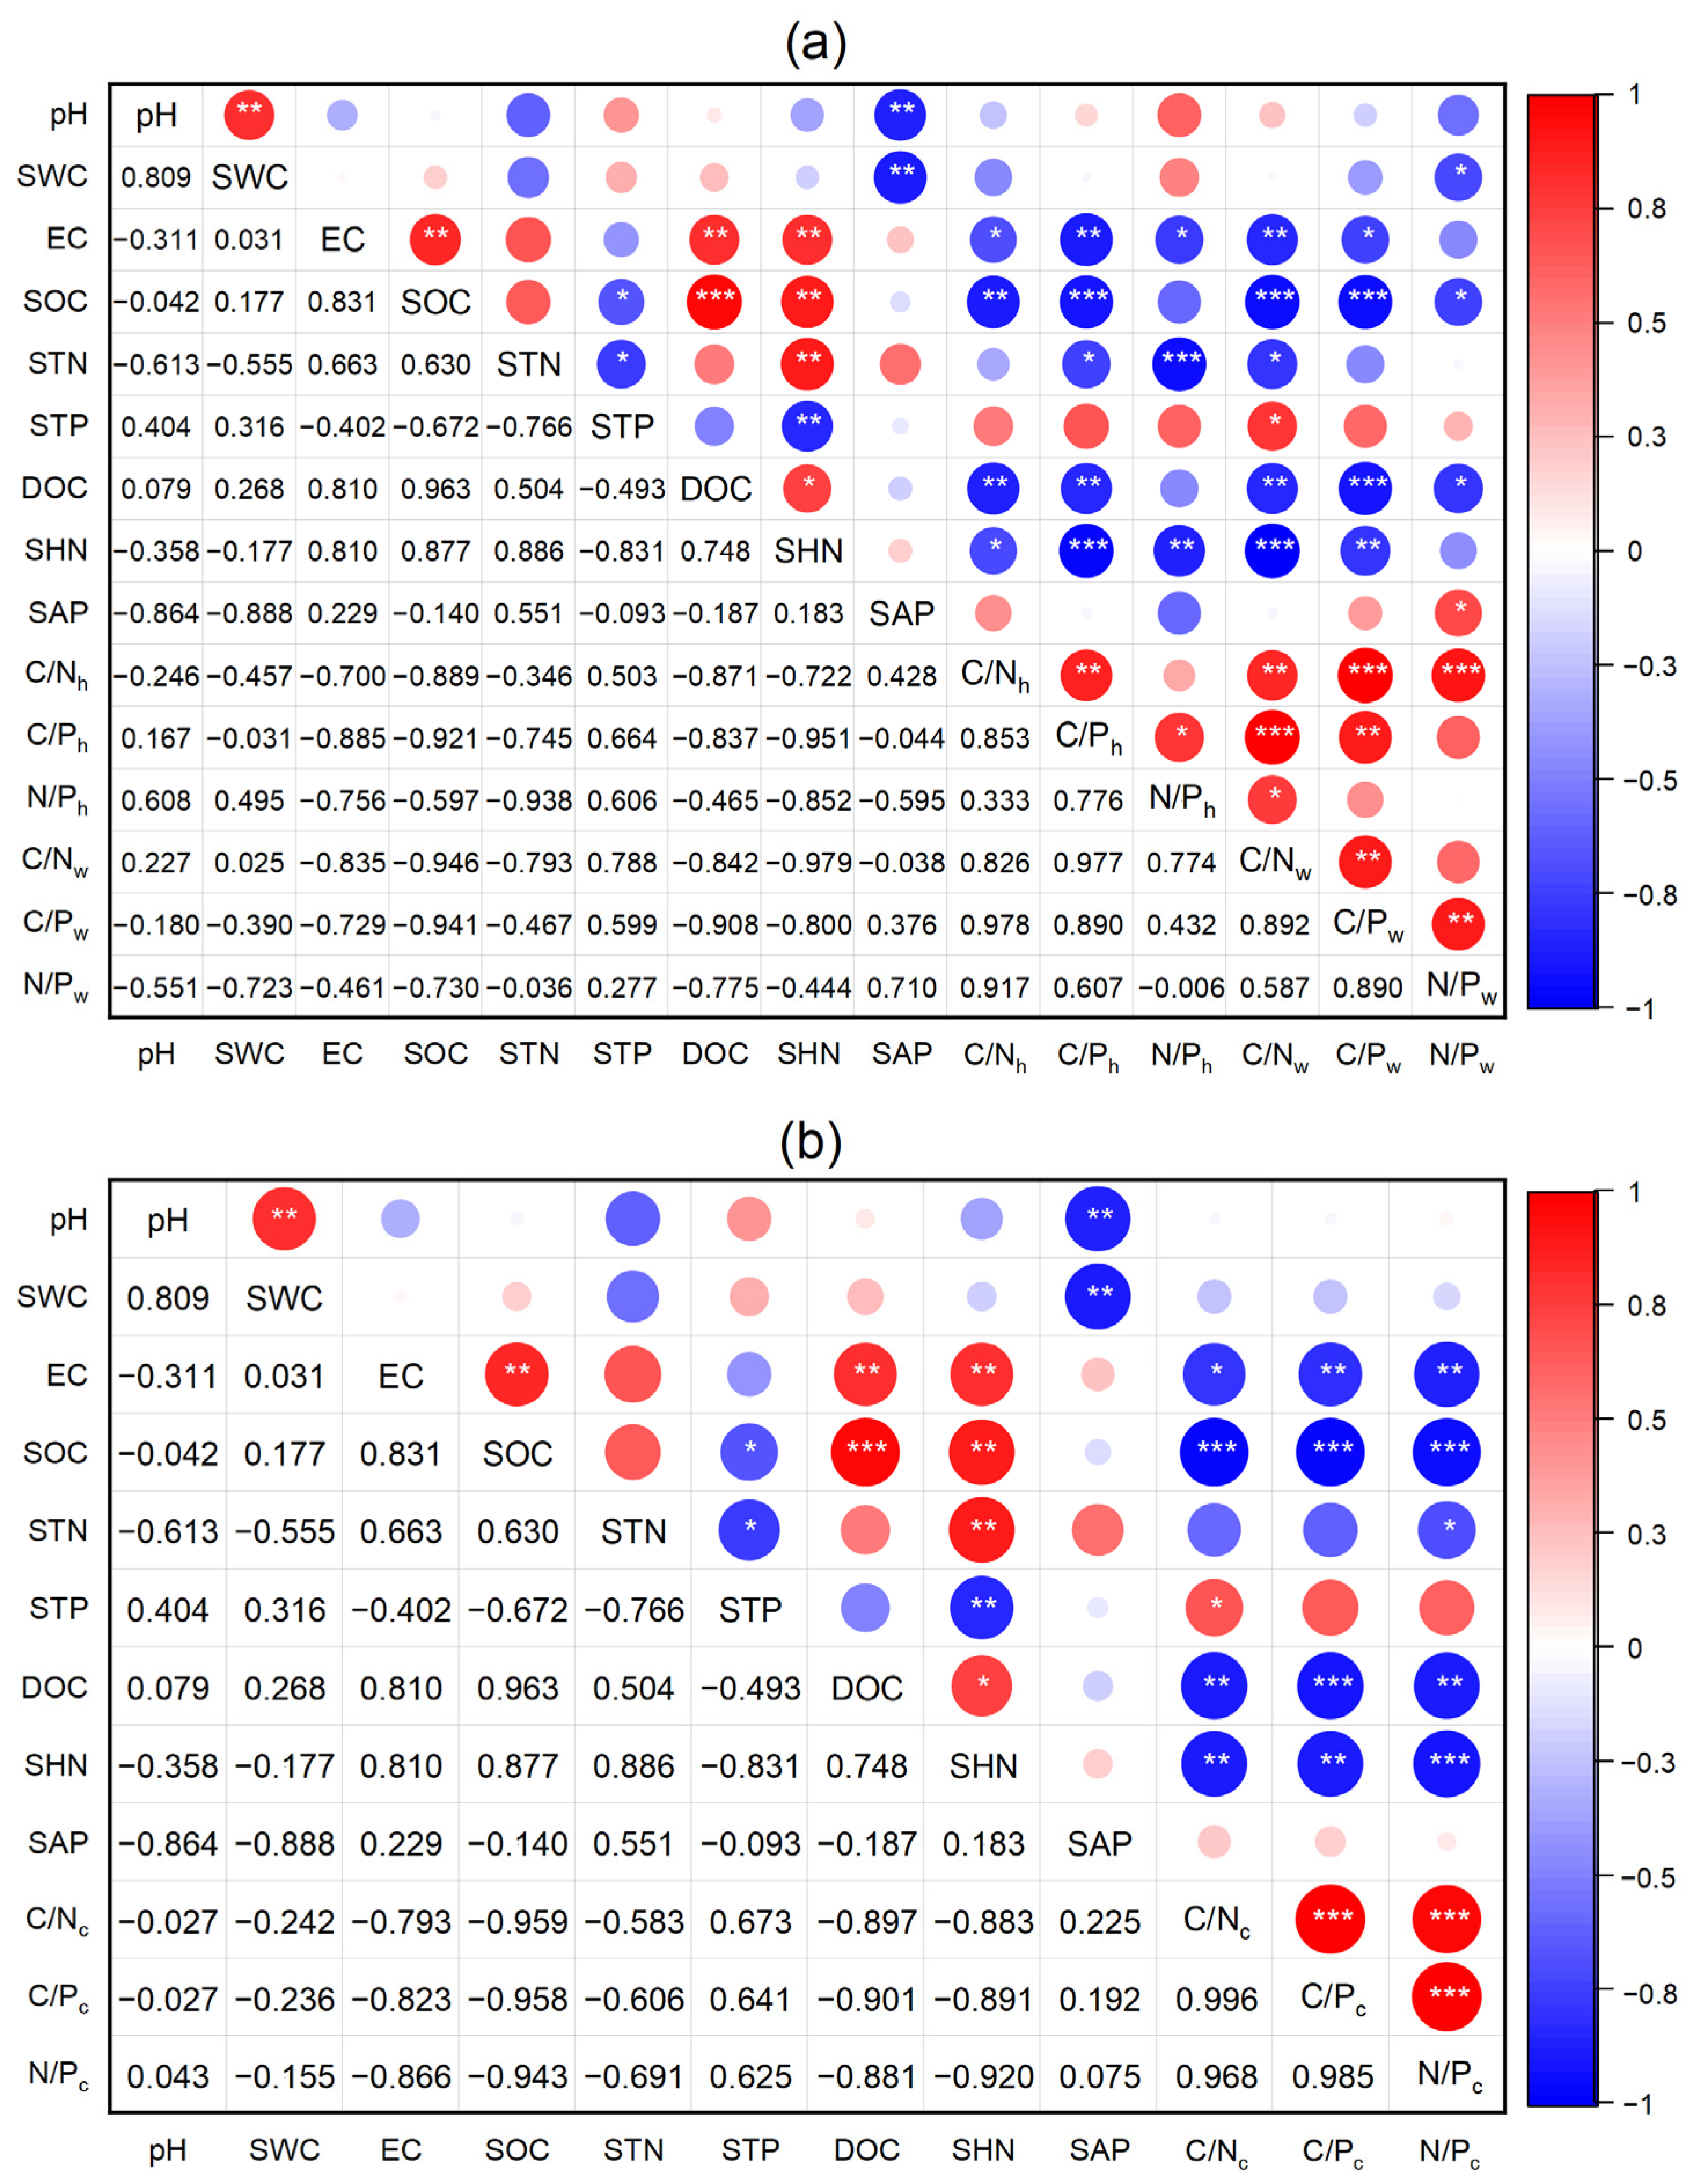
3.4. Relationships Among Soil Physicochemical Properties and Ecological Stoichiometry of Soil and Plants

According to the correlation analysis, soil physicochemical properties had little effect on soil C/N in riparian beach wetlands. In contrast, soil C/P and N/P were influenced by SWC, SHN, and SAP in riparian beach wetlands (p < 0.05). Soil ecological stoichiometry was influenced by soil pH, EC, DOC, SHN, and SAP in DW (p < 0.05) (Figure 4). Based on the redundancy analysis, soil EC and SHN had positive effects on soil ecological stoichiometry across the three wetlands (p < 0.01) (Figure 5b). According to the redundancy analysis (Figure 5d) and correlation analysis (Figure 6b), soil EC, SOC, DOC, and SHN remarkably negatively affected plant ecological stoichiometry across all wetland types (p < 0.05). The ecological stoichiometry of soil was negatively associated with that of plants (p < 0.05) (Figure 7).

4. Discussion

In this study, we investigated soil and plant ecological stoichiometry in lower-beach wetland (LBW), riparian higher-beach wetland (HBW), and depressional wetland (DW) of the Yellow River. These results support our hypothesis that soil and plant ecological stoichiometry vary with wetland type. Furthermore, stoichiometric ratios of plants were closely correlated with those of soil, supporting our further hypothesis. Interestingly, soil and plant stoichiometric ratios oppositely varied with wetland type, which is attributed to the different influences of soil physicochemical properties on soil and plant stoichiometry and their coupling effects.

4.1. Soil and Plant C, N, and P Stoichiometric Characteristics in the Yellow River Wetland

Generally, soil C/N below 25 suggests that soil N does not limit the microbial decomposition of organic matter, thus facilitating the mineralization and release of soil available nutrients [5,36,37]. In our study area, soil C/N was below 25 in the three wetlands (Figure 2d), implying that the decomposition rate of organic matter exceeded its accumulation rate. Moreover, soil C/P below 200 and above 300 implies net P mineralization and immobilization, respectively [36,38,39]. Soil C/P ranged from 2 to 17 in our study (Figure 2e), suggesting net P mineralization. Compared with the soil C/N and C/P in the lower reaches of the Yellow River, those in our study area were slightly higher [4]. Across all wetland types, the average C/N and C/P of plants in our study area were 19.39 and 185.23 (Figure 3), respectively, which were similar to or higher than those in fresh lake wetlands [40,41,42], but they were at a lower level compared with coastal wetlands and terrestrial ecosystems [12,13,43]. The results elucidate that wetland plants in the middle and lower reaches of the Yellow River have weak C assimilation capacity and N and P use efficiency, which is in line with a previous study on riverine wetland [20].
A lower soil N/P means greater N restriction for plant growth [44,45]. Soil N/P was below 2.5 in our research site (Figure 2f), which is comparable to that in the lower reaches of the Yellow River [4]. Across all wetland types, the average plant N/P in our study area was 9.37 at the community level (Figure 3f), higher than that of wetland plants across China [46]. Compared with other riparian wetlands, plant N/P was at an intermediate level [20,23]. Generally, N restricts plant growth when plant N/P < 14. In comparison, P becomes the major limiting factor when plant N/P > 16 [47]. Given the relatively low soil and plant N/P (Figure 2f and Figure 3f), plants in wetlands of the middle and lower reaches of the Yellow River tended to be limited by N, which is in line with previous studies on riparian wetlands [4,20,23].

4.2. Effects of Wetland Type on Soil and Plant Ecological Stoichiometry of C, N, and P

Soil physicochemical properties affected soil C/N little in riparian beach wetlands (Figure 4a,b), which may be attributed to the fact that riparian beach wetlands are proximate to the river and easily affected by river erosion. Dry–wet alternation and water table fluctuation induced by flooding events can cause soil nutrient leaching and redistribution, as well as modify the soil microbial activity involved in C and N cycles [6,19,20]. Therefore, hydrological characteristics may be the main factors that influence soil C/N and might overshadow the direct effects of soil physicochemical properties in these wetlands [15,20]. Dry–wet alternation and water table fluctuation induced by flooding events intensified organic C decomposition [6,19,20], resulting in lower SOC concentration and soil C/N and C/P in HBW (Figure 2d,e). Generally, high soil salinity decreases soil P sorption, enhances leaching [48], and hinders plant N absorption [49]. However, high soil EC accelerated plant P absorption (Figure 5c), contributing to P transfer from soil to plants in DW. Additionally, low soil pH promotes plant P absorption [50]. These processes contributed to the high soil C/P and N/P in DW. Higher soil C/N and C/P indicate a relatively stronger accumulation of SOC, a higher C storage potential, and a weaker nutrient mineralization in DW than in HBW [5,36,39]. Furthermore, compared with HBW and DW, higher SWC promoted microbial activity and available N release [15,16], and frequent flooding led to the migration and loss of soil dissolved N and higher soil C/N and lower soil N/P in LBW (Figure 2d,f).
Compared with LBW and DW, the low SWC in HBW was not conducive to plant nutrient absorption [21,51], resulting in lower N and P concentrations and higher C/N and C/P in plants at community level (Figure 3). Relatively low SWC, SOC, and soil DOC concentrations indicated that HBW had dry and poor soil. Therefore, plants that grew in HBW had to use nutrients more efficiently under the adverse circumstances [52,53,54], exhibiting a high C/N and C/P [8]. This result is consistent with the negative effects of SOC and SHN on plant C/N and C/P (Figure 5d and Figure 6b). High salinity improved soil phosphatase activity, which was conducive to organic matter decomposition, available P release, and plant P absorption [49] (Figure 4c and Figure 5c). Additionally, higher SOC and SHN promoted plant N and P absorption in DW (Figure 5c). These processes decreased plant C/P and N/P in DW. The results are in line with the conclusion that plants will reduce their nutrient use efficiency in a nutrient-rich environment [52,54,55]. The lowest plant C/N and C/P levels suggest that litter decomposed faster in DW than in LBW and HBW, and C and nutrient cycles will intensify in DW [56,57]. Compared with DW, plants in HBW and LBW had higher N/P due to their lower P concentration (Figure 3c). The results indicate that although DW has relatively high soil N content, it is more likely to be limited by soil N compared with riparian beach wetlands.
Woody plants with a long growth cycle have a low nutrient demand in the short term. They optimize N use efficiency by reducing the N allocation to leaves and increasing C/N in low-nutrient environments (Figure 6a), thus maintaining C accumulation in LBW [8]. Woody plants can utilize limited P more efficiently than herbaceous plants [51]. They prioritized P utilization and reduced C accumulation, so their C/P was low in the low-P environment in DW (Table 3). Herbaceous plants usually have a relatively high growth rate and a large demand for nutrients [8,51]. Due to the scarcity of available P in LBW, herbaceous plants maintained their growth by increasing C/P and P use efficiency [9]. In the high-P environment of HBW (Table 3), herbaceous plants absorbed a relatively large amount of P, resulting in a lower C/P ratio [8,13]. In HBW and DW with high soil N availability, the plants’ N acquisition was relatively stable, and no differences in C/N were detected between herbaceous and woody plants. In the low-nutrient environment in LBW (Table 3), woody plants tended to maintain a relatively low N/P to ensure their basic growth and metabolic needs (Figure 6a). Herbaceous plants grew rapidly and absorbed more N in the high-N environment in DW [8,51] (Table 3), resulting in an increase in N/P. In contrast, an abundant supply of soil P promoted P absorption by herbaceous plants in HBW [13], leading to relatively low N/P in herbaceous plants in HBW (Figure 6a). The average N/P of herbaceous plants was higher than that of woody plants, which is not consistent with a study on wetlands across China [46]. The inconsistency of plant N/P may be attributed to the specificity of plant species composition, wetland hydrology condition, and soil physicochemical properties in our study area [15,58]. The N/P of herbaceous and woody plants presented the opposite trend in LBW and HBW, indicating that the nutrient utilization strategies of herbaceous and woody plants are different under different hydrologic and soil environments [20,51].

4.3. The Inconsistent Effects of Soil Factors on Soil and Plant Ecological Stoichiometry

When pooling the wetland types together, soil EC and available nutrients, as the main influencing factors, positively affected soil ecological stoichiometry (Figure 4 and Figure 5b). High soil salinity improves soil phosphatase activity, decreases soil P sorption, and enhances plant P absorption [48,49], thus decreasing soil P. Soil available N promotes plant N uptake and biomass, enhances soil microbial decomposition, and increases C input from plants to soil [5,26]. Therefore, soil EC and hydrolyzed N had positive effects on SOC and STN and negative effects on STP. These changes subsequently increased soil C/N, C/P, and N/P (Figure 5a,b), ultimately intensifying P limitation in the Yellow River wetland. These results underscore that soil salinity and available nutrients play key roles in shaping soil ecological stoichiometry in the Yellow River wetland, which is in line with other studies performed in wetland ecosystems [12].
In contrast to soil stoichiometric characteristics, soil EC and available nutrients mainly presented negative effects on plant ecological stoichiometry at the community level (Figure 5d and Figure 6b). Soil available N facilitated plant N and P absorption, enhanced plant nutrient concentrations (Figure 5c), and finally altered ecological stoichiometry in plants. These phenomena indicate that soil N is vital in regulating plant P utilization strategies and that N and P are coupled in wetland ecosystems [3], which is in line with previous research [52,54,55]. Our results accord with previous studies on wetlands that found that soil salinity and nutrients were the major influencing factors for plant ecological stoichiometry [12,13]. Furthermore, SOC and its dissolved components negatively affected plant stoichiometric ratios, as well as soil salinity and nutrients in the Yellow River wetland (Figure 5d). Soil organic C and DOC can enhance soil microbial biomass C and facilitate soil enzyme activity, and are conducive to organic matter decomposition and nutrient release [26,59,60]. These processes facilitated plant absorption (Figure 5c), thus decreasing plant C/N and C/P. Soil N did not affect woody plant N/P but decreased herbaceous plant N/P (Figure 6a). Therefore, we infer that herbaceous plants absorb P faster than N with increasing soil N in the Yellow River wetland, whereas woody plants have similar absorption rates for N and P [9,13].
In conclusion, soil physicochemical factors and wetland types had opposite effects on plant and soil ecological stoichiometry (Figure 2, Figure 3 and Figure 5), which is attributed to the coupling of matter and elements between plant and soil systems [12,23,24]. Soil physicochemical factors directly affect soil systems, leading to changes in soil microbial activity and processes of organic matter decomposition. Thus, the release and transfer of soil nutrients are altered accordingly [15,16,25]. Plants absorb nutrients that are released from the soil, resulting in a dynamic balance between soil and plant nutrients [6,15,22]. Changes in nutrients in the soil–plant system also have an impact on the C assimilation capacity of plants. Therefore, the coupling effects of C and nutrients between soil and plant systems lead to inconsistent effects of soil physicochemical factors and wetland types on the ecological stoichiometric ratios of soil and plants.

4.4. The Negative Coupling Effects Between Soil and Plant Ecological Stoichiometry in the Yellow River Wetland

Carbon and nutrient concentrations of soil were negatively correlated with those of plants (Figure 7a). Similar relationships between soil and plants for ecological stoichiometry were found (Figure 7b). The results indicate that there exists a strong coupling relationship between plant and soil nutrients, as well as between plant and soil stoichiometric characteristics in the Yellow River wetland. On the one hand, the concentrations of C, N, and P in soil and their stoichiometric ratios affect the nutrient availability for plants [20]. On the other hand, plants react with the soil through processes such as the input of root exudates and litter and nutrient absorption, affecting soil nutrient cycles and stoichiometric characteristics [23,59]. When the stoichiometric ratios of soil and plants show negative correlations in this study, it may mean that plants are constantly adapting to changes in the soil environment and regulating the nutrient status of the soil to a certain extent. In addition, hydrologic and soil factors may play an important regulatory role in these negative correlation relationships, further affecting the dynamic balance of nutrients and stoichiometric ratios between soil and plants [6].

5. Conclusions

In this study, we investigated the variations in C and nutrient stoichiometric characteristics across different wetland types of the Yellow River at the junction of the middle and lower reaches. Firstly, due to the roughly opposite effects of soil physicochemical factors, the C and nutrient stoichiometric characteristics of soil and plants varied inconsistently in riparian beach wetland and depressional wetland (DW). Depressional wetland exhibited greater soil C/N (9.15 ± 0.13), C/P (11.17 ± 0.52), and N/P (1.08 ± 0.09) due to its higher soil salinity and available N, indicating its substantial potential for C and N storage compared with riparian higher-beach wetland (HBW). Riparian higher-beach wetland showed high plant C/N (22.91 ± 0.90) and C/P (241.04 ± 3.28) owing to its dry soil environment, indicating that plants in this area had a high efficiency of nutrient utilization. In comparison, low plant C/N (14.44 ± 1.02) and C/P (115.66 ± 2.82), owing to the high soil salinity and available N, contributed to litter decomposition and nutrient cycles in DW. Secondly, compared with riparian beach wetlands, soil physicochemical properties affected soil stoichiometry more in DW. Riparian beach wetlands had higher plant stoichiometric ratios due to the lower soil salinity and available nutrients. Across the three wetlands, soil salinity and available nutrients positively affected soil ecological stoichiometry, but they negatively influenced plant ecological stoichiometry, which was regulated by plant functional groups. Lastly, soil and plant ecological stoichiometry were negatively coupled in the Yellow River wetland, suggesting that the interaction and balance between plant and soil stoichiometry should be fully considered to promote the stability of riverine wetlands when formulating protection strategies for the Yellow River wetland. Our research will contribute to improving biogeochemical models, predicting C and nutrient cycles under changing wetland landscape patterns, and data support for the sustainable development of the Yellow River wetland.

Author Contributions

Formal analysis and investigation, C.Y. and J.G.; Writing—original draft, C.Y.; Writing—review and editing, Y.L.; Funding acquisition, C.Y., Y.L. and X.W. All authors have read and agreed to the published version of the manuscript.

Funding

This work was supported by the Fundamental Research Fund of Henan Academy of Sciences (240601086), the Soft Science Research Project of Henan Province (242400410184), the Joint Fund of Henan Province Science and Technology R&D Program (225200810047), the Scientific and Technological Research Project of Henan Province (242102320227), the National Natural Science Foundation of China (42207381), and the China Postdoctoral Science Foundation (2023M733230). The funders had no role in the study design, data collection, data analysis, decision to publish, or preparation of the manuscript.

Institutional Review Board Statement

Not applicable.

Informed Consent Statement

Not applicable.

Data Availability Statement

Data are available upon request.

Conflicts of Interest

The authors declare no conflicts of interest.

References

  1. Julian, P.; Gerber, S.; Bhomia, R.K.; King, J.; Osborne, T.Z.; Wright, A.L.; Powers, M.; Dombrowski, J. Evaluation of nutrient stoichiometric relationships among ecosystem compartments of a subtropical treatment wetland. Do we have “Redfield wetlands”? Ecol. Process. 2019, 8, 20. [Google Scholar] [CrossRef]
  2. Sardans, J.; Rivas-Ubach, A.; Penuelas, J. The elemental stoichiometry of aquatic and terrestrial ecosystems and its relationships with organismic lifestyle and ecosystem structure and function: A review and perspectives. Biogeochemistry 2012, 111, 1–39. [Google Scholar] [CrossRef]
  3. Zhang, J.H.; Li, M.X.; Xu, L.; Zhu, J.X.; Dai, G.H.; He, N.P. C:N:P stoichiometry in terrestrial ecosystems in China. Sci. Total Environ. 2021, 795, 148849. [Google Scholar] [CrossRef] [PubMed]
  4. Lin, Q.W.; Huai, Z.W.; Riaz, L.; Liu, T.S.; Wang, S.S.; Li, Y.C.; Bai, X.X.; Yan, G.X.; Yu, F.; Ma, J.M. Wetland-type conversion drives the C, N and P stoichiometry change of soil in river plain of lower of the Yellow River. Soil Use Manag. 2023, 39, 1335–1350. [Google Scholar] [CrossRef]
  5. He, J.Y.; Chen, B.B.; Xu, W.Z.; Xiang, C.Y.; Kuang, W.N.; Zhao, X.H. Driving factors for soil C:N ratio in woody plant communities across northeastern Qinghai-Tibetan Plateau. Catena 2023, 233, 107504. [Google Scholar] [CrossRef]
  6. Li, X.F.; Ding, C.X.; Bu, H.; Han, L.L.; Ma, P.; Su, D.R. Effects of submergence frequency on soil C:N:P ecological stoichiometry in riparian zones of Hulunbuir steppe. J. Soils Sed. 2020, 20, 1480–1493. [Google Scholar] [CrossRef]
  7. Zhang, Z.; Xue, Z.; Lyu, X.; Tong, S.; Jiang, M. Scaling of soil carbon, nitrogen, phosphorus and C:N:P ratio patterns in peatlands of China. Chin. Geogr. Sci. 2017, 27, 507–515. [Google Scholar] [CrossRef]
  8. Zhang, J.H.; He, N.P.; Liu, C.C.; Xu, L.; Chen, Z.; Li, Y.; Wang, R.M.; Yu, G.R.; Sun, W.; Xiao, C.W.; et al. Variation and evolution of C:N ratio among different organs enable plants to adapt to N-limited environments. Glob. Change Biol. 2020, 26, 2534–2543. [Google Scholar] [CrossRef]
  9. Zhang, J.H.; He, N.P.; Liu, C.C.; Xu, L.; Yu, Q.; Yu, G.R. Allocation strategies for nitrogen and phosphorus in forest plants. Oikos 2018, 127, 1506–1514. [Google Scholar] [CrossRef]
  10. Junk, W.J.; An, S.Q.; Finlayson, C.M.; Gopal, B.; Kvet, J.; Mitchell, S.A.; Mitsch, W.J.; Robarts, R.D. Current state of knowledge regarding the world’s wetlands and their future under global climate change: A synthesis. Aquat. Sci. 2013, 75, 151–167. [Google Scholar] [CrossRef]
  11. Hefting, M.M.; Van Den Heuvel, R.N.; Verhoeven, J.T.A. Wetlands in agricultural landscapes for nitrogen attenuation and biodiversity enhancement: Opportunities and limitations. Ecol. Eng. 2013, 56, 5–13. [Google Scholar] [CrossRef]
  12. Zuo, X.Y.; Cui, L.J.; Li, W.; Lei, Y.R.; Dou, Z.G.; Liu, Z.J.; Cai, Y.; Zhai, X.J. Spartina alterniflora leaf and soil eco-stoichiometry in the Yancheng coastal wetland. Plants 2021, 10, 13. [Google Scholar] [CrossRef]
  13. Hu, Y.K.; Liu, X.Y.; He, N.P.; Pan, X.; Long, S.Y.; Li, W.; Zhang, M.Y.; Cui, L.J. Global patterns in leaf stoichiometry across coastal wetlands. Glob. Ecol. Biogeogr. 2021, 30, 852–869. [Google Scholar] [CrossRef]
  14. Xu, C.Y.; Pu, L.J.; Li, B.W.; Xu, Y.; Kong, F.B. Coupling mechanism of C:N:P stoichiometry between plant and soil after long-term reclamation in the coastal area, eastern China. Reg. Stud. Mar. Sci. 2023, 68, 103178. [Google Scholar] [CrossRef]
  15. Hu, C.; Li, F.; Xie, Y.H.; Deng, Z.M.; Hou, Z.Y.; Li, X. Spatial distribution and stoichiometry of soil carbon, nitrogen and phosphorus along an elevation gradient in a wetland in China. Eur. J. Soil Sci. 2019, 70, 1128–1140. [Google Scholar] [CrossRef]
  16. Wang, W.Q.; Wang, C.; Sardans, J.; Tong, C.; Jia, R.X.; Zeng, C.S.; Penuelas, J. Flood regime affects soil stoichiometry and the distribution of the invasive plants in subtropical estuarine wetlands in China. Catena 2015, 128, 144–154. [Google Scholar] [CrossRef]
  17. Wang, W.Q.; Sardans, J.; Wang, C.; Zeng, C.S.; Tong, C.; Bartrons, M.; Asensio, D.; Penuelas, J. Shifts in plant and soil C, N and P accumulation and C:N:P stoichiometry associated with flooding intensity in subtropical estuarine wetlands in China. Estuar. Coast. Shelf Sci. 2018, 215, 172–184. [Google Scholar] [CrossRef]
  18. Shen, R.C.; Yang, H.; Rinklebe, J.; Bolan, N.; Hu, Q.W.; Huang, X.Y.; Wen, X.T.; Zheng, B.F.; Shi, L. Seasonal flooding wetland expansion would strongly affect soil and sediment organic carbon storage and carbon-nutrient stoichiometry. Sci. Total Environ. 2022, 828, 154427. [Google Scholar] [CrossRef]
  19. Zhang, Q.J.; Wang, Z.S.; Xia, S.X.; Zhang, G.S.; Li, S.X.; Yu, D.K.; Yu, X.B. Hydrologic-induced concentrated soil nutrients and improved plant growth increased carbon storage in a floodplain wetland over wet-dry alternating zones. Sci. Total Environ. 2022, 822, 153512. [Google Scholar] [CrossRef]
  20. Wang, L.; Arif, M.; Zheng, J.; Li, C.X. Patterns and drivers of plant carbon, nitrogen, and phosphorus stoichiometry in a novel riparian ecosystem. Front. Plant Sci. 2024, 15, 1354222. [Google Scholar] [CrossRef]
  21. Zhou, Y.; Jiao, L.; Qin, H.J.; Li, F. Effect of environmental stress on the nutrient stoichiometry of the clonal plant Phragmites australis in inland riparian wetlands of northwest China. Front. Plant Sci. 2021, 12, 705319. [Google Scholar] [CrossRef]
  22. Li, D.X.; Li, Y.N.; Xie, Y.L.; Cui, B.S.; Ning, Z.H.; Zhang, S.Y.; Bi, Z.G.; Fu, S.Q.; Che, C.G. Effects of ecological restoration on soil biogenic elements and their ecological stoichiometry in the Yellow River Delta, China. Front. Mar. Sci. 2022, 9, 993202. [Google Scholar] [CrossRef]
  23. Yu, M.F.; Tao, Y.X.; Liu, W.Z.; Xing, W.; Liu, G.H.; Wang, L.; Ma, L. C, N, and P stoichiometry and their interaction with different plant communities and soils in subtropical riparian wetlands. Environ. Sci. Pollut. Res. 2020, 27, 1024–1034. [Google Scholar] [CrossRef]
  24. Ren, G.Q.; Cui, M.M.; Yu, H.C.; Fan, X.; Zhu, Z.Q.; Zhang, H.Y.; Dai, Z.C.; Sun, J.F.; Yang, B.; Du, D.L. Global environmental change shifts ecological stoichiometry coupling between plant and soil in early-stage invasions. J. Soil. Sci. Plant Nutr. 2024, 24, 2402–2412. [Google Scholar] [CrossRef]
  25. Xu, Z.W.; Wang, Y.T.; Sun, D.J.; Li, H.K.; Dong, Y.M.; Wang, Z.C.; Wang, S.Z. Soil nutrients and nutrient ratios influence the ratios of soil microbial biomass and metabolic nutrient limitations in mountain peatlands. Catena 2022, 218, 106528. [Google Scholar] [CrossRef]
  26. Zhu, M.Y.; Song, Y.Y.; Li, M.T.; Gong, C.; Liu, Z.D.; Yuan, J.B.; Li, X.Y.; Song, C.C. Ammonia nitrogen and dissolved organic carbon regulate soil microbial gene abundances and enzyme activities in wetlands under different vegetation types. Appl. Soil Ecol. 2024, 196, 105310. [Google Scholar] [CrossRef]
  27. Ye, C.; Butler, O.M.; Chen, C.R.; Liu, W.Z.; Du, M.; Zhang, Q.F. Shifts in characteristics of the plant-soil system associated with flooding and revegetation in the riparian zone of Three Gorges Reservoir, China. Geoderma 2020, 361, 114015. [Google Scholar] [CrossRef]
  28. Zhang, K.L.; Feng, R.R.; Han, J.N.; Zhang, Z.C.; Zhang, H.J.; Liu, K. Temporal and spatial differentiation characteristics of ecosystem service values based on the ecogeographical division of China: A case study in the Yellow River Basin, China. Environ. Sci. Pollut. Res. 2022, 30, 8317–8337. [Google Scholar] [CrossRef]
  29. Liang, G.F.; Ding, S.Y. Impacts of human activity and natural change on the wetland landscape pattern along the Yellow River in Henan Province. J. Geogr. Sci. 2004, 14, 339–348. [Google Scholar] [CrossRef]
  30. Keddy, P.A. Wetland Ecology, Principles, and Conservation, 2nd ed.; Higher Education Press: Beijing, China, 2018; pp. 10–13. [Google Scholar]
  31. Mitsch, W.J.; Bernal, B.; Nahlik, A.M.; Mander, U.; Zhang, L.; Anderson, C.J.; Jorgensen, S.E.; Brix, H. Wetlands, carbon, and climate change. Landsc. Ecol. 2013, 28, 583–597. [Google Scholar] [CrossRef]
  32. Wang, Y.L.; Hu, Y.Y.; Yang, C.M.; Chen, Y.Y. Effects of vegetation types on water-extracted soil organic matter (WSOM) from riparian wetland and its impacts on riverine water quality: Implications for riparian wetland management. Sci. Total Environ. 2018, 628–629, 1249–1257. [Google Scholar] [CrossRef]
  33. Kalembasa, S.J.; Jenkinson, D.S. A comparative study of titrimetric and gravimetric methods for the determination of organic carbon in soil. J. Sci. Food Agric. 1973, 24, 1085–1090. [Google Scholar] [CrossRef]
  34. Parkinson, J.A.; Allen, S.E. A wet oxidation procedure suitable for the determination of nitrogen and mineral nutrients in biological material. Commun. Soil. Sci. Plant Anal. 1975, 6, 1–11. [Google Scholar] [CrossRef]
  35. Olsen, S.R.; Cole, C.V.; Watanabe, F.S.; Dean, S. Estimation of Available Phosphorus in Soils by Extraction with Sodium Bicarbonate; United States Department of Agriculture: Washington, DC, USA, 1954.
  36. Bui, E.N.; Henderson, B.L. C:N:P stoichiometry in Australian soils with respect to vegetation and environmental factors. Plant Soil 2013, 373, 553–568. [Google Scholar] [CrossRef]
  37. Zou, Y.H.; Tang, X.Y.; Cui, L.J.; Li, H.Z.; Lei, Y.R.; Zhao, X.S.; Zhai, X.J.; Li, J.; Wang, J.Z.; Wang, R.M.; et al. Analysis of coupled wetland soil–plant ecological stoichiometric characteristics of carbon, nitrogen, and phosphorus under different disturbance intensities. Plant Soil 2024. [Google Scholar] [CrossRef]
  38. Paul, E.A. Soil Microbiology and Biochemistry, 3rd ed.; Academic Press: London, UK, 2006; p. 254. [Google Scholar]
  39. Zhao, F.Z.; Sun, J.; Ren, C.J.; Kang, D.; Deng, J.; Han, X.H.; Yang, G.H.; Feng, Y.Z.; Ren, G.X. Land use change influences soil C, N, and P stoichiometry under “Grain-to-Green Program” in China. Sci. Rep. 2015, 5, 10195. [Google Scholar] [CrossRef]
  40. Xia, C.X.; Yu, D.; Wang, Z.; Xie, D. Stoichiometry patterns of leaf carbon, nitrogen and phosphorous in aquatic macrophytes in eastern China. Ecol. Eng. 2014, 70, 406–413. [Google Scholar] [CrossRef]
  41. Dibar, D.T.; Zhang, K.; Yuan, S.Q.; Zhang, J.Y.; Zhou, Z.Z.; Ye, X.X. Ecological stoichiometric characteristics of Carbon (C), Nitrogen (N) and Phosphorus (P) in leaf, root, stem, and soil in four wetland plants communities in Shengjin Lake, China. PLoS ONE 2020, 15, e0230089. [Google Scholar] [CrossRef]
  42. Wang, J.Q.; Liu, B.; Chang, F.; Ma, Z.J.; Fan, J.H.; He, X.J.; You, S.X.; Aerziguli, A.; Yang, Y.K.; Shen, X.Y. Plant functional traits and ecological stoichiometric characteristics under water-salt gradient in the lakeshore zone of Bosten Lake. Chin. J. Plant Ecol. 2022, 46, 961–970. [Google Scholar] [CrossRef]
  43. Tang, Z.Y.; Xu, W.T.; Zhou, G.Y.; Bai, Y.F.; Li, J.X.; Tang, X.L.; Chen, D.M.; Liu, Q.; Ma, W.H.; Xiong, G.M.; et al. Patterns of plant carbon, nitrogen, and phosphorus concentration in relation to productivity in China’s terrestrial ecosystems. Proc. Natl. Acad. Sci. USA 2018, 115, 4033–4038. [Google Scholar]
  44. Guo, X.; Jiang, Y.F. Spatial characteristics of ecological stoichiometry and their driving factors in farmland soils in Poyang Lake Plain, Southeast China. J. Soils Sed. 2019, 19, 263–274. [Google Scholar] [CrossRef]
  45. Peñuelas, J.; Sardans, J.; Rivas-Ubach, A.; Janssens, I.A. The human-induced imbalance between C, N and P in Earth’s life system. Glob. Change Biol. 2012, 18, 3–6. [Google Scholar] [CrossRef]
  46. Hu, W.F.; Zhang, W.L.; Zhang, L.H.; Chen, X.Y.; Lin, W.; Zeng, C.S.; Tong, C. Stoichiometric characteristics of nitrogen and phosphorus in major wetland vegetation of China. Chin. J. Plant Ecol. 2014, 38, 1041–1052. [Google Scholar] [CrossRef]
  47. Koerselman, W.; Meuleman, A.F.M. The vegetation N:P ratio: A new tool to detect the nature of nutrient limitation. J. Appl. Ecol. 1996, 33, 1441–1450. [Google Scholar] [CrossRef]
  48. Bai, J.H.; Ye, X.F.; Jia, J.; Zhang, G.L.; Zhao, Q.Q.; Cui, B.S.; Liu, X.H. Phosphorus sorption-desorption and effects of temperature, pH and salinity on phosphorus sorption in marsh soils from coastal wetlands with different flooding conditions. Chemosphere 2017, 188, 677–688. [Google Scholar] [CrossRef]
  49. Miura, K. Nitrogen and phosphorus nutrition under salinity stress. In Ecophysiology and Responses of Plants Under Salt Stress; Ahmad, P., Azooz, M.M., Prasad, M.N.V., Eds.; Springer: New York, NY, USA, 2013; pp. 425–441. [Google Scholar]
  50. Gao, Z.Q.; Fang, H.J.; Bai, J.H.; Jia, J.; Lu, Q.Q.; Wang, J.J.; Chen, B. Spatial and seasonal distributions of soil phosphorus in a short-term flooding wetland of the Yellow River Estuary, China. Ecol. Inform. 2016, 31, 83–90. [Google Scholar] [CrossRef]
  51. Chen, Y.; Li, Y.Q.; Wang, L.L.; Duan, Y.L.; Cao, W.J.; Wang, X.Y.; Li, Y.L. Heterogeneity of leaf stoichiometry of different life forms along environmental transects in typical ecologically fragile areas of China. Sci. Total Environ. 2024, 910, 168495. [Google Scholar] [CrossRef]
  52. Yan, C.; Liu, Z.C.; Yuan, Z.Y.; Shi, X.R.; Lock, T.R.; Kallenbach, R.L. Aridity modifies the responses of plant stoichiometry to global warming and nitrogen deposition in semi-arid steppes. Sci. Total Environ. 2022, 831, 154807. [Google Scholar] [CrossRef]
  53. Yuan, Z.Y.; Li, L.H.; Han, X.G.; Chen, S.P.; Wang, Z.W.; Chen, Q.S.; Bai, W.M. Nitrogen response efficiency increased monotonically with decreasing soil resource availability: A case study from a semiarid grassland in northern China. Oecologia 2006, 148, 564–572. [Google Scholar] [CrossRef]
  54. Guo, L.Z.; Meng, H.Z.; Teng, K.; Fan, X.F.; Zhang, H.; Teng, W.J.; Yue, Y.S.; Wu, J.Y. Effects of nitrogen forms on the growth and nitrogen accumulation in Buchloe dactyloides seedlings. Plants 2022, 11, 2086. [Google Scholar] [CrossRef]
  55. Ochoa-Hueso, R.; Pérez-Corona, M.E.; Manrique, E. Impacts of simulated N deposition on plants and mycorrhizae from Spanish semiarid Mediterranean shrublands. Ecosystems 2013, 16, 838–851. [Google Scholar] [CrossRef]
  56. Ridgeway, J.R.; Morrissey, E.M.; Brzostek, E.R. Plant litter traits control microbial decomposition and drive soil carbon stabilization. Soil Biol. Biochem. 2022, 175, 108857. [Google Scholar] [CrossRef]
  57. Wu, J.J.; Zhang, H.; Cheng, X.L.; Liu, G.H. Nitrogen addition stimulates litter decomposition rate: From the perspective of the combined effect of soil environment and litter quality. Soil Biol. Biochem. 2023, 179, 108992. [Google Scholar] [CrossRef]
  58. Gusewell, S. N: P ratios in terrestrial plants: Variation and functional significance. New Phytol. 2004, 164, 243–266. [Google Scholar] [CrossRef] [PubMed]
  59. Smith, D.J.; Duston, S.; Barney, J.N.; Strahm, B.D.; Agarwal, P.; Mangru, A.; Badgley, B.D. Dissolved organic carbon characteristics are associated with changes in soil microbiome under different plant species. Appl. Soil Ecol. 2024, 196, 105313. [Google Scholar] [CrossRef]
  60. Xiao, Q.T.; Xu, X.F.; Qi, T.C.; Luo, J.H.; Lee, X.H.; Duan, H.T. Lakes shifted from a carbon dioxide source to a sink over past two decades in China. Sci. Bull. 2024, 69, 1857–1861. [Google Scholar] [CrossRef]
Figure 1. Map of the sampling sites.
Sustainability 17 03276 g001
Figure 2. Soil organic C (SOC) (a), total N (STN) (b), total P (STP) (c), C/N (d), C/P (e), and N/P (f) in 0–15 and 15–30 cm soil layers in riparian lower-beach wetland (LBW), riparian higher-beach wetland (HBW), and depressional wetland (DW) of the Yellow River. Error bars represent the standard error of the mean. Different uppercase letters indicate significant variations among wetland types within the same soil layer, and different lowercase letters indicate significant variations between soil layers within the same wetland type (p < 0.05).
Sustainability 17 03276 g002
Figure 3. Herbaceous and woody plant C (a), N (b), and P (c) concentrations and C/N (d), C/P (e), and N/P (f) in riparian lower-beach wetland (LBW), riparian higher-beach wetland (HBW), and depressional wetland (DW) of the Yellow River. Insets represent the values at community level. Error bars represent the standard error of the mean. Different uppercase letters indicate significant variations among wetland types within the same soil layer, and different lowercase letters indicate significant variations between soil layers within the same wetland type (p < 0.05).
Sustainability 17 03276 g003
Figure 4. Correlation coefficients between soil stoichiometric ratios and soil physicochemical properties in riparian lower-beach wetland (a), riparian higher-beach wetland (b), and depressional wetland (c). EC: soil electrical conductivity; SWC: soil water content; SOC: soil organic C; STN: soil total N; STP: soil total P; DOC: soil dissolved organic C; SHN: soil hydrolyzed N; SAP: soil available P. C/Ns, C/Ps, and N/Ps are soil C/N, C/P, and N/P, respectively. “*” indicates p < 0.05, “**” indicates p < 0.01, and “***” indicates p < 0.001.
Sustainability 17 03276 g004
Figure 5. Redundancy analysis of the relationships among soil physicochemical properties (a) and correlations of soil ecological stoichiometry (b), plant C and nutrient concentrations (c), plant ecological stoichiometry (d), and soil physicochemical properties. EC: soil electrical conductivity; SWC: soil water content; SOC: soil organic C; STN: soil total N; STP: soil total P; DOC: soil dissolved organic C; SHN: soil hydrolyzed N; SAP: soil available P. CP, NP, and PP are plant C, N, and P concentrations, respectively; C/Ns, C/Ps, and N/Ps are soil C/N, C/P, and N/P, respectively; C/Nc, C/Pc, and N/Pc are plant C/N, C/P, and N/P at community level, respectively.
Sustainability 17 03276 g005
Figure 6. Correlation coefficients between plant stoichiometric ratios and soil physicochemical properties at functional group (a) and community (b) level. EC: soil electrical conductivity; SWC: soil water content; SOC: soil organic C; STN: soil total N; STP: soil total P; DOC: soil dissolved organic C; SHN: soil hydrolyzed N; SAP: soil available P. C/Nh, C/Ph, and N/Ph are herbaceous plant C/N, C/P, and N/P, respectively; C/Nw, C/Pw, and N/Pw are woody plant C/N, C/P, and N/P, respectively; C/Nc, C/Pc, and N/Pc are plant C/N, C/P, and N/P at community level, respectively. “*” indicates p < 0.05, “**” indicates p < 0.01, and “***” indicates p < 0.001.
Sustainability 17 03276 g006
Figure 7. Redundancy analysis of the relationships among soil, plant C, nutrients (a), and their ecological stoichiometry (b). SOC: soil organic C; STN: soil total N; STP: soil total P; CP, NP, and PP are plant C, N, and P concentrations, respectively; C/NS, C/PS, and N/PS are soil C/N, C/P, and N/P, respectively; C/NP, C/PP, and N/PP are plant C/N, C/P, and N/P, respectively.
Sustainability 17 03276 g007
Table 1. The plant species collected from riparian lower-beach wetland (LBW), riparian higher-beach wetland (HBW), and depressional wetland (DW) in this study.
Wetland TypePlant SpeciesLife FormGrowth CycleFamily
LBWTamarix chinensisWoodyPerennialTamaricaceae
Periploca sepiumWoodyPerennialApocynaceae
Salix matsudanaWoodyPerennialSalicaceae
Phragmites australisHerbaceousPerennialGramineae
Eleusine indicaHerbaceousAnnualGramineae
Rumex acetosaHerbaceousPerennialPolygonaceae
Persicaria lapathifoliaHerbaceousAnnualPolygonaceae
Typha orientalisHerbaceousPerennialTyphaceae
HBWTamarix chinensisWoodyPerennialTamaricaceae
Phragmites australisHerbaceousPerennialGramineae
Persicaria lapathifoliaHerbaceousAnnualPolygonaceae
Typha orientalisHerbaceousPerennialTyphaceae
Polygonum aviculareHerbaceousAnnualPolygonaceae
DWTamarix chinensisWoodyPerennialTamaricaceae
Salix matsudanaWoodyPerennialSalicaceae
Phragmites australisHerbaceousPerennialGramineae
Chenopodium albumHerbaceousAnnualAmaranthaceae
Cynodon dactylonHerbaceousPerennialGramineae
Klasea centauroidesHerbaceousPerennialAsteraceae
Table 2. Two-way ANOVA of main and interactive effects of wetland type (W) and soil depth (S) on soil pH, water content (SWC), C/N (C/NS), C/P (C/PS), N/P (N/PS), and concentrations of soil organic C (SOC), total N (STN), total P (STP), dissolved organic C (DOC), hydrolyzed N (SHN), and available P (SAP).
IndexVariablespHECSWCSOCSTNSTPC/NSC/PSN/PSDOCSHNSAP
FW21.861.2555.7326.6717.043.5011.9627.9662.8718.74206.4010.62
S22.4312.450.616.5146.7815.380.464.76106.511.77254.5019.98
W × S10.9311.920.7230.1815.248.963.7721.9049.791.92137.705.52
p valueW<0.0010.320<0.001<0.001<0.0010.0640.001<0.001<0.001<0.001<0.0010.002
S<0.0010.0040.4500.025<0.0010.002<0.001<0.001<0.0010.208<0.001<0.001
W × S0.0020.0010.507<0.001<0.0010.004<0.001<0.001<0.0010.189<0.0010.020
Notes: Data represent F and p values.
Table 3. Soil pH, electrical conductivity (EC), water content (SWC), dissolved organic C (DOC), hydrolyzed N (SHN), and available P (SAP) in riparian lower-beach wetland (LBW), riparian higher-beach wetland (HBW), and depressional wetland (DW) (mean ± S.E.).
ParametersLBWHBWDW
0–15 cm15–30 cm0–15 cm15–30 cm0–15 cm15–30 cm
pH7.42 ± 0.01 Aa7.61 ± 0.00 Ab7.12 ± 0.08 Ba7.53 ± 0.08 Ab7.22 ± 0.00 ABa7.18 ± 0.01 Bb
EC (µS cm−1)226.99 ± 34.26 Aa214.93 ± 36.15 ABa245.30 ± 38.51 Aa253.50 ± 2.31 Aa379.50 ± 17.61 Ba147.30 ± 14.02 Bb
SWC (%)25.33 ± 1.91 Aa30.24 ± 2.29 Aa9.40 ± 0.19 Ba5.86 ± 0.58 Ba20.95 ± 0.92 Aa18.54 ± 1.37 Ca
DOC (mg kg−1)328.89 ± 34.91 Aa716.21 ± 42.51 Ab253.86 ± 5.02 Aa191.90 ± 10.53 Bb484.70 ± 40.09 Ba606.98 ± 10.59 Cb
SHN (mg kg−1)22.17 ± 0.36 Aa15.78 ± 1.07 Ab52.22 ± 0.43 Ba33.40 ± 1.92 Bb148.76 ± 8.27 Ca33.04 ± 2.12 Bb
SAP (mg kg−1)3.86 ± 0.97 Aa3.87 ± 0.86 Aa9.43 ± 0.85 Ba4.79 ± 0.83 Ab6.54 ± 0.04 ABa3.30 ± 0.10 Ab
Notes: Different uppercase letters indicate significant variations among wetland types within the same soil layer, and different lowercase letters indicate significant variations between soil layers within the same wetland type (p < 0.05).
Table 4. Two-way ANOVA of main and interactive effects of wetland type (W) and plant functional group (G) on plant C (CP), N (NP), and P (PP) concentrations and C/N (C/NP), C/P (C/PP), and N/P (N/PP).
IndexVariablesCPNPPPC/NPC/PPN/PP
FW41.9456.8165.0024.8314.8116.72
G1.3613.860.4190.5645.9917.33
W × G52.4213.6326.0460.4763.2716.34
p valueW<0.001<0.001<0.001<0.001<0.001<0.001
G0.330<0.0010.535<0.001<0.001<0.001
W × G<0.001<0.001<0.001<0.001<0.001<0.001
Notes: Data represent F and p values.
Disclaimer/Publisher’s Note: The statements, opinions and data contained in all publications are solely those of the individual author(s) and contributor(s) and not of MDPI and/or the editor(s). MDPI and/or the editor(s) disclaim responsibility for any injury to people or property resulting from any ideas, methods, instructions or products referred to in the content.

