Article

Exploring the Spatial and Temporal Correlation Between Habitat Quality and Habitat Fragmentation in the West Qinling Mountains, China

College of Resources and Environmental Sciences, Gansu Agricultural University, Lanzhou 730070, China
*
Author to whom correspondence should be addressed.
Sustainability 2025, 17(7), 3256; https://doi.org/10.3390/su17073256
Submission received: 22 January 2025 / Revised: 1 April 2025 / Accepted: 4 April 2025 / Published: 5 April 2025
(This article belongs to the Section Resources and Sustainable Utilization)

Abstract

:
In recent decades, with the acceleration of industrialization and urbanization, the contradiction between resource development and environmental protection has become more and more prominent. Scientific simulation of the spatial and temporal correlation between habitat quality (HQ) and habitat fragmentation at a suitable scale is of great significance for maintaining the stability of regional ecosystems and achieving high-quality development. This study took the West Qinling Mountains as an example, where, firstly, the appropriate grid scale was determined based on the spatial stability of HQ, and the evolution characteristics of HQ were analyzed from 2000 to 2020 based on the InVEST model and GeoDa software. Secondly, the habitat fragmentation process was simulated from three characteristic dimensions of habitat area, habitat shape, and habitat distribution. Finally, the GWR model was used to explore the correlation mechanism between habitat fragmentation and HQ. The results showed the following: (1) The 3 km grid scale was a suitable scale for HQ evaluation and analysis in the West Qinling Mountains, and the scale effect was consistent across years. (2) The degree of HQ was at a higher level, where, from 2000 to 2020, it showed a decreasing trend, with a clear phenomenon of bipolar sharpening. The spatial distribution showed a pattern of “high in the west and low in the east, low in the north and high in the south”, and exhibited obvious spatial double clustering characteristics. (3) The degree of habitat fragmentation was at a medium level, where, from 2000 to 2020, it showed a increasing trend, with a clear bipolar contraction state. The spatial distribution showed a pattern of “high in the east and low in the west, high in the north and low in the south”, and the overall spatial distribution was retained with the change in time scale. (4) The effects of habitat fragmentation on HQ showed significant spatial and temporal non-stationary with a non-linear negative correlation. From 2000 to 2020, the degree of negative effect gradually increased, and the staggered distribution of forest, unused land, and water might offset the negative impact of unused land on HQ. The results could provide scientific evidence for the optimization of ecological patterns and ecological prevention and control in the West Qinling Mountains.

1. Introduction

Habitat quality (HQ) refers to the ability of a habitat to provide suitable conditions for the survival of individuals or populations [1,2], which can reflect the level of biodiversity and the suitability of human activities in a region [3,4]. In recent years, with the continuous advancement of industrialization and urbanization, the blind expansion of construction land, the increasing interference of human activities on natural habitats, and the problem of habitat fragmentation are becoming more and more prominent [5]. Habitat fragmentation changes the regional distribution pattern of habitat types, directly affects the ecological processes such as material circulation, energy flow and information transfer between patches, and then significantly reduces regional HQ [6,7,8]. Therefore, it is of great significance to analyze the spatial and temporal heterogeneity of HQ and habitat fragmentation, and to explore the internal driving mechanism of habitat fragmentation on HQ for the construction of regional ecological civilization and sustainable development.
Currently, scholars have been studying the evaluation of HQ in considerable depth. The studies mainly include revealing the spatial and temporal characteristics of HQ based on land use data [9,10], exploring the driving mechanisms of HQ [11,12], and conducting multi-scenario simulations [13,14]. The study objects were mainly selected from ecologically important nature reserves or watersheds [15,16], economically developing provinces and municipalities [17,18], land fragile areas occasionally involved in habitat degradation [19,20], and so on. In terms of research methodology, with the maturity of remote sensing technology, various mathematical models have been used to assess ecosystem service functions, such as the InVEST model [1,8], the SolVES model [21], and the HIS model [22]. Among them, the InVEST model has been widely used by various scholars to assess regional HQ due to its mature theoretical system, spatial visualization of assessment results, and low data requirements [10,14]. Habitat fragmentation refers to the phenomenon that contiguous habitats become dispersed and isolated geographic fragments under strong natural or anthropogenic disturbances [23]. In recent years, it has become popular for landscape pattern indices to be used to quantify the degree of regional habitat fragmentation. However, there is no uniform standard for selecting landscape pattern indices to quantify habitat fragmentation, and existing studies mainly measure habitat fragmentation characteristics and trends based on the number of patches, patch size, and patch shape, as well as diversity and aggregation [5,23]. Currently, various scholars have begun to explore the relationship between habitat fragmentation and habitat quality. And related studies have shown that habitat fragmentation is one the main factors causing HQ degradation [24]. Since the landscape pattern index reflects different ecological conditions at different grid scales, determining the appropriate research scale is a prerequisite for accurately revealing the spatial and temporal correlation between habitat quality and habitat fragmentation. However, it is known from literature combing that researchers’ consideration of grid size was mostly set based on the actual situation of the study area and researchers’ experience [6,23]. When the grid size was set inaccurately, the spatial and temporal heterogeneity of HQ and habitat fragmentation will not be accurately reflected, and the realism of the obtained results will be open to examination. In addition, when revealing the relationship between HQ and habitat fragmentation, related studies mostly adopted linear analysis methods [25,26] and ignored the spatial non-smoothness of variable distributions, and the results obtained cannot characterize the specific location of spatial significance. Therefore, the selection of landscape pattern index to quantitatively analyze the degree of habitat fragmentation and to explore the spatial and temporal correlation between HQ and habitat fragmentation has yet to be deepened.
The West Qinling Mountains are the western extension of the Qinling Mountains, the geographic demarcation line between north and south in China, and is the most important ecological security barrier and “central water tower” in Central China [27]. The West Qinling Mountains are narrow in the north and wide in the south, with a complex ecosystem structure and rich and diverse vegetation types. However, the ecosystem is fragile and vulnerable to damage due to the intersection of the Qinghai–Tibet Plateau, the Loess Plateau, the Sichuan Basin, and the Qinba Mountains. As we could see from the progress of research on the West Qinling Mountains, various scholars had mostly explored the formation mechanism of the rock bodies in the West Qinling orogenic belt and the mineral resources in the orogenic belt based on the geological point of view, and seldom explored the stability of the ecosystems of the West Qinling Mountains and the issue of high-quality development from the perspective of development and protection. However, in recent years, with the advancement of the urbanization process, which has led to the rough management of agricultural and animal husbandry land, the blind expansion of construction land, and the overutilization of natural resources, the contradiction between human and land in the region has become prominent, the development of resources has become unbalanced, and sustainable development has been thwarted. Based on these problems, this study took the West Qinling Mountains as the research object, assessed the HQ with the help of the Habitat Quality module of the InVEST model, then determined the suitable grid based on the spatial stability of HQ. Using the suitable grid as the research scale, the study explored the spatial and temporal evolution of HQ from 2000 to 2020 with the help of the Spatial Autocorrelation Analysis methods, and constructed the comprehensive habitat fragmentation index (CHFI) evaluation formula by selecting landscape indices from the three dimensions of habitat area, habitat shape, and habitat distribution, to analyze the degree of fragmentation of the habitats in a quantitative manner. Finally, the study adopted the geography weighted regression (GWR) to reveal the spatial and temporal correlation between HQ and CHFI from the perspective of spatial and temporal variability. The results obtained are intended to provide a scientific basis for the ecological defence and control of the West Qinling Mountains.

2. Materials and Methods
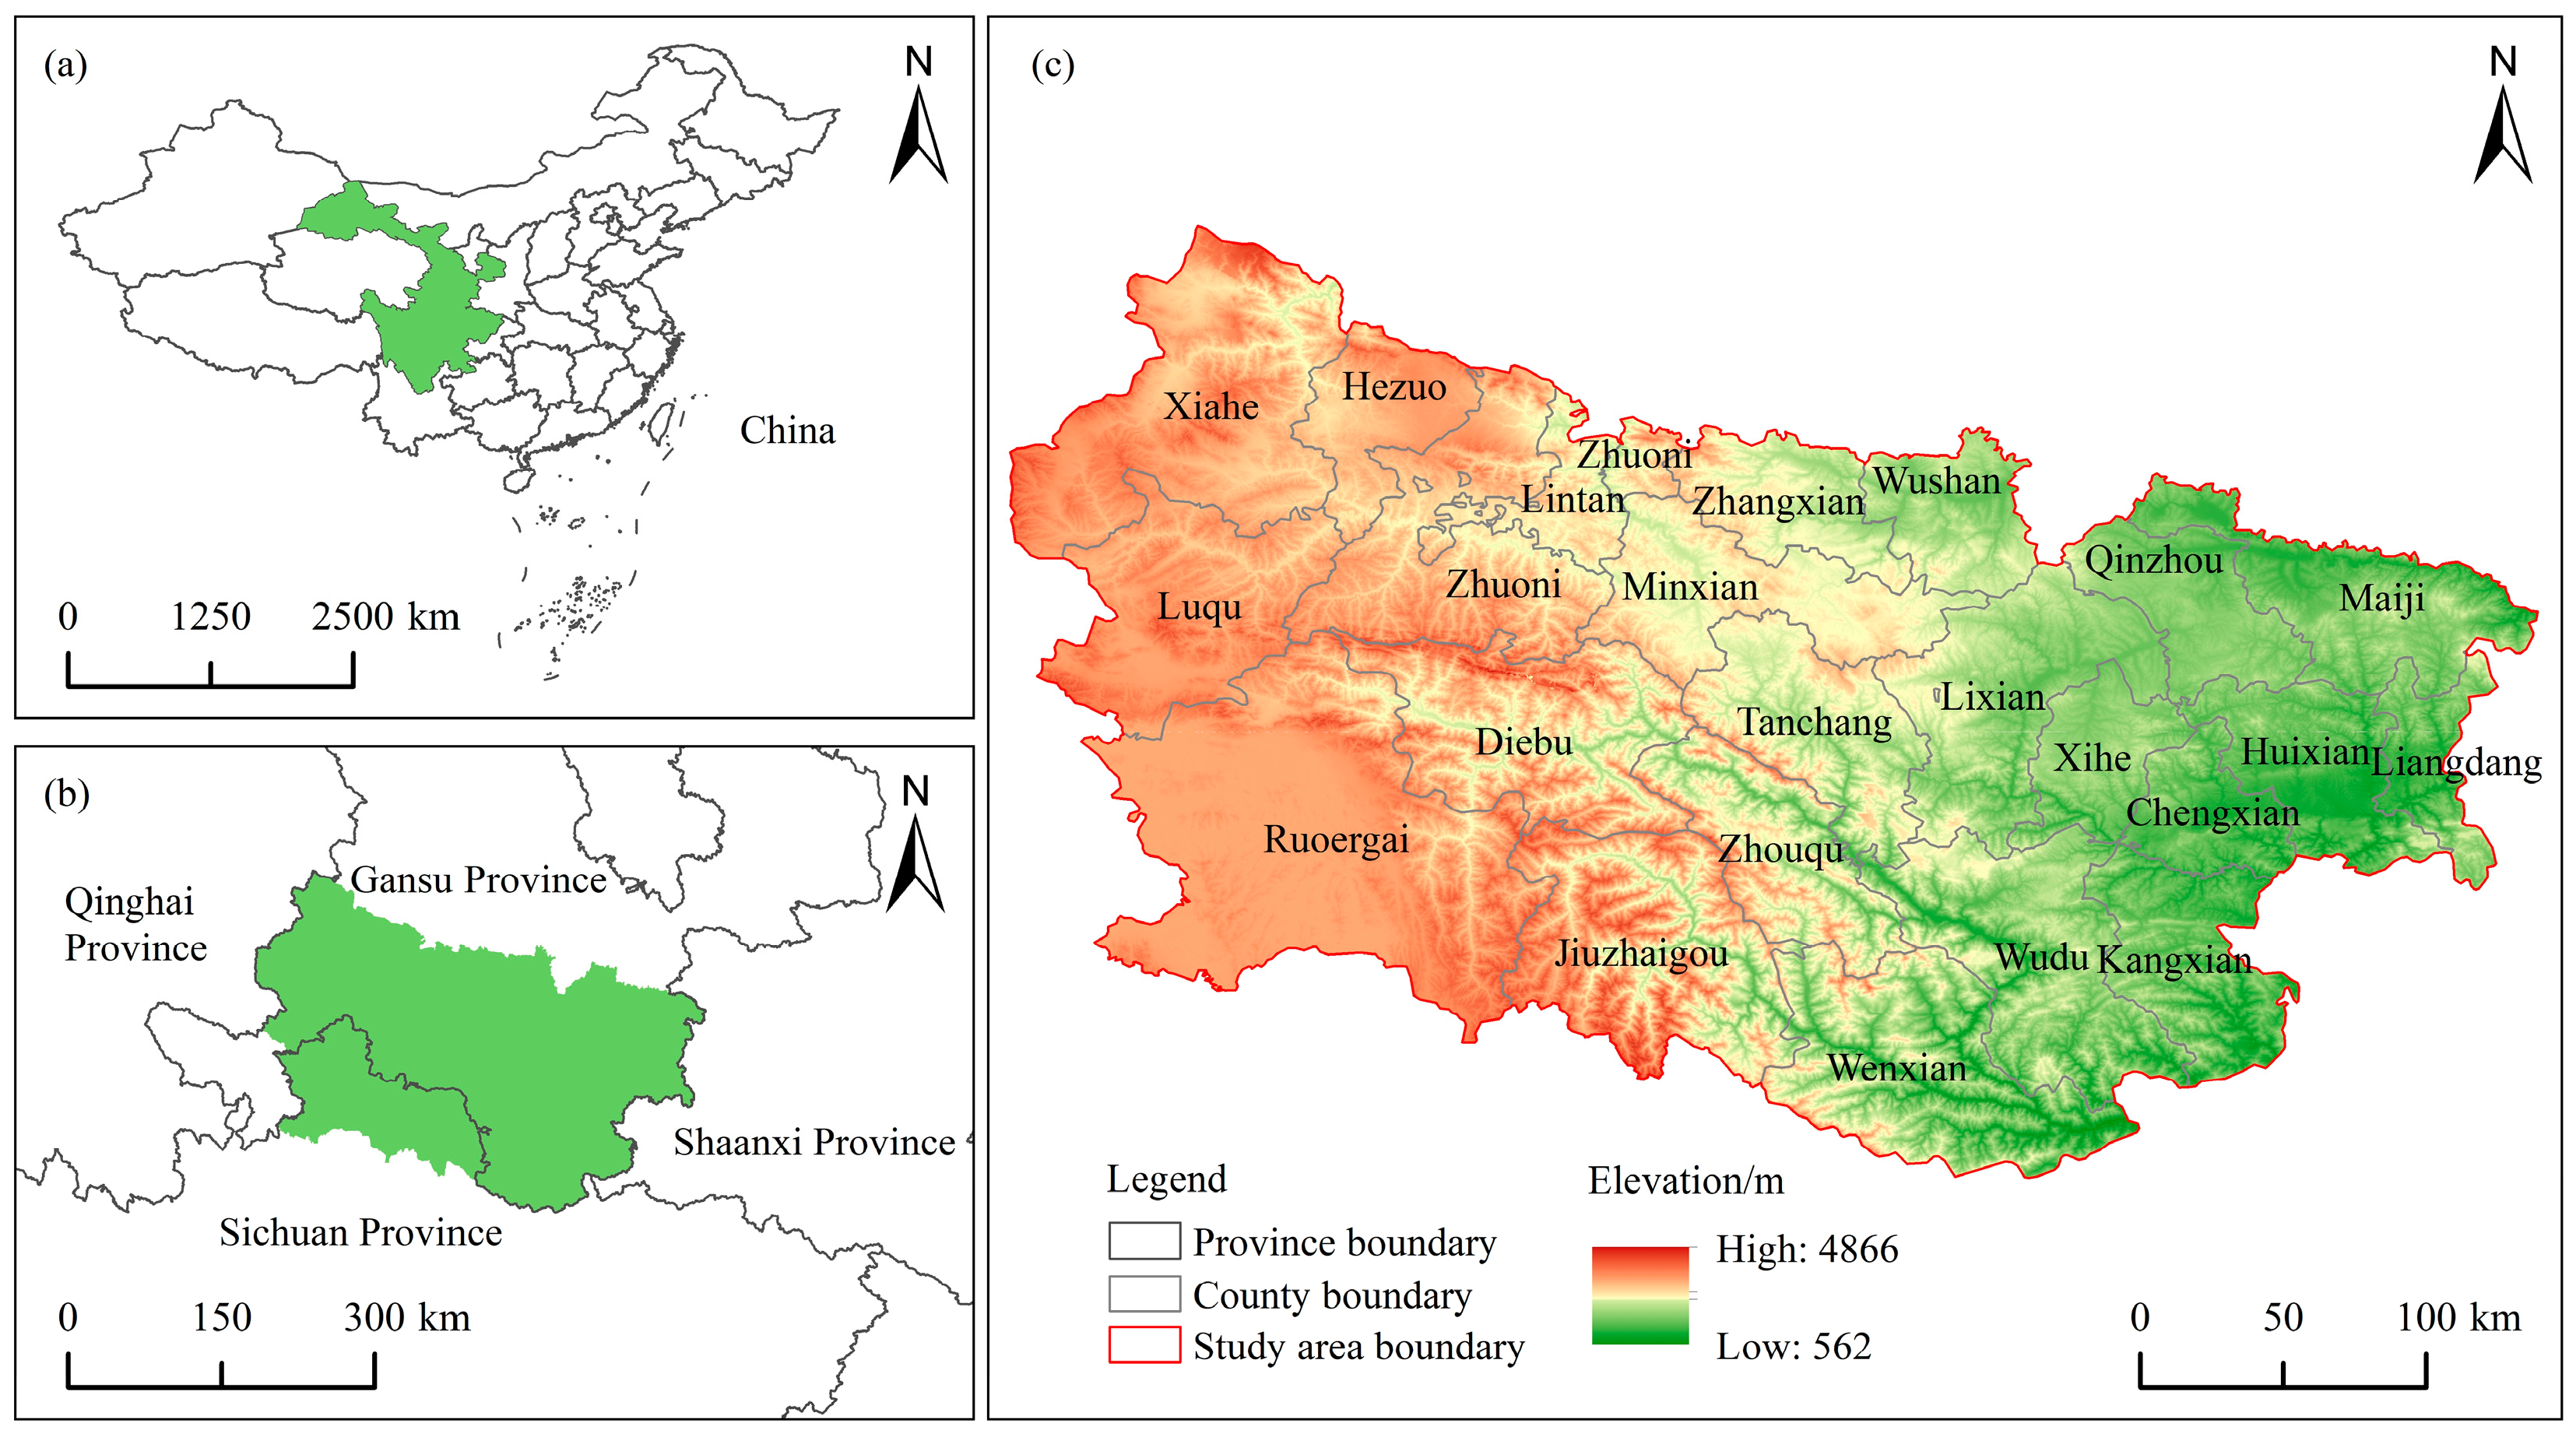
2.1. Study Area

The West Qinling Mountains are the western extension of the Qinling Mountains of China, between the Loess Plateau and the Sichuan Basin, and are part of both the north–south transition zone and the interlocking transition zone between the Qinghai–Tibet Plateau and the Qinba Mountains. They are located in the junction area of southern Gansu Province and northern Sichuan Province, including 5 prefecture-level cities (autonomous prefectures) and 23 counties (districts), with a total area of about 84,109 km2 (Figure 1). The topography of the West Qinling Mountains is complex, consisting of plateaus, mountains, and basins from west to east, with large terrain ups and downs, and the elevation is in the range of 562~4866 m. The West Qinling Mountains divide the Yellow River and the Yangtze River, and water structure is distinctive, with four major water systems, the Wei River, the Bailong River, the Tao River, and the Xihan River. In recent years, as urbanization continues, strong human interference with natural processes has led to the fragmentation of regional habitats and a decline in HQ, significantly affecting regional ecosystem stability and biodiversity, and the contradiction between development and protection has become a prominent feature of the West Qinling Mountains.

2.2. Data Sources

This study explores the spatial and temporal evolution of HQ of the West Qinling Mountains over the past 20 years based on five periods of land use data (Figure 2) in 2000, 2005, 2010, 2015, and 2020. The land use remote sensing image data were obtained from the Resource and Environment Science Data Platform of the Chinese Academy of Sciences (http://www.resdc.cn, accessed on 8 April 2024), and the land use types were divided into 6 Class I and 25 Class II, with Class I classes being cultivated land, forest, grassland, water, construction land, and unused land, respectively. The digital elevation model (DEM) data were obtained from the Geospatial Data Cloud Platform (http://www.gscloud.cn, accessed on 9 April 2024). The administrative boundary vector data were obtained from the National Geographic Information Public Service Platform (https://www.tianditu.gov.cn, accessed on 9 April 2024). The spatial reference unified coordinates of this study were WGS_1984_UTM_Zone_48N.

2.3. Methods

2.3.1. InVEST Model

This study used the Habitat Quality module of InVEST 3.12.0 software to assess the HQ of the West Qinling Mountains from 2000 to 2020. This model provides a quantitative spatial assessment of HQ based on land use data, distance, and spatial weight of the impacts of threat factors, habitat suitability of each land use type, and sensitivity of each habitat type to threat factors [1,2]. HQ was calculated using the following formulae:
D xj = r = 1 R y = 1 Y r ( W r / r = 1 R W r ) r y i rxy β x S jr
i rxy = 1 ( d xy d rmax ) ( linear )
i rxy = exp ( 2.99 d xy d rmax ) ( exponential )
Q xj = H j [ 1 ( D xj z D xj z + k z ) ]
where Dxj is the degree of habitat degradation of raster x in habitat type j; R is the number of threat factors; Yr is the number of rasters of the threat source; Wr is the weight of the threat source r (0–1); ry is the stress value of raster y; irxy is the threat level of ry of raster y to raster x; βx is the accessibility of the threat source to raster x (0 for legally protected areas and 1 for the rest of the area); Sjr is the sensitivity of the habitat type j to the threat source r; dxy is the straight-line distance of raster x from raster y; drmax is the maximum threat distance of threat source r; Qxj is the HQ index for raster x in habitat type j (0–1); Hj is the habitat suitability of habitat type j; k is the half-saturation constant, usually taken as half the degree of habitat degradation; and z is the normalization constant (z = 2.5).
In terms of the effects on HQ, the effects of human activities on HQ were reflected in the type of land use. Therefore, taking into account the actual situation of the West Qinling Mountains, cultivated land, urban land, rural residential land, other construction land, and unused land with significant human interference were defined as threat sources. According to the InVEST model manual and reading of similar literature [7,20,26,28], the coercive distances and weights of the threat sources, the habitat suitability of the land use types, and the sensitivities of the various habitat types to the threat factors were then determined, as detailed in Table 1 and Table 2.

2.3.2. Spatial Autocorrelation Analysis Methods

In order to further explore the correlation characteristics of HQ in the spatial distribution of the West Qinling Mountains, this study the Global Autocorrelation and the Local Autocorrelation to reflect the spatial differentiation characteristics of HQ and its domain relationship [19], then provided a basis for decision-making on the improvement of the HQ of the West Qinling Mountains. Global Autocorrelation was used to describe the overall agglomeration of HQ, and this study used the global Moran’s I index to measure it, with a value range of [−1, 1], where, the larger the value, the higher the degree of agglomeration of neighbouring units, and vice versa; >0 is positive correlation, <0 is negative correlation, and equal to 0 is random distribution. Local Autocorrelation measures the divergent characteristics of the spatial distribution of the HQ of the observation unit and that of the neighbouring units from a microscopic point of view, and in this study, the local indicators of spatial associations (LISA) index was used to reveal the clustering and dispersion characteristics of the spatial distribution of HQ of the neighbouring units, and its spatial visualization results were classified into five types: NS (non-significant area of clustering situation), H-H (high and high clustering area), H-L (high and low clustering area), L-H (low and high clustering area), and L-L (low and low clustering area). The calculation formulae are detailed in reference [29].

2.3.3. Habitat Fragmentation Index Selection

In order to quantify the degree of habitat fragmentation and its spatial distribution characteristics in the West Qinling Mountains over a period of 20 years, the landscape pattern index was used as a quantitative index in this study [1,7]. Relevant studies have shown that habitat fragmentation is mainly closely related to the number of patches, the shape of patches, the degree of patch isolation, and the spatial distribution status of patches [30,31,32]. Therefore, in this study, landscape indices were selected to express the habitat fragmentation process at the landscape level from the three levels of habitat area, habitat shape, and habitat distribution. In order to accurately reflect the degree of habitat fragmentation in the study area, firstly, the land use data of the study area were gridded with the help of the ArcGIS fishing net tool, then the landscape indices were calculated for each grid using Fragstats4.2 software. Secondly, considering the correlation between the indices, landscape pattern indices with correlations greater than 0.9 were excluded using two-tailed Pearson correlation analysis (Table 3). Finally, in order to ensure the independence of each index, multicollinearity was eliminated with the help of Variance Inflation Factor (VIF), where indices with VIF < 10 met the research requirements. The indices that met the research requirements are shown in Table 4.

2.3.4. Construction of Integrated Habitat Fragmentation Index Assessment Model

Since the selected landscape indices have different meanings and measurements, it is not possible to directly compare the magnitude of the values and the construction of the formulae. It is necessary to linearly normalize the raw results of each index [20], and the calculation formulae are as follows:
X i = X X min X max X min ,   X j = X min X X max X min
where Xi is a positive indicator, Xj is a negative indicator, X is the original value of the index, Xmax is the maximum value of the data, and Xmin is the minimum value of the data.
Referring to existing studies [23], an equal weight method was used to construct a comprehensive habitat fragmentation index (CHFI) assessment model with the following formula:
CHFI = 0.1667 PD + 0.1667 MPS + 0.1667 LSI + 0.1667 CIRCLE_MN + 0.1667 SHDI + 0.1667 DIVISION
According to the divided grid, the CHFI value of each grid was calculated. The calculation results were assigned to the fishing grids using ArcGIS software, and finally the spatial distribution of CHFI in the West Qinling Mountains was obtained.

2.3.5. GWR Model

In order to reveal the spatial and temporal correlation between HQ and CHFI in the West Qinling Mountains, this study clarified and interpreted the direction as well as the strength of the variables in the spatial and temporal dimensions with the help of the GWR model. Compared with the regression model in the traditional sense, the GWR model considered the geographic location of the variables and the spatial weights of the neighbouring points, estimated the local parameters of each sample point using the weighted least squares (WLS) method, better reflected the spatial heterogeneity of the sample points, broke through the limitations of the traditional linear regression, and accurately interpreted the spatial and temporal non-stationary relationship of the independent variables and the dependent variable [33]. The calculation formulae are detailed in reference [6].

3. Results

3.1. Determination of Appropriate Scale

Appropriate study scale is a prerequisite for scientific results. In this study, we used the fishing net creating tool of ArcGIS 10.6 software, and considered the area of the study area, the conditions of the habitat patches, and the feasibility of the calculation. We then used the equal spacing method to divide the study area into nine grids of 1 km, 2 km, 3 km, 4 km, 5 km, 6 km, 7 km, 8 km, and 9 km, and calculated the mean HQ of different years and the area of each grade at different grid scales (Figure 3). Compared the changes in mean HQ in different years (Figure 3a), from 2000 to 2020, mean HQ showed an increasing then stabilizing trend, and mean HQ was greatest at the 3 km grid scale and tended to stabilize. Compared to the area changes in each grade in different grid scale (Figure 3b), the higher grade showed a trend of first increasing then decreasing, the medium grade showed a trend of first decreasing then increasing, and the lower grade, the lower grade, and the high grade all showed a trend of first decreasing then stabilizing. Moreover, the 3 km grid scale was a turning point in area change. There were differences in the spatial distribution of HQ at different grid scales (Figure 4). As the grid scale increases, the low value areas in the north and southwest showed a decreasing trend, while the high-value areas in the east showed an increasing trend, and the changes in each region were stable at the 3 km grid scale. Therefore, the 3 km grid scale was determined to be the appropriate scale for HQ evaluation and analysis, and the study area was divided into 9725 grid units.

3.2. Characterization of Spatial and Temporal Patterns of HQ

3.2.1. Spatial and Temporal Variation in HQ

From 2000 to 2020, HQ was assessed using the Habitat Quality module of the InVEST model, with an HQ range of 0–1, where, the closer to 1, the better the HQ condition. In order to more intuitively reflect the spatial variation in HQ, the results of the HQ assessment were divided into five grades: low [0.0–0.2], lower [0.2–0.4], medium [0.4–0.6], higher [0.6–0.8], and high [0.8–1.0]. As shown in Figure 5, from 2000 to 2020, the HQ were dominated by medium grade and high grade, and the sum of the number of grids of these two grades amounted to 69.26%, 69.06%, 68.11%, 67.89%, and 67.84%, respectively, which indicated that the HQ was better in general, but showed a decreasing trend. An analysis of all grades showed that the grade with the greatest change in the number of grids over the 20-year period was the medium grade, with a decrease of 219 grids, accounting for 50.00% of the total number of grids changed. The remaining four grades had an increase in the number of grids, with the smallest change in the number of grids in the high grade, which accounted for only 8.90% of the total number of grids changed. Overall, HQ of the West Qinling Mountains showed a bipolar sharpening phenomenon.
Concerning the time scale, the mean HQ of the West Qinling Mountains was 0.6480, 0.6502, 0.6483, 0.6475, and 0.6476 in 2000, 2005, 2010, 2015, and 2020, respectively. Although there were up and down fluctuations in the HQ of the West Qinling during the period of 2000–2020, the overall trend showed a slightly decreasing trend, which decreased by 0.0617%. This was mainly related to the increase in the urbanization rate and the implementation of ecological protection measures in each watershed in the West Qinling Mountains over the past 20 years. At the spatial scale, the spatial distribution of HQ levels was significantly different from 2000 to 2020 (Figure 6). The Qinghai–Tibet Plateau region of the west and the Sichuan Basin region of the south were areas of good HQ, while the Loess Plateau region of the north and the Qinling Mountains region of the east are areas of poor HQ, and the area at the junction of the four major landforms located in the centre was of moderate HQ. Combined with the spatial distribution of land use in Figure 2, the spatial distribution of the various grades of HQ was broadly consistent with the distribution of land use types, HQ was low in areas of construction land, cultivated land of the north–centre and unused land of the south–west, and high in areas where forest was located in the south–centre and north–east. In conclusion, the spatial distribution of HQ in the West Qinling Mountains was significantly influenced by geomorphic types.

3.2.2. Spatial Aggregation of HQ

The Spatial Autocorrelation method was used to explore the spatial aggregation or discretization patterns of HQ in the West Qinling Mountains. The global Moran’s I values of HQ in 2000, 2005, 2010, 2015, and 2020 were 0.7574, 0.7555, 0.7601, 0.7600, and 0.7574 (p < 0.01), respectively, with z-values higher than 2.58, which indicated that there was a significant positive spatial correlation and strong spatial clusters. The local Spatial Autocorrelation of the West Qinling Mountains showed obvious spatial double aggregation characteristics at 99% confidence level (Figure 7). From 2000 to 2020, the Local Autocorrelation was dominated by H-H aggregation and L-L aggregation, with the sum of the two grids accounting for about 52% of the total number of grids. H-H aggregation areas were mainly distributed in the west, south, and northeast of the study area, which indicated that HQ of the region was good. The H-H aggregation area increased by 0.50% from 2000 to 2020, mainly due to the active implementation of ecological protection measures in the region, enhanced habitat suitability, and an increase in high-value areas of HQ. The northern and southwestern parts of the study area, where L-L aggregation was prevalent, had poor HQ. The L-L aggregation area decreased by 3.64% from 2000 to 2020, mainly due to strict control over the expansion of threat sources in the region, reduced habitat sensitivity, and a decrease in low value areas of HQ. In addition, the H-L discretization area and L-H discretization area showed sporadic distribution, where, from 2000 to 2020, the number of grids increased by 37.63% and 5.45%. This is mainly due to the accelerated pace of urbanization expansion, which led to prominent contradictions between habitat protection and development. In the future, stricter ecological governance plans need to be adopted to strengthen ecological protection and restoration supervision.

3.3. Spatial and Temporal Characterization of CHFI

The spatial and temporal distribution of CHFI in West Qinling Mountains was obtained with the help of Fragstats4.2 software and ArcGIS10.6 software. In order to reflect the spatial variation in CHFI more intuitively, the CHFI results were classified into five grades: low [0.0–0.2], lower [0.2–0.4], medium [0.4–0.6], higher [0.6–0.8], and high [0.8–1.0]. The CHFI values of the West Qinling Mountains range from 0.07 to 0.72, and were mainly dominated by medium-fragmentation, with about 65% of the grids, and there were no areas of high-fragmentation (Figure 8a). During the study period, CHFI showed a trend of first increasing then decreasing (Figure 8b). From 2000 to 2010, the grid units of the low-fragmentation and lower-fragmentation decreased by 102 and 23, respectively, and the grid units of the medium-fragmentation increased by 393. From 2010 to 2020, the grid units of the lower-fragmentation increased by 7, whereas the grid units in the medium-fragmentation decreased by 29. From 2000 to 2020, the medium-fragmentation changed significantly, with an increase of 364 grid units during the 20-year period, accounting for 50% of the total number of changed grid units, and the grid units of the low-fragmentation, the lower-fragmentation, and the higher-fragmentation all decreased, with the highest change in the high-fragmentation, which accounted for 32.97% of the total number of changed grid units. This indicated that CHFI showed a bipolar contraction phenomenon.
The mean CHFI values of the West Qinling Mountains were 0.4956, 0.4915, 0.4971, 0.4989, and 0.4963 in 2000, 2005, 2010, 2015, and 2020, respectively. The index fluctuated between 2000 and 2020, but eventually increased slightly, which reflected the increase in habitat fragmentation and dispersal of habitat types in the West Qinling Mountains. At the spatial scale, each grade of CHFI showed different spatial distributions from 2000 to 2020 (Figure 9). The higher-fragmentation were mainly distributed in the Qinling Mountains area of the east and the Loess Plateau area of the north, while low-fragmentation and lower-fragmentation were mainly distributed in the Qinghai–Tibet Plateau area of the west and the Sichuan Basin area of the south; medium-fragmentation were scattered in the study area. Meanwhile, combined with the spatial distribution map of land use types in Figure 2, it could be seen that the CHFI values of the construction land and the surrounding areas were higher, while the CHFI values of the water and forest were lower. Overall, the CHFI was at a medium-fragmentation level, the overall spatial distribution of CHFI was preserved with the change in time scale, and the low-fragmentation area of the southwest was gradually converted into lower-fragmentation area and medium-fragmentation area.

3.4. Spatial and Temporal Correlation Between HQ and CHFI

In order to reveal the spatial and temporal response relationship between HQ and habitat fragmentation, this study used the GWR model for spatial correlation analysis with HQ as the dependent variable and CHFI as the independent variable. The regression results of this study met the research criteria (Table 5), and in order to clearly express the spatial distribution of the coefficients of the explanatory variables, zero was set as the threshold for distinguishing between positive and negative effects, and the relationship coefficients were classified into four levels with an equal spacing of 0.5: low negative correlation zone [−0.5, 0.0], high negative correlation zone (<−0.5), low positive correlation zone (0.0, 0.5], and high positive correlation zone (>0.5).
The effect of CHFI on HQ showed obvious spatial and temporal non-stationary (Figure 10), which was manifested by the fact that the direction and intensity of the effect of the CHFI on HQ varied with grid units, and that the direction and intensity of the effect varied with time for the same grid unit. Specifically, the proportion of negatively correlated areas was as high as 72.40%, and its high-value areas were as high as 63.82%, which were mainly distributed in the Loess Plateau region in the north and the Qinling Mountains region in the east, and mainly distributed in and around cultivated land, forest land, and construction land. The proportion of positively correlated areas was only 27.60%, and its low value areas were as high as 74.27%, which were mainly distributed in the northwest Tibetan Plateau region and the southwest Sichuan Basin region, and mainly distributed in grassland, unused land, and water.
With the change in time scale, the relationship and coefficients between HQ and CHFI were transformed. On the one hand, the area of low negative correlation gradually turned into an area of high negative correlation, and the change area was mainly concentrated in the east–central region of the West Qinling Mountains; the area of low positive correlation gradually turned into an area of low negative correlation, and the change area was mainly distributed in the Loess Plateau region in the northern part of the West Qinling Mountains. The negatively correlated expansion area was located in the western part of the Western Qinling Mountains, where the geomorphological type was dominated by low and medium mountains and basins, with high topographic relief. Coupled with the uncontrolled extension of the urban construction zones, the degree of land fragmentation had deepened, while CHFI was relatively high and HQ was poor. On the other hand, the area of low positive correlation gradually turned into an area of high positive correlation, and the area of low negative correlation gradually turned into the area of low positive correlation. The change area was mainly located in the southwestern Tibetan Plateau region, where forest, unused land, and water were interspersed distribution, which might offset the negative impacts of unused land on HQ.

4. Discussion

4.1. Scaling Effects and Changing Trends of HQ

Sorting out previous studies, it can be seen that only a few scholars have explored the correlation between HQ and landscape indices mainly at specific grid scales. However, when the grid cell size cannot be accurately determined, the evaluation results may not truly reflect the spatial heterogeneity of HQ and the mechanism of habitat fragmentation on HQ [34]. Therefore, determining the optimal grid scale for the study area was a prerequisite for drawing scientific conclusions.
In this study, from the perspective of grid units research, on the one hand, it was confirmed that the scale effect of HQ was consistent among years (Figure 3), and that HQ of the West Qinling Mountains from 2000 to 2020 all showed a trend of increasing and then stabilizing with the increase in grid scale. On the other hand, it was also confirmed that different evaluation scales had differential spatial expression of HQ (Figure 4). It was shown that the larger the grid scale, the more complex the information covered in the grid units, which may lead to distortion of the study results [35,36]. As the grid scale increases, the low-grade areas in the north and southwest showed a decreasing trend, while the higher-grade areas in the east showed an increasing trend. Moreover, the statistics of the area of each grade showed that the 3 km grid scale was a turning point of the area change. Therefore, the 3 km grid scale was determined to be a suitable scale for HQ assessment and analysis.
From 2000 to 2020, the overall HQ of the West Qinling Mountains showed a decreasing trend, which was similar to the research results of Wang et al. [10] and Liang et al. [20]. Previous studies showed a strong correlation between HQ and land use change in the West Qinling Mountains. Forest, grassland, and water had less human interference, low land use intensity, strong habitat suitability, and good HQ. However, cultivated land, construction land, and unused land had more human interference, resulting in a high degree of land use, poor habitat suitability, and poor HQ. Over the past 20 years, the accelerated urbanization and industrialization in the West Qinling Mountains had led to a continuous increase in the demand for construction land, and the degree of threat to natural habitats has gradually deepened, resulting in a decreasing trend in HQ. With the change in time scale, HQ of the West Qinling Mountains showed a trend of first increasing then decreasing, and a turning point appeared in 2005. The main reason for this was closely related to the implementation of the environmental protection policy of the Green for Grain Project and the economic development strategy in the Western Region in China. The Green for Grain Project was fully implemented in the West Qinling Mountains in 2002, effectively increasing the area of suitable habitats and leading to a trend of improving HQ. Subsequently, due to the slowing down of the Green for Grain Project and the needs of Western Development, the disturbance of the ecological environment by human activities intensified, posing a serious threat to the regional HQ, which in turn led to a declining trend in HQ.

4.2. Relationship Between HQ and Response to Habitat Fragmentation

Habitat fragmentation was a direct manifestation of the disturbance of the natural environment caused by human activities, which directly affects the material cycle and energy flow of the regional environment, leading to the loss of biodiversity and the decline of HQ [37]. In this study, different landscape pattern indices, such as habitat area, patch shape, and spatial characteristics, were considered and superimposed in an equal weight manner to form a comprehensive habitat fragmentation index (CHFI) to quantify the degree of habitat fragmentation and its spatial distribution. Finally, the spatial correlation between HQ and CHFI was explored with the help of the GWR model.
From 2000 to 2020, HQ and CHFI showed obvious spatio-temporal non-stationary relationship in the West Qinling Mountains, which was consistent with the findings of Gu et al. [7] and Pu et al. [23]. The negatively correlated areas were mainly distributed in the Loess Plateau region in the northern part and the Qinling Mountain region in the eastern part, where the terrain was low and slow, the land use type was dominated by cultivated land and construction land, and it was the main human agglomeration and economic prosperity area of the West Qinling Mountains. The drastic human activities led to the distribution of a large number of the higher fragmentation areas clustered together, the reduction in habitat connectivity, the obstruction of the migration of the species, and the decline of the biodiversity, which in turn led to the lower HQ [38]. However, the positively correlated areas were mainly distributed in the Tibetan Plateau region and the Sichuan Basin region, where grassland, unused land, and water were interspersed, patch diversity and separation were increased, and habitat fragmentation was high. However, the HQ was better due to the higher altitude limited human interference, and the ecological environment was dominated by natural habitats. That is, the fragmentation of natural habitats was favoured to HQ, a conclusion verified in the study of Zheng et al. study [39]. With the change in time scale, the correlation between HQ and habitat fragmentation changed significantly, and the high areas of negative and positive correlation gradually spread outward, which was mainly closely related to the mode and degree of land use [40,41]. With the advancement of urbanization and industrialization, the construction land in the eastern region spread outwards in a radial state, coercing the neighbouring ecological land, exacerbating the increase in habitat fragmentation and decreasing the HQ, and thus urgently requiring the strengthening of ecological environmental protection and management. Under the positive influence of the ecological protection policy, the increase in grassland and water in the southwestern part weakened the threat to HQ posed by unused land, and the structure of the ecosystem was stable. Overall, the spatial correlation between habitat fragmentation and HQ varied regionally, but the overall negative correlation was dominant, which was mainly related to the regional dominant habitat types and their distribution patterns [42].
Therefore, when carrying out landscape ecological regulation with the aim of improving the HQ of the West Qinling Mountains, it was necessary to develop appropriate habitat improvement measures based on different land use types. For forest, grassland, and water, their HQ was less affected by the degree of habitat fragmentation, and the level of HQ was relatively good. In the future, strict ecological protection measures need to be taken, such as establishing ecological protection zones, to prevent human activities from damaging them, maintain a high level of ecological quality, and maintain the stability of their ecosystem functions. For cultivated land and construction land, their HQ was seriously affected by the degree of fragmentation, and the HQ was poor. In the future, reasonable land consolidation measures need to be taken to enhance the connectivity between single plots and reduce the risk of habitat fragmentation. Specifically, green belts can be appropriately added around the built-up area to improve the connectivity between artificial surface patches, weaken the threat of construction land to habitat quality, and improve regional habitat quality. For unused land, its HQ was inherently poor. In the future, reasonable land development policies can be adopted to encourage the planting of local forest and grass varieties, improve the habitat suitability of unused land, and prevent further deterioration of the habitat.

4.3. Innovations and Shortcomings

Exploring the scale effect of HQ helps to accurately reflect the spatial and temporal correlation between HQ and habitat fragmentation. It was shown that the mean value of HQ changes significantly at different grid scales. In this study, the fishing net creating tool was used to divide the study area into grid sizes of 1 km, 2 km, 3 km, 4 km, 5 km, 6 km, 7 km, 8 km, and 9 km, and it was intended to explore whether there is a variability in the scale effect of HQ in different years. The results showed that the mean HQ would eventually stay at a stable value with a consistent trend, which eliminated the effect of differences in the year on HQ and provided a scientific basis for the selection of evaluation scales for HQ. The degree of habitat fragmentation was quantified based on landscape indices, and most of the existing studies measured the degree of regional habitat fragmentation based on a single landscape index (patch density, aggregation index, interspersion juxtaposition index). In contrast, in this study, we comprehensively selected patch density, mean patch area, landscape shape index, mean related circumscribing circle, Shannon’s diversity index, and landscape division index from the main characteristics of habitat fragmentation, normalized them and superimposed them with equal weights to construct a comprehensive habitat fragmentation index (CHFI), which provided a new idea to quantify the degree of habitat fragmentation of the region in general.
However, this study also has certain limitations. Firstly, the weights of threat sources, habitat suitability, and sensitivity values required for the Habitat Quality module of the InVEST model were determined according to the model manual and the relevant literature, and the evaluation results were somewhat subjective. In future research work, field validation will be added to improve the accuracy of the evaluation results. Secondly, the effect of habitat fragmentation on HQ has a lag effect, but due to the problem of sample size, the GWR model was used in this study to discuss the relationship between HQ and habitat fragmentation, ignoring the temporal characteristics; a more refined model can be used in the future to accurately analyze the temporal and spatial effects between variables. Finally, this study only explored the general pattern of habitat fragmentation at the scale of the suitability grid, which basically matches the scale of HQ assessment. However, the fragmentation of different land use types had variability, and the mechanism of influence on HQ needs to be further explored. Therefore, future research could focus on exploring the fragmentation trends of different habitat components at the appropriate scale, determining the optimal driving threshold interval of the fragmentation index of each habitat under the ideal state of HQ, and addressing the question of what kind of habitat pattern is conducive to the HQ, so as to provide new data references for the high-quality development of the region and the spatial planning of the national territory.

5. Conclusions

Based on the land use data and using the grid as the research unit, this study assessed and analyzed the HQ and its spatial and temporal evolution of the West Qinling Mountains with the help of the Habitat Quality module of the InVEST model and the Spatial Autocorrelation method, constructed an assessment model of the CHFI model to analyze the process of habitat fragmentation, and explored the spatial and temporal correlations between the HQ and CHFI with the help of the GWR model. The main findings are as follows:
(1)
The 3 km grid scale was a suitable scale for the evaluation and analysis of HQ in the West Qinling Mountains. There was consistency in the temporal expression of scale effects by year differences, and variability in the spatial expression of HQ by grid size. And the 3 km grid scale was a turning point in the stabilization of mean HQ and in the change in area of each grade.
(2)
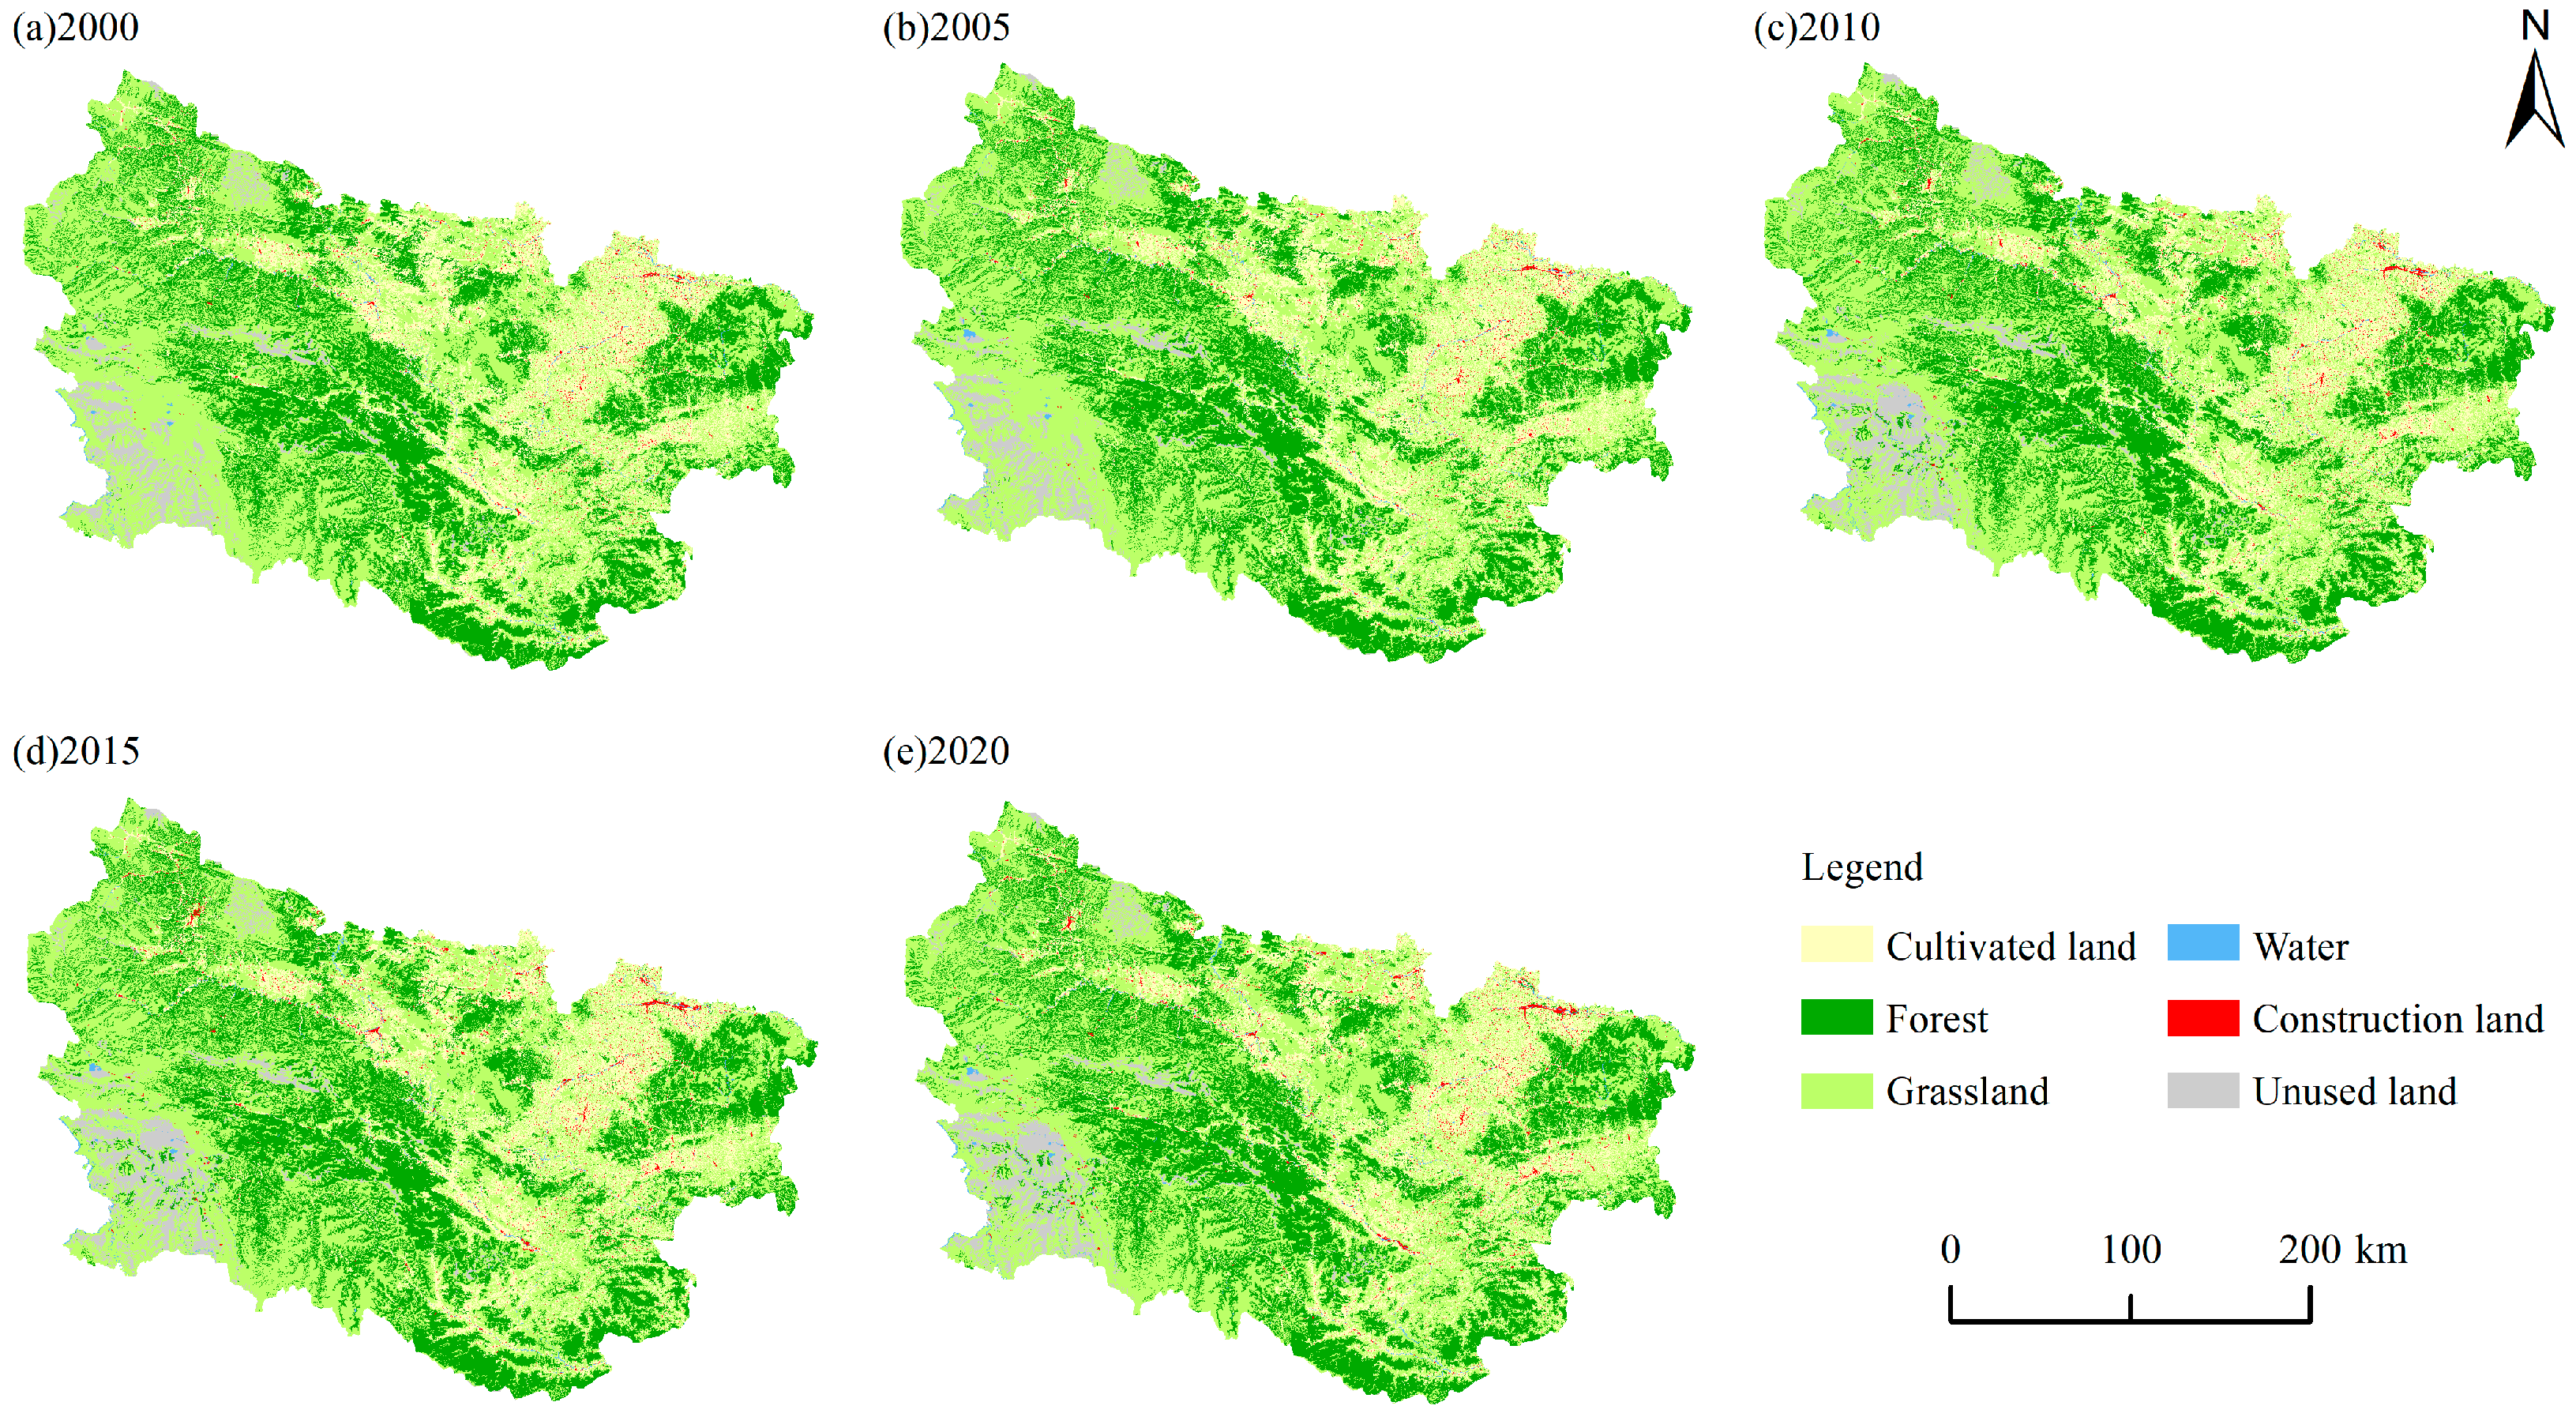
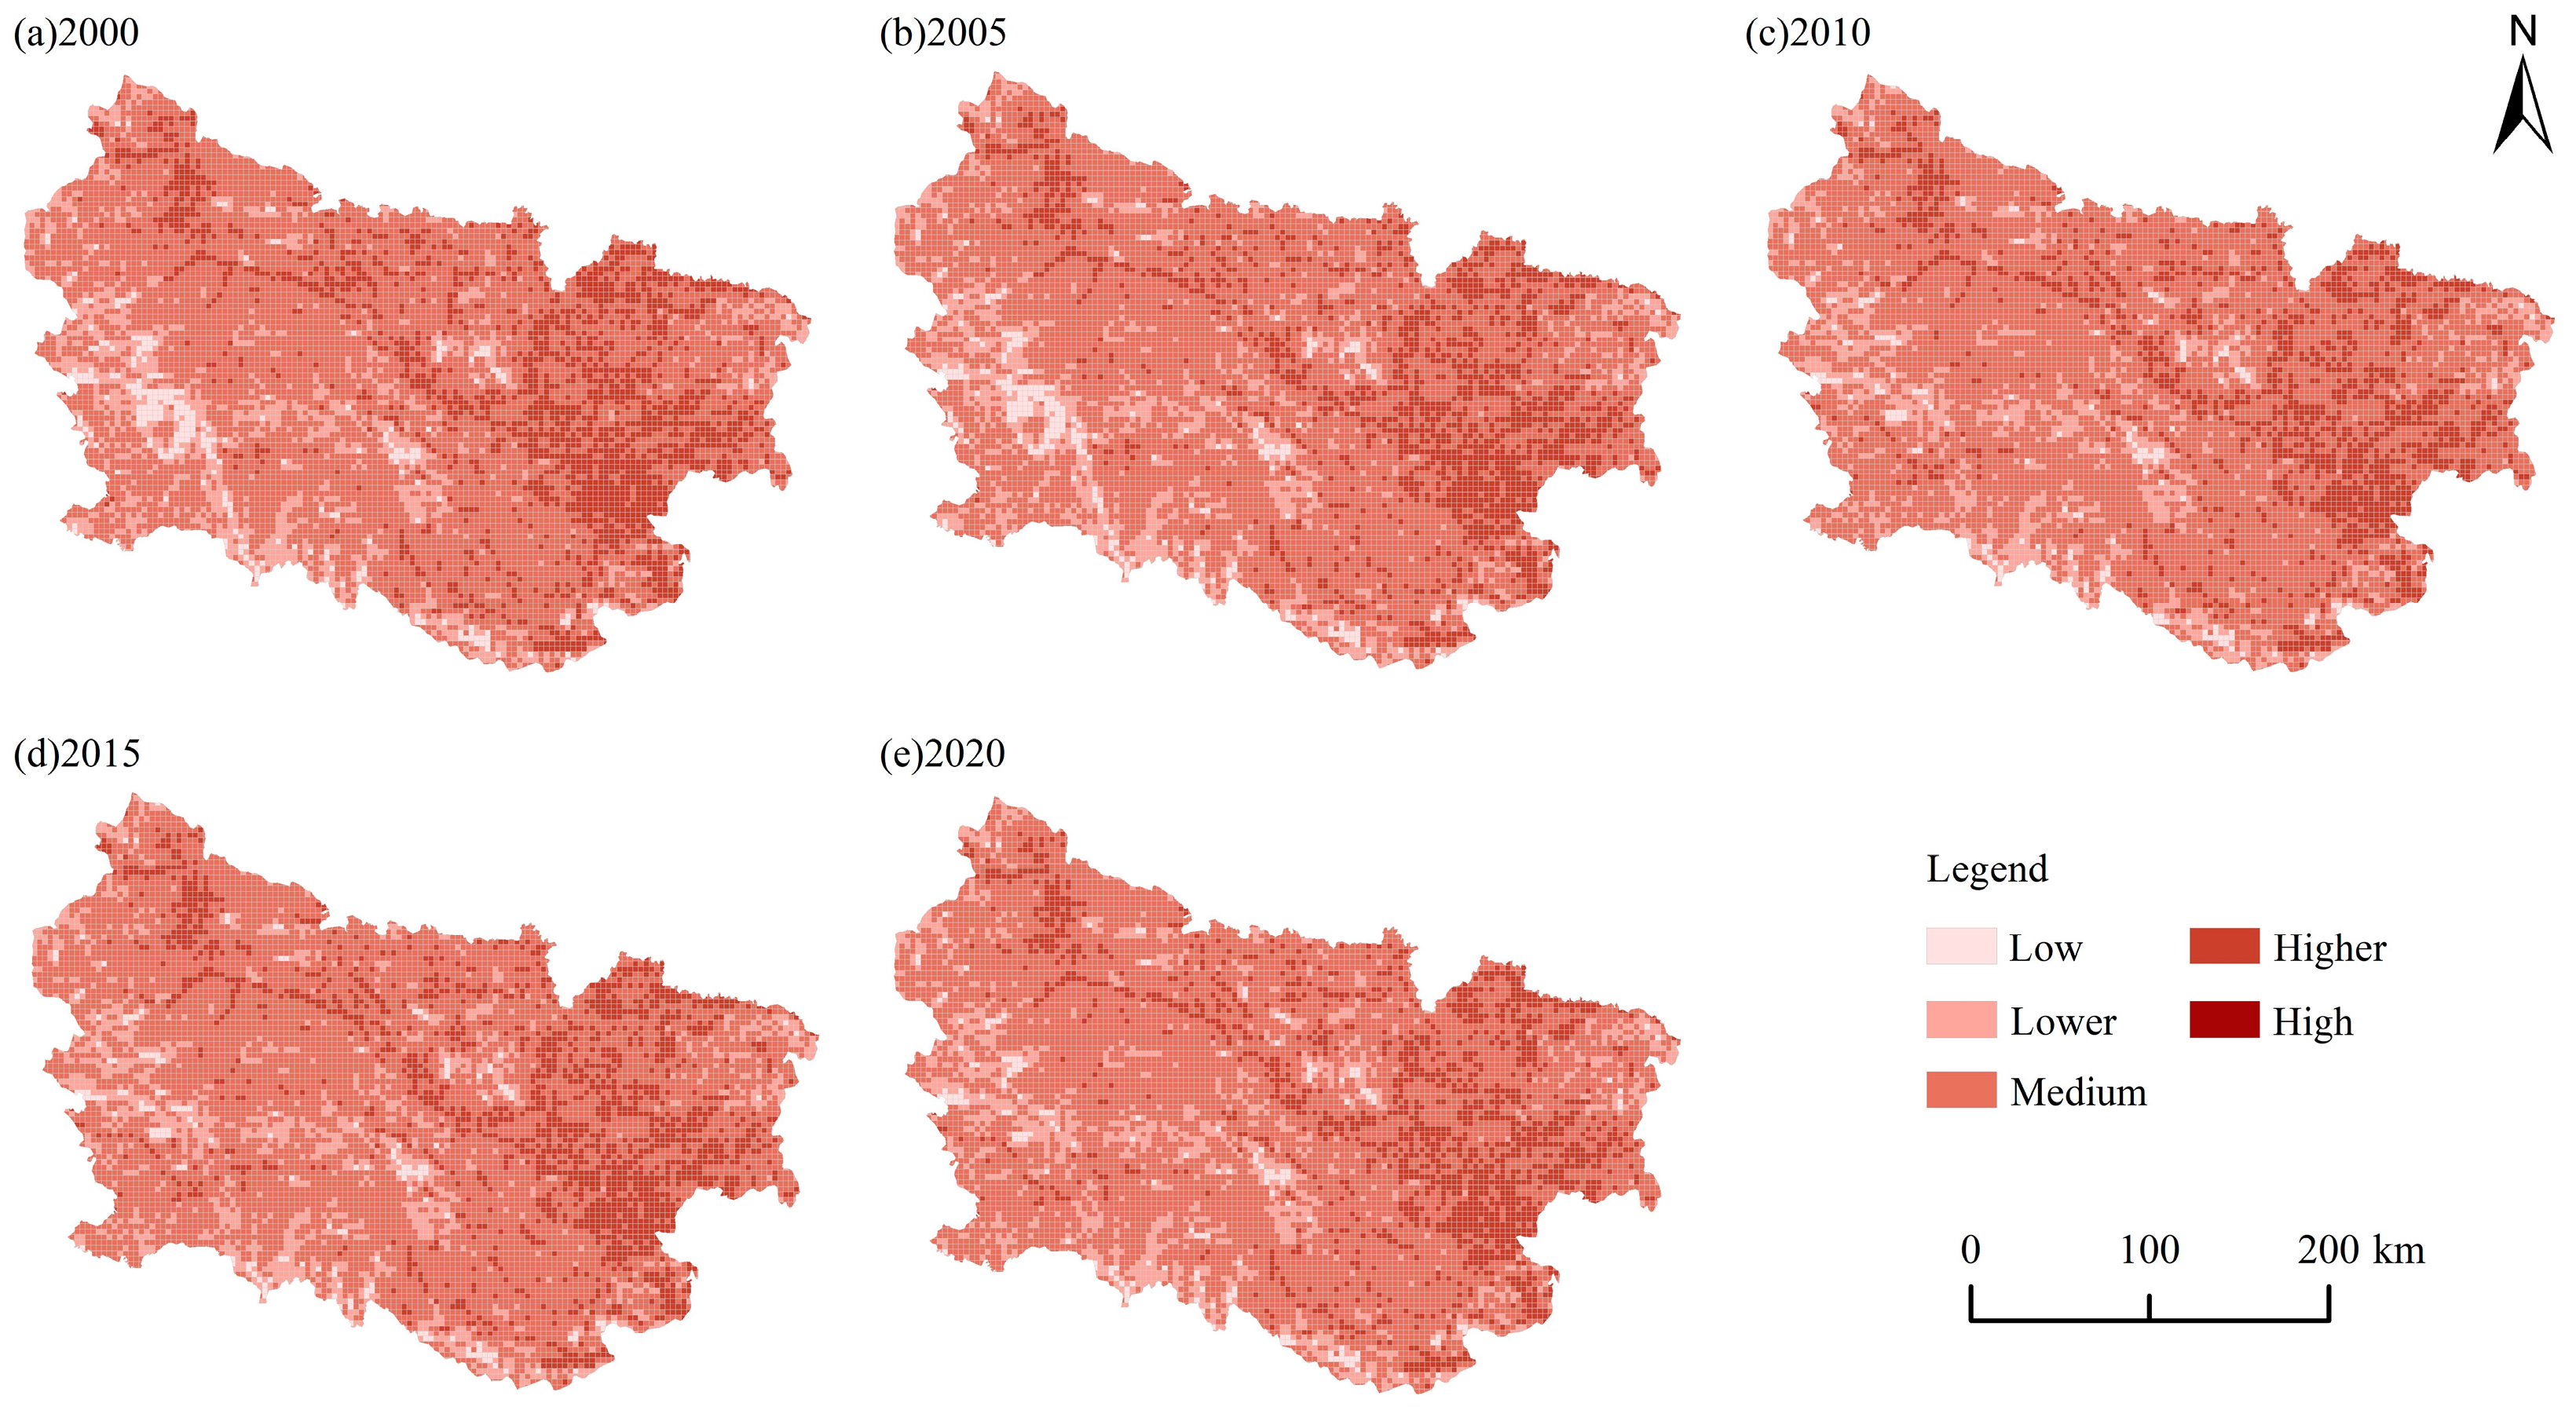
From 2000 to 2020, HQ of the West Qinling Mountains was at a higher level. From the analysis of temporal changes, the HQ showed a decreasing trend from 2000 to 2020. From the analysis of grade change, medium grade and higher grade were predominant, with a clear phenomenon of bipolar sharpening. From the analysis of spatial distribution, the HQ showed a distribution pattern of “high in the west and low in the east, low in the north and high in the south”. This distribution pattern showed a significant spatial positive correlation in space, which showed obvious spatial double clustering characteristics.
(3)
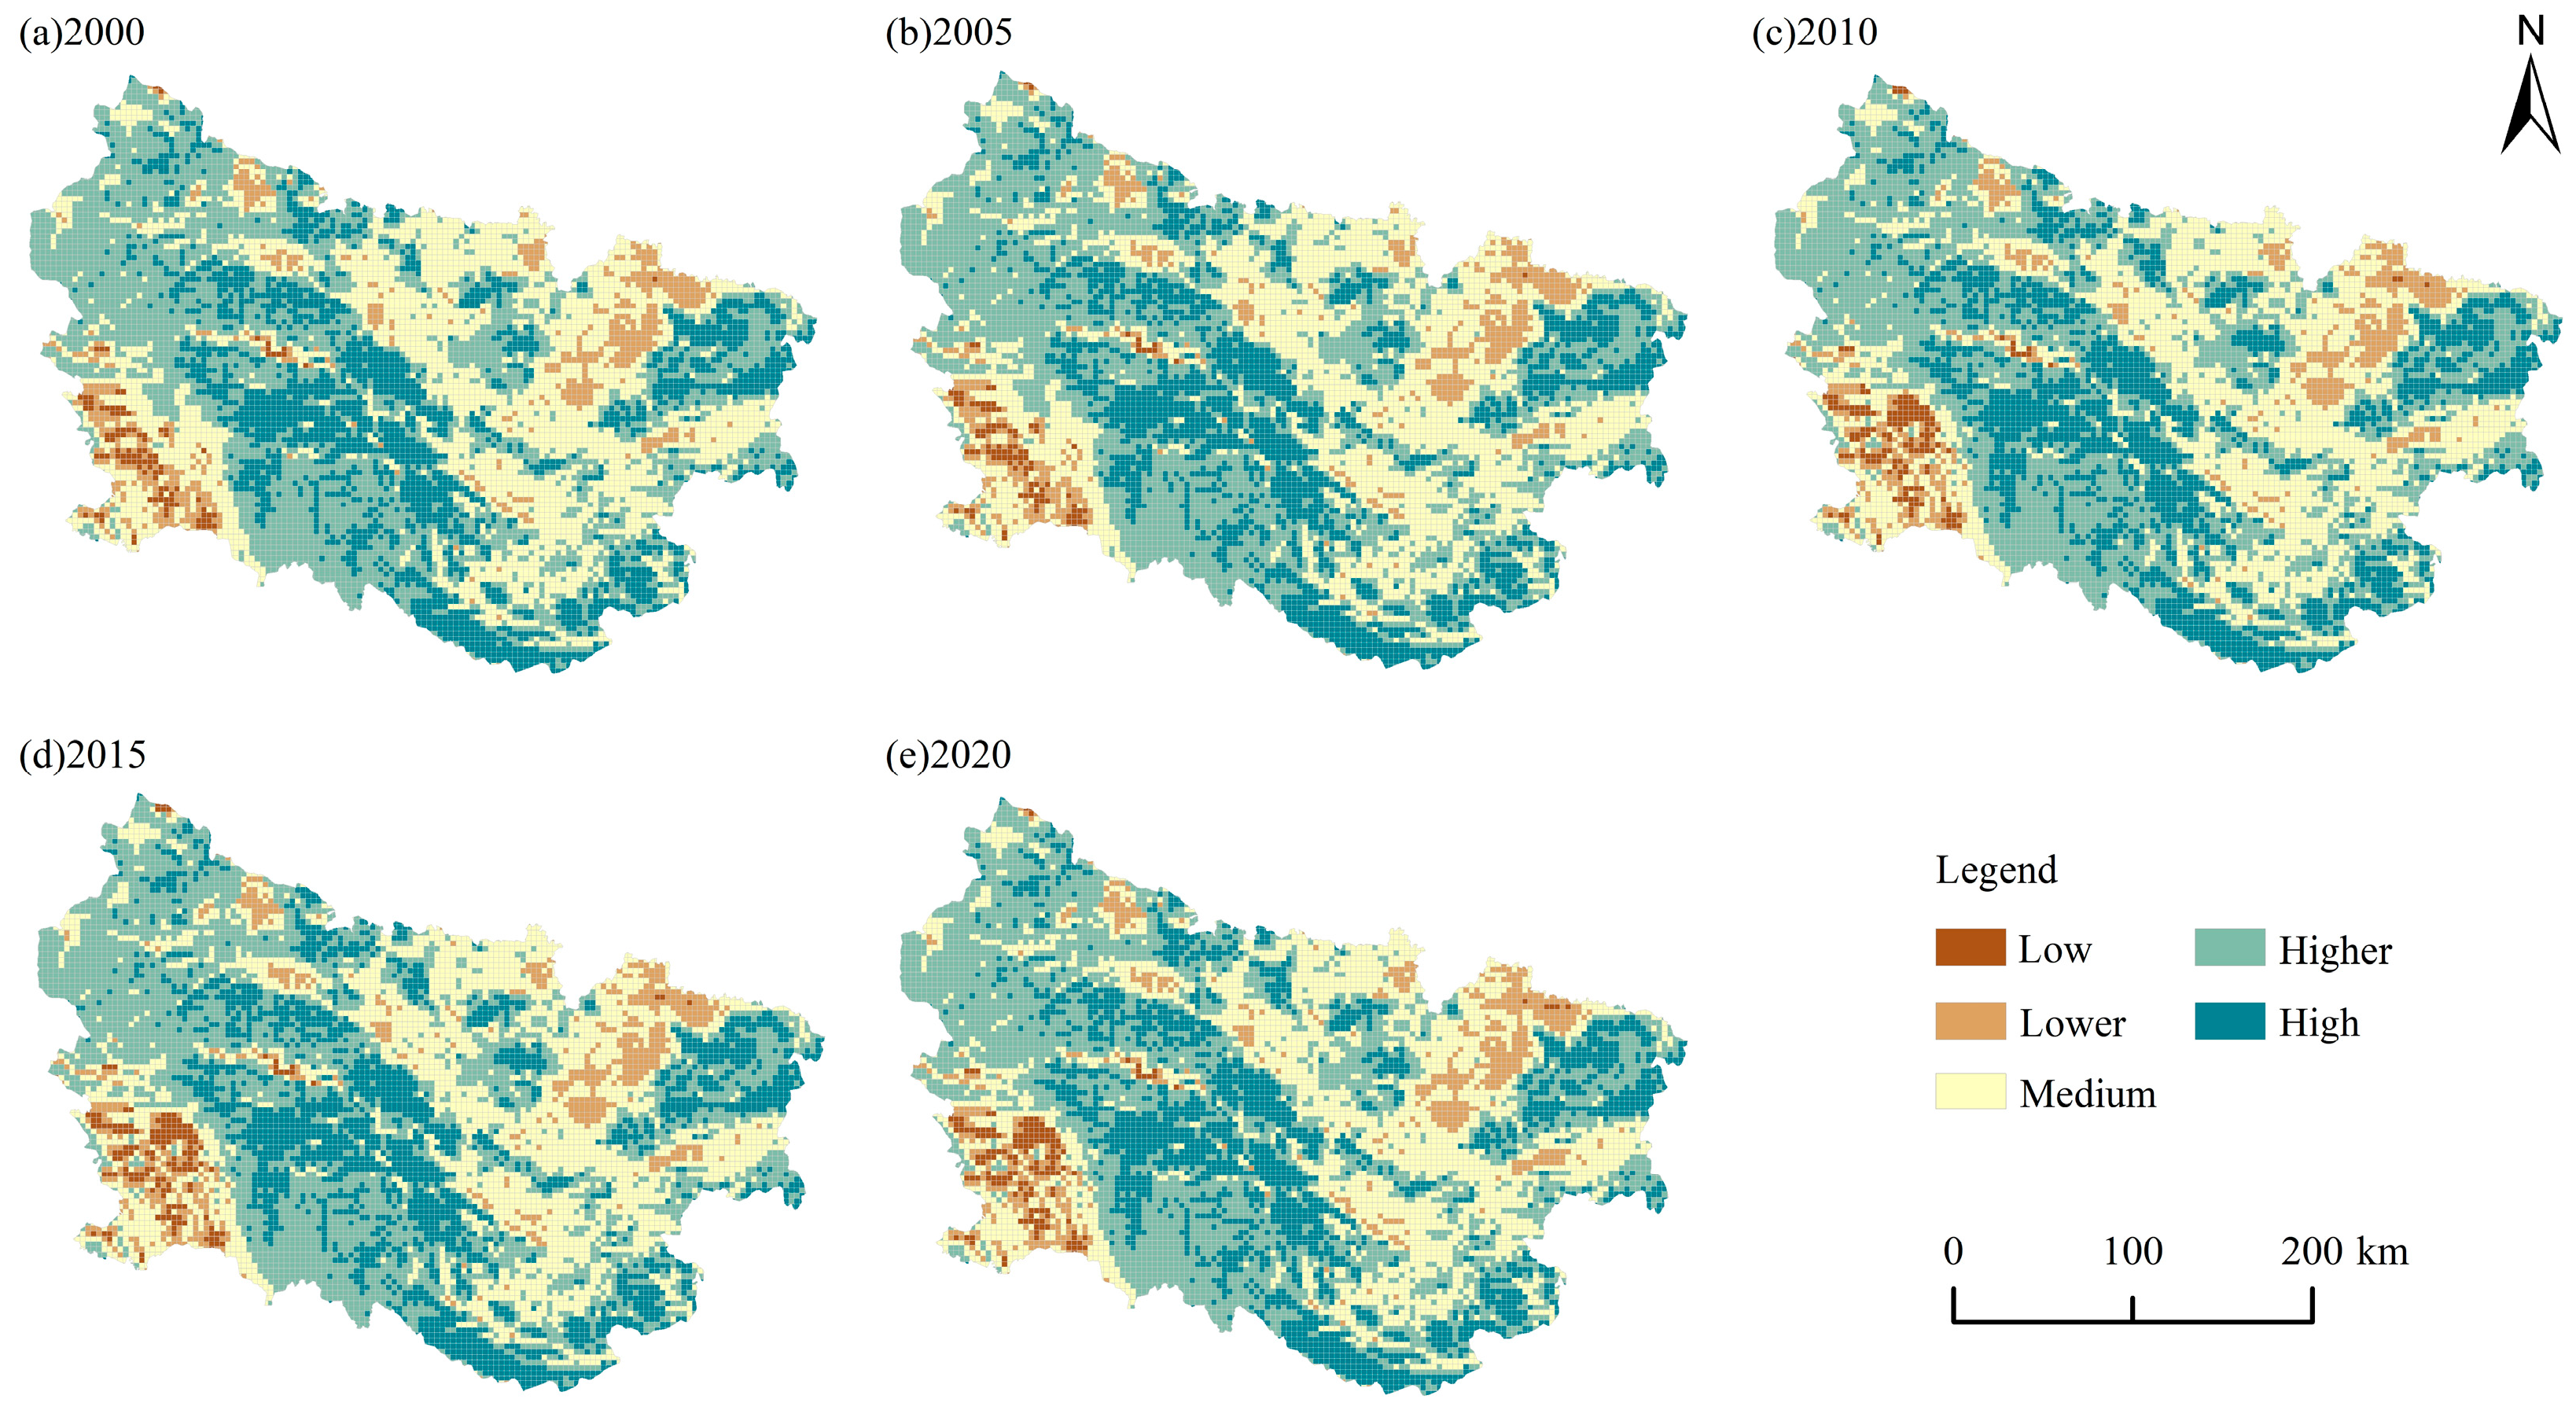
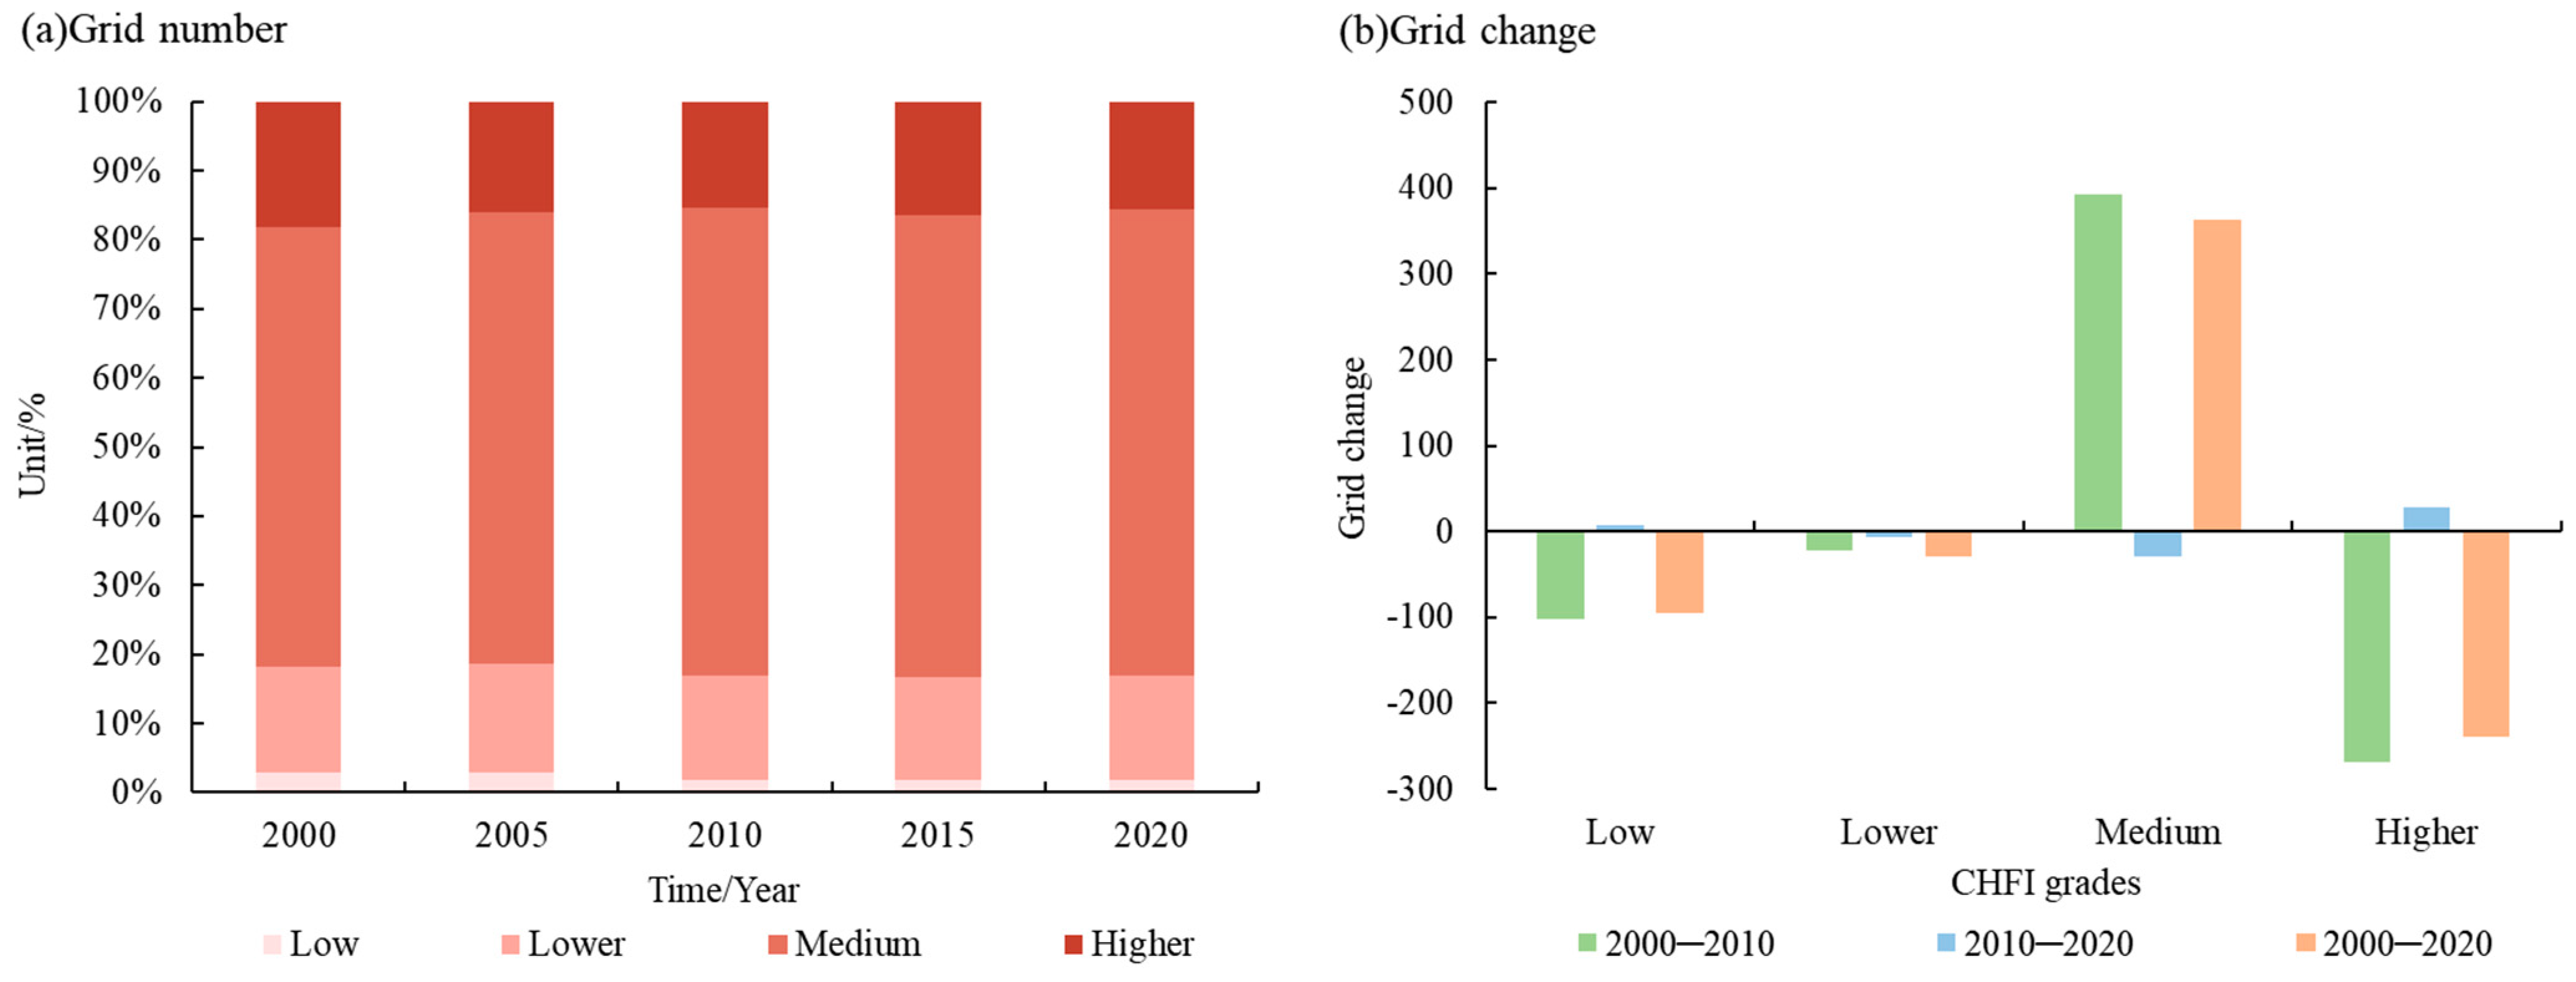
From 2000 to 2020, the habitat fragmentation of the West Qinling Mountains was at a medium level. From the analysis of temporal changes, CHFI showed an increasing trend from 2000 to 2020. From the analysis of grade change, the medium-fragmentation area increased, and the low-fragmentation area, the lower-fragmentation area, and the higher-fragmentation area all decreased, which demonstrated a clear bipolar contraction state. From the analysis of spatial distribution, CHFI showed a distribution pattern of “high in the east and low in the west, high in the north and low in the south”, and the overall spatial distribution of CHFI was retained with the change in time scale.
(4)
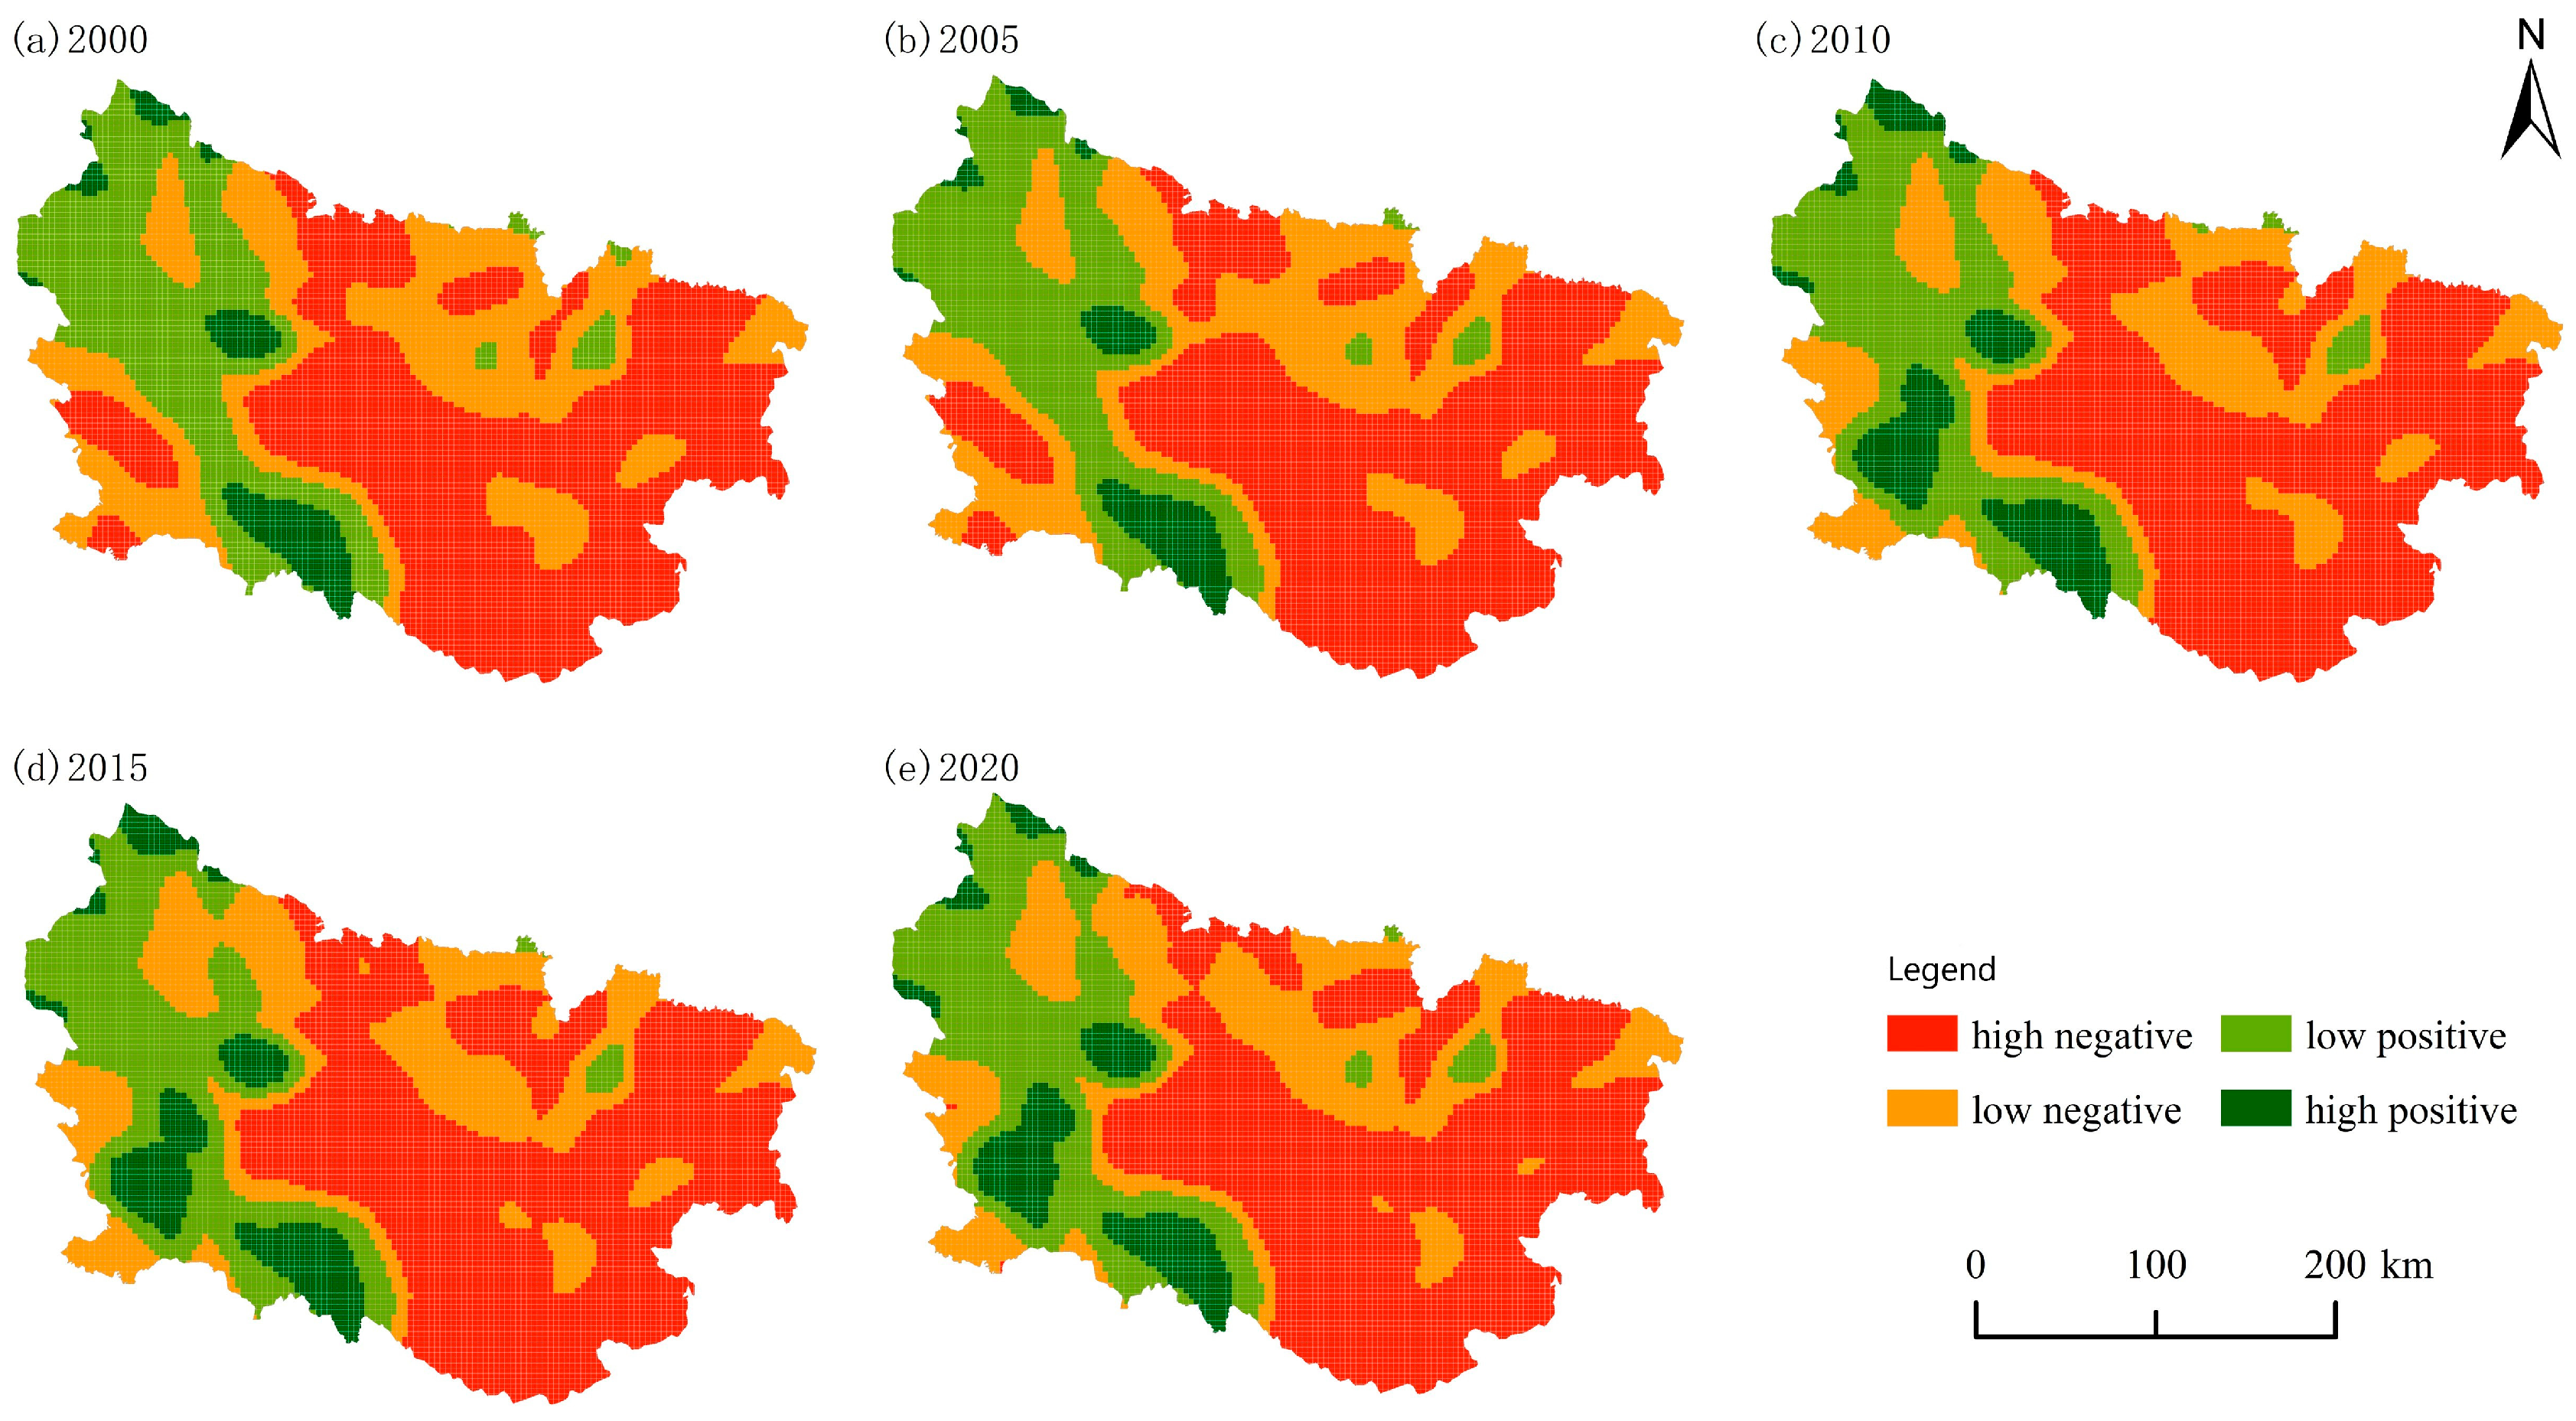
The effects of habitat fragmentation on HQ in the West Qinling Mountains showed a significant spatial and temporal non-stationary relationship, with a predominantly negative correlation. Negative correlation areas were mainly located in the Loess Plateau region of the north and the Qinling Mountains of the east, while positive correlation areas were mainly located in the Qinghai–Tibet Plateau region in the northwest and the Sichuan Basin region of the southwest. As the time scale changes, the degree and range of negative impacts increases and the area of change concentrates in the east-central part of the West Qinling Mountains. The study results suggest that the staggered distribution of forest, unused land, and water might counteract the negative impacts of unused land on HQ.

Author Contributions

Conceptualization, Methodology, Software, Formal Analysis, Writing—Original Draft, C.H.; Writing—Review and Editing, Funding Acquisition, X.L.; Software, X.Z. All authors have read and agreed to the published version of the manuscript.

Funding

This research was funded by the Research on Ecological Land Reclamation and Ecological Barrier Function in the Context of Multi-regulation (GAU-XZ-20160812).

Institutional Review Board Statement

Not applicable.

Informed Consent Statement

Not applicable.

Data Availability Statement

The original contributions presented in the study are included in the article; further inquiries can be directed to the corresponding author.

Conflicts of Interest

The authors declare no conflicts of interest.

Abbreviations

The following abbreviations are used in this manuscript:
HQHabitat quality
InVESTIntegrated valuation of ecosystem services and trade-offs
GWRGeographically weighted regression
CHFIComprehensive habitat fragmentation index
DEMDigital elevation model
LISALocal indicators of spatial associations
NSNon-significant area of clustering situation
H-HHigh and high clustering area
H-LHigh and low clustering area
L-HLow and high clustering area
L-LLow and low clustering area
VIFVariance Inflation Factor
PDPatch density
MPSMean patch area
LSILandscape shape index
CIRCLE_MNMean related circumscribing circle
SHDIShannon’s diversity index
DIVISIONLandscape division index
WLSWeighted least squares

References

  1. Shi, G.; Chen, C.; Cao, Q.; Zhang, J.; Xu, J.; Chen, Y.; Wang, Y.; Liu, J. Spatiotemporal Dynamics and Prediction of Habitat Quality Based on Land Use and Cover Change in Jiangsu, China. Remote Sens. 2024, 16, 4158. [Google Scholar] [CrossRef]
  2. Xie, Z.; Zhang, B.; Shi, Y.; Zhang, X.; Sun, Z. Changes and protections of urban habitat quality in Shanghai of China. Sci. Rep. 2023, 13, 10976. [Google Scholar]
  3. Qin, X.; Yang, Q.; Wang, L. The evolution of habitat quality and its response to land use change in the coastal China, 1985–2020. Sci. Total Environ. 2024, 952, 175930. [Google Scholar]
  4. Zhang, G.; Quan, L. Impact of Habitat Quality Changes on Regional Thermal Environment: A Case Study in Anhui Province, China. Sustainability 2024, 16, 8560. [Google Scholar] [CrossRef]
  5. Kong, X.; Kong, F.; Li, Y.; Sun, J.; Zhu, W.; Han, M. Assessment of coastal landscape fragmentation and its driving factors based on optimal scale: A case study of the Yellow River Delta, China. Ecol. Indic. 2024, 166, 112537. [Google Scholar] [CrossRef]
  6. Yang, F.; Yang, L.; Fang, Q.; Yao, X. Impact of landscape pattern on habitat quality in the Yangtze River Economic Belt from 2000 to 2030. Ecol. Indic. 2024, 166, 112480. [Google Scholar]
  7. Gu, L.; Yan, J.; Li, Y.; Gong, Z. Spatial-temporal evolution and correlation analysis between habitat quality and landscape patterns based on land use change in Shaanxi Province, China. Ecol. Evol. 2023, 13, e10657. [Google Scholar]
  8. Wu, J.; Hou, Y.; Cui, Z. Coupled InVEST–MGWR modeling to analyze the impacts of changing landscape patterns on habitat quality in the Fen River basin. Sci. Rep. 2024, 14, 13084. [Google Scholar]
  9. Mi, Y.; Li, S.; Wang, Z. Spatial distribution and topographic gradient effects of habitat quality in the Chang-Zhu-Tan Urban Agglomeration, China. Sci. Rep. 2024, 14, 22563. [Google Scholar]
  10. Wang, B.; Cheng, W. Effects of Land Use/Cover on Regional Habitat Quality under Different Geomorphic Types Based on InVEST Model. Remote Sens. 2022, 14, 1279. [Google Scholar] [CrossRef]
  11. Chen, C.; Liu, J.; Bi, L. Spatial and Temporal Changes of Habitat Quality and Its Influential Factors in China Based on the InVEST Model. Forests 2023, 14, 374. [Google Scholar] [CrossRef]
  12. Chen, M.; Bai, Z.; Wang, Q.; Shi, Z. Habitat Quality Effect and Driving Mechanism of Land Use Transitions: A Case Study of Henan Water Source Area of the Middle Route of the South-to-North Water Transfer Project. Land 2021, 10, 796. [Google Scholar] [CrossRef]
  13. Tang, Z.; Ning, R.; Wang, D.; Tian, X.; Bi, X.; Ning, J.; Zhou, Z.; Luo, F. Projections of land use/cover change and habitat quality in the model area of Yellow River delta by coupling land subsidence and sea level rise. Ecol. Indic. 2024, 158, 111394. [Google Scholar]
  14. Li, S.; Hong, Z.; Xue, X.; Zheng, X.; Du, S.; Liu, X. Evolution characteristics and multi-scenario prediction of habitat quality in Yulin City based on PLUS and InVEST models. Sci. Rep. 2024, 14, 11852. [Google Scholar]
  15. Lin, Y.; Zhang, X.; Zhu, H.; Li, R. Spatiotemporal Evolution and Mechanisms of Habitat Quality in Nature Reserve Land: A Case Study of 18 Nature Reserves in Hubei Province. Land 2024, 13, 363. [Google Scholar] [CrossRef]
  16. Tang, J.; Zhou, L.; Dang, X.; Hu, F.; Yuan, B.; Yuan, Z.; Wei, L. Impacts and predictions of urban expansion on habitat quality in the densely populated areas: A case study of the Yellow River Basin, China. Ecol. Indic. 2023, 151, 110320. [Google Scholar]
  17. Pan, C.; Wen, J.; Ma, J. Temporal and Spatial Variation in Habitat Quality in Guangxi Based on PLUS-InVEST Model. Land 2024, 13, 2250. [Google Scholar] [CrossRef]
  18. Xie, B.; Zhang, M. Spatio-temporal evolution and driving forces of habitat quality in Guizhou Province. Sci. Rep. 2023, 13, 6908. [Google Scholar]
  19. Chen, Y.; Chang, J.; Li, Z.; Ming, L.; Li, C. Influence of land use change on habitat quality: A case study of coal mining subsidence areas. Environ. Monit. Assess. 2024, 196, 535. [Google Scholar] [CrossRef]
  20. Liang, Y.; Wang, B.; Hashimoto, S.; Peng, S.; Yin, Z.; Huang, J. Habitat quality assessment provides indicators for socio-ecological management: A case study of the Chinese Loess Plateau. Environ. Monit. Assess. 2022, 195, 101. [Google Scholar]
  21. Zhang, Z.; Zhang, H.; Feng, J.; Wang, Y.; Liu, K. Evaluation of Social Values for Ecosystem Services in Urban Riverfront Space Based on the SolVES Model: A Case Study of the Fenghe River, Xi’an, China. Int. J. Environ. Res. Public Health 2021, 18, 2765. [Google Scholar] [CrossRef]
  22. Bai, D.; Chen, P.; Atzeni, L.; Cering, L.; Li, Q.; Shi, K. Assessment of habitat suitability of the snow leopard (Panthera uncia) in Qomolangma National Nature Reserve based on MaxEnt modeling. Zool. Res. 2018, 39, 373–386. [Google Scholar] [PubMed]
  23. Pu, J.; Shen, A.; Liu, C.; Wen, B. Impacts of ecological land fragmentation on habitat quality in the Taihu Lake basin in Jiangsu Province, China. Ecol. Indic. 2024, 158, 111611. [Google Scholar]
  24. Duan, X.; Chen, Y.; Wang, L.; Zheng, G.; Liang, T. The impact of land use and land cover changes on the landscape pattern and ecosystem service value in Sanjiangyuan region of the Qinghai-Tibet Plateau. J. Environ. Manag. 2023, 325, 116539. [Google Scholar] [CrossRef] [PubMed]
  25. Zhu, C.; Zhang, X.; Zhou, M.; He, S.; Gan, M.; Yang, L.; Wang, K. Impacts of urbanization and landscape pattern on habitat quality using OLS and GWR models in Hangzhou, China. Ecol. Indic. 2020, 117, 106654. [Google Scholar] [CrossRef]
  26. Wang, D.; Hao, H.; Liu, H.; Sun, L.; Li, Y. Spatial-temporal changes of landscape and habitat quality in typical ecologically fragile areas of western China over the past 40 years: A case study of the Ningxia Hui Autonomous Region. Ecol. Evol. 2024, 14, e10847. [Google Scholar] [CrossRef]
  27. Yang, F.; Wang, N.; Shi, F.; Ljungqvist, F.C.; Wang, S.; Fan, Z.; Lu, J. Multi-proxy temperature reconstruction from the West Qinling Mountains, China, for the past 500 years. PLoS ONE 2013, 8, e57638. [Google Scholar]
  28. Ji, X.; Sun, Y.; Guo, W.; Zhao, C.; Li, K. Land use and habitat quality change in the Yellow River Basin: A perspective with different CMIP6-based scenarios and multiple scales. J. Environ. Manag. 2023, 345, 118729. [Google Scholar] [CrossRef]
  29. Zhang, Q.; Zhu, L.; Fu, H. Spatiotemporal Correlation Analysis of Landscape Pattern and Habitat Quality in and Around China’s Tropical Rainforest National Park. Forests 2024, 15, 2070. [Google Scholar] [CrossRef]
  30. Fletcher, R.J.; Smith, T.A.H.; Kortessis, N.; Bruna, E.M.; Holt, R.D. Landscape experiments unlock relationships among habitat loss, fragmentation, and patch-size effects. Ecology 2023, 104, e4037. [Google Scholar] [CrossRef]
  31. Zou, L.; Wang, J.; Bai, M. Assessing spatial-temporal heterogeneity of China’s landscape fragmentation in 1980–2020. Ecol. Indic. 2022, 136, 108654. [Google Scholar] [CrossRef]
  32. Mulatu, K.; Hundera, K.; Senbeta, F. Analysis of land use/land cover changes and landscape fragmentation in the Baro-Akobo Basin, Southwestern Ethiopia. Heliyon 2024, 10, e28378. [Google Scholar] [CrossRef]
  33. Huang, B.; Wu, B.; Barry, M. Geographically and temporally weighted regression for modeling spatio-temporal variation in house prices. Int. J. Geogr. Inf. Sci. 2010, 24, 383–401. [Google Scholar]
  34. Li, Q.; Ma, B.; Zhao, L.; Mao, Z.; Luo, L.; Liu, X. Landscape Ecological Risk Evaluation Study under Multi-Scale Grids—A Case Study of Bailong River Basin in Gansu Province, China. Water 2023, 15, 3777. [Google Scholar] [CrossRef]
  35. Tran, D.X.; Pearson, D.; Palmer, A.; Lowry, J.; Gray, D.; Dominati, E.J. Quantifying spatial non-stationarity in the relationship between landscape structure and the provision of ecosystem services: An example in the New Zealand hill country. Sci. Total Environ. 2022, 808, 152126. [Google Scholar] [CrossRef]
  36. Shi, F.; Zhou, B.; Zhou, H.; Zhang, H.; Li, H.; Li, R.; Guo, Z.; Gao, X. Spatial Autocorrelation Analysis of Land Use and Ecosystem Service Value in the Huangshui River Basin at the Grid Scale. Plants 2022, 11, 2294. [Google Scholar] [CrossRef]
  37. Neate-Clegg, M.H.; Etterson, M.A.; Tingley, M.W.; Newmark, W.D. The combined effects of temperature and fragment area on the demographic rates of an Afrotropical bird community over 34 years. Biol. Conserv. 2023, 282, 110051. [Google Scholar] [CrossRef]
  38. Zheng, L.; Wang, Y.; Li, J. Quantifying the spatial impact of landscape fragmentation on habitat quality: A multi-temporal dimensional comparison between the Yangtze River Economic Belt and Yellow River Basin of China. Land Use Policy 2023, 125, 106463. [Google Scholar]
  39. Zheng, H.; Li, H. Spatial–temporal evolution characteristics of land use and habitat quality in Shandong Province, China. Sci. Rep. 2022, 12, 15422. [Google Scholar] [CrossRef]
  40. Hu, J.; Zhang, J.; Li, Y. Exploring the spatial and temporal driving mechanisms of landscape patterns on habitat quality in a city undergoing rapid urbanization based on GTWR and MGWR: The case of Nanjing, China. Ecol. Indic. 2022, 143, 109333. [Google Scholar] [CrossRef]
  41. Yohannes, H.; Soromessa, T.; Argaw, M.; Dewan, A. Spatio-temporal changes in habitat quality and linkage with landscape characteristics in the Beressa watershed, Blue Nile basin of Ethiopian highlands. J. Environ. Manag. 2021, 281, 111885. [Google Scholar] [CrossRef] [PubMed]
  42. Zhu, J.; Ding, N.; Li, D.; Sun, W.; Xie, Y.; Wang, X. Spatiotemporal analysis of the nonlinear negative relationship between urbanization and habitat quality in Metropolitan areas. Sustainability 2020, 12, 669. [Google Scholar] [CrossRef]
Figure 1. Location and elevation of study area. (a) Location of the provinces involved in the West Qinling Mountains in China. (b) The West Qinling Mountains’s specific location. (c) The West Qinling Mountains’s elevation.
Sustainability 17 03256 g001
Figure 2. Types of land use in West Qinling Mountains.
Sustainability 17 03256 g002
Figure 3. Mean HQ and HQ area under different grid sizes.
Sustainability 17 03256 g003
Figure 4. Spatial distribution of HQ under different grid scales in 2020 in West Qinling Mountains.
Sustainability 17 03256 g004
Figure 5. Number of HQ grades in West Qinling Mountains.
Sustainability 17 03256 g005
Figure 6. Spatial distribution of HQ in West Qinling Mountains.
Sustainability 17 03256 g006
Figure 7. LISA clusters map of HQ in West Qinling Mountains.
Sustainability 17 03256 g007
Figure 8. Number of CHFI grades in West Qinling Mountains.
Sustainability 17 03256 g008
Figure 9. Spatial distribution of CHFI in West Qinling Mountains.
Sustainability 17 03256 g009
Figure 10. Spatial distribution of correlation coefficients of CHFI and HQ in West Qinling Mountains.
Sustainability 17 03256 g010
Table 1. Threat and its maximum effect distance, weight, and spatial decay type.
Threat FactorsMaximum Effective Distance (km)WeightDecay Type
Cultivated land1.50.1Linear
Urban land60.35Exponential
Rural residential land2.50.2Exponential
Other construction land30.3Exponential
Unused land2.50.05Linear
Table 2. Habitat suitability and its sensitivity to threat factors.
Habitat TypeHabitat
Suitability
Cultivated LandUrban LandRural Residential LandOther Construction LandUnused Land
Cultivated land0.400.50.350.40.4
Forest10.810.850.80.6
Grassland0.60.50.60.40.50.6
Water0.80.70.90.750.90.75
construction land000000
Unused land000000
Table 3. The landscape indices correlation test.
Landscape
Pattern Index
Patch
Density
(PD)
Mean Patch Area
(MPS)
Landscape Shape Index (LSI)Mean Related Circumscribing Circle
(CIRCLE_MN)
Shannon’s Diversity Index (SHDI)Landscape Division Index (DIVISION)
Patch density
(PD)
1
Mean patch area
(MPS)
0.0591
Landscape shape index (LSI)−0.0220.5841
Mean related
circumscribing circle
(CIRCLE_MN)
−0.1730.4980.2571
Shannon’s
diversity index (SHDI)
−0.0410.5990.7250.3091
Landscape
division index
(DIVISION)
−0.0390.5920.7790.3430.8841
Table 4. The chosen landscape index at the landscape level.
TypeFeaturesLandscape
Pattern Index
UnitsRangeEcological
Significance
VIF
Habitat areaQuantityPatch density
(PD)
Pcs/100 ha>0The greater the PD, the greater the landscape heterogeneity, the greater the degree of fragmentation.1.072
ScaleMean patch area
(MPS)
ha>0The greater the MPS, the greater the landscape grain size, the less fragmentation.2.112
Habitat shapeComplexityLandscape shape index (LSI)≥1The greater the LSI, the more complex the landscape shape, the greater the degree of fragmentation.2.766
CompactnessMean related circumscribing circle
(CIRCLE_MN)
[0,1]The greater the CIRCLE_MN, the greater ductile of patch, the greater the degree of fragmentation.1.443
Habitat distributionDiversityShannon’s diversity index (SHDI)≥0The greater the SHDI, the greater the diversity of patch types, the greater the degree of fragmentation.4.832
AggregationLandscape division index (DIVISION)%[0,1]The greater the DIVISION, the less aggregation of patches, the greater the degree of fragmentation.5.749
Table 5. Fitting effect of GWR model.
Yearp ValueAICcR2Adj. R2
20000.0000−15,078.88480.64060.6311
20050.0000−15,011.76340.63720.6276
20100.0000−14,746.31780.65090.6408
20150.0000−14,768.07260.65400.6437
20200.0000−14,944.54350.65970.6491
Disclaimer/Publisher’s Note: The statements, opinions and data contained in all publications are solely those of the individual author(s) and contributor(s) and not of MDPI and/or the editor(s). MDPI and/or the editor(s) disclaim responsibility for any injury to people or property resulting from any ideas, methods, instructions or products referred to in the content.

