
An Effort to Strengthen the Objectives of Education for Sustainable Development, Based on the Use of the Cosmos–Evidence–Ideas Model


Abstract
1. Introduction
Theoretical Background
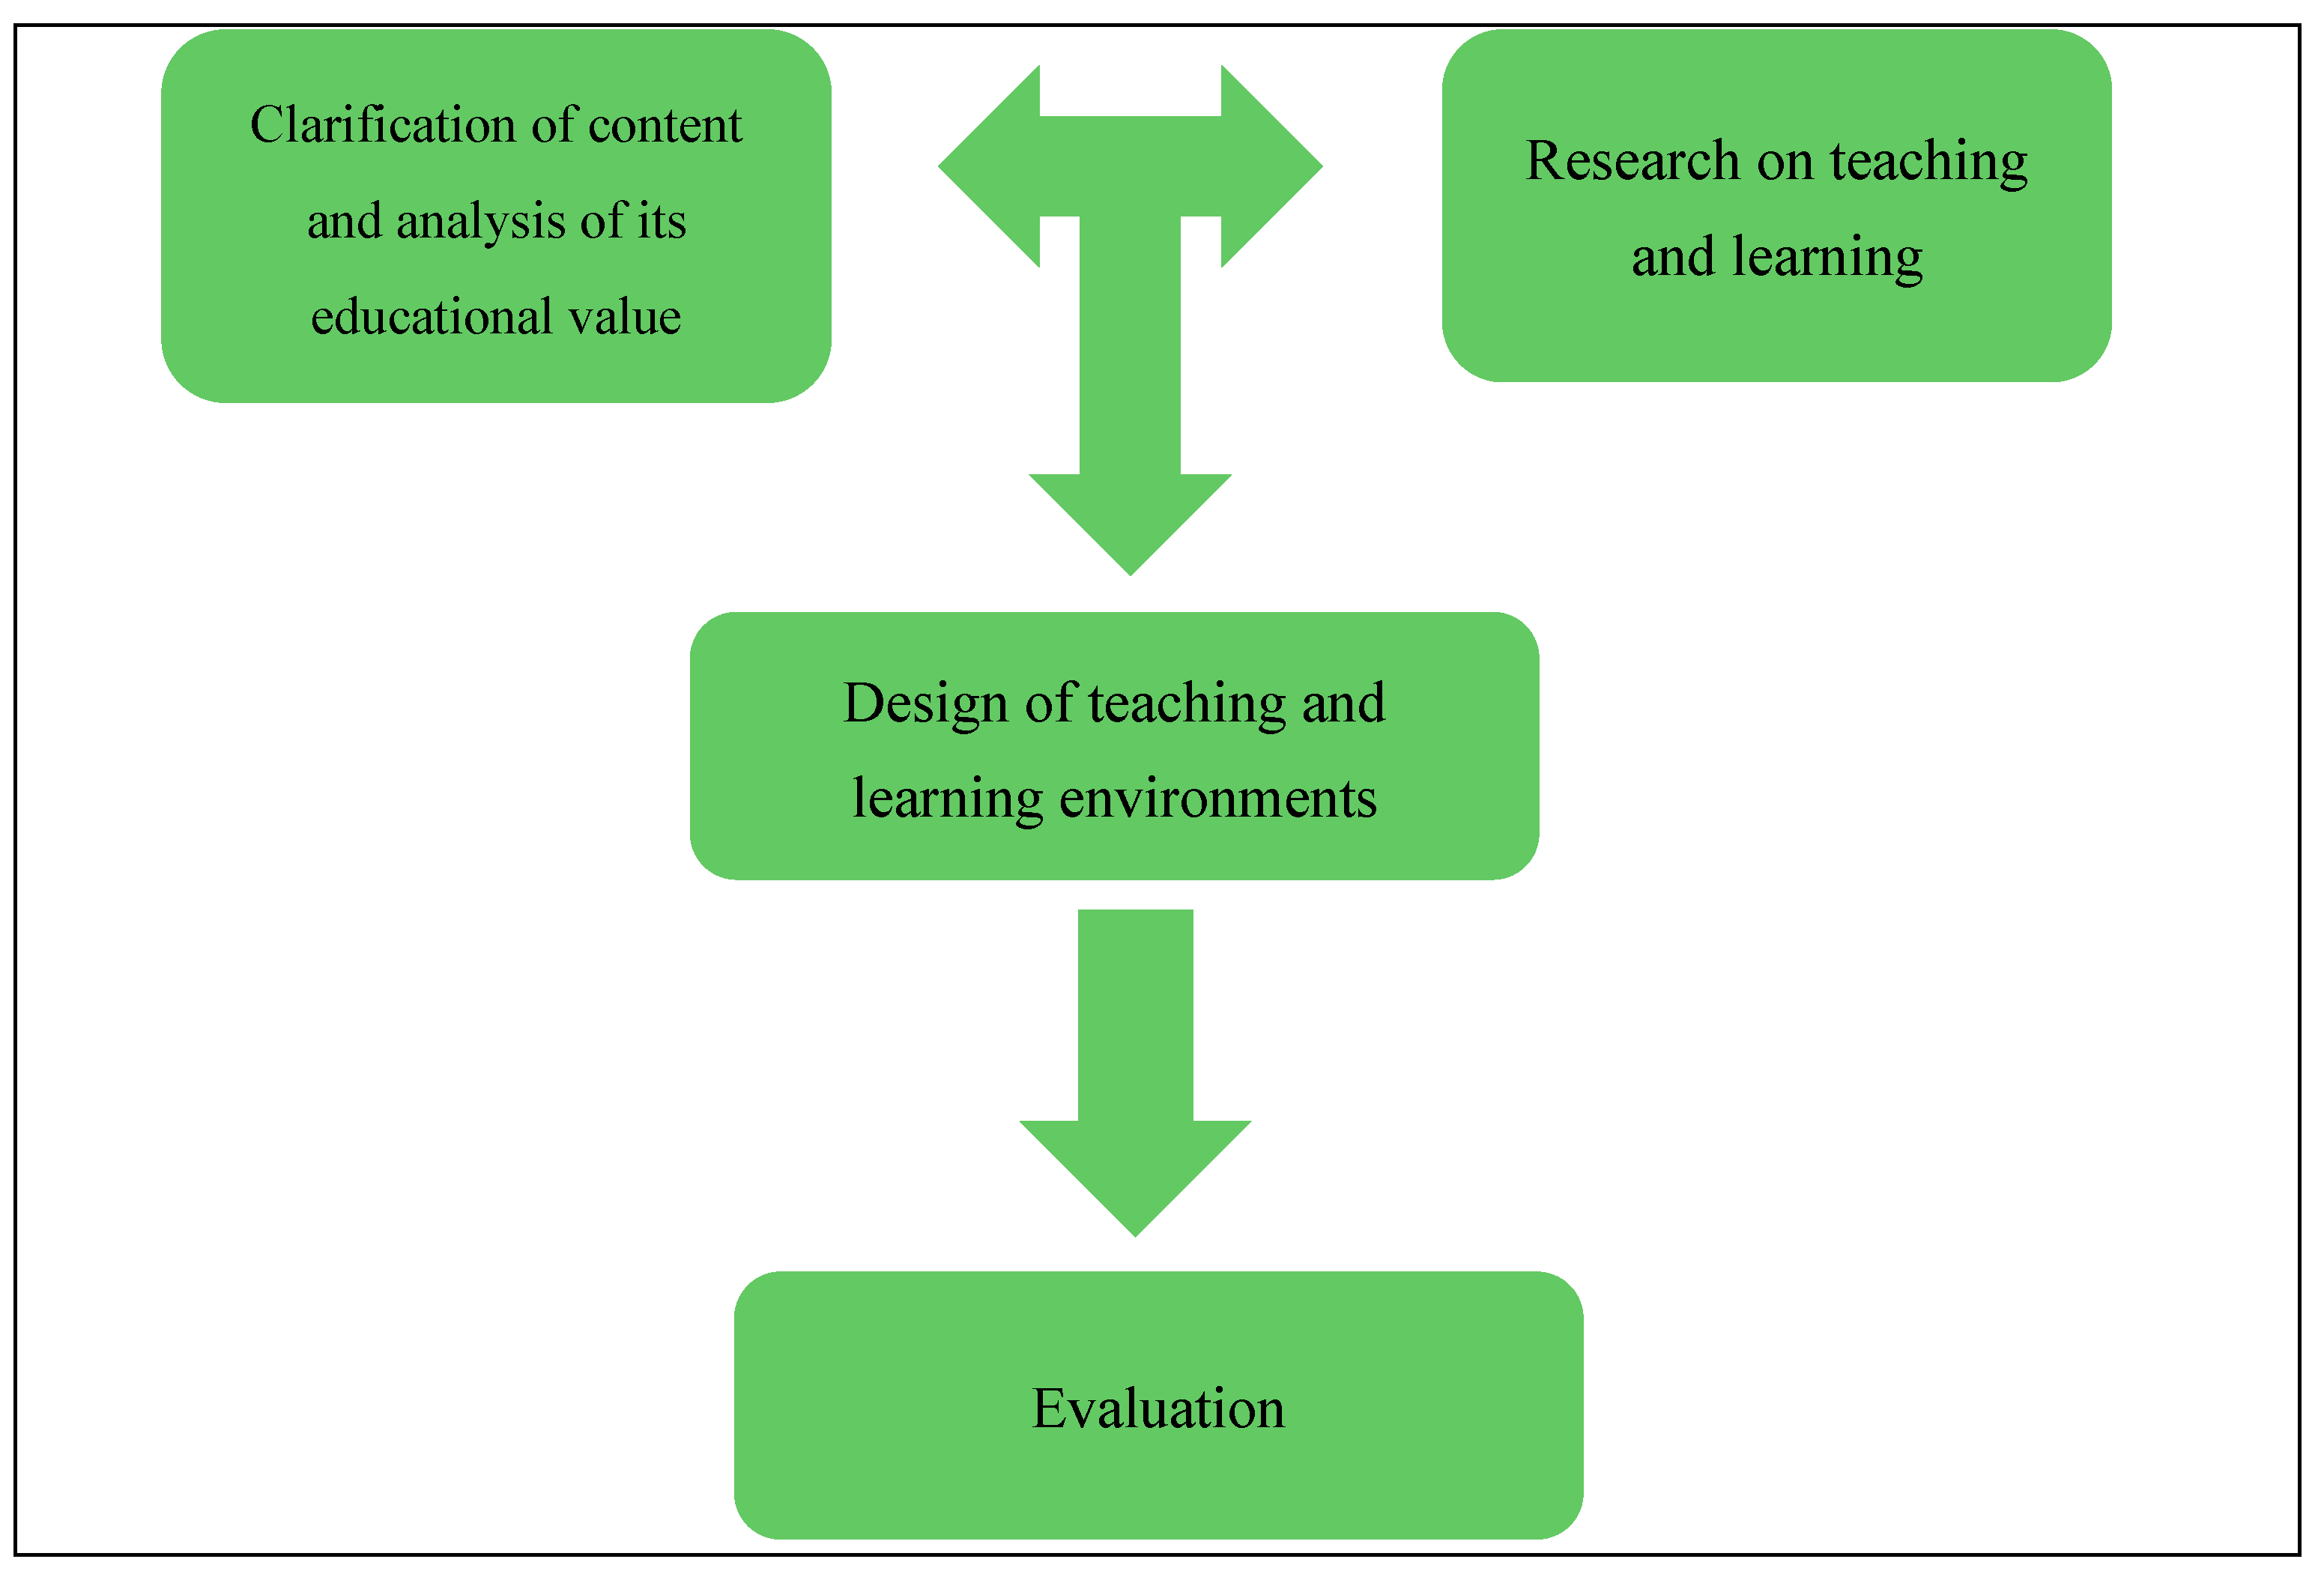
2. Materials and Methods
2.1. Participants
2.2. The TLSs
- Improving overall understanding;
- The enhancement of knowledge regarding particular topics around which the instruction was centered;
- The weakening of their alternative ideas;
- Their ability to incorporate new knowledge into their reasoning.

| Teaching Scenarios | Main Activities | Connection | |
|---|---|---|---|
| TLS 1 | TLS 2 | ||
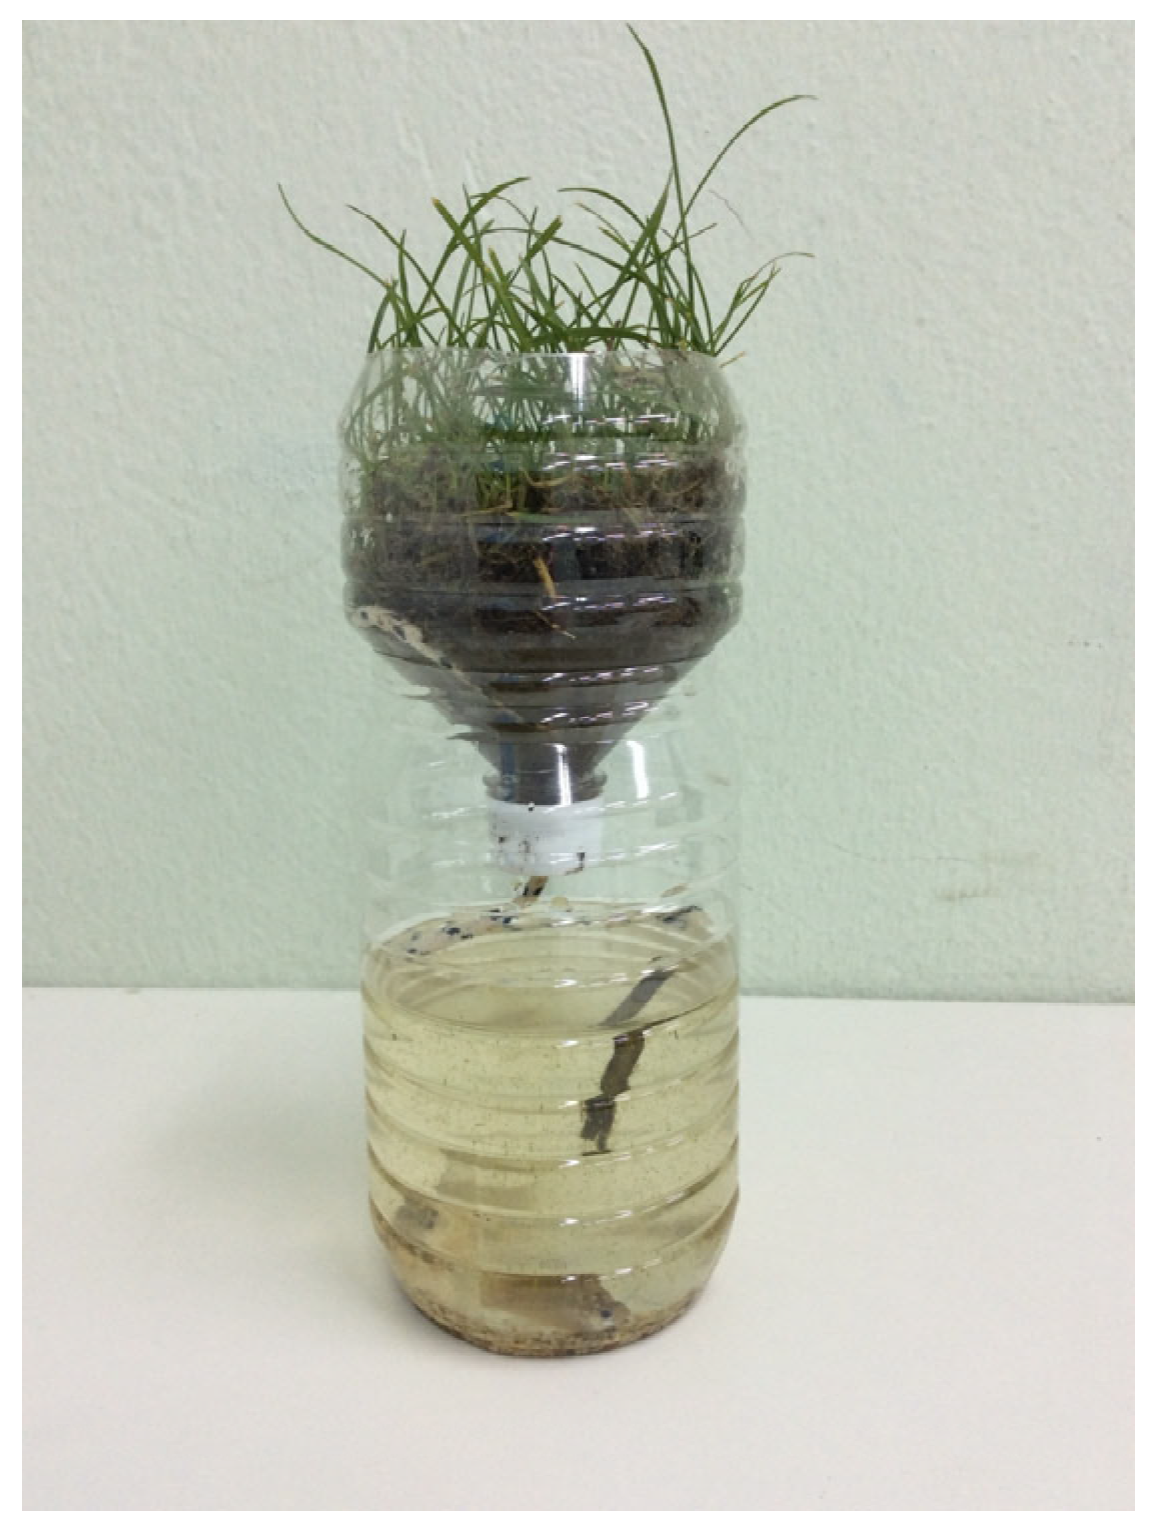
| 1 Structure—ecosystem characteristics | An ecosystem model is presented to the students, and they are asked to perform several activities in relation to it (Figure 4), e.g., description with observational or theoretical terms, construction of concept maps, crossword completion, etc. | C → E I ↔ E | All |
| 2 Plant growth—nutrition | The historical experiments of Helmont and Priestley are presented step by step. Students predict experiments’ progress—draw conclusions. They build chemical molecules using digital simulation. | C → E I ↔ E | All |
| 3 Energy flow—food relationships | They study food chains, webs, and pyramids; make calculations; and come to conclusions. They role-play and simulate a food web. | C ↔ E I ↔ C | All |
| 4 Ecological succession | They study pictures and videos of the successive forms of an ecosystem and focus on the differences. They place in chronological order corresponding images of an ecosystem and recognize the stages of development of another in a case study text. | I ↔ E C → I | All |
| 5 Biodiversity | They focus on the biodiversity that surrounds them. They record how many different organisms contribute ingredients to make a specific food, how many human activities rely on interaction with other organisms, etc. They undertake to present, in a way of their choice, the reasons why we should protect biodiversity. | C ↔ E I → E C → I | All |
2.3. The Evaluation of the TLSs
3. Results
3.1. Comparison of TLS 1 and TLS 2 Groups Before the Instruction
3.2. Cognitive Development of TLS 1 and TLS 2 Groups
3.2.1. For the TLS 1 Group
3.2.2. For the TLS 2 Group
3.3. Comparison of Improvement Between the Groups
3.4. Concerning Comprehending Each of the Distinct Ideas
3.5. Concerning Alternative Ideas
3.5.1. For the TLS 1 Group
3.5.2. For the TLS 2 Group
- A change in the population of one organism will affect all other organisms to the same extent [26];
- Populations exist in states of either steady growth or decline depending on their position in a food chain [23];
- Carbon dioxide is a source of energy for plants [62];
- The succession involves distinct stages that ultimately lead to a deterministic climax [62];
- The top of a food chain has the most energy because it accumulates along the chain [29].
3.6. Concerning the Integration of New Knowledge
4. Discussion
Supplementary Materials
Author Contributions
Funding
Institutional Review Board Statement
Informed Consent Statement
Data Availability Statement
Acknowledgments
Conflicts of Interest
Abbreviations
| TLS | Teaching learning sequence |
| CEI | Cosmos–Evidence–Ideas model |
| R | Representational entities |
| I | Interventional entities |
Appendix A
Appendix A.1. Sample Multiple-Choice Question of the Questionnaire. The Correct Answer Is Marked with Bold
- Will only affect those organisms with which they are directly linked through a trophic relationship, e.g., they have a predator–prey relationship
- It will affect all other organisms to the same extent
- May not affect the ecosystem because some organisms are not important
- Will affect all organisms in the ecosystem to a lesser or greater extent
Appendix A.2. Open-Ended Questions of the Questionnaire
Appendix A.3. Examples of 1st Open-Ended Questions’ Analysis
“First of all, it is a problem because some organisms feed on these species. Secondly, the population of organisms feeding endangered species will increase excessively. Thirdly, it is regrettable that future generations will not be aware of these species.”
“The food chain is broken”
Appendix A.4. Examples of Pre Post Responses to the 1st Open-Ended Question
| 1st Open-Ended Question | |
| Pre | Post |
| There will be less animals. The food chain will break. Trees will be reduced. | Enough animals will die; it will break up the food chain. |
| The food chain is destroyed. Because many things contribute to human life. | Other organisms overpopulate. The food chain they are in is disrupted. |
Appendix A.5. Examples of 2nd Open-Ended Questions’ Analysis
“Stop the hunting of non-breeding animals. Increase the mating of endangered species. Reduce environmental pollution because many animals die because they confuse garbage with food”
“Be more careful about the environment”
Appendix A.6. Examples of Pre/Post Responses to the 2nd Open-Ended Question
| 2nd Open-Ended Question | |
| Pre | Post |
| Endangered species will be able to gather them in an environment and care for them. To stop destroying the natural environment of these species in any way. To inform the population about the seriousness of the situation and to act accordingly. | To prevent fires. To build protected areas for endangered animals. Not to interfere with the ecosystem of any species. |
| Do not throw garbage into the sea. Not killing enough animals (for some reason). Don’t cut the trees. | Not to kill animals to make bags, belts. Not to set fires of their own volition. Be more careful with animals. |
References
- Lewinsohn, T.M.; Attayde, J.L.; Fonseca, C.R.; Ganade, G.; Jorge, L.R.; Kollmann, J.; Overbeck, G.E.; Prado, P.I.; Pillar, V.D.; Popp, D.; et al. Ecological literacy and beyond: Problem-based learning for future professionals. Ambio 2015, 44, 154–162. [Google Scholar] [PubMed]
- Archie, M.; Mann, L.; Vymetal-Taylor, M.; Alston, C.; Braus, J.; Hayden, M.; Hollums, D.; McKeown-Ice, R.; Paden, M.; Paterson, M.; et al. Guidelines for the Preparation and Professional Development of Environmental Educators; North American Association for Environmental Education: Washington, DC, USA, 2005. [Google Scholar]
- Cid, C.R.; Pouyat, R.V. Making ecology relevant to decision making: The human-centered, place-based approach. Front. Ecol. Environ. 2013, 11, 447–448. [Google Scholar] [CrossRef]
- Ju, E.J.; Kim, J.G. Using soil seed banks for ecological education in primary school. J. Biol. Educ. 2011, 45, 93–101. [Google Scholar]
- Long, T.M.; Dauer, J.T.; Kostelnik, K.M.; Momsen, J.L.; Wyse, S.A.; Speth, E.B.; Ebert-May, D. Fostering ecoliteracy through model-based instruction. Front. Ecol. Environ. 2014, 12, 138–139. [Google Scholar] [CrossRef]
- McBride, B.B.; Brewer, C.A.; Berkowitz, A.R.; Borrie, W.T. Environmental literacy, ecological literacy, ecoliteracy: What do we mean and how did we get here? Ecosphere 2013, 4, 1–20. [Google Scholar] [CrossRef]
- Berkowitz, A.R.; Archie, M.; Simmons, D. Defining environmental literacy: A call for action. Bull. Ecol. Soc. Am. 1997, 78, 170–172. [Google Scholar]
- Orr, D. Ecological Literacy: Education and the Transition to a Postmodern World; Suny Press: Albany, NY, USA, 1992; Volume 131. [Google Scholar]
- Imperatives, S. Report of the World Commission on Environment and Development. In Our Common Future; Oxford University Press: Oxford, UK, 1987. [Google Scholar]
- Capra, F. LifeNet: A Critical Review/Essay of the Web of Life. 1997. Available online: https://www.researchgate.net/publication/342571999_LifeNet_A_Critical_ReviewEssay_of_THE_WEB_OF_LIFE (accessed on 30 January 2025).
- Gigliotti, M.; Schmidt-Traub, G.; Bastianoni, S. The sustainable development goals. In Encyclopedia of Ecology; Elsevier: Amsterdam, The Netherlands, 2018. [Google Scholar]
- Henriksen, H.Z.; Thapa, D.; Elbanna, A. Sustainable development goals in IS research. Scand. J. Inf. Syst. 2021, 33, 3. [Google Scholar]
- Agirreazkuenaga, L. Education for Agenda 2030: What Direction do We Want to Take Going Forward? Sustainability 2020, 12, 2035. [Google Scholar] [CrossRef]
- Gottlieb, D.; Vigoda-Gadot, E.; Haim, A.; Kissinger, M. The ecological footprint as an educational tool for sustainability: A case study analysis in an Israeli public high school. Int. J. Educ. Dev. 2012, 32, 193–200. [Google Scholar] [CrossRef]
- Kioupi, V.; Voulvoulis, N. Education for Sustainable Development: A Systemic Framework for Connecting the SDGs to Educational Outcomes. Sustainability 2019, 11, 6104. [Google Scholar] [CrossRef]
- Glavič, P. Identifying Key Issues of Education for Sustainable Development. Sustainability 2020, 12, 6500. [Google Scholar] [CrossRef]
- Schizas, D.; Psillos, D.; Papadopoulou, P. De-black-boxing learners: What is occurring in their minds when they answer multiple-choice questions that assess their understanding of biological concepts. Int. J. Environ. Sci. Educ. 2019, 14, 297–310. [Google Scholar]
- Almeida, B.; Santos, M.; Justi, R. Aspects and abilities of science literacy in the context of nature of science teaching. Sci. Educ. 2023, 32, 567–587. [Google Scholar] [CrossRef]
- Georgiou, Y.; Kyza, E.A. Fostering Chemistry Students’ Scientific Literacy for Responsible Citizenship through Socio-Scientific Inquiry-Based Learning (SSIBL). Sustainability 2023, 15, 6442. [Google Scholar] [CrossRef]
- Brehm, S. Ecology: A Teaching Module; Occasional Paper No. 94; The Institution for Research on Teaching: East Lansing, MI, USA, 1986. [Google Scholar]
- D’Avanzo, C. Application of Research on Learning to College Teaching: Ecological Examples. BioScience 2003, 53, 1121. [Google Scholar] [CrossRef]
- Gibson, D.J. Textbook Misconceptions: The climax concept of succession. Am. Biol. Teach. 1996, 58, 135–140. [Google Scholar]
- Munson, B.H. Ecological misconceptions. J. Environ. Educ. 1994, 25, 30–34. [Google Scholar]
- Brody, M.J.; Koch, H. An Assessment of 4th-, 8th-, and 11th-Grade Students’ Knowledge Related to Marine Science and Natural Resource Issues. J. Environ. Educ. 1990, 21, 16–26. [Google Scholar] [CrossRef]
- Gallegos, L.; Jerezano, M.E.; Flores, F. Preconceptions and relations used by children in the construction of food chains. J. Res. Sci. Teach. 1994, 31, 259–272. [Google Scholar]
- Griffiths, A.K.; Grant, B.A. High school students’ understanding of food webs: Identification of a learning hierarchy and related misconceptions. J. Res. Sci. Teach. 1985, 22, 421–436. [Google Scholar]
- Krebs, R.E. Scientific Development and Misconceptions Through the Ages: A reference Guide; Greenwood Publishing Group: Westport, CT, USA, 1999. [Google Scholar]
- McComas, W.F. The ideal environmental science curriculum: I. history, rationales, misconceptions & standards. Am. Biol. Teach. 2002, 64, 665–672. [Google Scholar]
- Adeniyi, E.O. Misconceptions of Selected Ecological Concepts Held by Some Nigerian Students. J. Biol. Educ. 1985, 19, 311–316. [Google Scholar]
- Brumby, M.N. Students’ perceptions of the concept of life. Sci. Educ. 1982, 66, 613–622. [Google Scholar] [CrossRef]
- Hogan, K. Assessing students’ systems reasoning in ecology. J. Biol. Educ. 2000, 35, 22–28. [Google Scholar] [CrossRef]
- Lancor, R.A. Using Student-Generated Analogies to Investigate Conceptions of Energy: A multidisciplinary study. Int. J. Sci. Educ. 2012, 36, 1–23. [Google Scholar]
- Leach, J.; Driver, R.; Scott, P.; Wood-Robinson, C. Children’s ideas about ecology 2: Ideas found in children aged 5–16 about the cycling of matter. Int. J. Sci. Educ. 1996, 18, 19–34. [Google Scholar]
- Opitz, S.T.; Blankenstein, A.; Harms, U. Student conceptions about energy in biological contexts. J. Biol. Educ. 2017, 51, 427–440. [Google Scholar]
- Wyner, Y.; Blatt, E. Connecting ecology to daily life: How students and teachers relate food webs to the food they eat. J. Biol. Educ. 2019, 53, 128–149. [Google Scholar]
- Métioui, A.; Matoussi, F.; Trudel, L. The teaching of photosynthesis in secondary school: A history of the science approach. J. Biol. Educ. 2016, 50, 275–289. [Google Scholar]
- Scaife, J.; Abdullah, A. Using Interviews to Assess Children’s Understanding of Science Concepts. Sch. Sci. Rev. 1997, 78, 79–84. [Google Scholar]
- Stavy, R. Material cycles in nature. A new approach to teaching photosynthesis in Junior High School. Am. Biol. Teach. 1992, 54, 339–342. [Google Scholar]
- Svandova, K. Secondary School Students’ Misconceptions about Photosynthesis and Plant Respiration: Preliminary Results. Eurasia J. Math. Sci. Technol. Educ. 2014, 10, 59–67. [Google Scholar] [CrossRef]
- Thorn, C.J.; Bissinger, K.; Thorn, S.; Bogner, F.X. “Trees Live on Soil and Sunshine!”- Coexistence of Scientific and Alternative Conception of Tree Assimilation. PLoS ONE 2016, 11, e0147802. [Google Scholar] [CrossRef]
- Soga, M.; Gaston, K.J. Extinction of experience: The loss of human–nature interactions. Front. Ecol. Environ. 2016, 14, 94–101. [Google Scholar] [CrossRef]
- Gray, S. Measuring systems thinking. Nat. Sustain. 2018, 1, 388–389. [Google Scholar]
- Leach, J.; Driver, R.; Scott, P.; Wood-Robinson, C. Children’s ideas about ecology 1: Theoretical background, design and methodology. Int. J. Sci. Educ. 1995, 17, 721–732. [Google Scholar]
- Leach, J.; Driver, R.; Scott, P.; Wood-Robinson, C. Children’s ideas about ecology 3: Ideas found in children aged 5–16 about the interdependency of organisms. Int. J. Sci. Educ. 1996, 18, 129–141. [Google Scholar]
- Hoskinson, A.-M.; Barger, N.N.; Martin, A. Keys to a Successful Student-Centered Classroom: Three Recommendations. Bull. Ecol. Soc. Am. 2014, 95, 281–292. [Google Scholar] [CrossRef]
- Burrow, A.K. Teaching introductory ecology with problem-based learning. Bull. Ecol. Soc. Am. 2018, 99, 137–150. [Google Scholar]
- Knapp, A.K.; D’Avanzo, C. Teaching with principles: Toward more effective pedagogy in ecology. Ecosphere 2010, 1, 1–10. [Google Scholar] [CrossRef]
- Méheut, M.; Psillos, D. Teaching–learning sequences: Aims and tools for science education research. Int. J. Sci. Educ. 2004, 26, 515–535. [Google Scholar] [CrossRef]
- Psillos, D.; Kariotoglou, P. Theoretical issues related to designing and developing teaching-learning sequences. In Iterative Design of Teaching-Learning Sequences: Introducing the Science of Materials in European Schools; Springer: Dordrecht, The Netherlands, 2016; pp. 11–34. [Google Scholar]
- Duit, R.; Gropengießer, H.; Kattmann, U.; Komorek, M.; Parchmann, I. The Model of Educational Reconstruction—A Framework for Improving Teaching and Learning Science. In Science Education Research and Practice in Europe; Jorde, D., Dillon, J., Eds.; Sense Publishers: Rotterdam, The Netherlands, 2012; pp. 13–37. [Google Scholar] [CrossRef]
- Hacking, I. The self-vindication of the laboratory sciences. In Science as Practice and Culture; University of Chicago Press: Chicago, IL, USA, 1992; Volume 30. [Google Scholar]
- Psillos, D.; Tselfes, V.; Kariotoglou, P. An epistemological analysis of the evolution of didactical activities in teaching–learning sequences: The case of fluids. Int. J. Sci. Educ. 2004, 26, 555–578. [Google Scholar] [CrossRef]
- Tselfes, V. A proposal for the teaching of the laboratory natural sciences based on its Ian Hacking approach of their “inner life”. In The Contribution of the History and Philosophy of Natural Sciences in Their Teaching Physical Sciences; PDPE: Athens, Greece, 2003; pp. 259–271. [Google Scholar]
- Kallery, M.; Psillos, D.; Tselfes, V. Typical Didactical Activities in the Greek Early-Years Science Classroom: Do they promote science learning? Int. J. Sci. Educ. 2009, 31, 1187–1204. [Google Scholar] [CrossRef]
- Cohen, L.; Manion, L.; Morrison, K. Research Methods in Education, 6th ed.; Routledge: Oxfordshire, UK, 2002. [Google Scholar]
- Gierl, M.J.; Bulut, O.; Guo, Q.; Zhang, X. Developing, Analyzing, and Using Distractors for Multiple-Choice Tests in Education: A Comprehensive Review. Rev. Educ. Res. 2017, 87, 1082–1116. [Google Scholar] [CrossRef]
- Zeidner, M. Essay versus multiple-choice type classroom exams: The student’s perspective. J. Educ. Res. 1987, 80, 352–358. [Google Scholar] [CrossRef]
- Butler, A.C. Multiple-choice testing in education: Are the best practices for assessment also good for learning? J. Appl. Res. Mem. Cogn. 2018, 7, 323–331. [Google Scholar] [CrossRef]
- Ahmed, M.M.; James, W.; Marie, T. An assessment of functioning and non-functioning distractors in multiple-choice questions: A descriptive analysis. BMC Med. Educ. 2009, 9, 40. [Google Scholar]
- Moreno, R.; Martínez, R.; Muñiz, J. Guidelines based on validity criteria for the development of multiple choice items. Psicothema 2015, 4, 388–394. [Google Scholar] [CrossRef]
- Rodriguez, M.C. Selected-response item development. In Handbook of Test Development; Routledge: Oxfordshire, UK, 2015; pp. 259–273. [Google Scholar]
- Lavoie, D. Using a modified concept mapping strategy to identify students’ alternative scientific understandings of biology. In Proceedings of the Annual Meeting of the National Association for Research in Science Teaching, Chicago, IL, USA, 24–28 March 1997; pp. 21–24. [Google Scholar]
- Sada, A.N.; Maldonado, A. Research Methods in Education. Sixth Edition–By Louis Cohen, Lawrence Manion and Keith Morrison. Br. J. Educ. Stud. 2007, 55, 469–470. [Google Scholar] [CrossRef]
- Krathwohl, D.R. A Revision of Bloom’s Taxonomy: An Overview. Theory Pract. 2002, 41, 212–218. [Google Scholar] [CrossRef]
- Momsen, J.L.; Long, T.M.; Wyse, S.A.; Ebert-May, D. Just the facts? Introductory undergraduate biology courses focus on low-level cognitive skills. CBE—Life Sci. Educ. 2010, 9, 435–440. [Google Scholar]
- Grotzer, T.A.; Basca, B.B. How does grasping the underlying causal structures of ecosystems impact students’ understanding? J. Biol. Educ. 2003, 38, 16–29. [Google Scholar] [CrossRef]
- Eilam, B. System thinking and feeding relations: Learning with a live ecosystem model. Instr. Sci. 2012, 40, 213–239. [Google Scholar]
- Sinha, S.; Gray, S.; Hmelo-Silver, C.E.; Jordan, R.; Eberbach, C.; Goel, A.; Rugaber, S. Conceptual representations for transfer: A case study tracing back and looking forward. Frontline Learn. Res. 2013, 1, 3–23. [Google Scholar] [CrossRef]
- Jordan, R.C.; Brooks, W.R.; Hmelo-Silver, C.; Eberbach, C.; Sinha, S. Balancing broad ideas with context: An evaluation of student accuracy in describing ecosystem processes after a system-level intervention. J. Biol. Educ. 2014, 48, 57–62. [Google Scholar]
- Hmelo-Silver, C.E.; Jordan, R.; Eberbach, C.; Sinha, S. Systems learning with a conceptual representation: A quasi-experimental study. Instr. Sci. 2017, 45, 53–72. [Google Scholar] [CrossRef]
- Agouridis, C.T.; Sanderson, T.M. Understanding Ecosystems and Their Services Through Apollo 13 and Bottle Models. In Learner-Centered Teaching Activities for Environmental and Sustainability Studies; Springer: Cham, Switzerland, 2016; pp. 89–96. [Google Scholar]
- Kinslow, A.T.; Sadler, T.D.; Nguyen, H.T. Socio-scientific reasoning and environmental literacy in a field-based ecology class. Environ. Educ. Res. 2019, 25, 388–410. [Google Scholar] [CrossRef]
- Redman, A.; Wiek, A. Competencies for Advancing Transformations Towards Sustainability. Front. Educ. 2021, 6, 785163. [Google Scholar] [CrossRef]
- Eberbach, C.; Hmelo-Silver, C.E.; Jordan, R.; Taylor, J.; Hunter, R. Multidimensional trajectories for understanding ecosystems. Sci. Educ. 2021, 105, 521–540. [Google Scholar]


| Representational | I → E | Linking Ideas with expected Evidence. Predictions of Evidence based on one’s own ideas. |
| E → I | Linking Evidence with Ideas. Explaining specific Evidence in terms of some specific Ideas. These Ideas can be scientific or common. | |
| C→ E | Linking a piece of Cosmos with a piece of Evidence. Descriptions of what is happening in Cosmos in terms of observed or recalled Evidence. | |
| Interventional | E → C | Linking Evidence with a piece of Cosmos. Constructing, intervening, or modifying a specific segment of the material world on the basis of a specific piece of evidence. |
| I → C | Linking Ideas with Cosmos. Interventions in the material world. Using scientific ideas, construct a piece of Cosmos with specific characteristics. | |
| Representational | C → I | Linking Cosmos with Ideas. Describing a piece of Cosmos on the basis of one’s own Ideas. |
| TLS 1 | Pre | Post | Change | ||||||
|---|---|---|---|---|---|---|---|---|---|
| Mean | SD | Shapiro–Wilk’ s | Mean | SD | Shapiro–Wilk’ s | Mean | SD | Shapiro–Wilk’ s | |
| Total sum | 6.65 | 3.408 | 0.371 | 7.29 | 3.177 | 0.784 | 0.65 | 3.673 | 0.649 |
| Sum 1–8 | 3.29 | 1.572 | 0.703 | 4.29 | 2.054 | 0.155 | 1 | 1.768 | 0.432 |
| Sum 9 | 3.35 | 2.644 | 0.126 | 3 | 2.424 | 0.024 | −0.35 | 2.999 | 0.022 |
| TLS 2 | Pre | Post | Change | ||||||
|---|---|---|---|---|---|---|---|---|---|
| Mean | SD | Shapiro–Wilk’ s | Mean | SD | Shapiro–Wilk’ s | Mean | SD | Shapiro–Wilk’ s | |
| Total sum | 7.78 | 3.282 | 0.437 | 9.94 | 2.388 | 0.464 | 2.17 | 2.149 | 0.576 |
| Sum 1–8 | 3.61 | 2.062 | 0.717 | 5.72 | 1.406 | 0.139 | 2.11 | 1.641 | 0.230 |
| Sum 9 | 4.17 | 2.282 | 0.148 | 4.22 | 1.833 | 0.600 | 0.06 | 1.474 | 0.426 |
| TLS 1 | TLS 2 | |||
|---|---|---|---|---|
| Frequency | Percent | Frequency | Percent | |
| Stable | 2 | 11.1 | 2 | 11.1 |
| Decrease | 5 | 27.8 | 0 | 0 |
| Increase | 11 | 61.1 | 16 | 88.9 |
| Total | 18 | 100.0 | 18 | 100.0 |
| TLS 1 | TLS 2 | |||
|---|---|---|---|---|
| Frequency | Percent | Frequency | Percent | |
| Stable | 8 | 44.4 | 6 | 33.3 |
| Decrease | 5 | 27.8 | 5 | 27.8 |
| Increase | 5 | 27.8 | 7 | 38.9 |
| Total | 18 | 100 | 18 | 100 |
| Answer Groups | Answer Category | Number of Students–TLS 1 | |||
|---|---|---|---|---|---|
| Pre | Post | ||||
| Limitation of activities | Limiting the killing of animals | 13 | 34 | 12 | 22 |
| Pollution control | 7 | 3 | |||
| Reducing fires | 4 | 2 | |||
| Not destroying their homes | 8 | 3 | |||
| Changing consumption and food habits | 2 | 1 | |||
| Restricting logging | 0 | 1 | |||
| Taking action | Human care (e.g., feeding them, making them houses, parks, and breeding them) | 5 | 8 | 6 | 7 |
| Informing people about the value of biodiversity | 0 | 1 | |||
| Tree planting | 1 | 0 | |||
| Strict laws | 1 | 0 | |||
| Recycling | 1 | 0 | |||
| Answer Groups | Answer Category | Number of Students—TLS 2 | |||
|---|---|---|---|---|---|
| Pre | Post | ||||
| Limitation of activities | Restriction of hunting—fishing | 12 | 33 | 10 | 19 |
| Pollution control | 9 | 4 | |||
| Restriction of logging | 3 | 0 | |||
| Reducing fires | 2 | 3 | |||
| Reducing product consumption | 3 | 2 | |||
| Limiting energy consumption | 4 | 0 | |||
| Taking action | Characterization of protected areas | 0 | 12 | 4 | 9 |
| Creating places of care (e.g., national parks) | 6 | 2 | |||
| Use of renewable energy sources | 1 | 0 | |||
| Recycling | 0 | 1 | |||
| Information on the value of biodiversity (seminars or media) | 3 | 0 | |||
| Tree planting | 0 | 2 | |||
| Strict environmental protection laws | 2 | 0 | |||
Disclaimer/Publisher’s Note: The statements, opinions and data contained in all publications are solely those of the individual author(s) and contributor(s) and not of MDPI and/or the editor(s). MDPI and/or the editor(s) disclaim responsibility for any injury to people or property resulting from any ideas, methods, instructions or products referred to in the content. |
© 2025 by the authors. Licensee MDPI, Basel, Switzerland. This article is an open access article distributed under the terms and conditions of the Creative Commons Attribution (CC BY) license (https://creativecommons.org/licenses/by/4.0/).
Share and Cite
Ntinolazou, C.; Papadopoulou, P. An Effort to Strengthen the Objectives of Education for Sustainable Development, Based on the Use of the Cosmos–Evidence–Ideas Model. Sustainability 2025, 17, 3212. https://doi.org/10.3390/su17073212
Ntinolazou C, Papadopoulou P. An Effort to Strengthen the Objectives of Education for Sustainable Development, Based on the Use of the Cosmos–Evidence–Ideas Model. Sustainability. 2025; 17(7):3212. https://doi.org/10.3390/su17073212
Chicago/Turabian StyleNtinolazou, Christina, and Penelope Papadopoulou. 2025. "An Effort to Strengthen the Objectives of Education for Sustainable Development, Based on the Use of the Cosmos–Evidence–Ideas Model" Sustainability 17, no. 7: 3212. https://doi.org/10.3390/su17073212
APA StyleNtinolazou, C., & Papadopoulou, P. (2025). An Effort to Strengthen the Objectives of Education for Sustainable Development, Based on the Use of the Cosmos–Evidence–Ideas Model. Sustainability, 17(7), 3212. https://doi.org/10.3390/su17073212