


Multi-Scenario Simulation of Land Use Change and Ecosystem Health Assessment in Chengdu Metropolitan Area Based on SD-PLUS-VORS Coupled Modeling


Abstract
1. Introduction
2. Materials and Methods
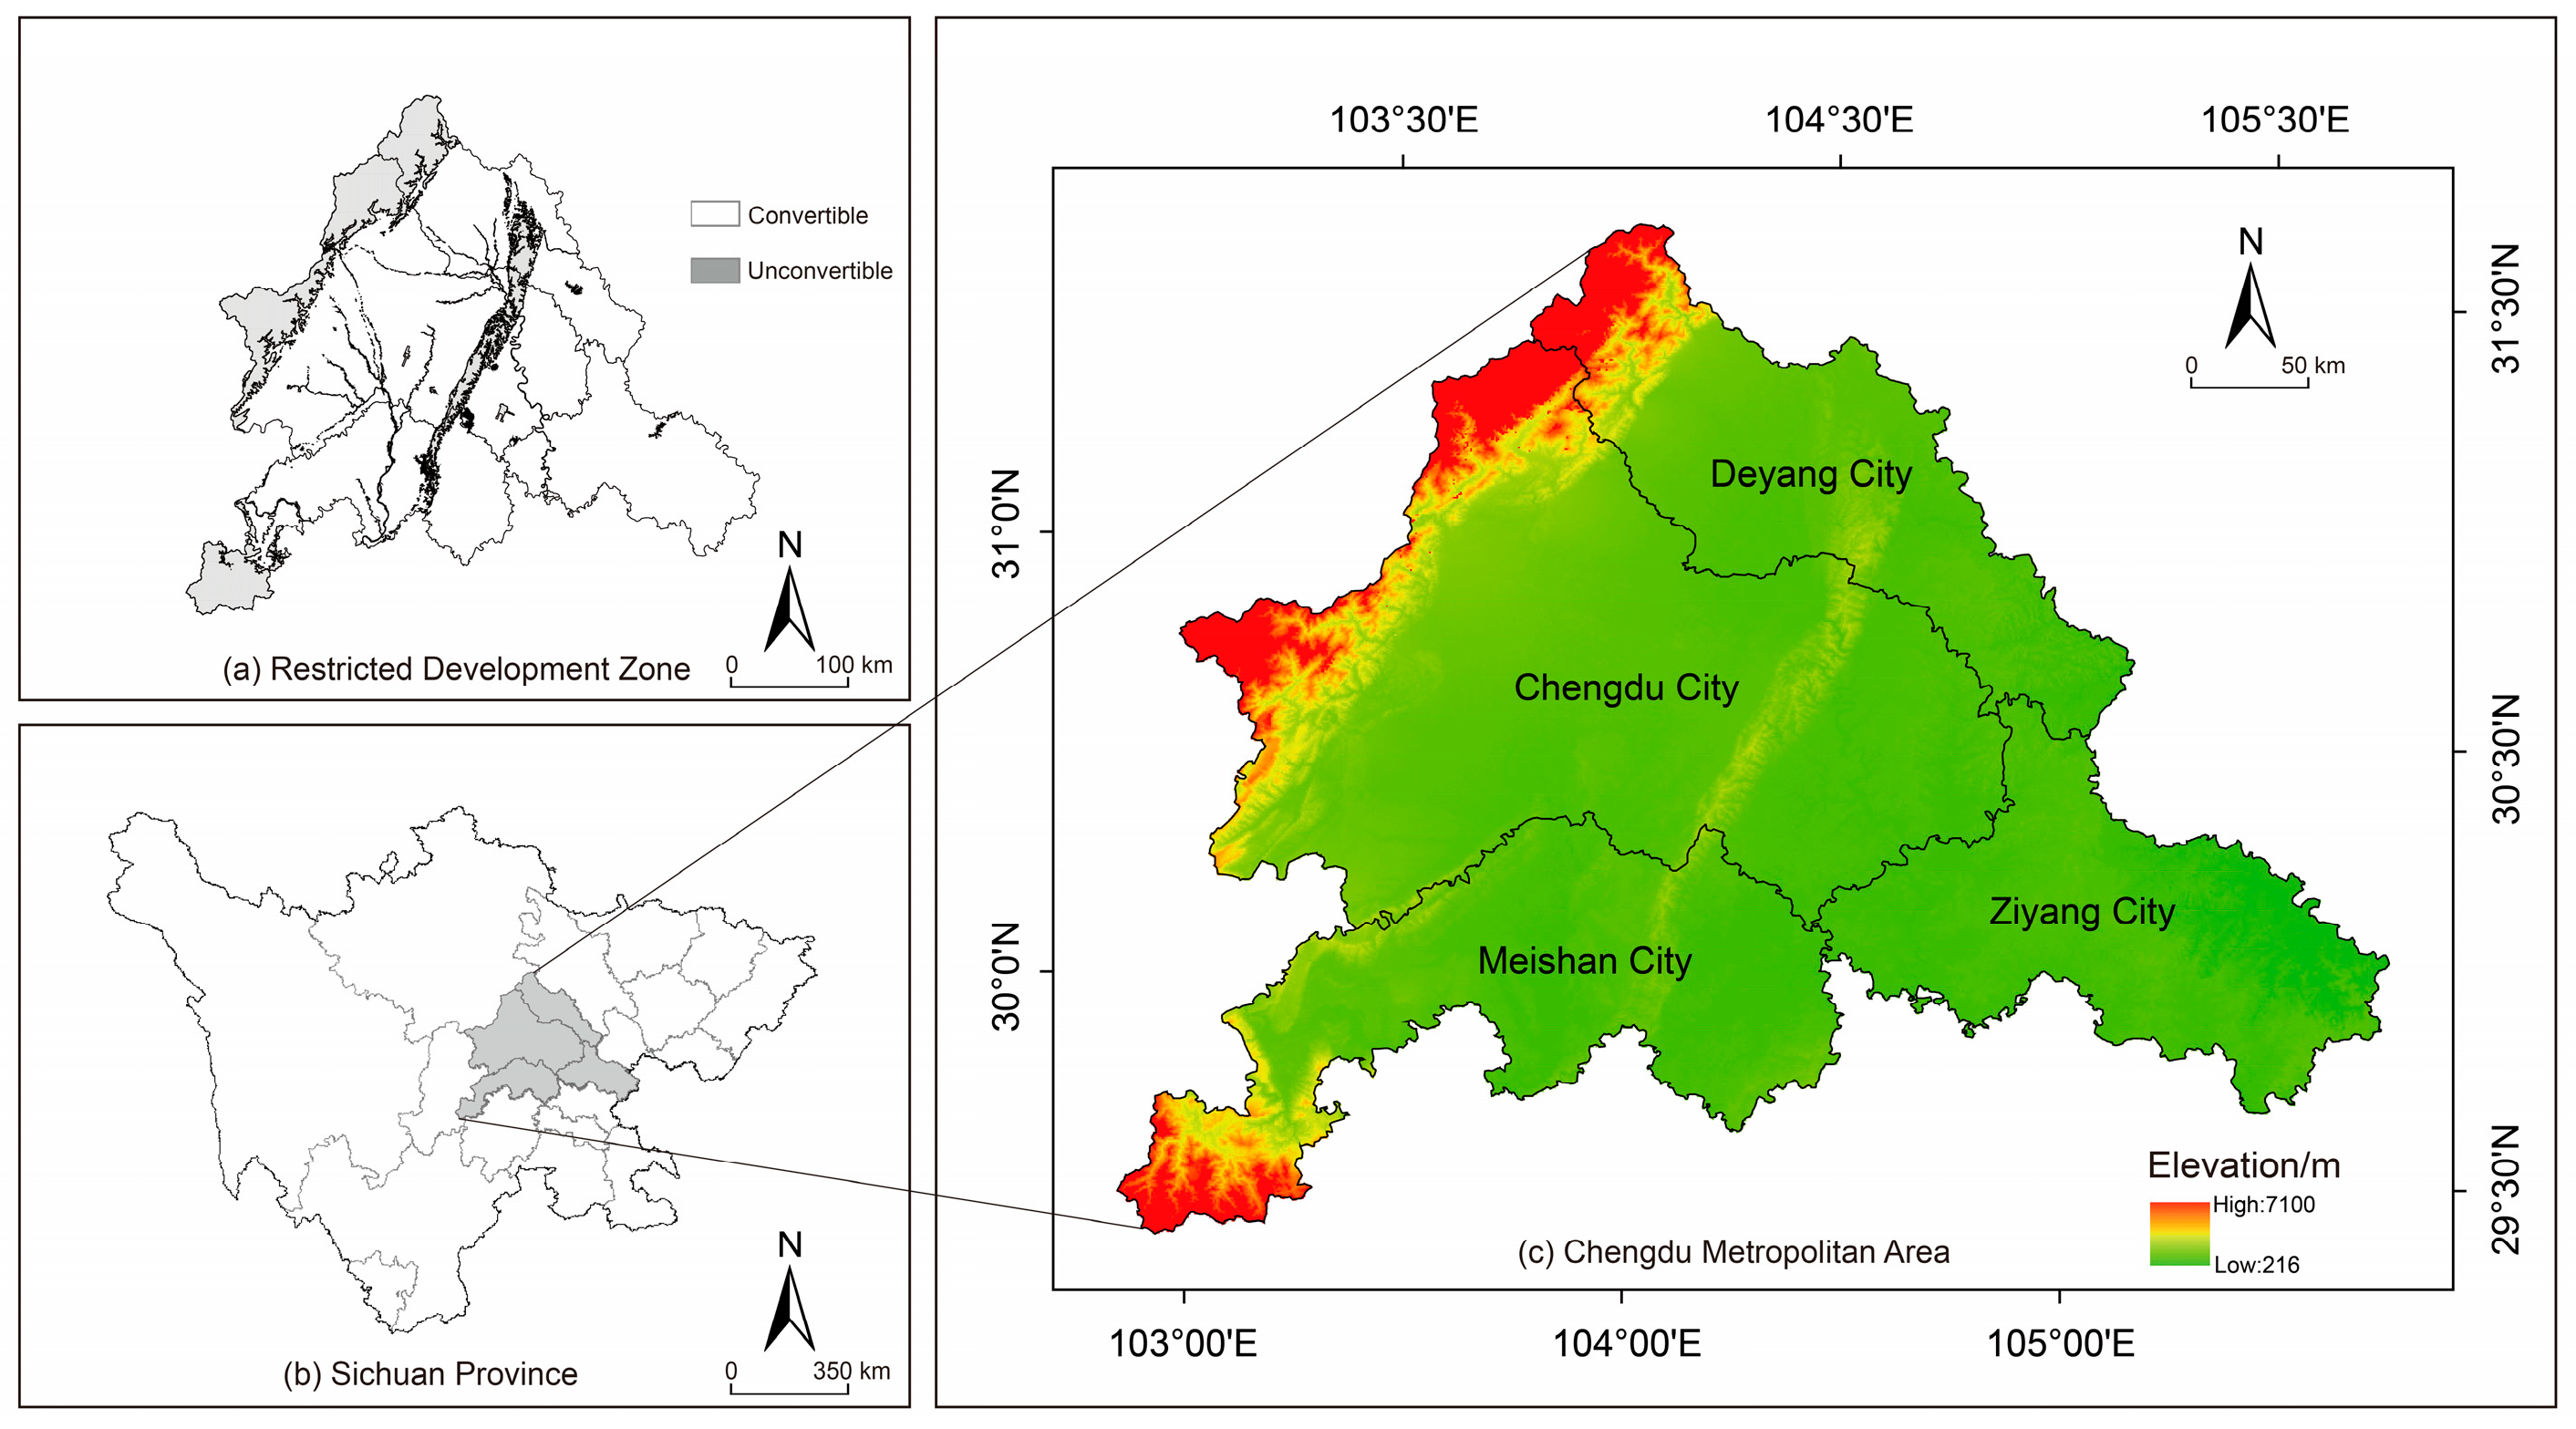
2.1. Study Area
2.2. Data Acquisition and Processing
2.3. Methods
2.3.1. Scenario Setting
- EPS (ecological protection scenario): This scenario prioritizes the containment of urban sprawl. It focuses on the creation of an ecological conservation-centered land protection system, the enforcement of stringent ecological land protection policies, and increased ecological management investment. In accordance with the Chengdu Metropolitan Circle Territorial Spatial Plan (2021–2035), stringent restrictions are imposed on the transformation of ecological land for urban development.
- NDS (natural development scenario): Based on the trend of socioeconomic shifts in the CMA between 2005 and 2020, this scenario presumes no new economic or environmental policy interventions and continues the land use transfer patterns witnessed during this period. The projected land demand, therefore, represents the organic progression of change in the CMA.
- EDS (economic development scenario): Unregulated urban expansion and a completely open population policy have spurred rapid population increases in the CMA, exacerbating competition for land resources. Therefore, land demand has transformed under extensive use.
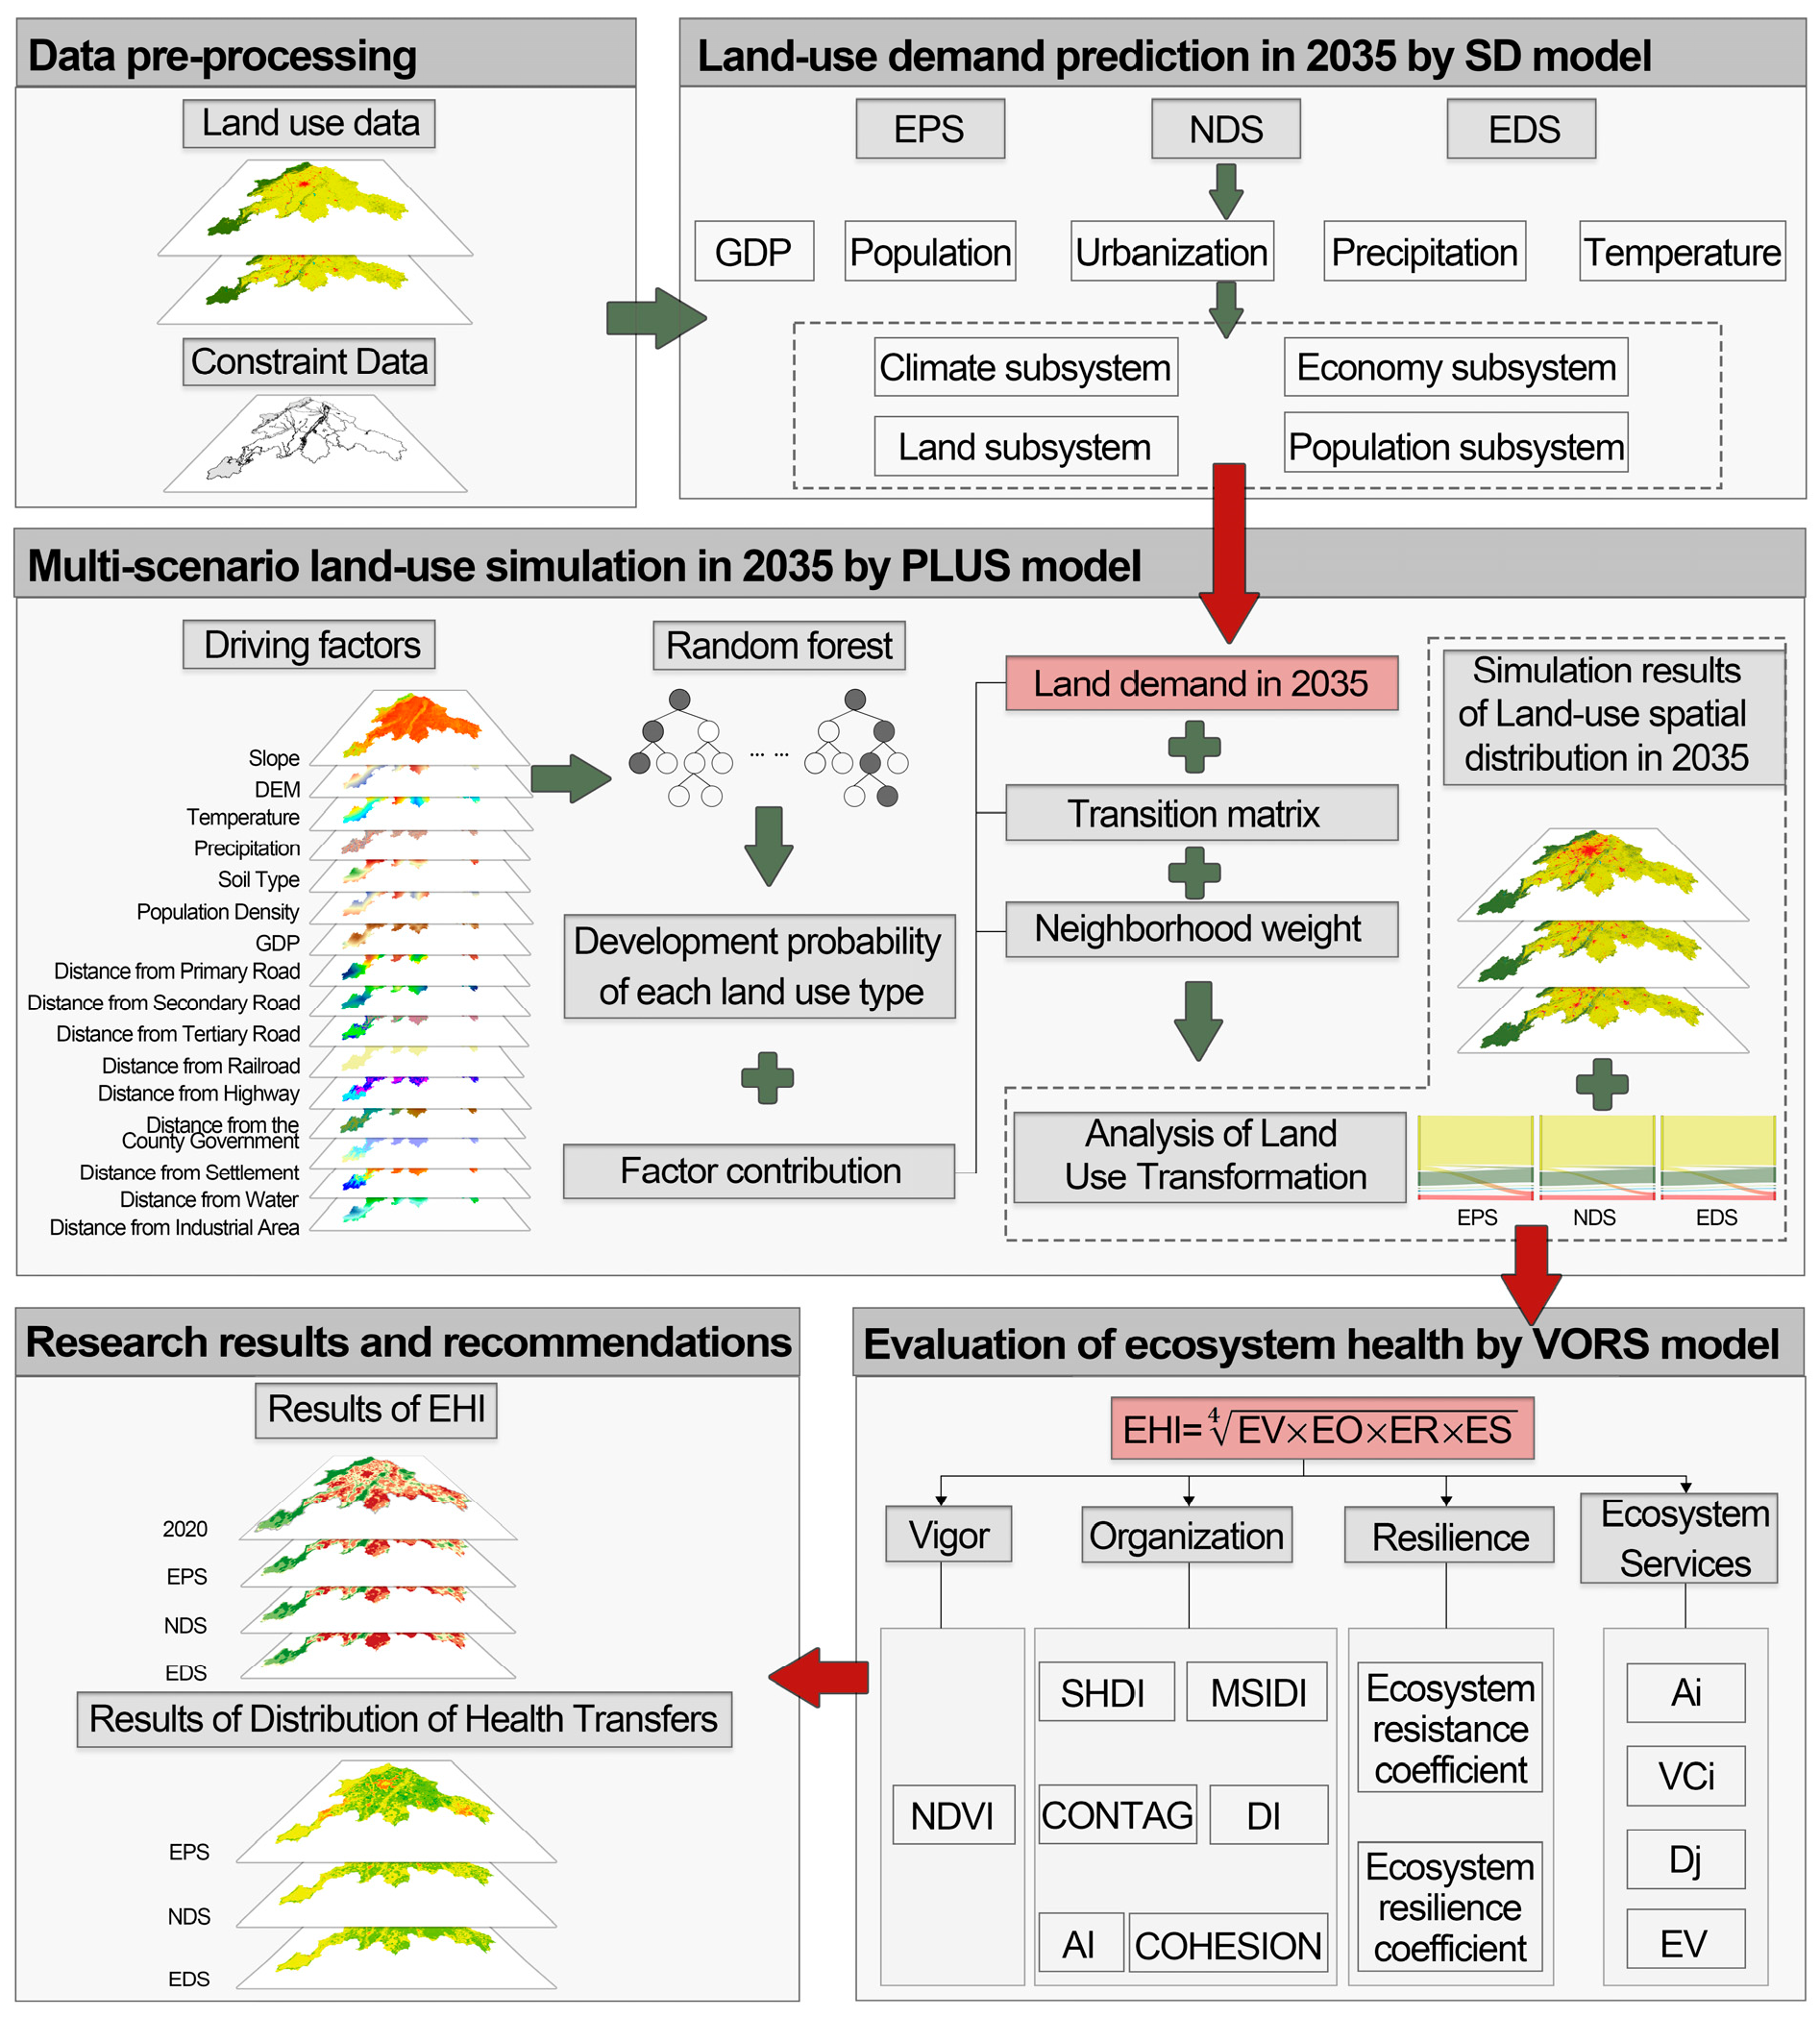
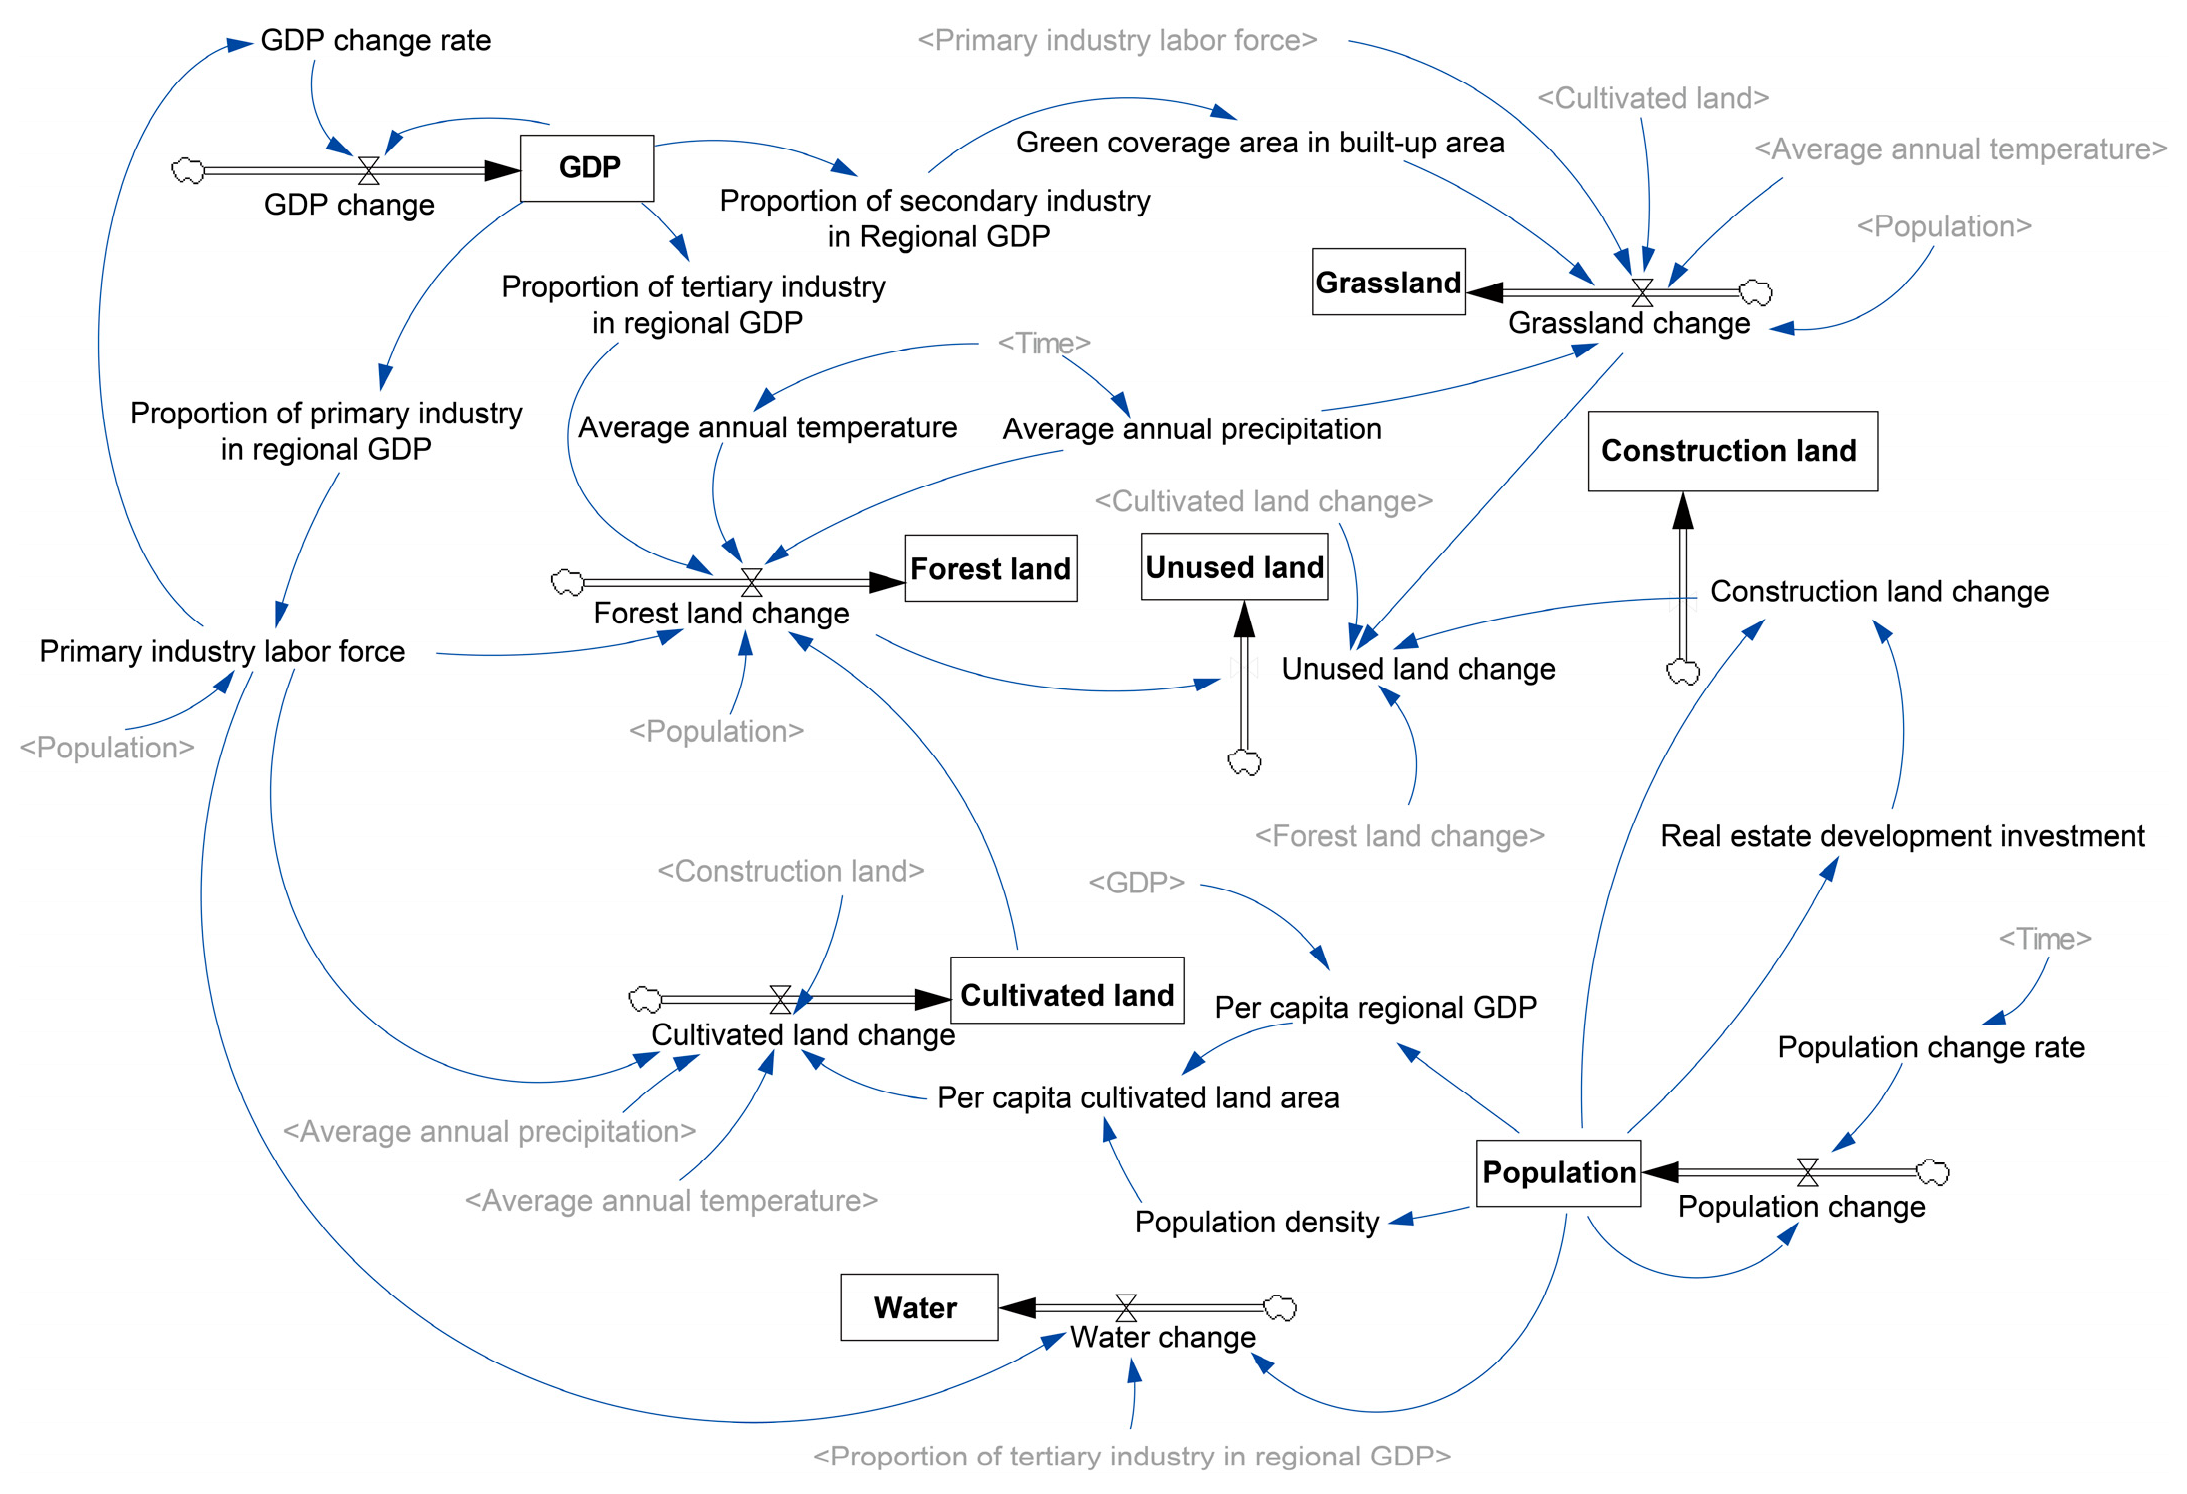
2.3.2. Development of an SD Model for Quantitative Land Demand Forecasting
2.3.3. Spatiotemporal Changes in Land Use Across Multiple Scenarios Using the PLUS Model
2.3.4. Evaluation of Ecosystem Health Utilizing the VORS Model
- 1.
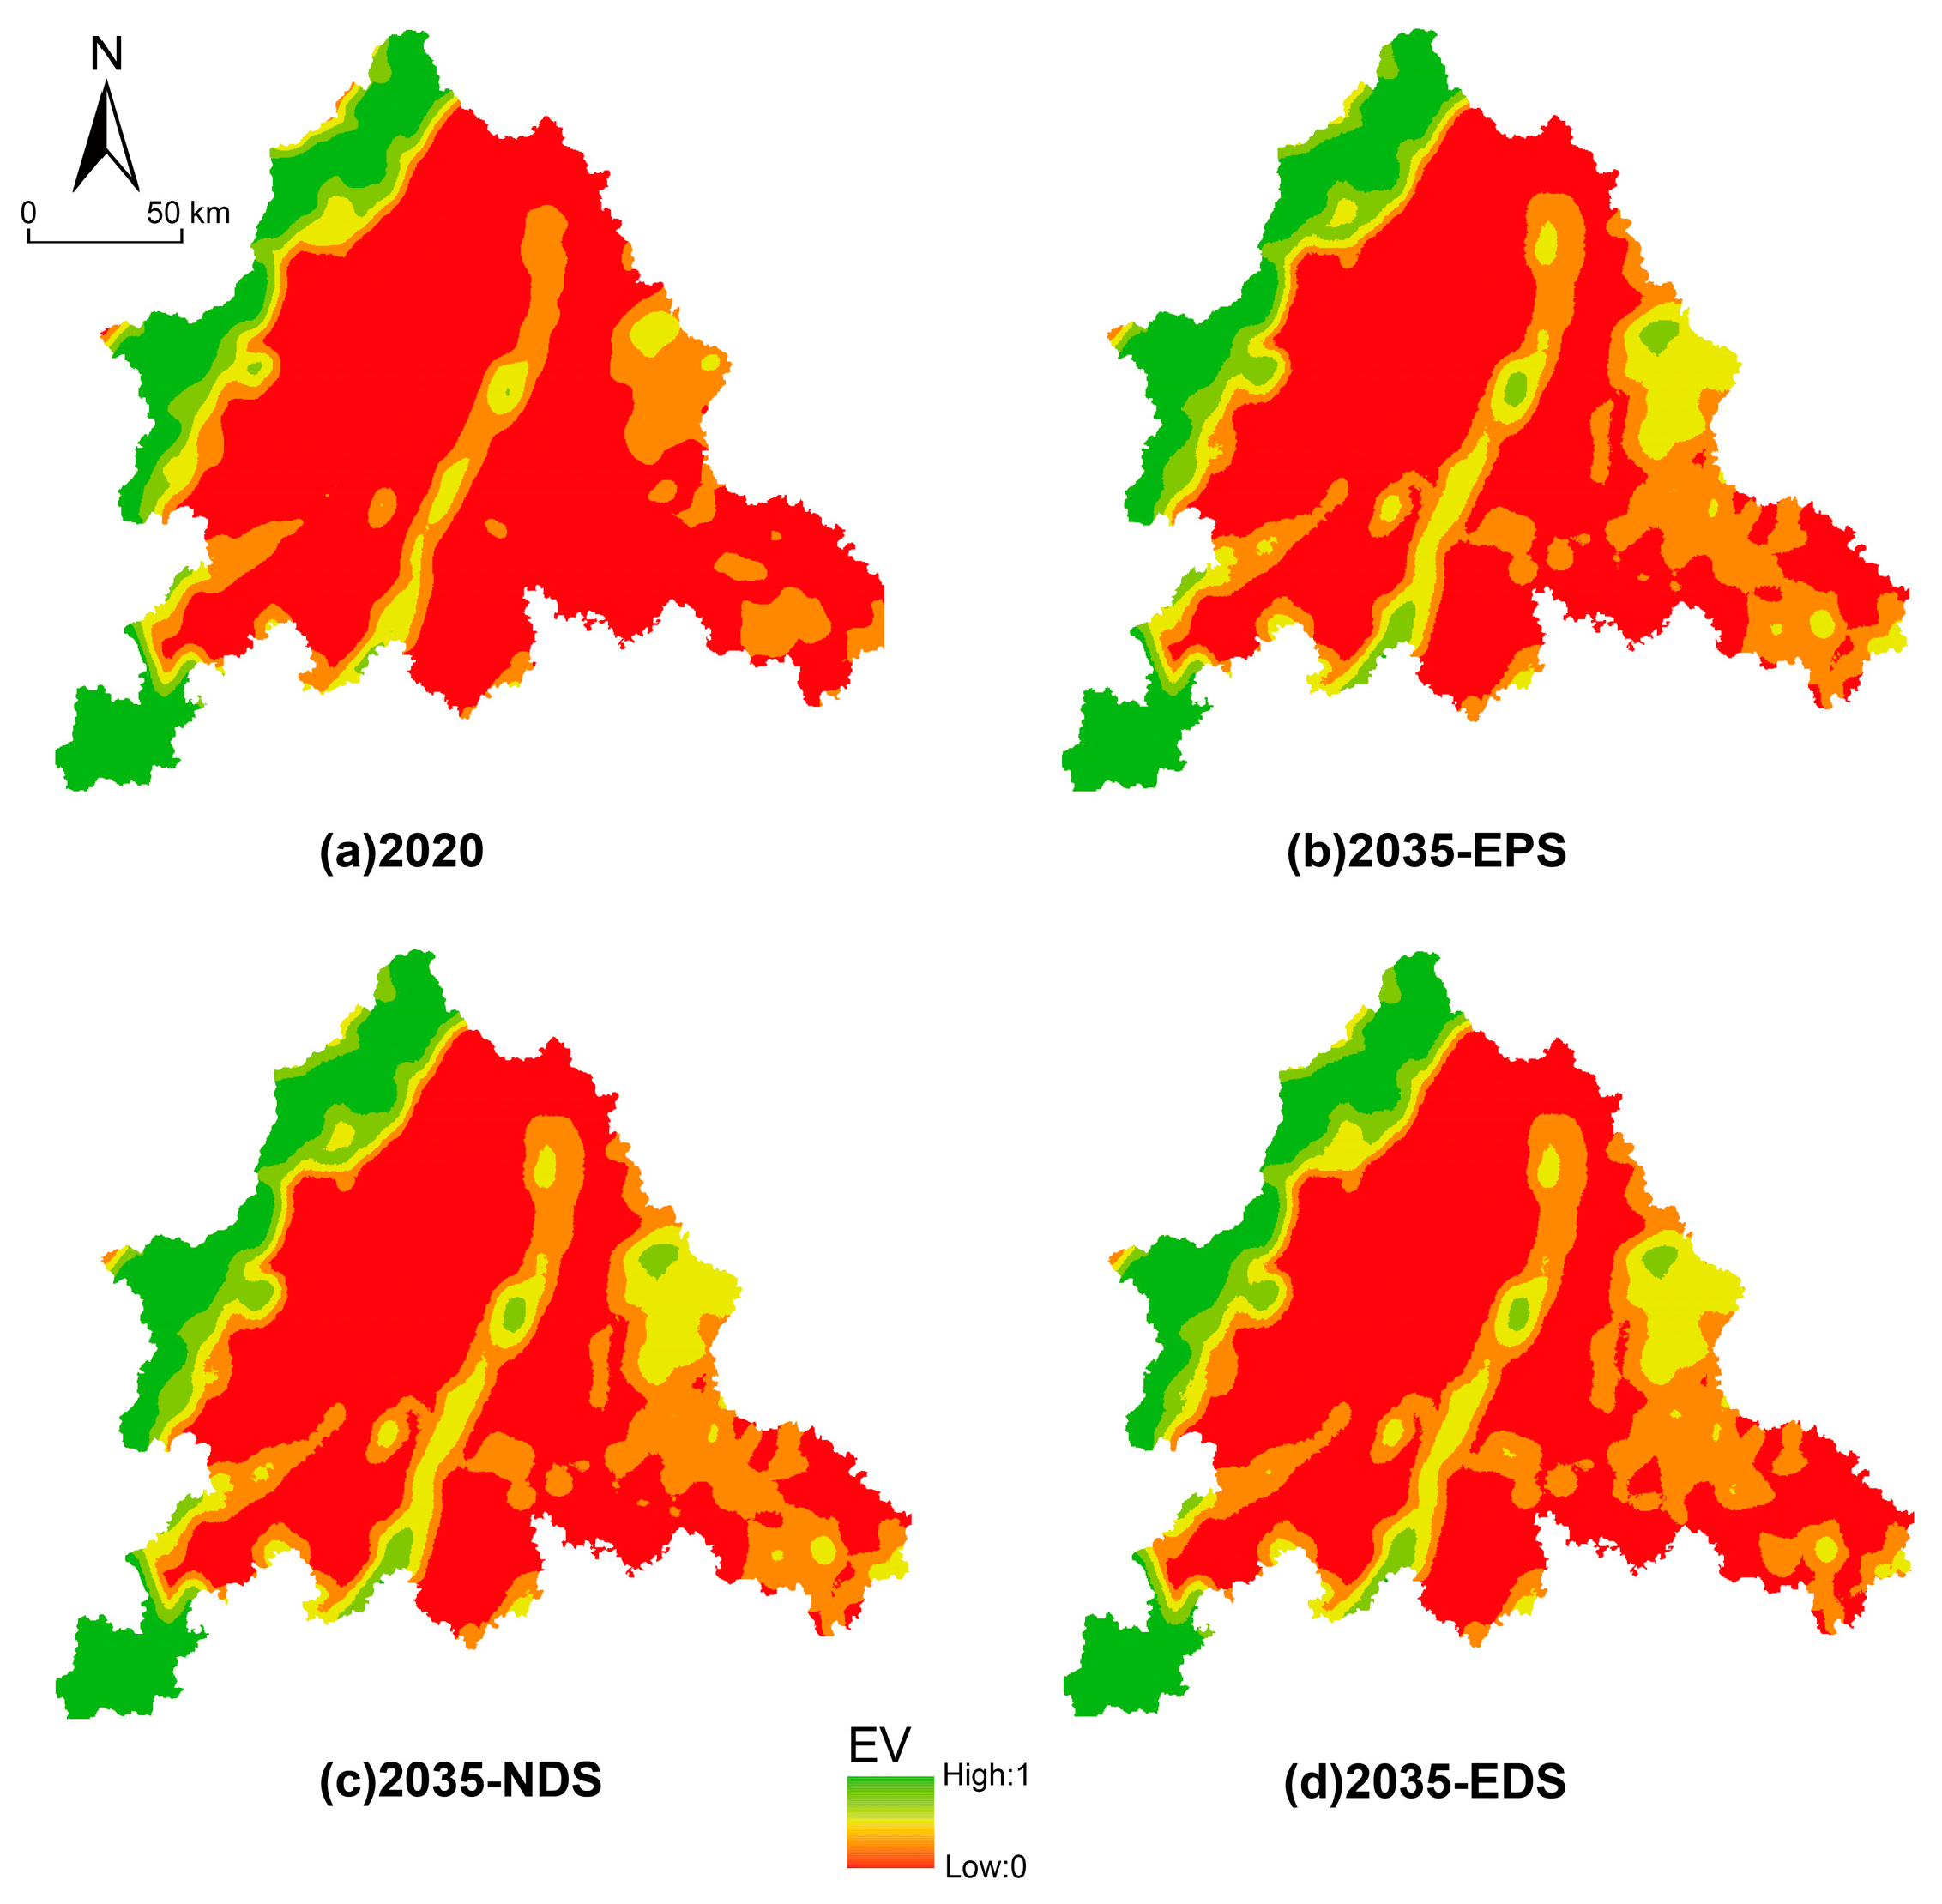
- Ecosystem Vigor (EV): This concept typically denotes the metabolic efficiency or the fundamental productivity of a specific ecosystem. According to previous research, the Normalized Difference Vegetation Index (NDVI) is a reliable indicator of ecosystem vigor [38]. Therefore, the current paper utilizes NDVI to express regional ecosystem vigor.
- 2.
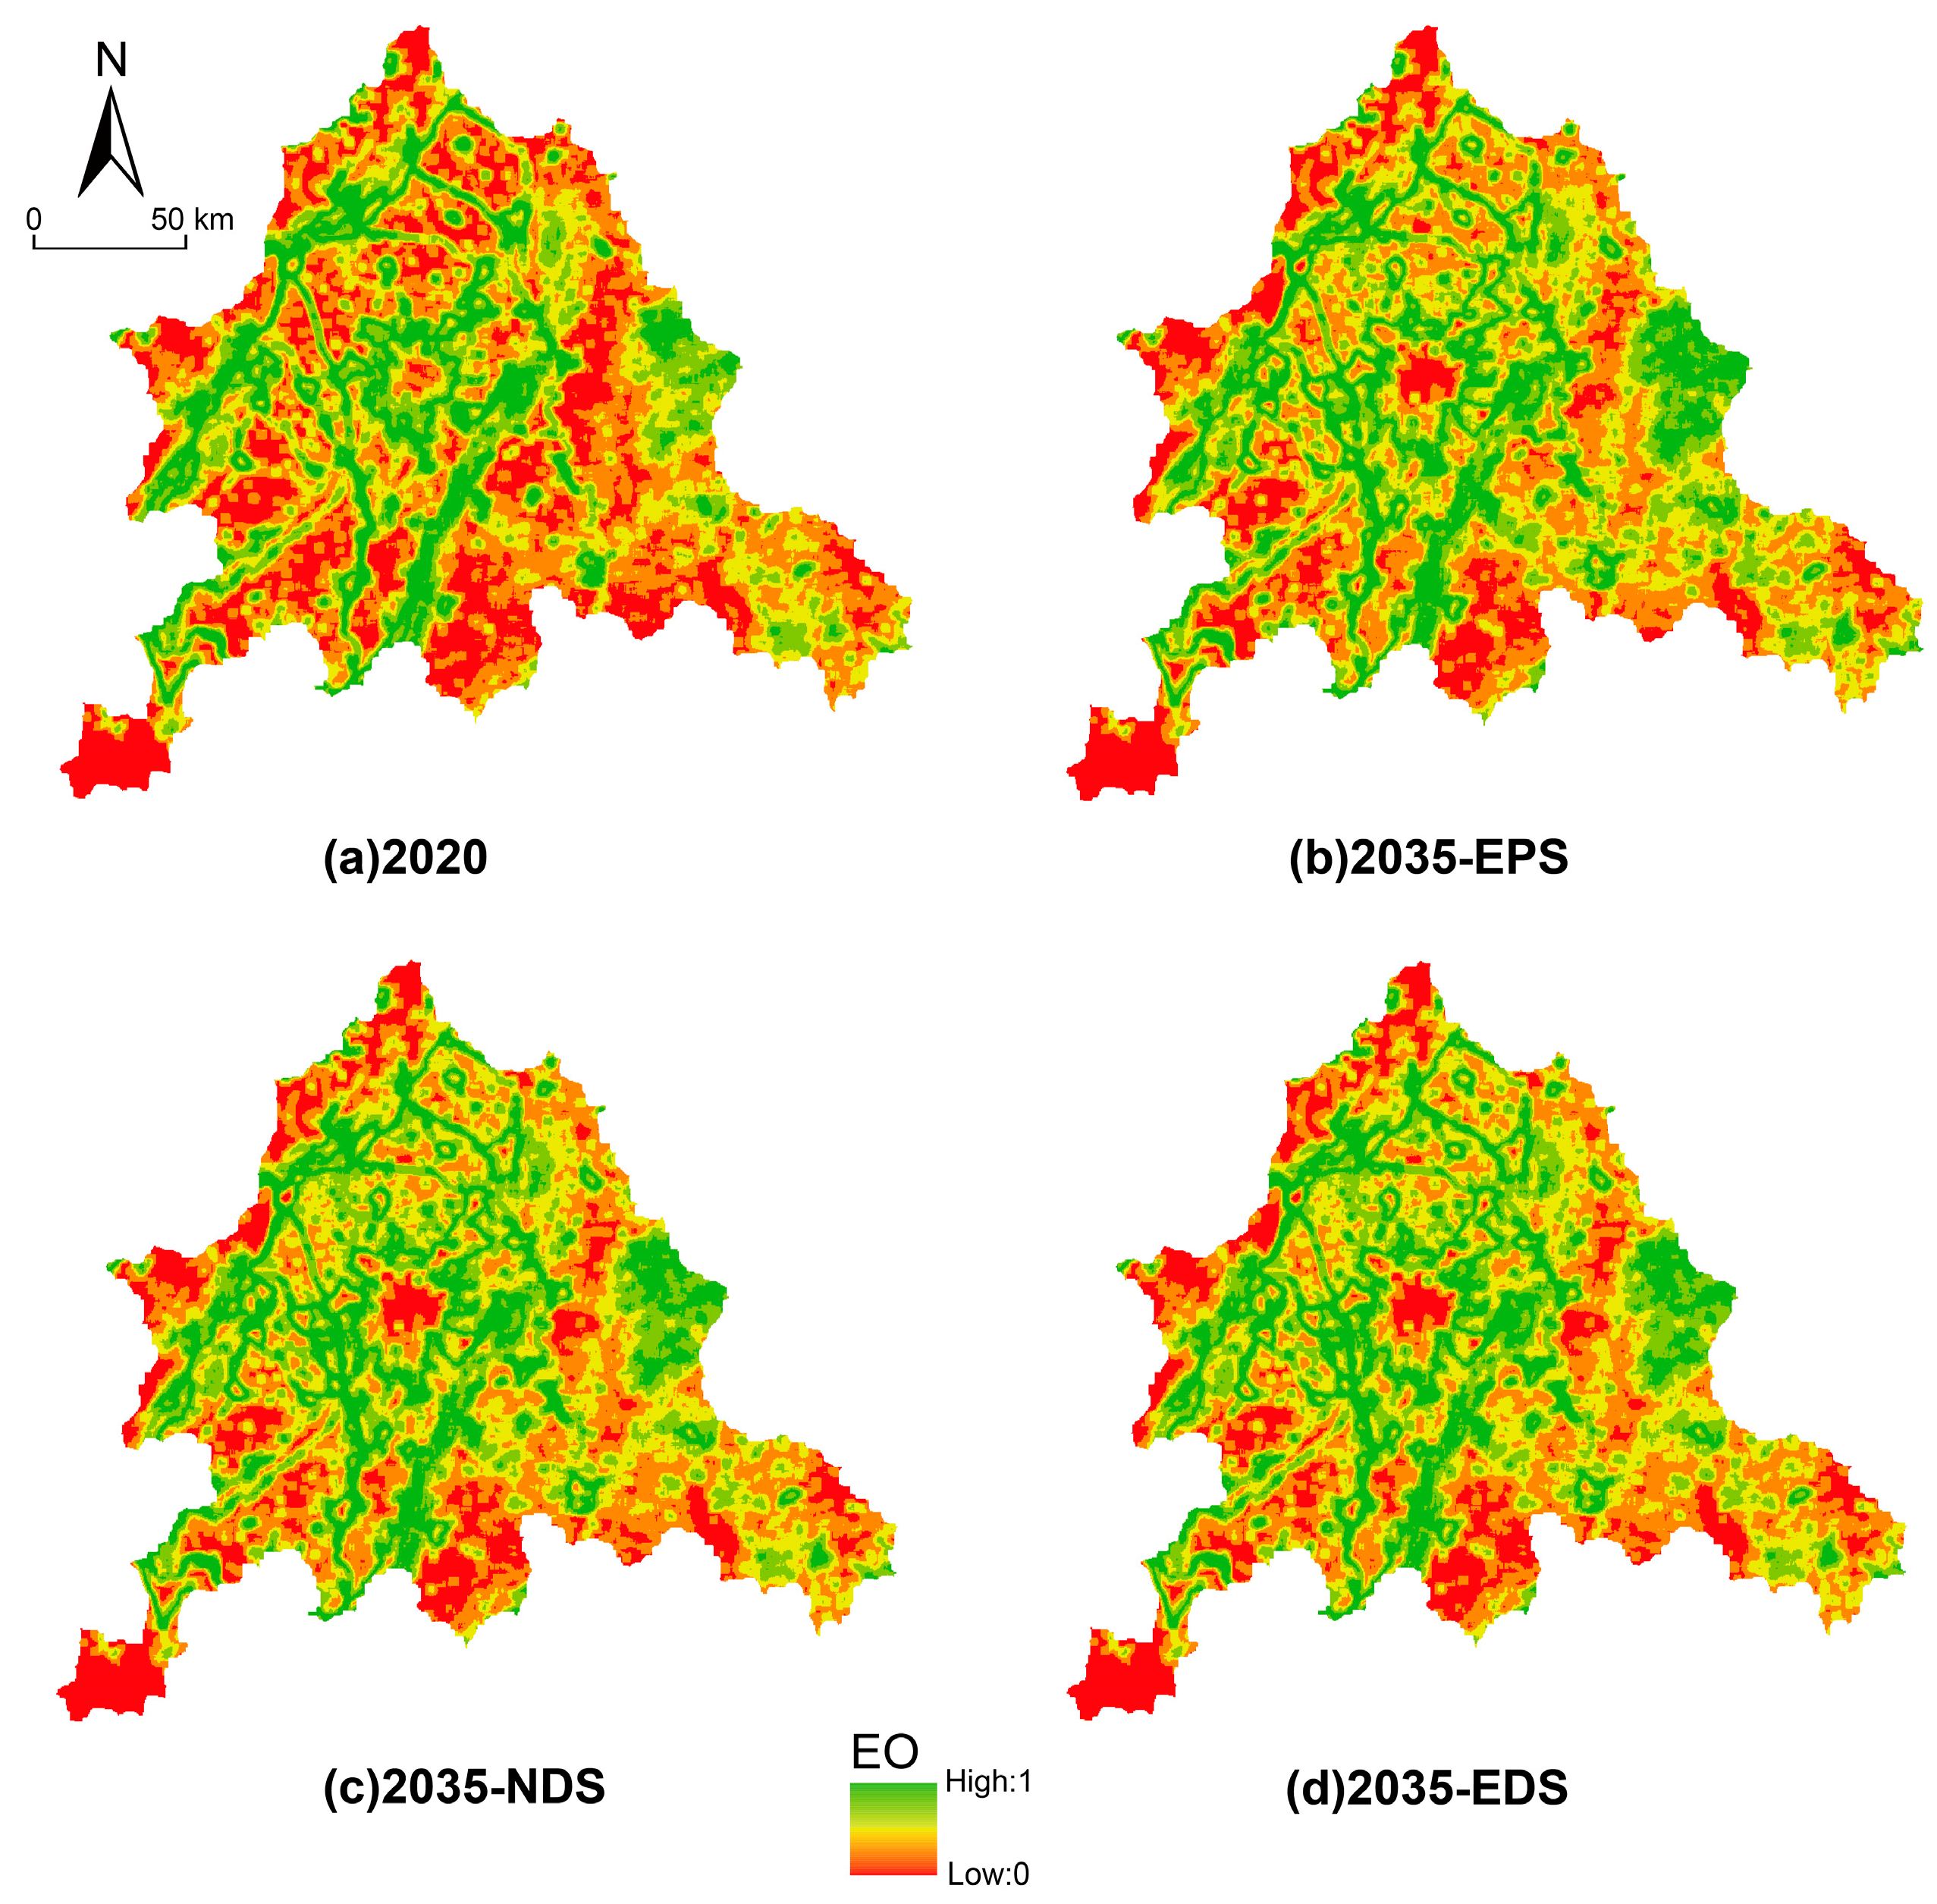
- Ecosystem Organization (EO): This concept describes an ecosystem’s ability to remain stable when subjected to anthropogenic pressures [15,47]. Ecosystem organization is often defined by measures of landscape heterogeneity (LH), landscape connectivity (LC), and critical ecosystem connectivity (CEC). The SHDI [2] and modified Simpson diversity index [44] represent common metrics for measuring LH. The contagion index and landscape division index evaluate LC [48], while the aggregation index and patch cohesion index assess CEC [2]. Each component of the landscape structure index exerts a specific influence on ecosystem function, and this influence is quantifiable through weighted contributions in the assessment framework. Considering the unique and non-fungible contributions of LH, LC, and CEC to overall ecosystem health, these factors were assigned specific weights. Here, LH and LC were each given a weight of 0.35 [49]. The effect of critical ecosystem connectivity is comparatively smaller, which leads to a weight assignment of 0.3 [24,37]. The weighting scheme employed for each variable is informed by the existing literature [47,50], and the specific equation is detailed below:
(0.2 × CONTAG + 0.15 × DI) + (0.15 × AI + 0.15 × COHESION)
- 3.
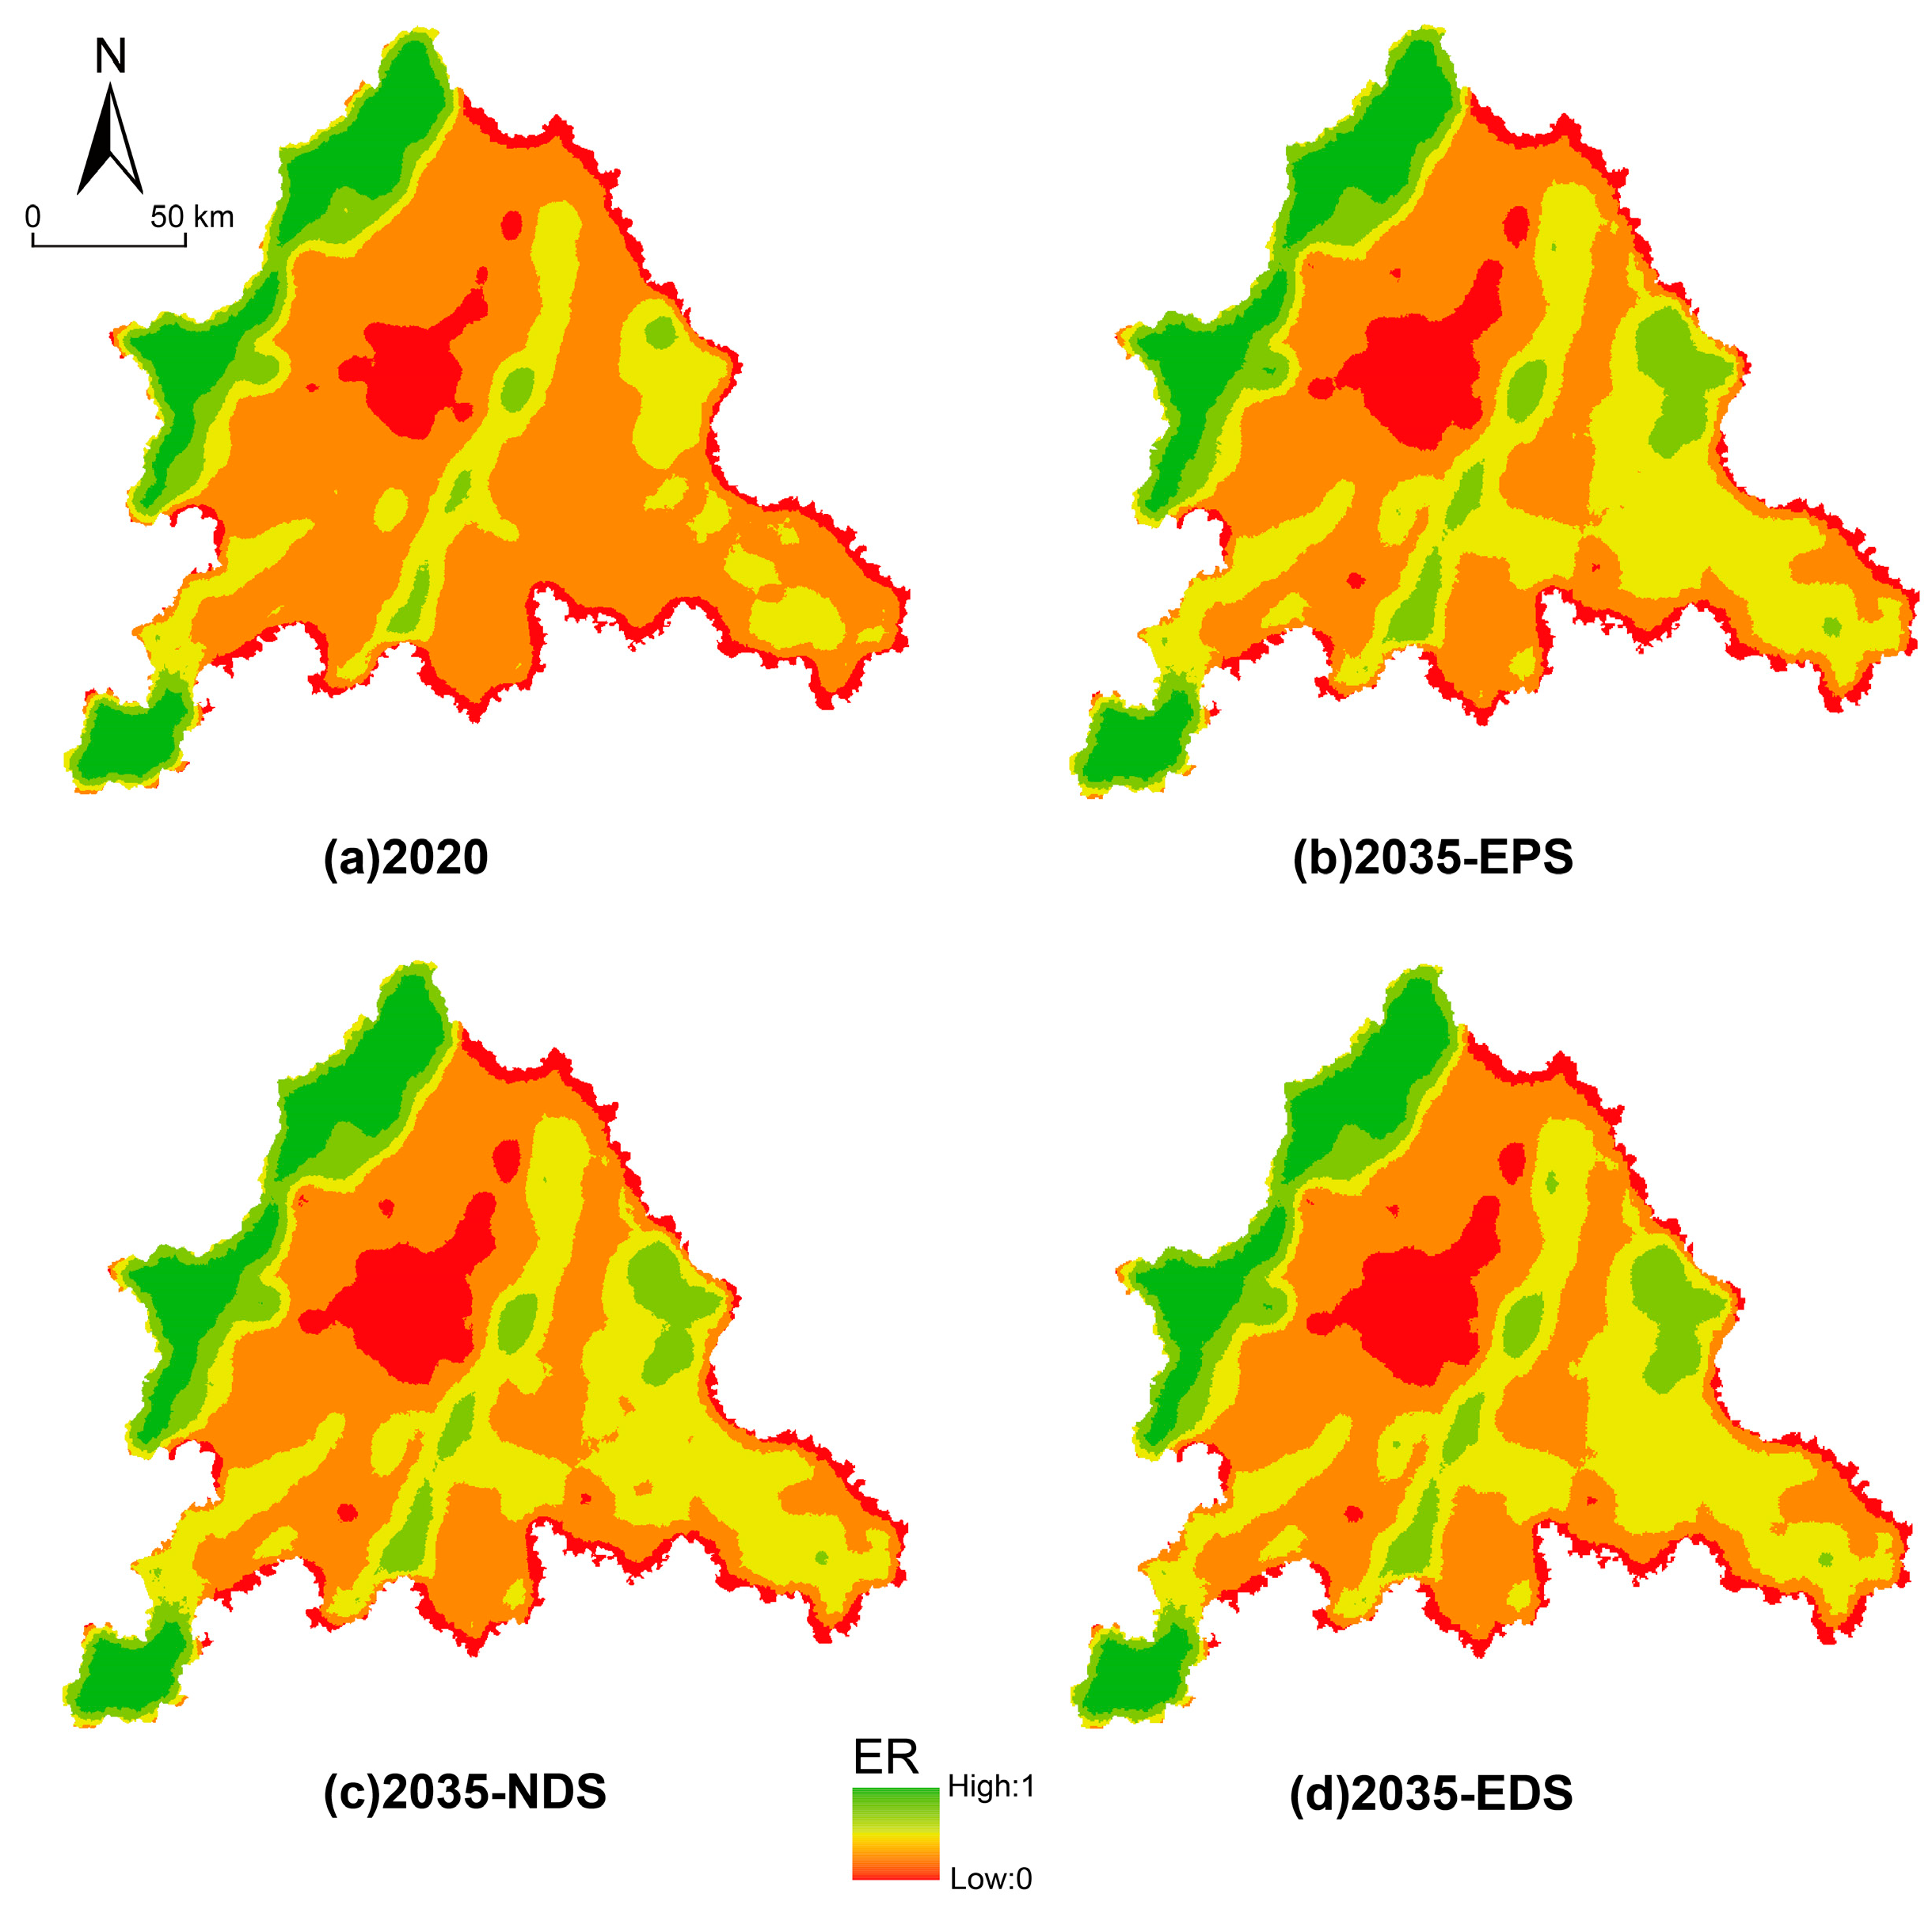
- Ecosystem Resilience (ER): ER denotes the capacity of an ecosystem to recuperate and preserve its original condition following a disturbance. This study measures ER utilizing the ER coefficient and the ecosystem resistance coefficient [2,51]. Based on data from previous research [40,49], weights of 0.6 and 0.4 were assigned, respectively. The equation is as follows:
- 4.
- Ecosystem Services (ES): This term refers to a series of direct and indirect ecological functions provided for humans [52]. It critically measures the ecological health of a specific region. The calculation of ES is based on the equivalent factor method proposed by Xie Gaodi et al. [53]. The evaluated ecosystem services are categorized into provisioning services, regulating services, cultural services, and support services [3,54]. Provisioning services encompass the supply of vital resources, including food and raw materials, fundamental to human subsistence. These services involve food production and the provision of biological materials to meet various human needs. Regulating services encompass ecological processes that maintain environmental balance and promote sustainability. These strategies encompass climate regulation and hydrological regulation, all intended to augment ecological resilience. Cultural services enhance human well-being and general quality of life. They represent the intangible advantages conferred to human society. Supporting services are essential ecological processes that uphold other ecosystem functions, such as soil development and preservation, alongside biodiversity conservation. These processes are crucial for sustaining ecosystem stability. Standard equivalent values corresponding to the actual production conditions of the study region were established based on the classification of ecosystem services (ES). A spatial overlay analysis was then conducted to integrate the area of each land use type. The spatial distribution of ES values within the research region was visualized accordingly, and the formula is as follows:
3. Results
3.1. Assessment of the Accuracy of the SD-PLUS Coupled Model
3.2. Land Use Scenarios for 2035 Predicted Using the SD-PLUS Coupled Model
3.3. Analysis of Ecosystem Spatial Pattern
3.3.1. Ecosystem Vigor
3.3.2. Ecosystem Organization
3.3.3. Ecosystem Resilience
3.3.4. Ecosystem Services
3.4. Prediction of Changes in the EHI
4. Discussion
4.1. Spatiotemporal Analysis of Ecosystem Health Under Different Land Use Scenarios
4.2. Policy Recommendations
4.3. Limitations and Future Prospects
5. Conclusions and Recommendations
- (1)
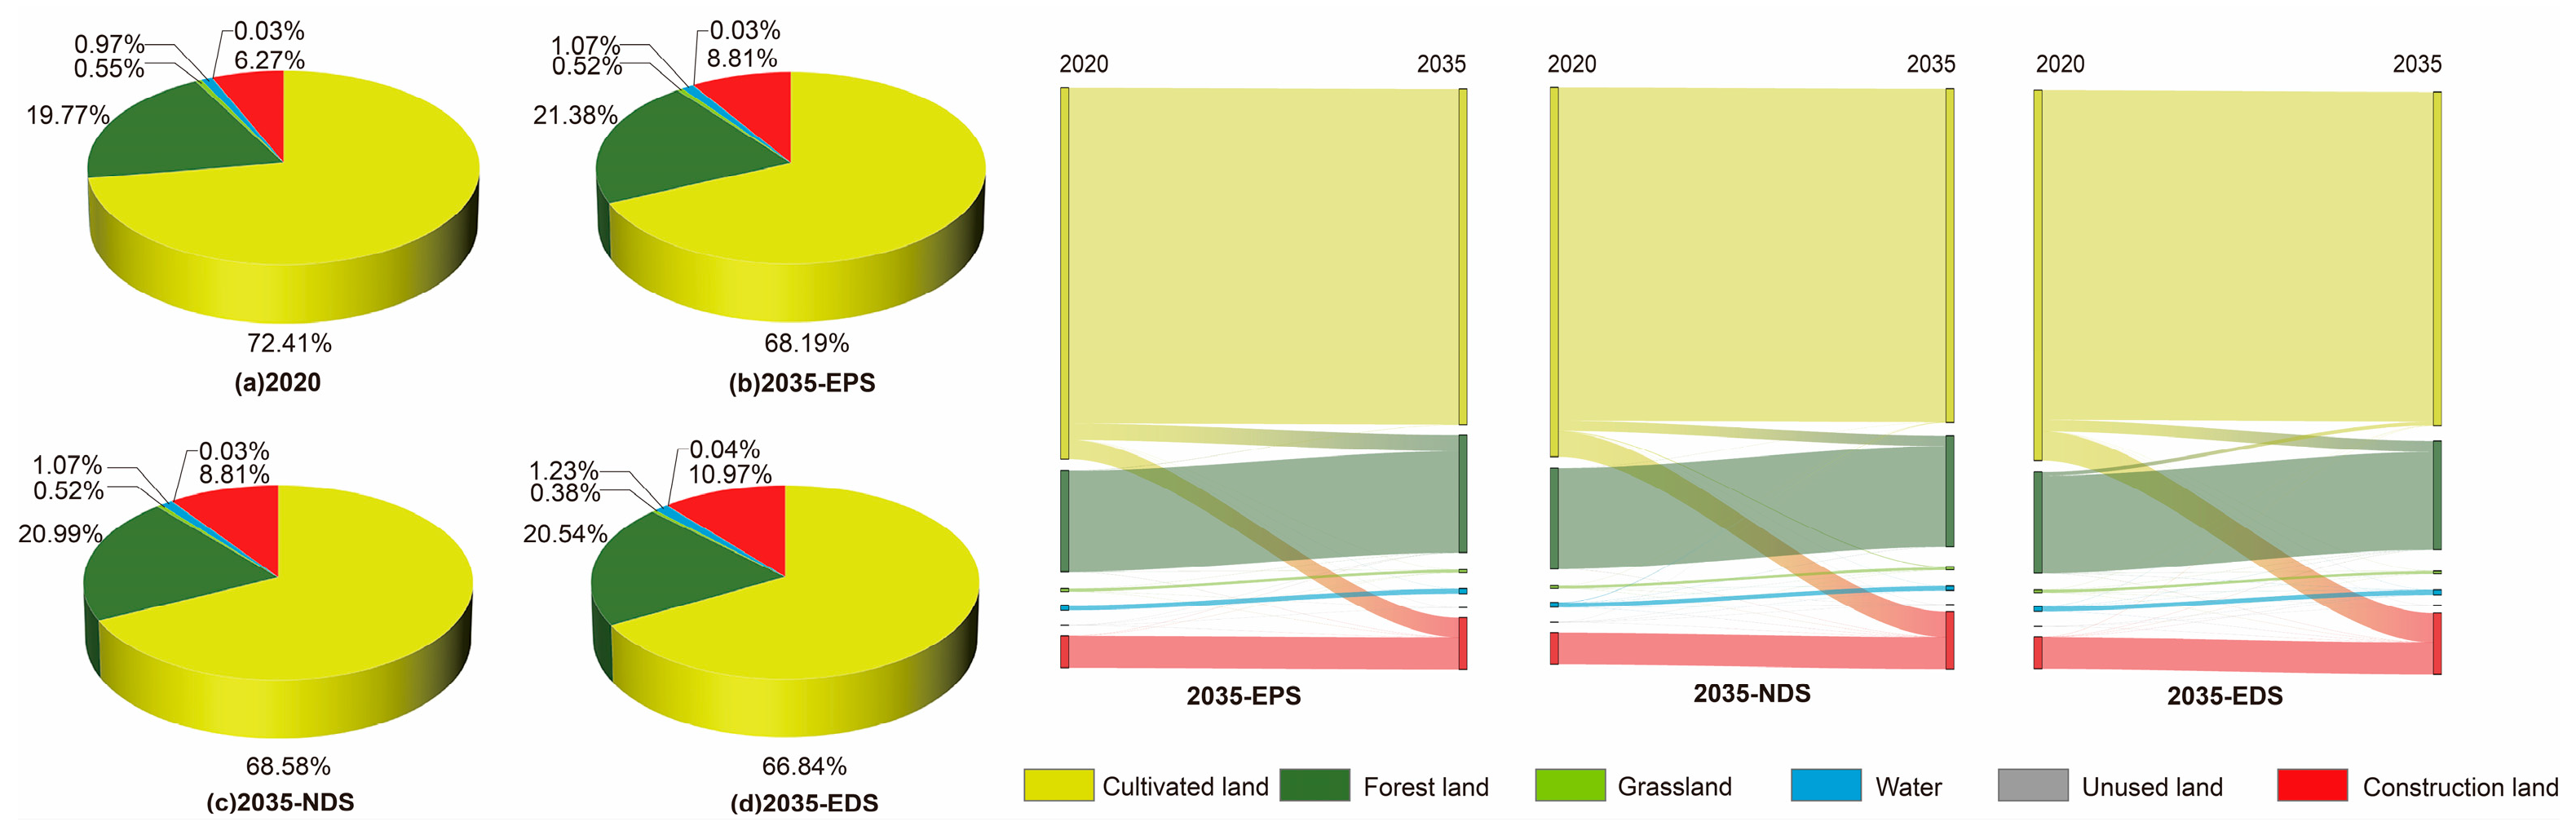
- Simulated land use patterns for the CMA in 2035 exhibit significant differences across the three scenarios. In the context of the EDS, the total construction land area is projected to increase to 3630.57 km2, representing a 75.01% growth. The majority of the new construction sites will be situated on the periphery of the city center. Conversely, under the EPS, the expansion of construction land is constrained by numerous legislative limitations, resulting in a negligible increase, whereas the area of forest land has markedly expanded due to afforestation and conservation initiatives. Under the NDS, maintaining the current urban development policy, land use achieves a balance between ecological protection and economic development.
- (2)
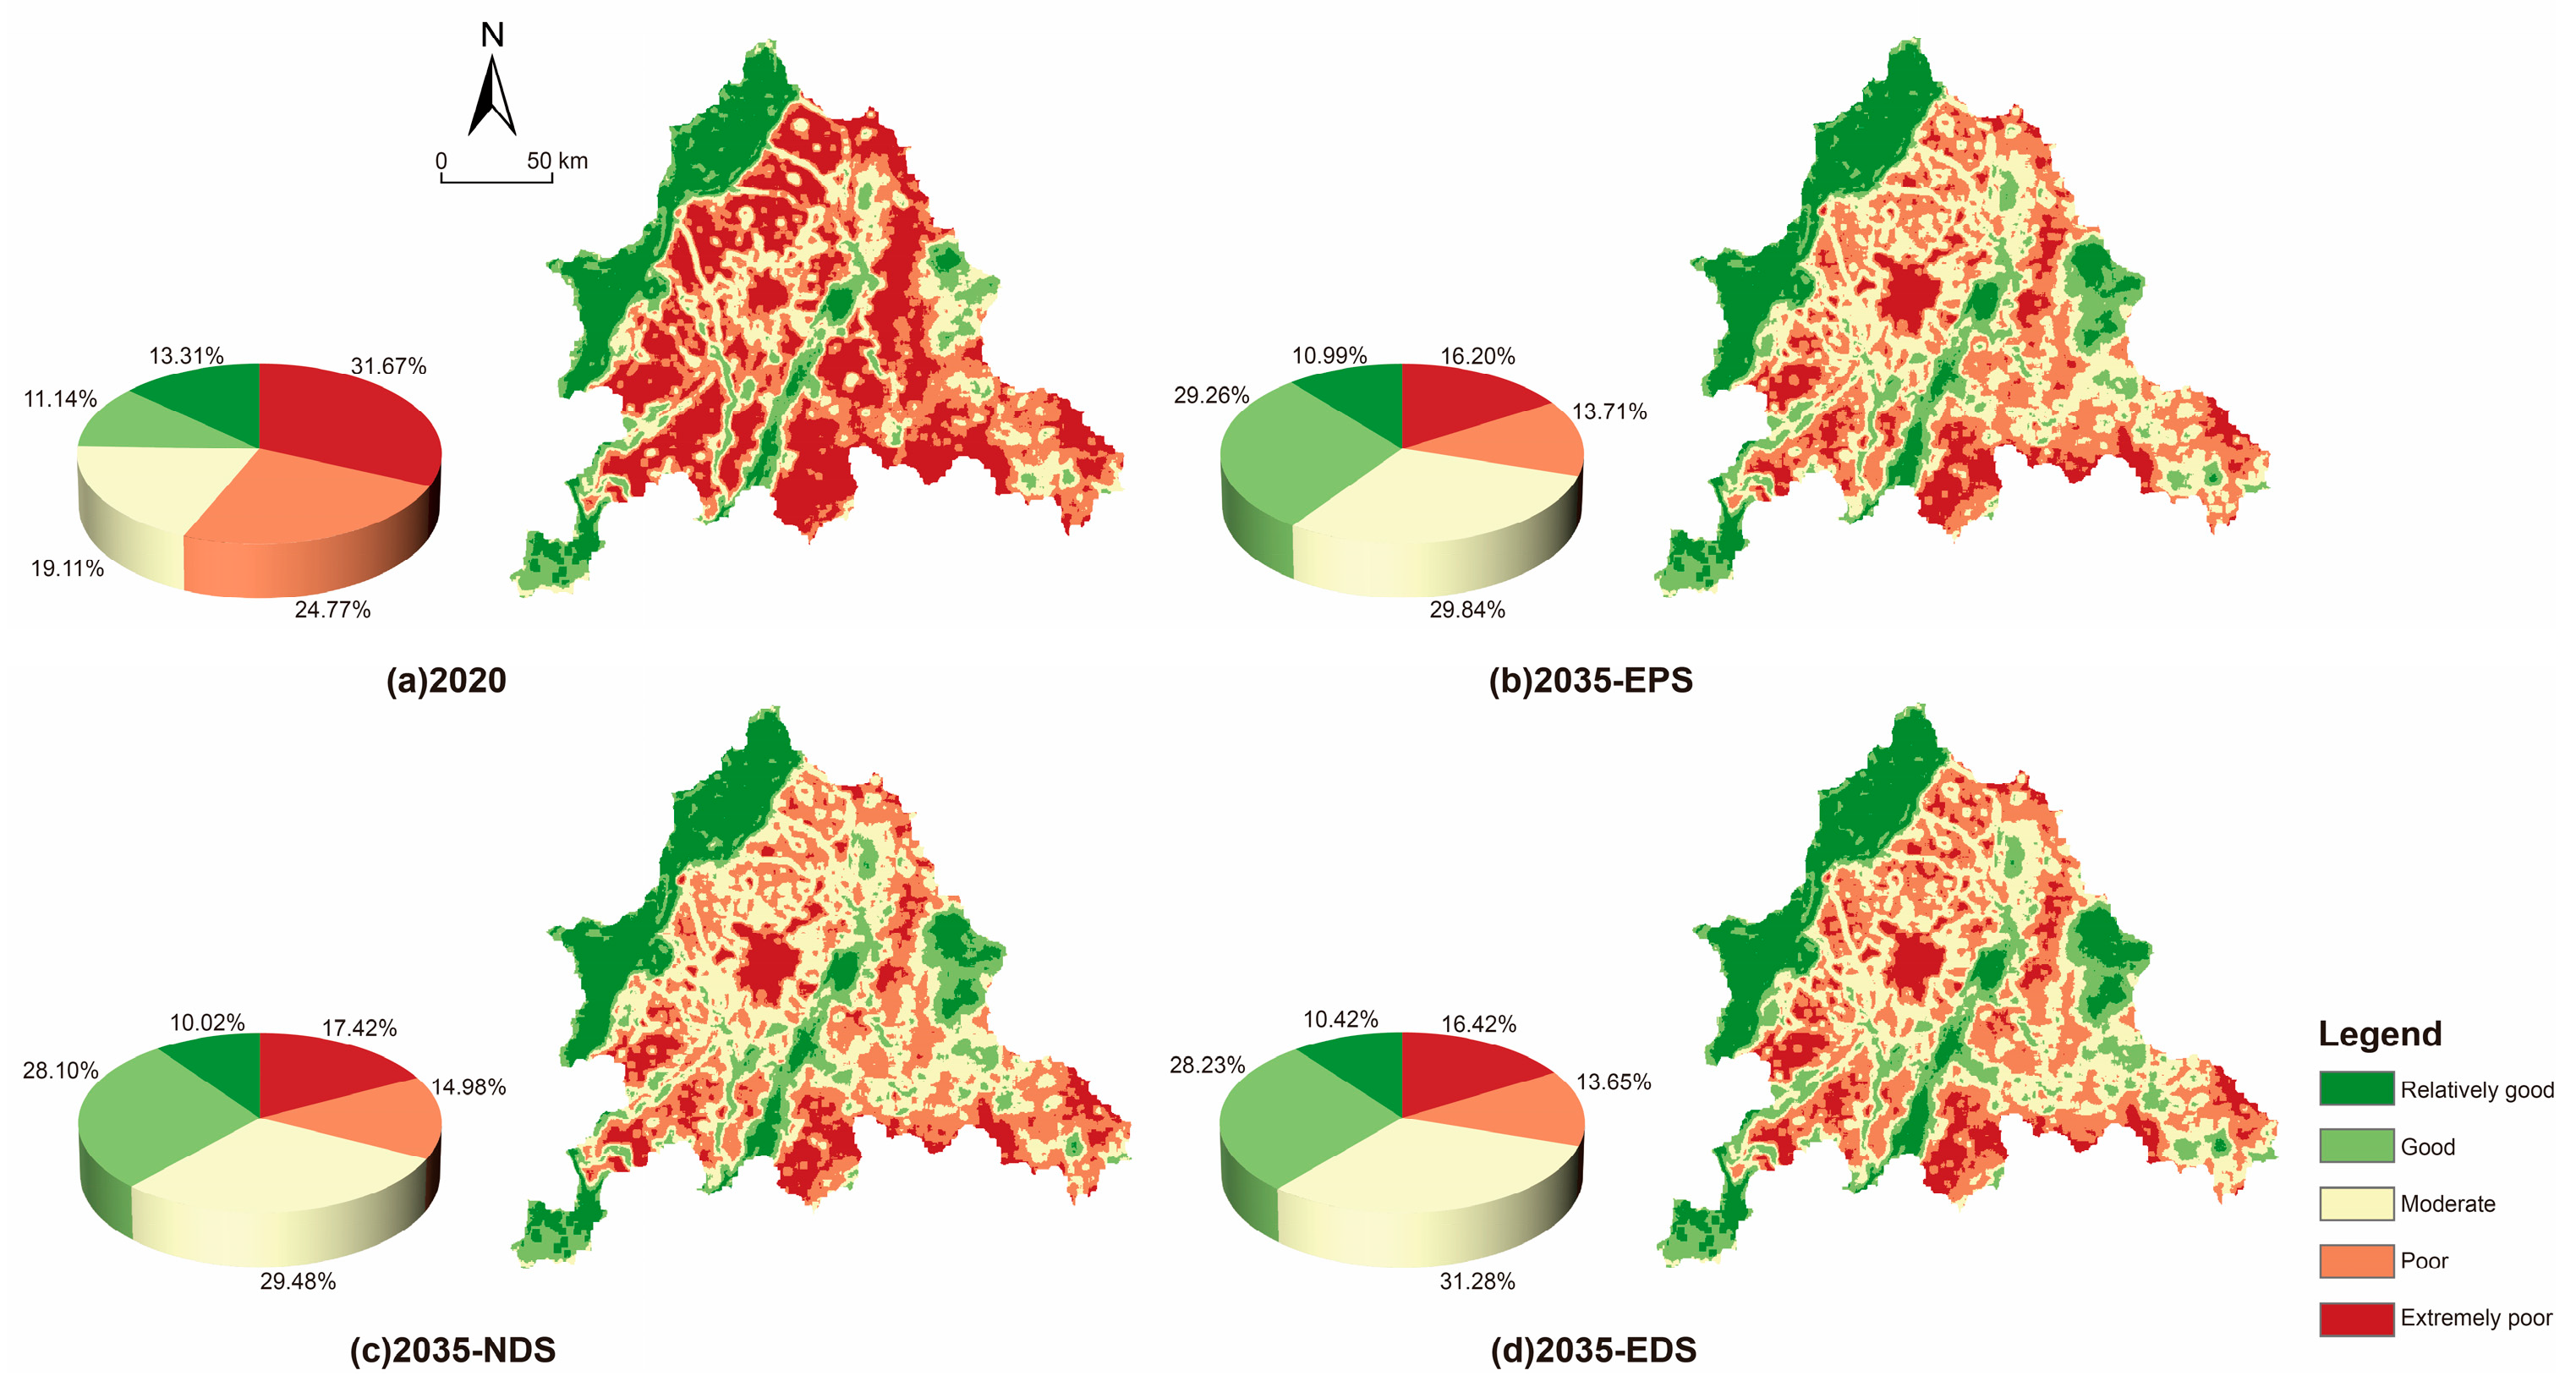
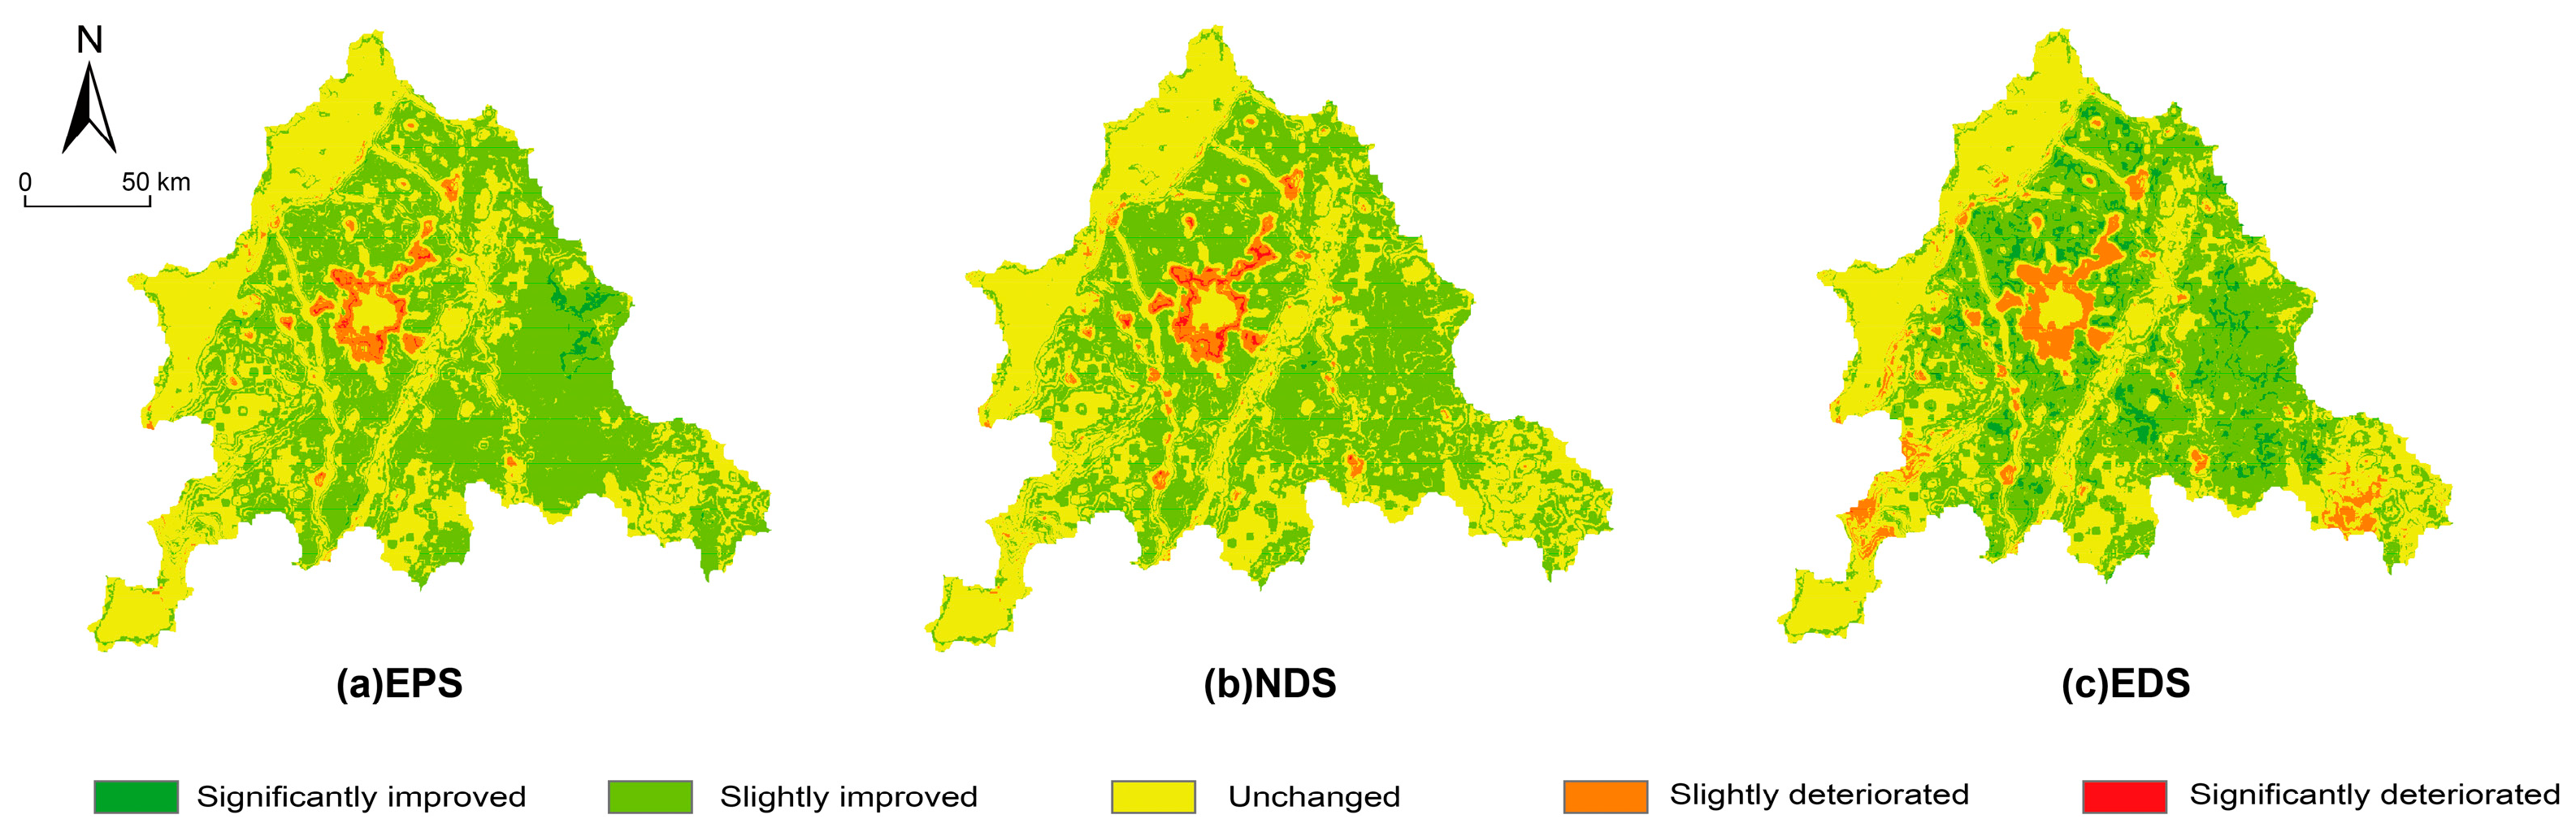
- The EHI distribution in the CMA shows spatial heterogeneity, with lower values in urban core areas and overall relative stability. Projections for 2035 indicate the following ranking of the CMA EHI across the three scenarios: EPS (0.4286) > EDS (0.4097) > NDS (0.4044). Level 4 and Level 5 health zones are predominantly located in the forested areas of the western Longmen Mountains and the central and western Longquan Mountains, whereas Level 3 health zones are mainly found in the peripheral municipalities. Level 1 and Level 2 health zones are predominantly situated in the construction land surrounding the primary urban areas of the four cities within the research area. These areas are highly susceptible to the effects of land use transformations. Under the EDS, the widespread expansion and uncontrolled growth of construction land leads to a slight increase in EHI, with the smallest increase. In the NDS, the increase in the EHI is balanced. Conversely, in the EPS, the implementation of stringent ecological protection measures could lead to a substantial enhancement in the regional EHI, underscoring the pivotal role of ecological protection policies in attaining regional sustainability.
- (3)
- The spatial distribution of land use is closely related to ecosystem health. The EHI in the three scenarios exceeds the 2020 level, with the EPS demonstrating the most significant increase and the NDS exhibiting the least increase. These findings underscore the pivotal role of ecological protection policies in mitigating the adverse impacts of urban expansion and ensuring long-term sustainability. This study proposes a scalable modeling approach that can be used to enhance scenario-based land use simulation and ecosystem health assessment, thereby informing long-term sustainable land management strategies. The model’s scalability and the insights it provides are noteworthy, as they can be applied to other rapidly urbanizing regions and offer decision-makers valuable tools to balance economic development and ecological sustainability.
Author Contributions
Funding
Institutional Review Board Statement
Informed Consent Statement
Data Availability Statement
Conflicts of Interest
References
- Comberti, C.; Thornton, T.F.; Echeverria, V.W.; Patterson, T. Ecosystem Services or Services to Ecosystems? Valuing Cultivation and Reciprocal Relationships between Humans and Ecosystems. Glob. Environ. Change-Hum. Policy Dimens. 2015, 34, 247–262. [Google Scholar] [CrossRef]
- Peng, J.; Liu, Y.; Wu, J.; Lv, H.; Hu, X. Linking Ecosystem Services and Landscape Patterns to Assess Urban Ecosystem Health: A Case Study in Shenzhen City, China. Landsc. Urban Plan. 2015, 143, 56–68. [Google Scholar] [CrossRef]
- Costanza, R.; d’Arge, R.; de Groot, R.; Farber, S.; Grasso, M.; Hannon, B.; Limburg, K.; Naeem, S.; ONeill, R.V.; Paruelo, J.; et al. The Value of the World’s Ecosystem Services and Natural Capital. Nature 1997, 387, 253–260. [Google Scholar] [CrossRef]
- Wu, T.; Cui, Y.; Lian, A.; Tian, Y.; Li, R.; Liu, X.; Yan, J.; Xue, Y.; Liu, H.; Wu, B. Vehicle Emissions of Primary Air Pollutants from 2009 to 2019 and Projection for the 14th Five-Year Plan Period in Beijing, China. J. Environ. Sci. 2023, 124, 513–521. [Google Scholar] [CrossRef]
- Su, M.; Yang, Z.; Chen, B.; Liu, G.; Zhang, Y.; Zhang, L.; Xu, L.; Zhao, Y. Urban Ecosystem Health Assessment and Its Application in Management: A Multi-Scale Perspective. Entropy 2013, 15, 1–9. [Google Scholar] [CrossRef]
- Xiao, Z.; Liu, R.; Gao, Y.; Yang, Q.; Chen, J. Spatiotemporal Variation Characteristics of Ecosystem Health and Its Driving Mechanism in the Mountains of Southwest China. J. Clean. Prod. 2022, 345, 131138. [Google Scholar] [CrossRef]
- Xie, X.; Fang, B.; Xu, H.; He, S.; Li, X. Study on the Coordinated Relationship between Urban Land Use Efficiency and Ecosystem Health in China. Land Use Policy 2021, 102, 105235. [Google Scholar] [CrossRef]
- Lv, T.; Zeng, C.; Lin, C.; Liu, W.; Cheng, Y.; Li, Y. Towards an Integrated Approach for Land Spatial Ecological Restoration Zoning Based on Ecosystem Health Assessment. Ecol. Indic. 2023, 147, 110016. [Google Scholar] [CrossRef]
- Ainslie, W. Rapid Wetland Functional Assessment—Its Role and Utility in the Regulatory Arena. Water Air Soil Pollut. 1994, 77, 433–444. [Google Scholar] [CrossRef]
- Rapport, D.J. Ecosystem Services and Management Options as Blanket Indicators of Ecosystem Health. J. Aquat. Ecosyst. Health 1995, 4, 97–105. [Google Scholar] [CrossRef]
- Yu, W.; Zhang, D.; Liao, J.; Ma, L.; Zhu, X.; Zhang, W.; Hu, W.; Ma, Z.; Chen, B. Linking Ecosystem Services to a Coastal Bay Ecosystem Health Assessment: A Comparative Case Study between Jiaozhou Bay and Daya Bay, China. Ecol. Indic. 2022, 135, 108530. [Google Scholar] [CrossRef]
- Costanza, R. Ecosystem Health and Ecological Engineering. Ecol. Eng. 2012, 45, 24–29. [Google Scholar] [CrossRef]
- Costanza, R.; de Groot, R.; Braat, L.; Kubiszewski, I.; Fioramonti, L.; Sutton, P.; Farber, S.; Grasso, M. Twenty Years of Ecosystem Services: How Far Have We Come and How Far Do We Still Need to Go? Ecosyst. Serv. 2017, 28, 1–16. [Google Scholar] [CrossRef]
- Li, M.; Luo, G.; Li, Y.; Qin, Y.; Huang, J.; Liao, J. Effects of Landscape Patterns and Their Changes on Ecosystem Health under Different Topographic Gradients: A Case Study of the Miaoling Mountains in Southern China. Ecol. Indic. 2023, 154, 110796. [Google Scholar] [CrossRef]
- Peng, J.; Liu, Y.; Li, T.; Wu, J. Regional Ecosystem Health Response to Rural Land Use Change: A Case Study in Lijiang City, China. Ecol. Indic. 2017, 72, 399–410. [Google Scholar] [CrossRef]
- Yushanjiang, A.; Zhang, F.; Leong Tan, M. Spatial-Temporal Characteristics of Ecosystem Health in Central Asia. Int. J. Appl. Earth Obs. Geoinf. 2021, 105, 102635. [Google Scholar] [CrossRef]
- Kang, J.; Fang, L.; Li, S.; Wang, X. Parallel Cellular Automata Markov Model for Land Use Change Prediction over MapReduce Framework. ISPRS Int. J. Geo-Inf. 2019, 8, 454. [Google Scholar] [CrossRef]
- Shirmohammadi, B.; Malekian, A.; Salajegheh, A.; Taheri, B.; Azarnivand, H.; Malek, Z.; Verburg, P.H. Scenario Analysis for Integrated Water Resources Management under Future Land Use Change in the Urmia Lake Region, Iran. Land Use Policy 2020, 90, 104299. [Google Scholar] [CrossRef]
- Wang, Z.; Li, X.; Mao, Y.; Li, L.; Wang, X.; Lin, Q. Dynamic Simulation of Land Use Change and Assessment of Carbon Storage Based on Climate Change Scenarios at the City Level: A Case Study of Bortala, China. Ecol. Indic. 2022, 134, 108499. [Google Scholar] [CrossRef]
- Liu, X.; Liang, X.; Li, X.; Xu, X.; Ou, J.; Chen, Y.; Li, S.; Wang, S.; Pei, F. A Future Land Use Simulation Model (FLUS) for Simulating Multiple Land Use Scenarios by Coupling Human and Natural Effects. Landsc. Urban Plan. 2017, 168, 94–116. [Google Scholar] [CrossRef]
- Zhang, S.; Zhong, Q.; Cheng, D.; Xu, C.; Chang, Y.; Lin, Y.; Li, B. Landscape Ecological Risk Projection Based on the PLUS Model under the Localized Shared Socioeconomic Pathways in the Fujian Delta Region. Ecol. Indic. 2022, 136, 108642. [Google Scholar] [CrossRef]
- Wang, J.; Zhang, J.; Xiong, N.; Liang, B.; Wang, Z.; Cressey, E.L. Spatial and Temporal Variation, Simulation and Prediction of Land Use in Ecological Conservation Area of Western Beijing. Remote Sens. 2022, 14, 1452. [Google Scholar] [CrossRef]
- Pan, Z.; He, J.; Liu, D.; Wang, J. Predicting the Joint Effects of Future Climate and Land Use Change on Ecosystem Health in the Middle Reaches of the Yangtze River Economic Belt, China. Appl. Geogr. 2020, 124, 102293. [Google Scholar] [CrossRef]
- Li, W.; Wang, Y.; Xie, S.; Cheng, X. Spatiotemporal Evolution Scenarios and the Coupling Analysis of Ecosystem Health with Land Use Change in Southwest China. Ecol. Eng. 2022, 179, 106607. [Google Scholar] [CrossRef]
- Wang, L.; Zhu, R.; Yin, Z.; Chen, Z.; Fang, C.; Lu, R.; Zhou, J.; Feng, Y. Impacts of Land-Use Change on the Spatio-Temporal Patterns of Terrestrial Ecosystem Carbon Storage in the Gansu Province, Northwest China. Remote Sens. 2022, 14, 3164. [Google Scholar] [CrossRef]
- Chen, Y.; Wang, J.; Xiong, N.; Sun, L.; Xu, J. Impacts of Land Use Changes on Net Primary Productivity in Urban Agglomerations under Multi-Scenarios Simulation. Remote Sens. 2022, 14, 1755. [Google Scholar] [CrossRef]
- Li, G.; Wang, W.; Li, B.; Duan, Z.; Hu, L.; Liu, J. Spatiotemporal Simulation of Blue-Green Space Pattern Evolution and Carbon Storage under Different SSP-RCP Scenarios in Wuhan. Sci. Rep. 2025, 15, 4017. [Google Scholar] [CrossRef]
- Tan, J.; Li, A.; Lei, G.; Xie, X. A SD-MaxEnt-CA Model for Simulating the Landscape Dynamic of Natural Ecosystem by Considering Socio-Economic and Natural Impacts. Ecol. Model. 2019, 410, 108783. [Google Scholar] [CrossRef]
- Hu, C.; Huang, G.; Wang, Z. Exploring the Seasonal Relationship between Spatial and Temporal Features of Land Surface Temperature and Its Potential Drivers: The Case of Chengdu Metropolitan Area, China. Front. Earth Sci. 2023, 11, 1226795. [Google Scholar] [CrossRef]
- Liang, X.; Guan, Q.; Clarke, K.C.; Liu, S.; Wang, B.; Yao, Y. Understanding the Drivers of Sustainable Land Expansion Using a Patch-Generating Land Use Simulation (PLUS) Model: A Case Study in Wuhan, China. Comput. Environ. Urban Syst. 2021, 85, 101569. [Google Scholar] [CrossRef]
- Guo, R.; Wu, T.; Wu, X.; Luigi, S.; Wang, Y. Simulation of Urban Land Expansion Under Ecological Constraints in Harbin-Changchun Urban Agglomeration, China. Chin. Geogr. Sci. 2022, 32, 438–455. [Google Scholar] [CrossRef]
- Ji, X.; Sun, Y.; Guo, W.; Zhao, C.; Li, K. Land Use and Habitat Quality Change in the Yellow River Basin: A Perspective with Different CMIP6-Based Scenarios and Multiple Scales. J. Environ. Manag. 2023, 345, 118729. [Google Scholar] [CrossRef]
- Jiang, Y.; Du, G.; Teng, H.; Wang, J.; Li, H. Multi-Scenario Land Use Change Simulation and Spatial Response of Ecosystem Service Value in Black Soil Region of Northeast China. Land 2023, 12, 962. [Google Scholar] [CrossRef]
- Zhang, Q.; Wu, C. Optimization Model of Permanent Basic Farmland Indicators Distribution from the Perspective of Equity: A Case from W County, China. Land 2022, 11, 1290. [Google Scholar] [CrossRef]
- Prasad, P.; Loveson, V.J.; Chandra, P.; Kotha, M. Evaluation and Comparison of the Earth Observing Sensors in Land Cover/Land Use Studies Using Machine Learning Algorithms. Ecol. Inform. 2022, 68, 101522. [Google Scholar] [CrossRef]
- Ai, B.; Xie, D.; Ma, S.; Jiang, H. An EasyCA Model with Few Steady Variables and Clone Stamp Strategy for Simulation of Urban Growth in Metropolitan Areas. Ecol. Model. 2022, 468, 109950. [Google Scholar] [CrossRef]
- Hasani, M.; Pielesiak, I.; Mahiny, A.S.; Mikaeili, A. Regional Ecosystem Health Assessment Based on Landscape Patterns and Ecosystem Services Approach. Acta Ecol. Sin. 2023, 43, 333–342. [Google Scholar] [CrossRef]
- Rapport, D.J.; Costanza, R.; McMichael, A.J. Assessing Ecosystem Health. Trends Ecol. Evol. 1998, 13, 397–402. [Google Scholar] [CrossRef]
- Carpenter, S.R.; Mooney, H.A.; Agard, J.; Capistrano, D.; DeFries, R.S.; Díaz, S.; Dietz, T.; Duraiappah, A.K.; Oteng-Yeboah, A.; Pereira, H.M.; et al. Science for Managing Ecosystem Services: Beyond the Millennium Ecosystem Assessment. Proc. Natl. Acad. Sci. USA 2009, 106, 1305–1312. [Google Scholar] [CrossRef]
- Chen, W.; Zhao, H.; Li, J.; Zhu, L.; Wang, Z.; Zeng, J. Land Use Transitions and the Associated Impacts on Ecosystem Services in the Middle Reaches of the Yangtze River Economic Belt in China Based on the Geo-Informatic Tupu Method. Sci. Total Environ. 2020, 701, 134690. [Google Scholar] [CrossRef]
- Wang, Z.; Yang, Z.; Shi, H.; Han, F.; Liu, Q.; Qi, J.; Lu, Y. Ecosystem Health Assessment of World Natural Heritage Sites Based on Remote Sensing and Field Sampling Verification: Bayanbulak as Case Study. Sustainability 2020, 12, 2610. [Google Scholar] [CrossRef]
- Zhou, Y.; Yue, D.; Li, S.; Liang, G.; Chao, Z.; Zhao, Y.; Meng, X. Ecosystem Health Assessment in Debris Flow-Prone Areas: A Case Study of Bailong River Basin in China. J. Clean. Prod. 2022, 357, 131887. [Google Scholar] [CrossRef]
- Meng, L.; Huang, J.; Dong, J. Assessment of Rural Ecosystem Health and Type Classification in Jiangsu Province, China. Sci. Total Environ. 2018, 615, 1218–1228. [Google Scholar] [CrossRef] [PubMed]
- Ma, J.; Ding, X.; Shu, Y.; Abbas, Z. Spatio-Temporal Variations of Ecosystem Health in the Liuxi River Basin, Guangzhou, China. Ecol. Inform. 2022, 72, 101842. [Google Scholar] [CrossRef]
- Zou, S.; Qian, J.; Xu, B.; Tu, Z.; Zhang, W.; Ma, X.; Liang, Y. Spatiotemporal Changes of Ecosystem Health and Their Driving Mechanisms in Alpine Regions on the Northeastern Tibetan Plateau. Ecol. Indic. 2022, 143, 109396. [Google Scholar] [CrossRef]
- Sun, T.; Lin, W.; Chen, G.; Guo, P.; Zeng, Y. Wetland Ecosystem Health Assessment through Integrating Remote Sensing and Inventory Data with an Assessment Model for the Hangzhou Bay, China. Sci. Total Environ. 2016, 566, 627–640. [Google Scholar] [CrossRef]
- Kang, P.; Chen, W.; Hou, Y.; Li, Y. Linking Ecosystem Services and Ecosystem Health to Ecological Risk Assessment: A Case Study of the Beijing-Tianjin-Hebei Urban Agglomeration. Sci. Total Environ. 2018, 636, 1442–1454. [Google Scholar] [CrossRef]
- Xu, W.; He, M.; Meng, W.; Zhang, Y.; Yun, H.; Lu, Y.; Huang, Z.; Mo, X.; Hu, B.; Liu, B.; et al. Temporal-Spatial Change of China’s Coastal Ecosystems Health and Driving Factors Analysis. Sci. Total Environ. 2022, 845, 157319. [Google Scholar] [CrossRef]
- Pan, Z.; He, J.; Liu, D.; Wang, J.; Guo, X. Ecosystem Health Assessment Based on Ecological Integrity and Ecosystem Services Demand in the Middle Reaches of the Yangtze River Economic Belt, China. Sci. Total Environ. 2021, 774, 144837. [Google Scholar] [CrossRef]
- Frondoni, R.; Mollo, B.; Capotorti, G. A Landscape Analysis of Land Cover Change in the Municipality of Rome (Italy): Spatio-Temporal Characteristics and Ecological Implications of Land Cover Transitions from 1954 to 2001. Landsc. Urban Plan. 2011, 100, 117–128. [Google Scholar] [CrossRef]
- Colding, J. ‘Ecological Land-Use Complementation’ for Building Resilience in Urban Ecosystems. Landsc. Urban Plan. 2007, 81, 46–55. [Google Scholar] [CrossRef]
- De Groot, R.; Brander, L.; van der Ploeg, S.; Costanza, R.; Bernard, F.; Braat, L.; Christie, M.; Crossman, N.; Ghermandi, A.; Hein, L.; et al. Global Estimates of the Value of Ecosystems and Their Services in Monetary Units. Ecosyst. Serv. 2012, 1, 50–61. [Google Scholar] [CrossRef]
- Gao-di, X.I.E.; Lin, Z.; Chun-xia, L.U.; Yu, X.; Cao, C. Expert Knowledge Based Valuation Method of Ecosystem Services in China. J. Nat. Resour. 2008, 23, 911–919. [Google Scholar] [CrossRef]
- Maes, J.; Liquete, C.; Teller, A.; Erhard, M.; Paracchini, M.L.; Barredo, J.I.; Grizzetti, B.; Cardoso, A.; Somma, F.; Petersen, J.-E.; et al. An Indicator Framework for Assessing Ecosystem Services in Support of the EU Biodiversity Strategy to 2020. Ecosyst. Serv. 2016, 17, 14–23. [Google Scholar] [CrossRef]
- Lin, T.; Wu, D.; Yang, M.; Ma, P.; Liu, Y.; Liu, F.; Gan, Z. Evolution and Simulation of Terrestrial Ecosystem Carbon Storage and Sustainability Assessment in Karst Areas: A Case Study of Guizhou Province. Int. J. Environ. Res. Public Health 2022, 19, 16219. [Google Scholar] [CrossRef]


| Category | Data Name | Data Type | Data Source |
|---|---|---|---|
| Land Use Data | 2005 and 2020 Land Use Data | Raster/30 m | Chinese Academy of Sciences Resource and Environmental Science Data Center (https://www.resdc.cn, accessed on 4 January 2025). |
| Administrative Boundary | City Administrative Boundary | - | Resource and Environment Science Data Center (http://www.resdc.cn, accessed on 4 January 2025). |
| Natural Factor Drivers | Slope | Raster/30 m | Chinese Academy of Sciences Resource and Environmental Science Data Center (https://www.resdc.cn, accessed on 4 January 2025). |
| DEM | |||
| Average Annual Temperature | |||
| Average Annual Precipitation | |||
| Soil Type | |||
| Socioeconomic Factor Drivers | Population Density | Raster/1 km | Chinese Academy of Sciences Resource and Environmental Science Data Center (https://www.resdc.cn, accessed on 4 January 2025). |
| GDP | |||
| Distance Factor Drivers | Distance from Primary Road | Raster/30 m | National Geographic Information Resources Catalog Service System (https://www.webmap.cn/main.do?method=index, Accessed on 5 January 2025) |
| Distance from Secondary Road | |||
| Distance from Tertiary Road | |||
| Distance from Railroad | |||
| Distance from Highway | |||
| Distance from the County Government | |||
| Distance from Settlement | |||
| Distance from Water | |||
| Distance from Industrial Area | |||
| Statistical Data | Economic Data, Demographic Data, and Annual Average Temperature and Precipitation Data for the Simulation Phase. | - | Chengdu Statistical Yearbook 2005–2020 (https://cdstats.chengdu.gov.cn/cdstjj/c155008/list.shtml, accessed on 7 January 2025) |
| Deyang Statistical Yearbook 2005–2020 (https://data.dystat.cn/list/145/d/1/subsite/1.html, accessed on 7 January 2025) | |||
| Meishan Statistical Yearbook 2005–2020 (https://www.ms.gov.cn/zfxxgk/fdzdgknr/tjxx/tjnj.htm, accessed on 7 January 2025) | |||
| Ziyang Statistical Yearbook 2005–2020 (http://www.ziyang.gov.cn/zysrmzf/tjnj/pc/list.html, accessed on 7 January 2025) |
| Scenario | Mean Annual GDP Growth Rate (%) | Mean Annual Population Growth Rate (‰) | Mean Annual Urbanization Rate (%) | Mean Annual Precipitation (mm) | Mean Annual Temperature (°C) |
|---|---|---|---|---|---|
| EPS | 6 | 4.3 | 0.62 | 5.45 | 0.12 |
| NDS | Keep Constant | Keep Constant | Keep Constant | Keep Constant | Keep Constant |
| EDS | 7.5 | 7.2 | 0.84 | 7.14 | 0.45 |
| Land Use Type | EPS | NDS | EDS |
|---|---|---|---|
| Cultivated land | 0.4 | 0.6 | 0.4 |
| Forest land | 1 | 0.7 | 0.3 |
| Grassland | 0.7 | 0.3 | 0.2 |
| Water | 0.8 | 0.3 | 0.6 |
| Unused land | 0.1 | 0.5 | 0.1 |
| Construction land | 0.8 | 1 | 1 |
| EPS | NDS | EDS | ||||||||||||||||
|---|---|---|---|---|---|---|---|---|---|---|---|---|---|---|---|---|---|---|
| A | B | C | D | E | F | A | B | C | D | E | F | A | B | C | D | E | F | |
| A | 1 | 1 | 1 | 1 | 1 | 1 | 1 | 1 | 1 | 1 | 1 | 1 | 1 | 0 | 0 | 0 | 1 | 1 |
| B | 0 | 1 | 0 | 0 | 0 | 0 | 1 | 1 | 1 | 1 | 1 | 1 | 1 | 1 | 1 | 0 | 1 | 1 |
| C | 0 | 1 | 1 | 0 | 0 | 0 | 1 | 1 | 1 | 1 | 1 | 1 | 0 | 0 | 1 | 1 | 0 | 1 |
| D | 0 | 1 | 1 | 1 | 0 | 0 | 1 | 1 | 1 | 1 | 1 | 1 | 0 | 0 | 0 | 1 | 0 | 0 |
| E | 1 | 1 | 1 | 1 | 1 | 1 | 1 | 1 | 1 | 1 | 1 | 1 | 1 | 1 | 1 | 1 | 1 | 1 |
| F | 0 | 0 | 0 | 0 | 0 | 1 | 0 | 0 | 0 | 0 | 0 | 1 | 1 | 1 | 1 | 1 | 1 | 1 |
| Unit (km2) | Cultivated Land | Forest Land | Grassland | Water | Unused Land | Construction Land |
|---|---|---|---|---|---|---|
| 2020 actual value | 23,978.41 | 6544.38 | 181.63 | 321.71 | 8.84 | 2074.54 |
| 2020 simulation value | 23,748.59 | 6687.17 | 179.49 | 335.13 | 8.42 | 2150.71 |
| Relative error (%) | −0.96 | +2.18 | −1.18 | +4.17 | −4.75 | +3.67 |
| Scenario | Cultivated Land | Forest Land | Grassland | Water | Unused Land | Construction Land |
|---|---|---|---|---|---|---|
| Actual in 2020 | 23,978.41 | 6544.38 | 181.63 | 321.71 | 8.84 | 2074.54 |
| EPS | 22,775.61 | 6880.01 | 170.93 | 353.28 | 11.24 | 2918.43 |
| NDS | 22,907.43 | 6448.37 | 153.39 | 380.16 | 9.69 | 3210.45 |
| EDS | 22,168.04 | 6801.93 | 127.38 | 368.61 | 12.98 | 3630.57 |
Disclaimer/Publisher’s Note: The statements, opinions and data contained in all publications are solely those of the individual author(s) and contributor(s) and not of MDPI and/or the editor(s). MDPI and/or the editor(s) disclaim responsibility for any injury to people or property resulting from any ideas, methods, instructions or products referred to in the content. |
© 2025 by the authors. Licensee MDPI, Basel, Switzerland. This article is an open access article distributed under the terms and conditions of the Creative Commons Attribution (CC BY) license (https://creativecommons.org/licenses/by/4.0/).
Share and Cite
Yu, J.; Guo, S.; Wang, S.; Luo, Y. Multi-Scenario Simulation of Land Use Change and Ecosystem Health Assessment in Chengdu Metropolitan Area Based on SD-PLUS-VORS Coupled Modeling. Sustainability 2025, 17, 3202. https://doi.org/10.3390/su17073202
Yu J, Guo S, Wang S, Luo Y. Multi-Scenario Simulation of Land Use Change and Ecosystem Health Assessment in Chengdu Metropolitan Area Based on SD-PLUS-VORS Coupled Modeling. Sustainability. 2025; 17(7):3202. https://doi.org/10.3390/su17073202
Chicago/Turabian StyleYu, Jiancheng, Shuting Guo, Shiyuan Wang, and Yanyun Luo. 2025. "Multi-Scenario Simulation of Land Use Change and Ecosystem Health Assessment in Chengdu Metropolitan Area Based on SD-PLUS-VORS Coupled Modeling" Sustainability 17, no. 7: 3202. https://doi.org/10.3390/su17073202
APA StyleYu, J., Guo, S., Wang, S., & Luo, Y. (2025). Multi-Scenario Simulation of Land Use Change and Ecosystem Health Assessment in Chengdu Metropolitan Area Based on SD-PLUS-VORS Coupled Modeling. Sustainability, 17(7), 3202. https://doi.org/10.3390/su17073202