Article

Environmental Assessment for Sustainable Educational Spaces: Optimizing Classroom Proportions in Taif City, KSA

by
Amal K. M. Shamseldin
Department of Civil Engineering, Faculty of Engineering, Taif University, Taif 21944, Saudi Arabia
Sustainability 2025, 17(7), 3198; https://doi.org/10.3390/su17073198
Submission received: 25 January 2025 / Revised: 17 March 2025 / Accepted: 27 March 2025 / Published: 3 April 2025

Abstract

:
Sustainable development in educational environments requires a holistic approach to architectural design, balancing multiple environmental functions to optimize student well-being and energy efficiency. According to architectural standards, rectangular classrooms typically have a shallow proportion, meaning the external facade is longer than the internal sides. While this design ensures adequate natural lighting, essential for classroom visual functions, it may not fully align with the sustainability goals in regions with diverse environmental characteristics. This diversity can lead to shortcomings in other aspects of human comfort or environmental performance, as optimizing one function may negatively impact others, while the environmental efficiency of architectural spaces should not be judged solely on a single comfort criterion. A holistic study should evaluate common architectural shapes and proportions to ensure they align with the Green Architectural principles for specific locations. This manuscript compares eight rectangular classrooms with different external-to-internal wall proportions and window-to-wall ratios (WWR) to determine their suitability for Taif City, KSA schools. The case studies include variations in window sizes (10.5 m2 and 14 m2) and orientations (North and South), providing a comprehensive evaluation of their impact on human comfort. Simulation results reveal that the common classroom proportion did not yield the highest green credits, suggesting it may not be optimal for all regions, including Taif City. The findings emphasize the need to reconsider standard classroom dimensions to better align with local environmental conditions and Green Architecture principles, contributing to the broader goals of sustainability and sustainable development in educational infrastructure.

1. Introduction

Sustainable development in educational infrastructure is critical for fostering environments that support both student well-being and environmental conservation. Sustainable development requires the integration of Green Architectural principles, which emphasize the optimization of environmental functions such as thermal, visual, and acoustic comfort while minimizing energy consumption and environmental impact [1,2].
Primary school students spend most of their time in the same classroom, making the classroom environment a critical factor in their academic achievement and engagement. The classroom environment has a greater influence on student progress and learning success compared to other school spaces. Evidence-based classroom design can maximize educational outcomes, and improving student achievement is vital for national development. Scientific research has demonstrated that the physical classroom environment significantly impacts student academic achievement, learning, and motivation. It has also been proven that natural aspects of the physical environment, such as lighting and ventilation, remain a priority despite advancements in artificial alternatives. The geometric form, size, and proportion of classrooms play a key role in controlling the quality of the internal environment, which in turn affects academic performance, student behavior, and attitudes [3,4,5,6,7,8,9,10,11,12]. By optimizing classroom design to align with sustainability principles, learning spaces not only enhance educational outcomes but also enhance environmental functions, contributing to the broader goals of sustainable development [3,5,6,10,12,13].
A study of 153 classrooms in 27 schools identified the main classroom features influencing students’ academic progress. Variations in physical classroom characteristics accounted for 16% of the differences in learning achievements among approximately 4000 students over a year. Natural design factors, such as light, sound, temperature, air quality, and a connection to nature, contributed to about half of the impact on learning. Moving an average student from the least to the most effective classroom resulted in 1.3 sub-levels of progress per year [3,5]. Sapna Cheryan et al. outlined the most important classroom design aspects that influence students’ ability to learn effectively. They found that inadequate lighting, heating, noise, and poor air quality hinder student achievement [6]. Another study of 583 primary school students in Galicia, Spain, found a direct correlation between reduced thermal comfort and lower academic performance in mathematics and art, linking this to indoor environmental features like ventilation, room size, and views [10]. Further study on seating positions and arrangements in primary classrooms in Kenya from 2002 to 2005 demonstrated that students in front rows gained 5% to 27% more in learning compared to those seated further from the board [12]. This highlights the importance of classroom layout in enhancing student engagement and academic performance.
Teachers are also significantly affected by classroom geometry. They must make critical decisions on how to organize the classroom to maintain order, engage students, and foster collaboration. This is a major challenge for teachers and a key factor in job dissatisfaction across countries. Classroom management relies heavily on architectural decisions, as the shape and size of the classroom determine seating arrangements, the number of students who can sit close to the teacher, and the level of student interaction during the school day. An additional study. found that classroom design influences both academic development and social functioning, as it affects students’ physical distance from each other and their teacher [7].
A study on classroom geometry in China examined its impact on annual energy use and summer thermal discomfort. It analyzed some parameters such as orientation, shape, room depth, and window-to-wall ratio (WWR) using the DesignBuilder software (https://designbuilder.co.uk/) and a questionnaire to assess students’ subjective preferences. The findings revealed that shallow classrooms, despite their advantages in maximizing natural lighting and ventilation, had higher energy consumption and lower thermal comfort compared to deeper classrooms. This is primarily due to the larger external wall area exposed to solar radiation, which results in greater heat gain. In contrast, deeper classrooms with higher WWR (30%, 40%, 50%, and 60% for 6 m, 8 m, 10 m, and 12 m depths, respectively) achieved better thermal performance by reducing direct solar exposure and promoting controlled ventilation. Increasing the window size in deeper rooms compensated for the additional demand for artificial lighting caused by greater room depth, as more artificial lighting lead to higher energy consumption and internal heat gain. Larger windows also enhanced indoor ventilation, reducing summer discomfort. Consequently, the study concluded that deep classrooms with an 8 m depth offered greater potential for achieving both thermal and energy efficiency improvements compared to other alternatives [11]. These findings are particularly relevant for regions with extreme climates, where balancing natural lighting, ventilation, and thermal comfort is critical.
Additionally, while natural ventilation is a key advantage of shallow classrooms, it may not always be sufficient to maintain thermal comfort in hot climates. For instance, a study found that in Taif City, classrooms with larger windows and higher WWR (as seen in deeper classrooms) could achieve better thermal comfort by promoting cross-ventilation and reducing the need for mechanical cooling. However, this comes at the cost of increased glare and potential over-illumination, which can negatively impact visual comfort [13].
The importance of evaluating the influence of different variables on environmental functions to ensure their maximum achievement without conflict has been emphasized in some studies [14]. This is particularly relevant in the context of classroom design, where trade-offs between thermal, visual, and acoustic comfort necessitate a holistic approach. For instance, a study in Taif City examined the relationship between thermal and visual comfort after implementing window design recommendations. The study found that while shallow classrooms offer advantages in natural lighting and ventilation, their thermal performance in hot climates like Taif City can be suboptimal, leading to higher energy costs for cooling and discomfort for occupants. This highlights the need for region-specific design strategies that carefully balance conflicting environmental functions, such as adjusting window designs to achieve both thermal and visual comfort. These findings underscore the importance of considering the unique climatic and environmental characteristics of the location when designing classrooms [15].
The design of educational spaces, particularly classrooms, involves a complex interplay of multiple environmental functions, including physical (thermal, visual, and acoustic), physiological (circadian rhythms and color temperature), and psychological (users’ preferences and links to nature) comfort. Each of these functions contributes to the overall well-being and academic performance of students, yet they often present conflicting requirements. For instance, maximizing natural light through larger windows can enhance visual comfort and linkage to nature, but may lead to increased solar heat gain, compromising thermal comfort, especially in hot climates [11,13]. Similarly, while natural ventilation can improve indoor air quality and thermal comfort, it may also introduce external noise, negatively impacting acoustic comfort [8,16]. These trade-offs necessitate a holistic approach to classroom design, where the interplay between different environmental functions is carefully balanced to achieve optimal performance [14,15].
Therefore, indoor environmental quality (IEQ) in educational buildings has been widely studied, with a growing emphasis on holistic and comprehensive evaluation methods. Recent study on IEQ assessment proposed a multicriteria method for identifying and ranking IEQ criticalities in existing school buildings. The used approach integrates subjective investigations to assess four key environmental functions: thermal comfort, indoor air quality, acoustics, and lighting. By applying this method to university classrooms, the authors highlighted the importance of weighting schemes in determining the most critical IEQ factors. This approach aligns with the need for holistic IEQ assessments to enhance student well-being and academic performance [17]. Similar work proposed an innovative approach to IEQ assessment during the design stage of school buildings, emphasizing the integration of thermal, acoustic, visual, and air quality factors to optimize energy consumption and occupant comfort. This work highlighted the need for predictive models and weighting schemes to assess IEQ [18]. Another study developed a multi-criteria method for assessing lighting quality in educational rooms, using the Analytic Hierarchy Process (AHP) to assign weights to various lighting criteria. The findings underscored the importance of considering factors such as luminance distribution, glare, and daylight availability to achieve adequate visual comfort, which is particularly relevant in classroom environments where student performance and well-being are closely tied to lighting conditions [19].
A Comprehensive review of IEQ performance indicators emphasized the integration of thermal, acoustic, visual, and air quality factors to assess overall comfort and productivity in indoor environments. This work highlights the need for multi-dimensional approaches to IEQ evaluation [20]. Similarly, a weighting scheme for IEQ assessment was proposed, emphasizing the role of occupant preferences and contextual factors in determining the relative importance of different IEQ parameters. Its findings suggest that tailored weighting schemes can significantly improve the accuracy and relevance of IEQ evaluations, particularly in classroom environments where student performance and well-being are closely tied to environmental conditions [21]. Recent work advances this discussion by reviewing the impact of IEQ on cognitive functions, emphasizing the need for dynamic weighting schemes that reflect real-time data and occupant feedback. The approach provides a robust methodology for capturing the complex interplay of IEQ factors, offering valuable insights for the development of comprehensive evaluation tools [22].
The growing interest in Green Architecture has led to the development of Green Building Rating Systems (GBRSs), which assess buildings based on their environmental performance. The success of green buildings is measured by their ability to achieve high levels of environmental functions, especially IEQ-related functions, such as thermal, visual, and acoustic comfort [1,23].
General classroom proportions, as defined by architectural standards, have been established through extensive studies that address the common needs of schools and their users. These standards typically favor a shallow rectangular classroom design, where the longer side serves as the external facade. This design is intended to maximize natural light, which is a critical factor in educational environments [8,24,25]. For instance, Neufert’s Architect’s Data, a widely recognized architectural reference, recommends shallow rectangular classrooms with a width-to-length ratio of approximately 1:1.5 to 1:2, as this configuration optimizes daylight penetration and ensures adequate illumination for students [24]. Similarly, the Time-Saver Standards for Building Types emphasize the importance of shallow rectangular classrooms, noting that such proportions facilitate better natural ventilation and visual comfort, particularly in educational settings where student performance is closely tied to environmental conditions [25].
In Saudi Arabia (KSA), rectangular classrooms commonly adhere to this proportion, as evidenced by various school prototype designs developed by the Ministry of Education [13,26,27,28,29,30,31]. However, while this design has been widely adopted, it may not always align with the evolving principles of GBRSs, which emphasize a holistic approach to environmental performance rather than focusing on individual functions.
This manuscript investigates the impact of external-to-internal wall ratios on indoor environmental quality in Taif City, KSA, using both the local Mostadam GBRS [2] and the globally recognized Leadership in Energy and Environmental Design (LEED) GBRS [1] systems. The study reveals that the common shallow classroom proportion may not be the most effective choice for achieving holistic environmental functions in Taif City, KSA. Taif City has a generally moderate climate. The city experiences warm to moderate temperatures in spring and autumn, and moderate to cold winters. Summers are characterized by hot weather, with daytime temperatures often rising to moderately high levels, but the overall climate remains moderate due to the city’s high altitude [13,32].
Several case studies with deeper proportions demonstrated higher overall environmental performance compared to the traditional shallow designs. These findings suggest that the Ministry of Education in KSA should reconsider the standard classroom dimensions and identify the most suitable rectangular proportions for new school constructions, ensuring alignment with Green Architecture principles and environmental sustainability.
The study underscores the importance of optimizing classroom design to enhance indoor environmental performance, which in turn can lead to improved student academic achievement. However, it is important to note that the results may vary across different regions, even within KSA, due to the unique climatic and environmental characteristics of each location. Therefore, region-specific adjustments to classroom design are essential to achieve the best possible outcomes in terms of environmental efficiency and student well-being. By evaluating the external-to-internal wall ratios of rectangular classrooms, this research aims to identify design strategies that maximize environmental efficiency while minimizing conflicts with human comfort functions. The findings will provide valuable insights for architects and policymakers in designing classrooms that are not only energy-efficient but also conducive to learning and well-being in Taif City and similar climatic regions [13,15]

2. Materials and Methods

Eight case studies with different and similar aspects were compared analytically. These case studies represent rectangular classrooms with varying external-to-internal wall ratios, window-to-wall ratios (WWRs), and window dimensions. The following sections provide details on the materials, information, and study methods used.

2.1. Software and Electronic Tools Used in the Study

Several simulation programs and tools were employed in this study. The DesignBuilder software version 7 was used for thermal simulations of case studies. DIAlux Evo software version 12 was utilized to predict indoor light levels based on space and location characteristics. The Climate Consultant software version 6 provided basic thermal information about Taif City. Additionally, online tools such as the reverberation time calculator and the Internal Noise Calculator were used to estimate internal noise levels. The Center for the Built Environment (CBE) Thermal Comfort Tool was applied to assess compliance with thermal comfort standards, and the GAISMA sun path diagram tool was used to determine sun angles in Taif City.

2.2. Study Location

Taif City, KSA, was selected for the case studies due to its relatively young population and unique climate. Approximately 87% of the 7.7 million students in KSA attend public schools [9]. Taif City is located 1,700 m above sea level, giving it a distinct climate characterized by warm to moderate temperatures in spring and autumn, hot summers with average daytime temperatures in the mid-30s (°C), and moderate to cold winters [13,32]. The primary focus of thermal comfort in classrooms is on heat gain during the summer, as other seasons are less problematic. In Taif City, the comfort zone is defined by temperatures ranging between 20 °C and 23.9 °C at relative humidity levels of up to 50%. Furthermore, by excluding the three-month summer vacation period—when schools are unoccupied—from the annual temperature analysis, the mean temperature was found to align closely with the comfort zone, ranging from 15 °C to 27 °C [33]. According to the psychrometric chart, the Climate Consultant software showed that 66.7% of the total hours in a year fall within the comfort zone, even when using only passive and natural solutions. The remaining hours outside the comfort zone occur mainly during the summer, which can be minimized by considering the non-occupied summer vacation period in schools [15,32,33]. This finding underscores the potential for achieving thermal comfort in Taif City through passive strategies, such as natural ventilation and shading, without the need for extensive mechanical cooling systems. Figure 1 shows the resulting psychrometric chart using the Climate Consultant software and Taif City’s weather file.

2.3. Common Rectangular Classroom Ratio in the Study Location

Classroom capacity influences the shape and seating arrangement. Architectural standards for rectangular classrooms with a capacity of 24 students generally avoid deep ratios. The most commonly used classroom proportions, as defined by architectural standards, typically follow a width-to-length ratio of 2:3 or 3:4 (ranging from 1:1.5 to 1:2), with the longer side serving as the external facade. This design is widely recommended to optimize natural lighting and ventilation, which are critical factors in educational environments. For instance, Neutfert’s Architect’s Data (reference [24]), a widely recognized architectural reference, suggests that shallow rectangular classrooms with these proportions facilitate better daylight penetration and ensure adequate illumination for students. Similarly, the Time-Saver Standards for Building Types (reference [25]) emphasize the importance of such proportions, noting that they enhance natural ventilation and visual comfort, particularly in educational settings where student performance is closely tied to environmental conditions.
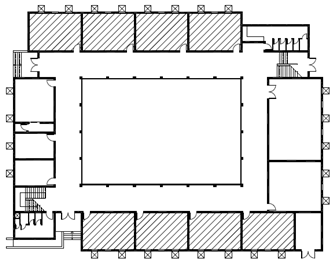
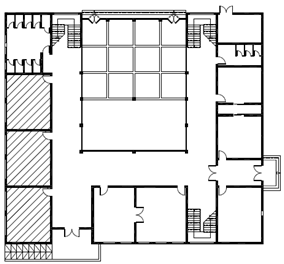
In KSA, these proportions are commonly adopted in school designs, particularly in primary schools where 24-student classrooms are standard. The rectangular shape is the most prevalent, and the Ministry of Education has developed 14 prototype school building designs that are replicated across cities and towns. These prototypes adhere to the typical external-to-internal wall proportions, with classrooms generally featuring a width-to-length ratio ranging from 1:1.15 to 1:1.55 and a standard height of 3.5 m, as specified by the Ministry of Education [13,27,28,29,30,31]. Table 1 presents four school prototypes from KSA, illustrating the common classroom proportions. This manuscript argues that the common rectangular classroom proportion in Taif City, KSA, should be reconsidered based on its specific environmental characteristics.

2.4. Description of Case Study Parameters

This study analyzed eight case studies to explore the impact of room and window dimensions, ratios, and orientations on simulated outcomes. Each case study features a room with dimensions of either 8 m by 6 m or 6 m by 8 m, resulting in a consistent room area of 48 m2. The window dimensions vary, with widths ranging from 5 m to 7 m and heights from 2 m to 2.5 m, leading to window areas of either 10.5 m2 or 14 m2. The window-to-wall ratio (WWR) is either 37% or 50% across the cases. Cases 1 and 5 have different external-to-internal wall ratios compared to the other cases. The window orientation is split, with Cases 1, 2, 3, and 4 facing North, while Cases 5, 6, 7, and 8 face South. Cases 1, 3, 5, and 7 share the same window area of 10.5 m2, and Cases 1, 2, 4, 5, 6, and 7 have a WWR of 50%. Cases 1, 2, 5, and 6 also feature the maximum available window height of 2.1 m or 2.5 m. These variations provide a comprehensive basis for evaluating the influence of different architectural parameters. More detailed information about the case studies is provided in the next section.

2.5. Indoor Environmental Functions Under Study

Students spend most of their time at school, and the physical environment significantly impacts their learning and behavior. Therefore, regardless of the chosen classroom shape and dimensions, minimal adequacy levels of physical environment elements must be guaranteed [4,6,7]. The presence of windows is particularly important, as recent studies have shown a positive correlation between windows and student engagement [16]. Research has also emphasized the value of outdoor views and their effect on students’ anxiety levels, behavior, and mood. Windowless classrooms negatively impact students’ health and well-being, as no artificial systems can fully replace fresh air and sunlight. These findings are supported by well-conducted studies that are reliable, long-lasting, and difficult to alter [3,5,8].
For designers, reducing conflicts between different environmental functions is a key objective. For example, maintaining both thermal and visual comfort in an interior space using the same window can be challenging, as their requirements may differ or even conflict. To achieve multiple incompatible functions, designers may employ available technologies to resolve such conflicts. Solutions should range from simple to more advanced technological approaches to ensure that the majority of environmental functions are achieved over the longest possible duration. The indoor environmental functions related to human needs include physical, chemical, physiological, psychological, and radiological balance. Physical comfort is achieved when thermal, visual, and acoustic conditions are balanced, allowing individuals to perform tasks without stress. To achieve chemical, physiological, psychological, and radiological balance, buildings should provide natural ventilation and a link to nature [14,34]. These functions are discussed in detail in the following sections.

2.5.1. Visual Comfort in Classrooms: Metrics and Academic Outcomes

Visual comfort in classrooms is influenced by various factors. Lighting quality in educational rooms can be assessed using five lighting criteria and 15 sub-criteria, each with specific indicators. The ranking of these criteria and sub-criteria can be based on their global weights, reflecting their relative importance in influencing visual comfort. The glare criteria, which have the highest impact, include sub-criteria such as discomfort glare, overhead glare, and daylight glare. The amount of light criteria, the next most impactful, include sub-criteria such as illuminance, illuminance uniformity, and luminance distribution. The healthiness criteria include daylight availability, flicker effects, and circadian effects. The flexibility criteria include lighting scenes, adjustment of luminous flux, and adjustment of correlated color temperature. The least impactful criteria, color appearance, include color rendition, color temperature, and surface treatments. Glare (especially daylight glare) and luminance distribution are the most critical factors affecting visual comfort in educational rooms. Daylight availability and lighting flexibility also play significant roles in ensuring visual comfort. Color appearance factors, such as color temperature and rendition, have the least impact compared to other factors. This ranking can guide improvements in lighting design, focusing on the most impactful factors to enhance visual comfort in educational environments [17,19].
The manuscript focuses on specific performance indicators that address the most significant lighting criteria and sub-criteria, including optimal viewing angles, adequate illuminance levels for specific visual tasks, effective glare control, and appropriate color temperature. By addressing these indicators, educational environments can enhance both the visual comfort and overall well-being of students and teachers, ultimately supporting better academic outcomes. These indicators are critical for ensuring optimal visual comfort in classrooms, as outlined below:
  • Viewing Angles and Sight Lines: Visual comfort is influenced by the physical arrangement of the classroom, particularly the angles of sight and viewing distances. The shape and seating arrangement should ensure that all students have a clear view of the teacher and visual materials, such as whiteboards or projection screens, without obstructions. Optimal visual comfort ensures that students can see details clearly without excessive head or eye movement [35,36,37]. Eye contact between students and teachers is another important factor in maintaining engagement and communication. Classrooms should be designed to facilitate this interaction, ensuring that seating arrangements allow for direct lines of sight between students and the teacher [35,36].
  • Illuminance Levels: Visual comfort is closely tied to the ability of students and teachers to perform specific visual tasks, such as reading from a book, writing on paper, or viewing a whiteboard. These tasks require adequate illuminance levels to ensure clarity and reduce eye strain. Studies have shown that higher quantities of natural and artificial light improve student outcomes, provided there is no direct sunlight. Both natural and artificial light are essential for achieving sufficient brightness in the classroom [3,5,8].
    Natural lighting is generally preferred for its positive impact on student performance and well-being. The window-to-wall ratio (WWR), which measures the proportion of window area relative to the wall area, plays a critical role in controlling the Daylight Factor (DF). The DF quantifies the amount of natural light available indoors compared to the light outside. A well-designed WWR ensures sufficient daylight penetration, which has been associated with optimal learning outcomes. For example, natural light from large windows has been shown to significantly influence science and reading vocabulary test scores in elementary schools. Studies have demonstrated that students in classrooms with ample daylight perform better in subjects like math and reading, with progress rates up to 20% higher compared to those in poorly lit environments [3,5,6,31]. However, the design must ensure that natural light is evenly distributed and does not create glare or shadows, which can negatively affect visual comfort. Uniform light distribution is also crucial, as uneven lighting can create shadows or bright spots, hindering visual performance [19]. For instance, natural light should ideally come from the student’s left side, as most students write with their right hand, and light coming over their right shoulder may be blocked by their arm [8].
    While natural lighting is highly beneficial, high-quality artificial lighting can serve as a viable alternative when natural light is insufficient. Additionally, the controllability of lighting, whether natural or artificial, is important for both teacher and student outcomes, allowing adjustments to suit specific tasks and preferences [3,5,16,25]. The type of illumination system used in classrooms significantly affects learning conditions and visual comfort. For example, the integration of LED lighting, which offers high energy efficiency and controllability, has become increasingly popular in educational settings. LED systems can be tailored to provide optimal illuminance levels and color temperatures, supporting both visual tasks and circadian rhythm regulation. Furthermore, the use of smart lighting controls, such as dimmers and sensors, can help maintain consistent lighting conditions while minimizing energy consumption. These systems not only improve visual comfort but also contribute to a more sustainable and adaptable learning environment [18,19].
  • Glare Control: Glare is a significant factor that can disrupt visual comfort in classrooms. It occurs when there is excessive contrast between bright and dark areas in the visual field, often caused by direct sunlight or reflections from highly reflective surfaces. Glare can be categorized into two types: discomfort glare, which causes visual discomfort without necessarily impairing vision, and disability glare, which directly interferes with the ability to see clearly [19]. Natural sources of light in classrooms, such as the sky, direct sunlight, and the bright walls of adjacent buildings, can contribute to glare. However, excessive direct sunlight in classrooms can cause glaring problems, especially with the widespread use of interactive whiteboards and computer projections. This can lead to excessive brightness and disrupt the recommended balance of light [8].
    To mitigate glare, classrooms should incorporate shading systems, such as blinds or curtains, to control direct sunlight. Additionally, the orientation of windows should be carefully considered to avoid direct sunlight entering the classroom during peak hours. Reflected light on the board can be managed by blacking out windows 1 m from the board. Reflective surfaces, such as whiteboards or glossy desks, should be positioned to minimize reflections that could cause glare. Inclining whiteboards at a slight angle (e.g., 5 degrees) and ensuring that windows are not directly behind the teacher can also help reduce glare and improve visibility [16,25].
  • Color Temperature and Circadian Rhythms: The color temperature of light plays a crucial role in visual comfort and overall well-being. Light with a color temperature between 4000 K and 6000 K is generally recommended for educational environments, as it provides a balance between warm and cool tones, promoting alertness and concentration [19]. However, the impact of color temperature extends beyond visual comfort; it also influences circadian rhythms, which regulate sleep–wake cycles and overall mental health. Natural light, with its dynamic changes in color temperature throughout the day, is particularly effective in reinforcing circadian rhythms. It facilitates a sense of physical and mental comfort due to its soft and diffused quality and its subtle changes in value and color. Bright daylight is a powerful mood enhancer, an activator of mental performance, and an effective treatment for depression [3,15,25,31]. However, in the absence of sufficient natural light, artificial lighting systems should be designed to mimic these natural variations. Studies have shown that dynamic lighting systems, which allow for adjustments in light intensity and color temperature, can enhance students’ concentration and performance. For instance, lighting systems that mimic natural daylight variations have been found to improve alertness and reduce fatigue, particularly during long periods of study. Moreover, the vertical illuminance at eye level is another critical parameter that influences circadian rhythms. Adequate vertical illuminance ensures that light reaches the eyes effectively, helping to regulate melatonin production and maintain a healthy sleep–wake cycle [18,19].

2.5.2. Thermal Comfort in Classrooms: Metrics and Academic Outcomes

Thermal comfort plays a significant role in student performance and achievement. Studies have shown that appropriate thermal conditions can lead to a 12% improvement in student achievement, with some research indicating an even higher impact of 16% [32]. For students aged 10 to 12 years, performance and speed in numerical and language tests significantly improved when thermal comfort was optimized by reducing the temperature from 25 °C to 20 °C and increasing ventilation rates. Additionally, students performed better in environments where temperature control was easily adjustable. Conversely, inappropriate thermal conditions can negatively affect both student and teacher outcomes [3].
School hours often coincide with peak solar heat gain during midday, making thermal comfort a critical concern. Students near windows are particularly affected, as they are more exposed to external temperature fluctuations and surrounding surfaces [6]. To enhance student achievement and task performance, the recommended temperature range is 21 °C to 28 °C, though this can vary depending on regional climate, season, activity type, heat sources, humidity, occupancy density, and individual preferences [4,5]. Students generally prefer moderate airspeed, which does not disturb papers, achieved through open windows, doors, or ceiling fans [4,16]. However, any thermal comfort intervention must ensure adequate ventilation. Heating systems that recycle indoor air without introducing fresh air are not recommended, as they can compromise indoor air quality. Thermal control systems are therefore emphasized for maintaining comfort [16].
To simplify the evaluation of thermal comfort, comprehensive indicators such as the Predicted Mean Vote (PMV) and Predicted Percentage Dissatisfied (PPD) are widely used. The PMV index predicts the average thermal sensation of a group of people on a scale from −3 (cold) to +3 (hot), with 0 representing thermal neutrality. The PPD index estimates the percentage of people likely to feel dissatisfied with the thermal conditions, even when the PMV is close to neutral. These indicators are based on factors such as air temperature, mean radiant temperature, air velocity, humidity, clothing insulation, and metabolic rate, providing a holistic approach to assessing thermal comfort. These metrics can guide the design and optimization of classrooms to ensure thermal conditions conducive to learning and productivity [19].

2.5.3. Acoustic Comfort in Classrooms: Metrics and Academic Outcomes

Acoustic comfort in classrooms is essential for ensuring optimal conditions for speech intelligibility and student performance. It involves managing both external and internal noise levels to create an environment conducive to learning. Poor acoustic conditions can lead to students missing or misinterpreting teachers’ instructions, feeling distracted or distressed, and experiencing reduced patience and focus. To address these issues, architectural acoustics focuses on two key aspects: sound insulation and sound absorption. Sound insulation refers to the ability of walls, windows, and other building elements to block unwanted noise from external or adjacent environments. This is critical for reducing background noise, which can interfere with the teacher’s voice and disrupt learning. A high signal-to-noise ratio (SNR), which compares the teacher’s voice to the background noise, is essential for clear speech perception [8,16]. Studies have shown that students perform significantly worse on tasks like reading comprehension when exposed to external noise sources such as aircraft or road traffic [6,16,25,38]. Effective sound insulation ensures that classrooms are protected from these external noise sources, creating a quieter and more focused learning environment [5,38].
Sound insulation refers to the ability of walls, windows, and other building elements to block unwanted noise from external or adjacent environments. This is critical for reducing background noise, which can interfere with the teacher’s voice and disrupt learning. A high signal-to-noise ratio (SNR), which compares the teacher’s voice to the background noise, is essential for clear speech perception. Studies have shown that students perform significantly worse on tasks like reading comprehension when exposed to external noise sources such as aircraft or road traffic. Effective sound insulation ensures that classrooms are protected from these external noise sources, creating a quieter and more focused learning environment [5,38].
Sound absorption, on the other hand, deals with the treatment of internal surfaces to control the propagation of sound within the classroom. This is particularly important for managing reverberation time (RT) and improving the Speech Transmission Index (STI). RT measures how long sound echoes in a room, and excessive reverberation can distort speech, making it harder for students to understand the teacher. The STI, which quantifies speech clarity, is influenced by the reflection and absorption properties of internal surfaces such as walls, ceilings, and floors. Proper acoustic treatment of these surfaces using materials with high sound absorption coefficients can significantly reduce RT and improve STI, enhance speech intelligibility, and student performance [3,5,16].
While sound insulation primarily addresses external noise, sound absorption focuses on internal acoustic conditions. Together, they create a balanced acoustic environment that supports both speech clarity and overall comfort. For example, classrooms with high-quality sound insulation but poor internal absorption may still suffer from excessive reverberation, making it difficult for students to hear clearly. Conversely, classrooms with excellent sound absorption but inadequate insulation may still be affected by external noise. Therefore, a holistic approach that combines both aspects is essential for achieving optimal acoustic comfort [5,38].

2.5.4. Ventilation in Classrooms: Metrics and Academic Outcomes

For optimum learning thermal conditions, natural ventilation should be combined with other thermal treatments. Natural ventilation also plays an important role in maintaining indoor air quality (IAQ), which is directly related to students’ health and well-being, leading to better learning progress and reduced absenteeism. Studies have found that students’ attention slows when the air exchange rate is low and carbon dioxide (CO2) levels are high. Poor air quality affects student attendance and teachers’ ability to teach [3,6]. A study showed that increasing ventilation rates led to more accurate responses and improved performance in tasks such as picture memory, color word vigilance, choice reaction, and word recognition. Health difficulties caused by poor IAQ and excess CO2 include drowsiness, inattention, dizziness, headaches, asthma, allergic reactions, and asthmatic symptoms. Although CO2 is not considered a pollutant, it is an indicator of ventilation rates. IAQ is also influenced by the presence or absence of dirt, hygiene, and the reduction in unpleasant odors [4,9,16]. Generally, children are more affected by pollutants due to their higher metabolic and breathing rates. Ventilation can be achieved under different conditions, such as having a large classroom volume or windows of varying sizes and heights [3]. Opening windows in circulation areas can be a solution if external windows are not feasible or to facilitate cross-ventilation. Controlled ventilation allows users to effectively ventilate the classroom under different conditions [5].
The effectiveness of ventilation systems in classrooms is closely tied to the design and type of windows, as well as the ventilation strategy employed. Natural ventilation, facilitated by operable windows, is one of the most common and cost-effective methods to improve IAQ. However, the size, orientation, and placement of windows play a critical role in determining air flow patterns and ventilation rates. For instance, windows positioned at different heights can promote stack ventilation, where warm air escapes through higher openings, drawing in cooler air from lower openings. Cross-ventilation, achieved by placing windows on opposite walls, enhances air exchange by creating a direct airflow path across the room. In cases where natural ventilation is insufficient, mechanical ventilation systems, such as exhaust fans or air handling units, can be integrated to ensure consistent air exchange rates. Hybrid ventilation systems, which combine natural and mechanical methods, offer a flexible solution by adapting to varying weather conditions and occupancy levels. Additionally, the use of advanced window technologies, such as tilt-and-turn windows or automated window controls, can optimize ventilation efficiency while maintaining thermal comfort. Studies have shown that well-designed ventilation systems, supported by appropriate window configurations, significantly reduce CO2 levels, improve IAQ, and enhance cognitive performance among students [17,18,19,20,21,22].

2.5.5. Linking to Nature in Classrooms: Metrics and Academic Outcomes

The loss of psychological connection to nature can lead to a loss of mental balance. Students in primary schools typically spend most of their time in a fixed learning space, and linking to nature helps prevent boredom and monotony. Their mental attention increases when they are surrounded by natural environments. Linking to nature encourages students’ creative writing processes, enhances their interest in problem-solving, promotes social interaction, fosters imaginative play, improves physical and cognitive development, supports weaker learners, and promotes empathy [3,5,16,39]. Thus, placing windows that allow students to easily view the outdoors and bringing the natural environment indoors is an important consideration for learning progress. This connection between students and the natural environment outside the classroom helps them rest their eyes periodically. Looking out the window requires only soft attention, making it easier for students to refocus on their work. Natural variation, influenced by changing environmental conditions over days and seasons, is essential for maintaining this connection. Studies have shown that students score 7% to 18% higher on standard assessments when exposed to external views [31]. Clerestory windows, placed above eye level, can preserve natural light while reducing potential distractions. However, they may also create shifting patterns of light and shade, and shadow lines can form visual barriers, causing distress for some students [8,16]. Classrooms with views of natural elements such as gardens, ponds, plants, and grass are preferable. Windowsills should be positioned below students’ eye level, with no obstructions such as window displays or furniture. Regular window maintenance is also important to ensure a clear visual link between the indoors and outdoors [3,5].

2.6. Verification References for the Environmental Functions Achievement of the Case Studies

To ensure the holistic achievement of environmental functions in the proposed case studies, it is essential to rely on reliable and region-specific verification references. These references were selected from Green Building Rating Systems (GBRSs) used to assess buildings environmentally. Only two systems were chosen for their reliability and relevance: the Mostadam Rating System for non-residential buildings and the globally recognized Leadership in Energy and Environmental Design (LEED) system.
  • The Mostadam Rating System for non-residential buildings is the Environmental Building Rating System for non-residential buildings in KSA. It aligns with the Saudi Building Code (SBC), specifically the architectural part (SBC 201), and incorporates the WELL Standard, which links building features to health and well-being. Mostadam complies with KSA’s legislation, local aspects, and geographical priorities, making it highly relevant for evaluating environmental performance in the region [2,15,32].
  • The LEED system, on the other hand, is considered the most efficient and widely recognized GBRS globally, with significant contributions to environmental building assessments in KSA. It primarily relies on the well-known ASHRAE standards [40], providing a comprehensive framework for evaluating key environmental functions such as thermal, visual, and acoustic comfort, as well as ventilation and linking to nature [15].
By adhering to these standards, the study ensures that the proposed classroom designs meet both local and international benchmarks for environmental performance. These systems provide a robust framework for balancing conflicting environmental requirements, such as the trade-offs between maximizing daylight and minimizing glare or solar heat gain [4,5,6,14,16]. This holistic approach ensures that the best-case study achieves the maximum environmental functions with minimal conflict among them. Figure 2 outlines the criteria for assessing visual, thermal, acoustic, ventilation, and linking-to-nature functions based on Mostadam and LEED systems [1,2].

2.7. The Questionnaire Used in the Study

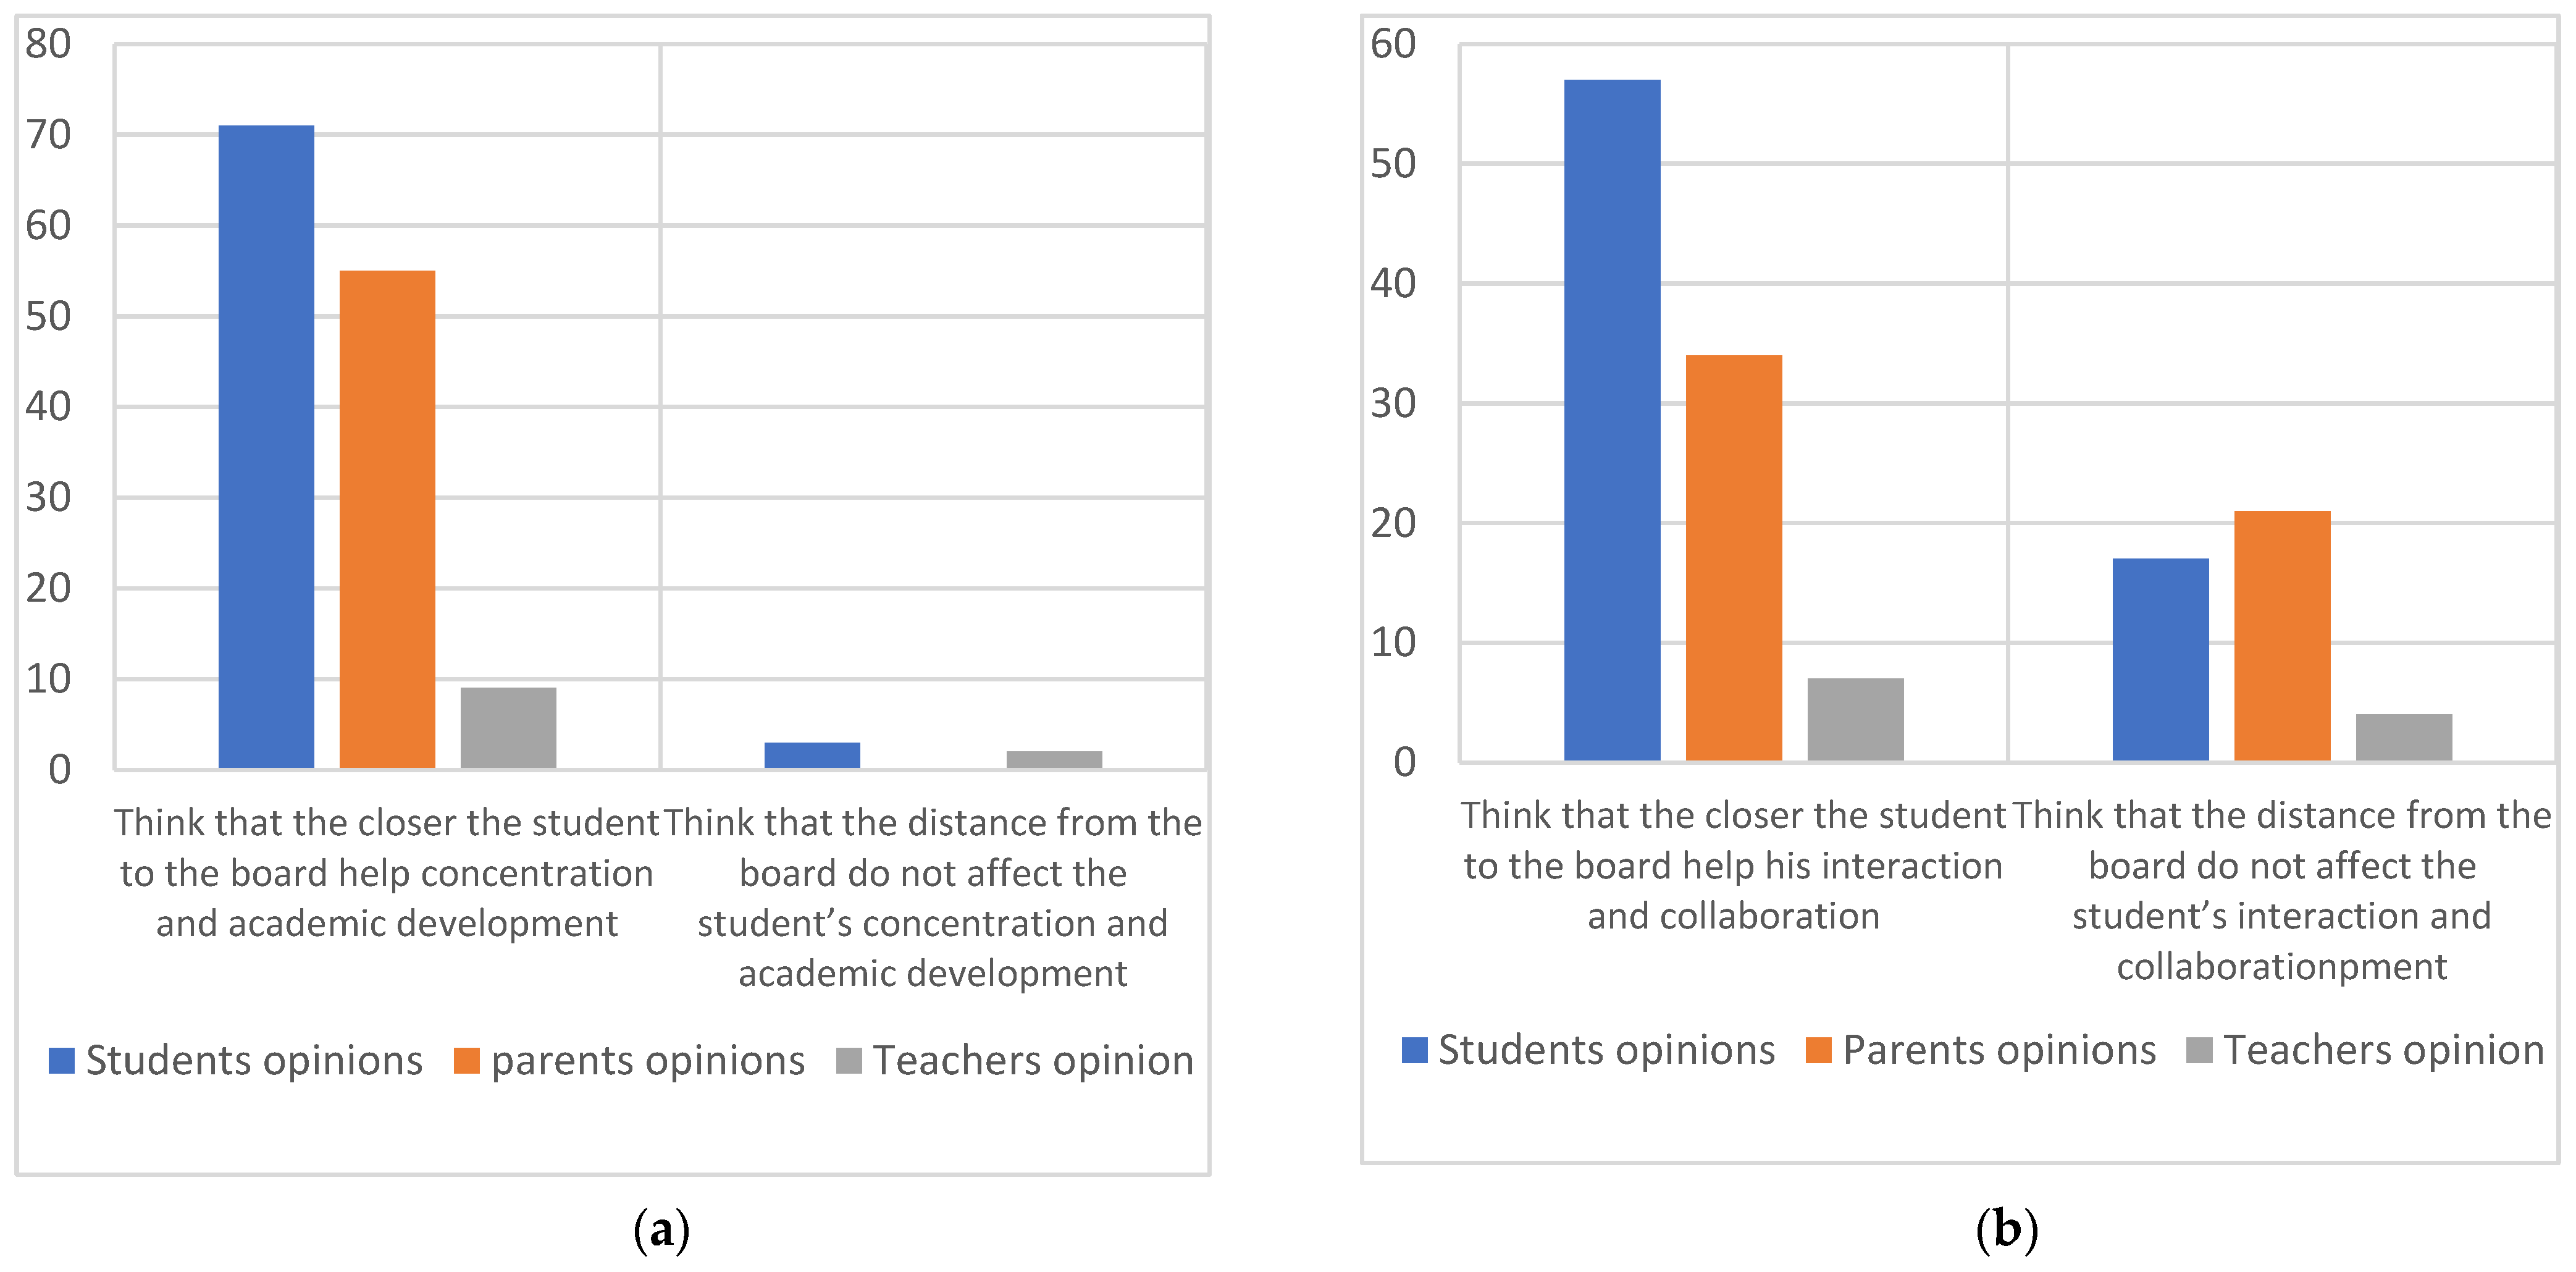
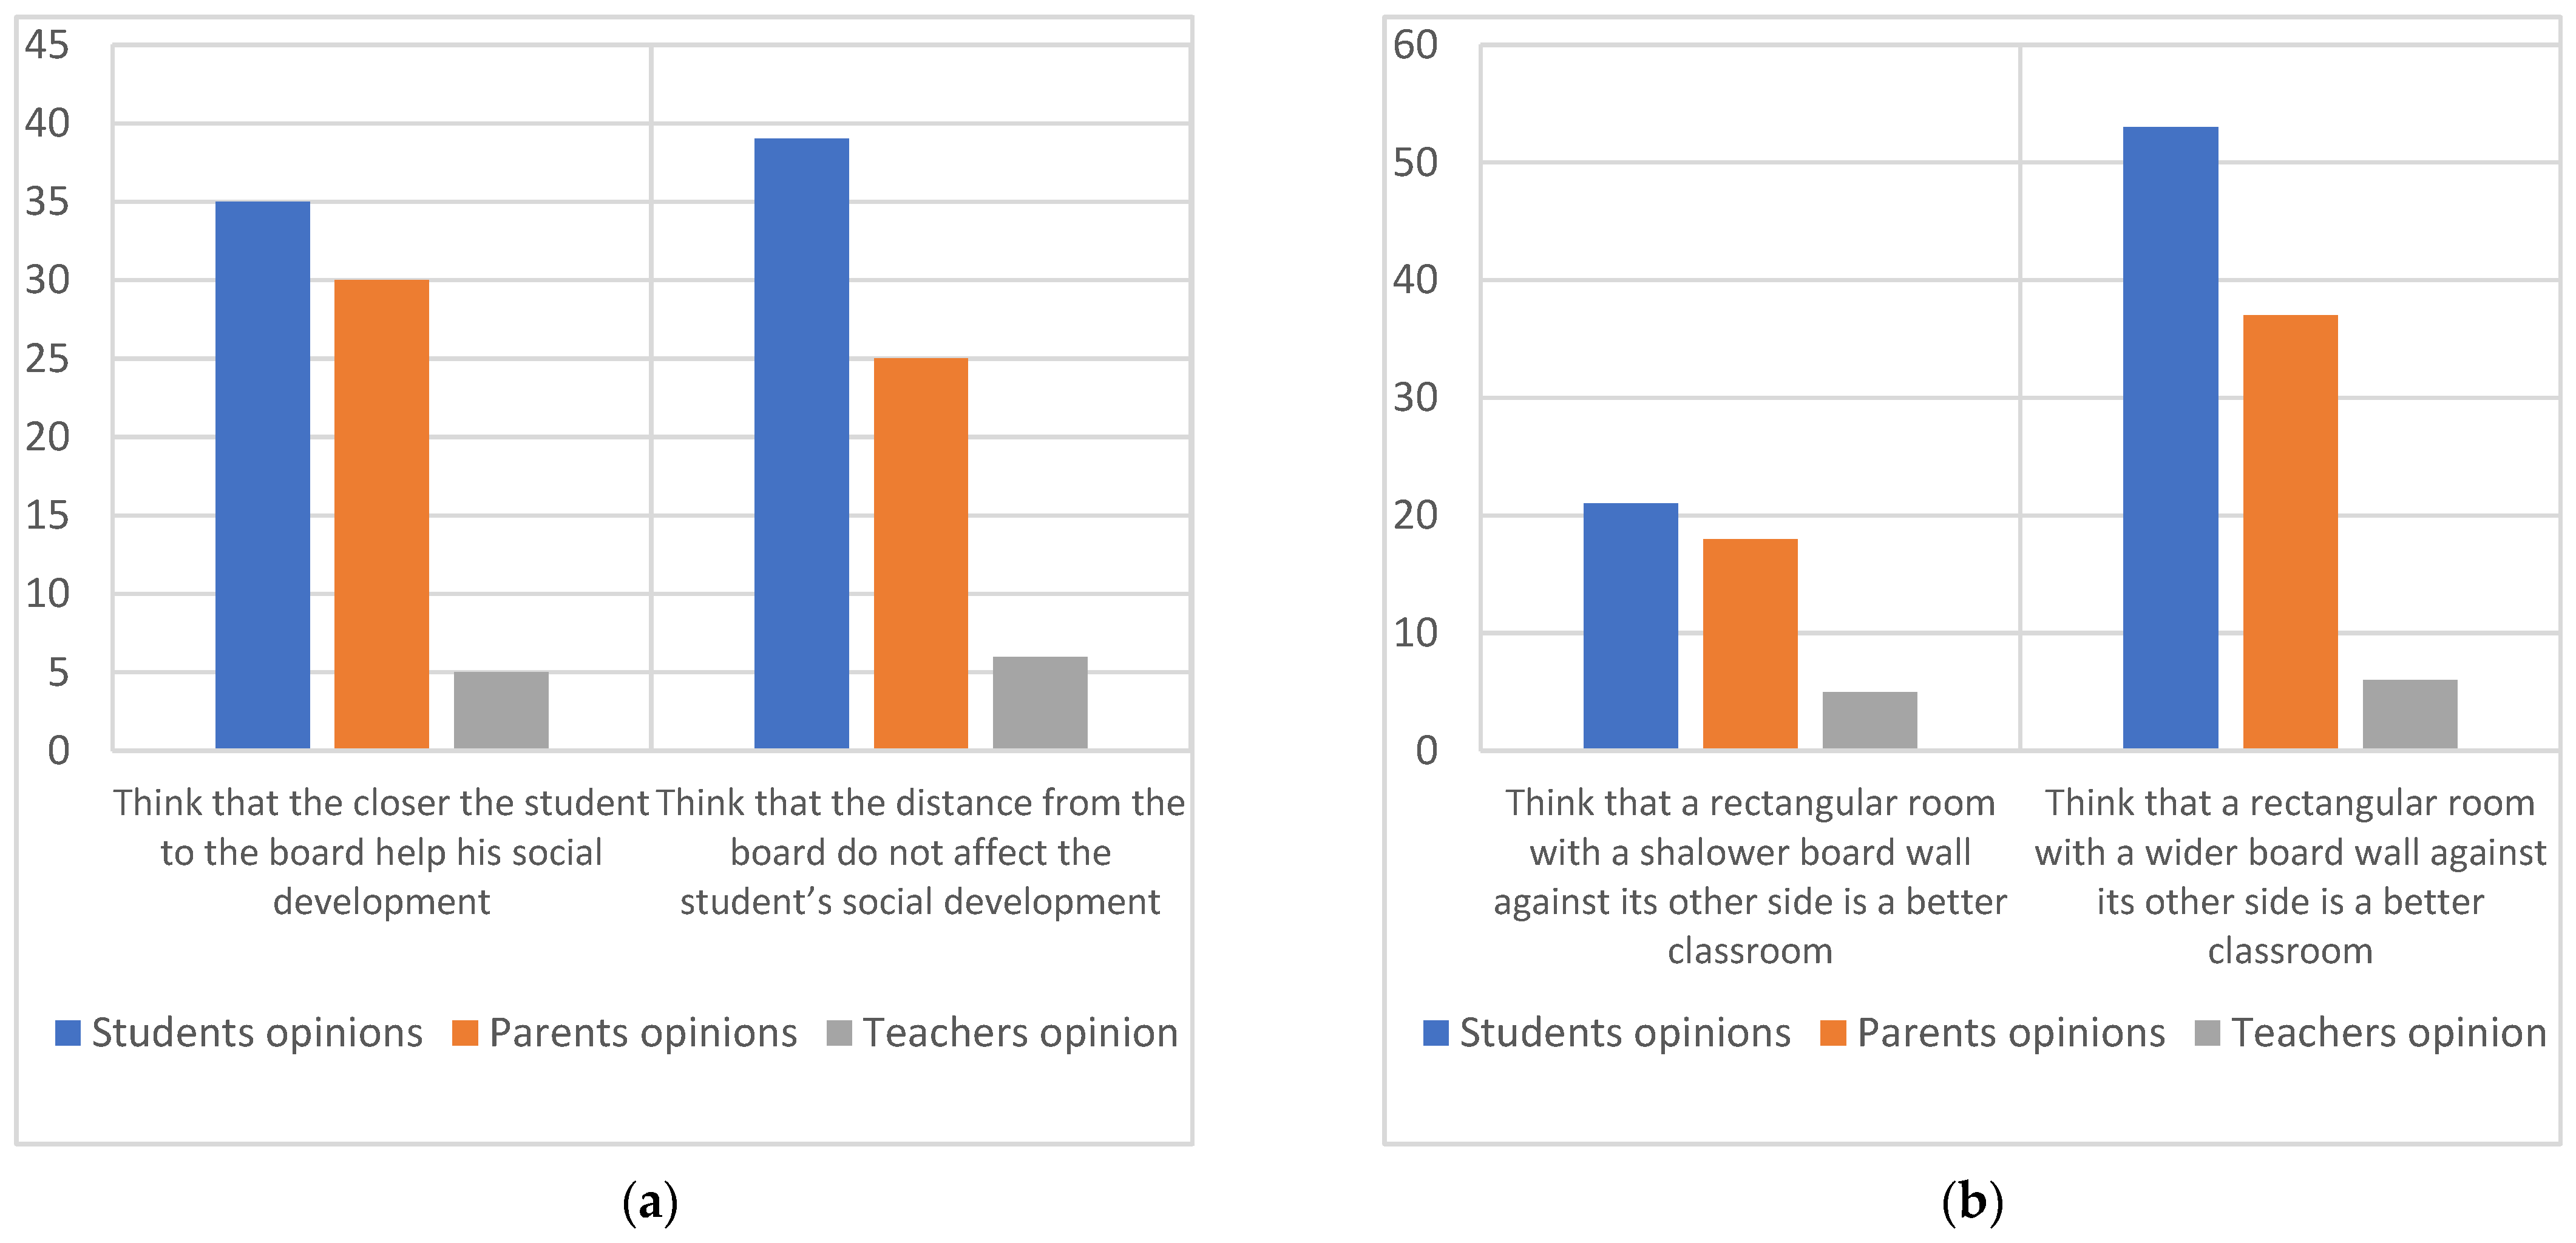
The questionnaire was administered to students from the fourth and sixth grades across three different schools in Taif City. It was distributed in person during school hours by the researcher, with the assistance of school staff. The questionnaire was provided to three groups: students, their teachers, and their parents. Each group received a brief explanation of the study’s purpose and clear instructions on how to complete the questionnaire. Students completed the questionnaire in their classrooms under the supervision of their teachers, while parents and teachers were given the option to complete it at home or in a designated area within the school. The average time to complete the questionnaire was approximately 5–10 min.
The questionnaire was structured and included closed-ended questions, allowing respondents to choose from predefined options. For example:
  • Binary-choice questions: Questions such as “Do you think that being closer to the board helps students’ interaction and collaboration?” with options like “Yes” or “No”.
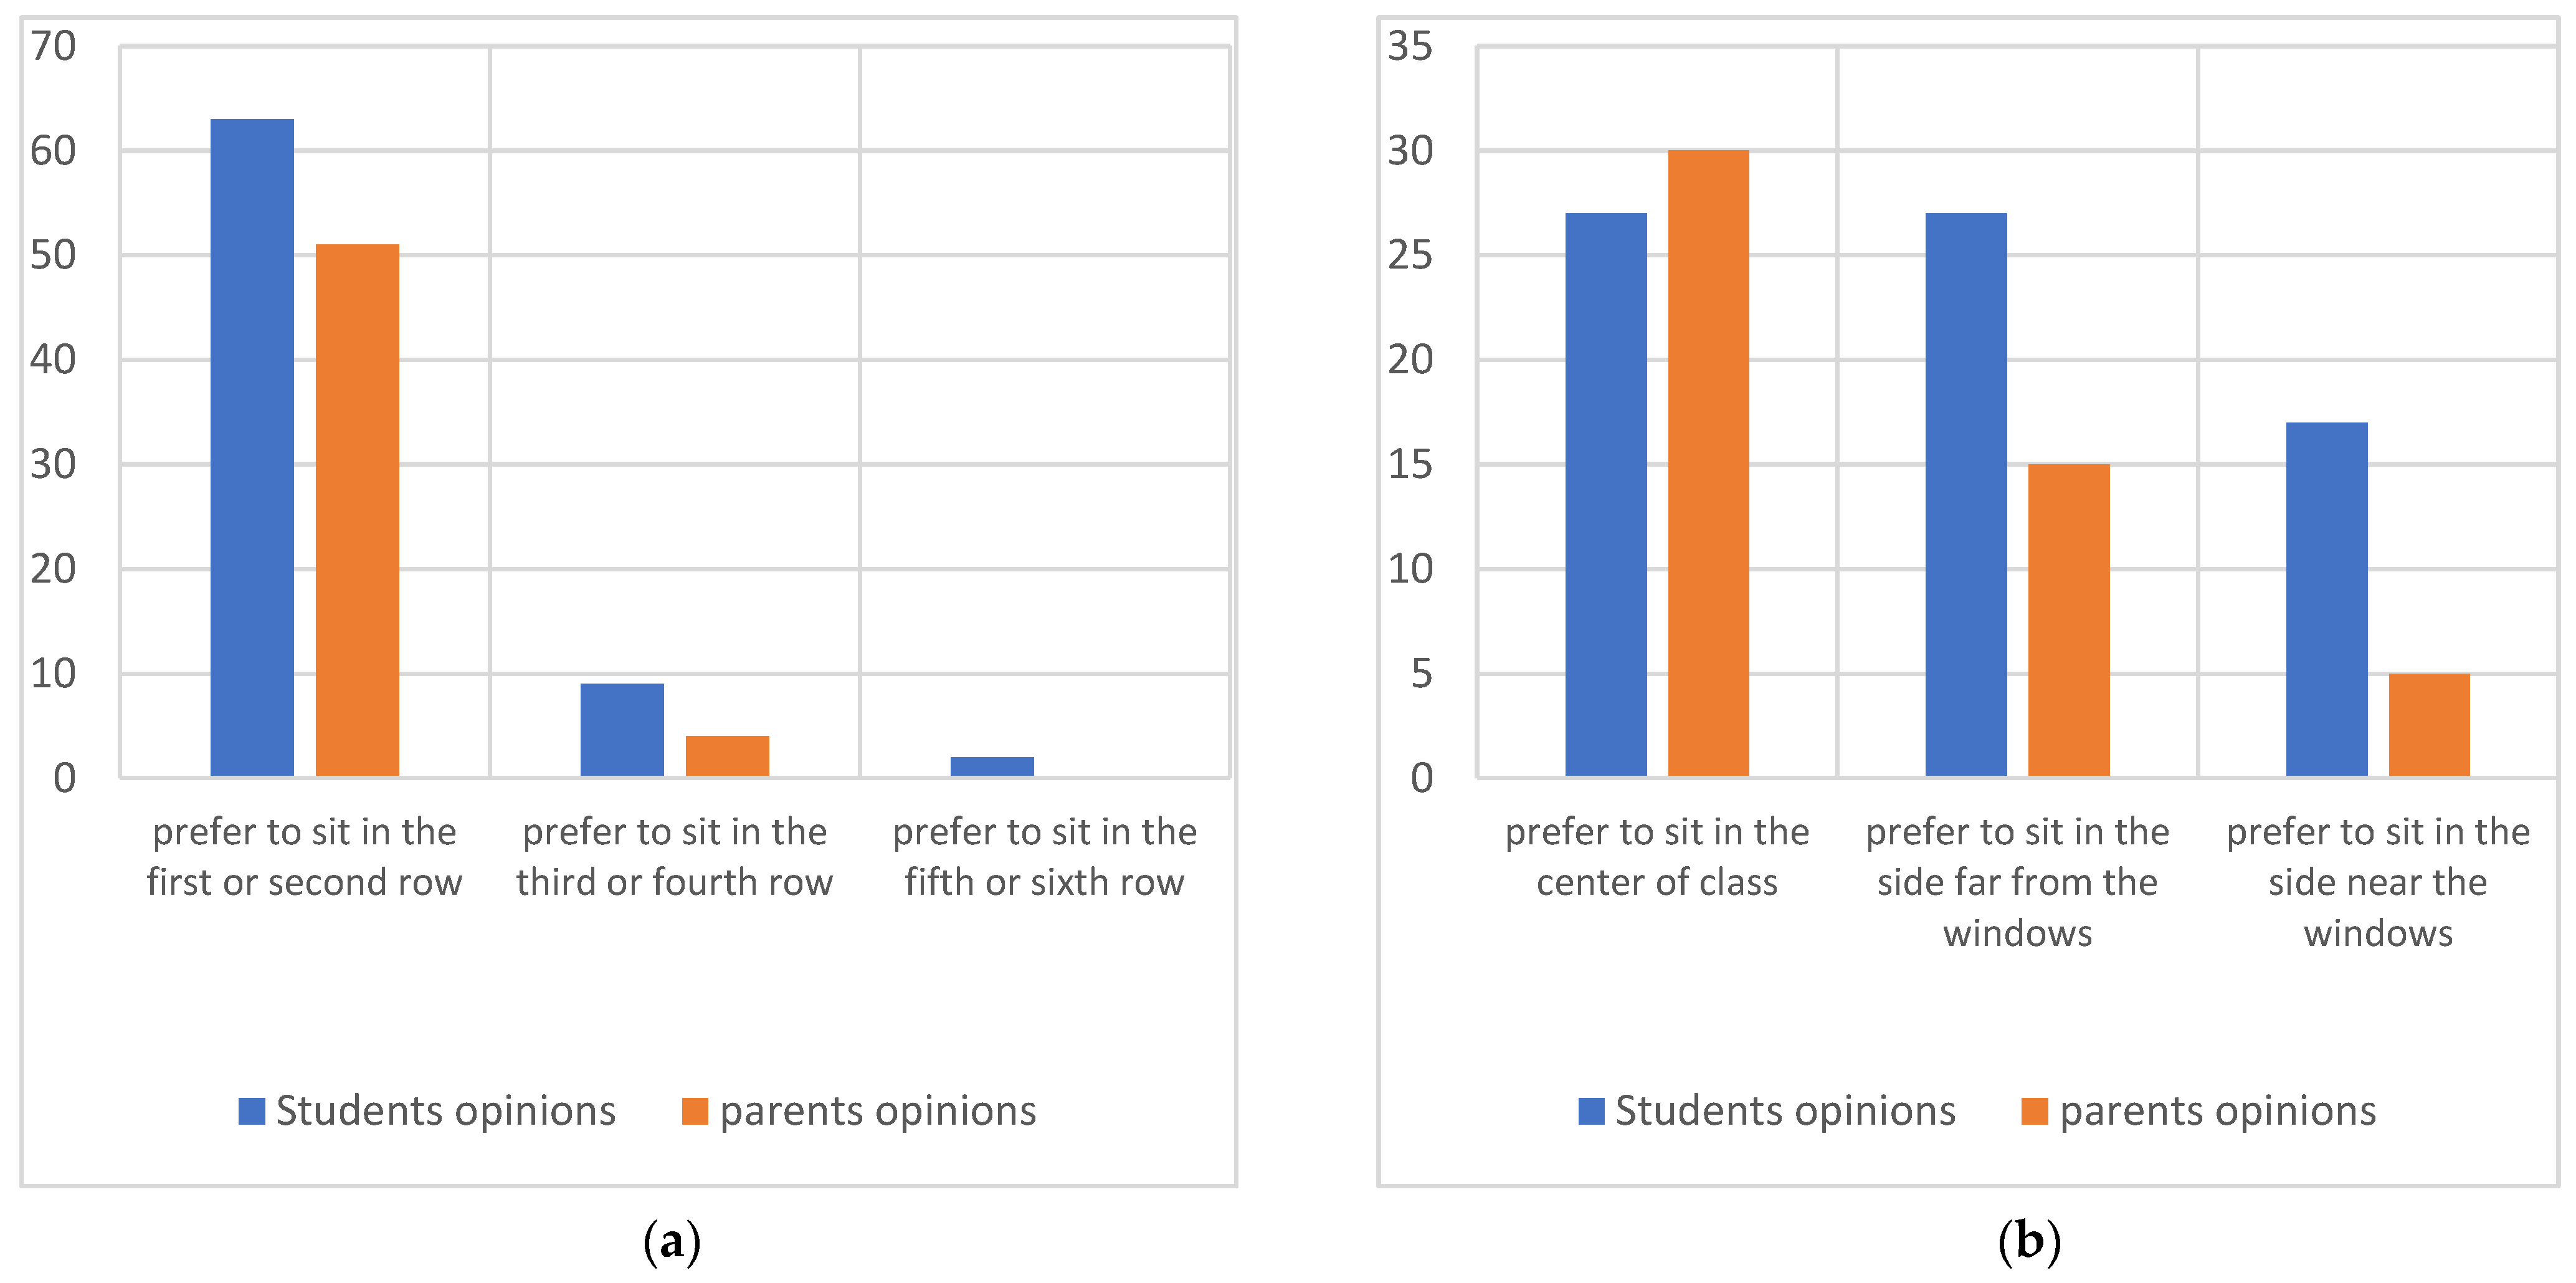
  • Multiple-choice questions: Questions such as “Where do you prefer to sit in the classroom?” with options like “First or second row”, “Third or fourth row”, or “Fifth or sixth row”.
  • Preference-based questions: Questions such as “Which rectangular classroom proportion do you prefer?” with options like “A rectangular room with a shallower board wall” or “A rectangular room with a wider board wall”.
The selection criteria for respondents were as follows:
  • Students: Fourth and sixth-grade students from three schools in Taif City, ensuring a mix of age groups and classroom experiences.
  • Parents: Parents of the selected students, providing insights from a family perspective.
  • Teachers: Teachers from the same schools, offering professional insights into classroom dynamics.
Participation in the questionnaire was entirely voluntary. Respondents were informed about the study’s purpose and assured of the confidentiality of their responses. They were free to withdraw at any time without any consequences. All responses were collected anonymously and recorded manually for further analysis.
The overall response rate was 63.6%. Out of the 220 questionnaires distributed (100 to students, 100 to parents, and 20 to teachers), 140 complete responses were received (74 from students, 55 from parents, and 11 from teachers).

2.8. Step-by-Step Methodology

The evaluation of the case studies was conducted using the Mostadam and LEED rating systems, which provide comprehensive frameworks for assessing environmental performance in buildings. Figure 3 presents a framework flow chart of the activities carried out in the manuscript. The following steps outline how these criteria were applied:
  • Selection of Environmental Functions:
    The study focused on five key environmental functions: visual comfort, thermal comfort, acoustic comfort, ventilation, and linking to nature. These functions were selected based on their relevance to classroom environments and their inclusion in both Mostadam and LEED standards.
  • Definition of Performance Indicators:
    For each environmental function, specific performance indicators were defined based on Mostadam and LEED requirements:
    Visual Comfort: Illuminance levels (300–3000 lux), glare avoidance, and viewing angles, thermal comfort: Predicted Mean Vote (PMV: −0.5 to +0.5) and Predicted Percentage Dissatisfied (PPD: <10%), acoustic comfort: noise levels (≤35 dBA) and reverberation time (0.6–0.7 s), ventilation: operable window area (≥8% of floor area) and CO2 levels (≤1000 ppm), linking to nature: direct line of sight to outdoors (≥75% of floor area).
  • Simulation and Data Collection:
    Visual comfort: Illuminance levels and glare spots were simulated using DIAlux Evo software. The simulations were conducted for different times of the year (June, December, and February) to account for seasonal variations in daylight.
    Thermal comfort: Thermal characteristics were simulated using DesignBuilder software, and PMV/PPD values were calculated using the CBE thermal comfort tool.
    Acoustic comfort: Internal noise levels were estimated using the Internal Noise Calculator, and reverberation time was calculated using the reverberation time calculator.
    Ventilation: The operable window area was calculated based on architectural drawings, and CO2 levels were assessed using natural ventilation strategies.
    Linking to nature: The proportion of floor area with a direct line of sight to the outdoors was calculated using architectural sections and sight lines.
  • Subjective Investigation (Questionnaire):
    The questionnaire results were used to assess user preferences for classroom proportions (e.g., shallower vs. wider external walls) and seating arrangements, providing insights into the psychological aspects of environmental comfort.
  • Comparison with Mostadam and LEED Criteria:
    The simulation results for each case study were compared against the Mostadam and LEED criteria to determine compliance. For example:
    If a case study achieved illuminance levels within the required range (300–3000 lux) for at least 75% of the floor area, it was considered compliant with both Mostadam and LEED standards.
    If the PMV and PPD values fell within the specified ranges (−0.5 to +0.5 for PMV and <10% for PPD), the case study was deemed compliant with thermal comfort requirements.
  • Final Assessment:
    A summary was created to compare the performance of each case study against the Mostadam and LEED criteria. This summary provides a clear overview of compliance levels for each environmental function.

3. Proposed Case Studies

In Taif, students spend approximately seven working hours per day, five days a week, for about 12 years at school. This time includes additional periods for rest, prayer, and meals. Therefore, the case studies were designed to adhere to the maximum comfort properties outlined in architectural standards and codes. They also incorporated the simplest architectural elements and solutions, such as a single window opening without shading, to minimize the variability of effects on performance. It is important to note that other classroom properties can enhance the achievement of required environmental functions. For example, daylight glare can be controlled using various shading systems, while additional natural light and ventilation can be achieved through multiple external walls or skylights. Artificial lighting can be optimized with switching, dimming, and control devices, and better sightlines can be achieved through classroom shape angles and flooring levels that improve seating arrangements and views of the board [17,19].
According to architectural standards, the maximum number of students in a class is 32. However, the case studies were designed for 24 students, reflecting the most common class size in KSA [13,26,27,28,29,30]. Table 2 shows the similarities and differences among the case studies regarding room and window dimensions, ratios, and orientations. All cases have the same area, but Cases 1 and 5 have different external/internal wall ratios compared to the others. Cases 1, 2, 3, and 4 are oriented toward the North, while Cases 5, 6, 7, and 8 are oriented toward the South. Cases 1, 3, 5, and 7 share the same window area, and Cases 1, 2, 4, 5, 6, and 7 have the same window-to-wall ratio (WWR). Additionally, Cases 1, 2, 5, and 6 have the same window height, which is the maximum available height. The following section presents the properties of the case studies as simulated.

3.1. Architectural Properties

The case studies consist of rectangular classrooms with a single external wall. The openings include a window on the external wall and a door on the opposite-facing wall. Both the ceiling and the floor are flat. The distance between the board wall and the students at the back does not exceed the maximum of 9 m, as per standards (six times the screen height). All case study areas are 6 × 8 m2 with a clear height of 3.5 m. Thus, the minimum classroom guidelines were achieved, as the standard minimum area is 2 m2 per student, and the volume is 6 m3 per student. The minimum standard height is 3 m, which can only be reduced by construction. However, in the case studies, a height of 3.5 m is used, consistent with most KSA schools. The door width is the minimum required, which is 1 m. The minimum adjacent single-loaded corridor width is 1.25 m for up to 180 people, as determined by standards. Other case study properties, such as the first-row seating distance from the board’s wall (at least two times the screen height), the board dimensions, the door position, and the minimum writing surface dimensions, were also designed according to standards [24,37].
According to standards, the classroom depth should not exceed 7.20 m if all windows are on one side [24]. However, this dimension was not strictly adhered to in two case studies, as this manuscript examines its effect on achieving the overall classroom’s internal environmental functions. Thus, this dimension was exceeded in Cases 1 and 5.

3.2. Natural Light Properties

All case studies relied solely on natural light from the proposed window. The natural light properties were designed to meet different local and international codes. For example, the window-to-wall ratios (WWRs) are approximately 40% in some cases and extend to 50% in others. In all cases, the window glazing has a solar factor (g-value) of 35% and a light transmittance (t-value) of 40%. The windows’ sills are 1 m high, and all windows are positioned at least 1 m away from the board’s wall to avoid glare. In some cases, windows extend up to about 20 cm from the ceiling, slightly exceeding the standard allowance [2,8,15,41]. Regarding orientation, the North is preferable for reducing direct sunlight penetration while ensuring adequate natural lighting. North-facing windows provide the most uniform daylight throughout the year and rarely cause glare discomfort. West-facing windows allow sunlight after the school day, while East-facing windows receive direct sunlight early in the day. Thus, West and East orientations may not provide abundant daylight, although they have a low risk of glare during normal school hours. Therefore, the case studies excluded West and East orientations and instead used North and South orientations, despite the potential for glare from the South. This glare can be mitigated using shading devices to control sunlight penetration [3,5,25]. Additionally, a study on two classroom prototypes in Jeddah, KSA, showed that West and East orientations lead to inefficient daylight distribution, resulting in dark areas on some surfaces and excessive brightness on others [26,30,31].
To improve ambient lighting, the reflectance levels of paints, laminates, and other finished materials were carefully selected. According to the WELL Building Standard, Mostadam specifies light reflectance values (LRV) for building materials in learning areas. Ceilings should have an average LRV of at least 0.8 for 80% of the surface area, walls should have an average LRV of at least 0.7 for 50% of the vertical surface area, and furniture should have an average LRV of at least 0.5 for 50% of the surface area. In the case studies, the simulated LRV was 80% for ceilings and 70% for walls. The exterior coating was chosen to be a soft white color with a 73% reflective factor, following LEED and WELL standards [15,37,42,43].

3.3. Thermal Properties

Common classroom windows in KSA typically use a single clear glazing layer [26,30], which was also used in the examined classrooms despite its inefficiency in reducing heat gain. Alternative glazing types, such as double or low-E glazing, could be recommended to improve thermal and energy efficiency. A study on different KSA microclimate zones found that the worst classroom orientations for heat gain are the South and East, with south-facing classrooms receiving the most solar radiation [30]. However, while poor thermal orientation can be mitigated, poor daylight orientation cannot. Therefore, the South orientation was included in the case studies, with the possibility of implementing thermal recommendations, while the East orientation was excluded due to its daylight-related issues. A previous study recommended a 35% WWR for south-facing windows in Taif City classrooms to achieve visual comfort, with thermal solutions such as horizontal light shelves during the summer season. Another study suggested a WWR of 20% for south-facing facades or 35% for north-facing facades to achieve thermal comfort in moderate climate regions, such as Taif City. Both studies adopted North and South orientations while excluding East and West [15,30].
The classroom construction materials were selected according to SBC 601 for non-residential buildings in Taif City, which has a degree-day (DD) value of 2200. For unconditioned classrooms with glazed openings greater than 25% but less than 40%, and classrooms with glazed openings greater than 40% but less than 50% of the above-grade wall area, the following specifications were applied: The thermal resistance (R-value) of masonry walls was 1.937 m2·K/W, as required by the code [41]. This was achieved using four layers, from outside to inside: 2 cm of cement plaster, 1.5 cm of polyurethane board, 25 cm of masonry brick, and 2 cm of cement plaster. The same R-value could be achieved using other layer configurations without affecting the results. According to a recent study, the optimal thickness of thermal insulation should vary based on the orientation (South, North, East, or West) to differentiate the walls’ R-values [13]. However, a unified R-value was applied to all wall directions, as specified in the SBC, which is the primary reference in this manuscript. As applied in the case studies and based on a study of a classroom in Taif City, thermal insulation is preferably applied to the outer surface of external walls, especially for south-facing classrooms [13]. According to SBC 601, the roof R-value is 3.346 m2·K/W, and the floor R-value is 1.585 m2·K/W, assuming both are made of concrete with continuous insulation.
No shading devices were used in the case studies. According to SBC 601 for non-residential buildings in Taif City, for shading with a projection factor (PF) of less than 0.25, the required U-factor is 2.839 W/m2K for the glazed area. Additionally, the required Solar Heat Gain Coefficient (SHGC) is 0.4 for the proposed WWR areas [41]. The chosen window configuration to meet these requirements is double clear glass (6 mm with a 6 mm air gap) with an aluminum frame and dividers, incorporating thermal breaks.

3.4. Acoustical Properties

According to building codes, classrooms should be oriented away from busy roads and external noise sources such as playgrounds and traffic. Therefore, the case studies were assumed to be in a quiet zone with a buffer distance maintained by trees and shrubs. The corridor adjacent to the classrooms can also serve as a buffer zone [4,5,16,25]. According to standards and the World Health Organization, the Noise Reducing Coefficient (NRC) should be between 0.65 and 0.85, the minimum Sound Transmission Class (STC) should be 50, and the reverberation time (RT) should be between 0.6 and 0.7 s [8,37,38,44].

3.5. Ventilation Properties

All case studies rely on natural ventilation to avoid high CO2 concentration levels associated with air conditioning (AC). Large windows were incorporated to promote fresh air circulation. A study conducted in three secondary public schools in Jeddah, KSA, measured CO2 concentration levels in 12 classrooms using three different types of AC systems. The American National Standards Institute (ANSI) and the American Society of Heating, Refrigerating, and Air-Conditioning Engineers (ASHRAE) recommend a CO2 concentration limit of 1000 ppm to maintain acceptable indoor air quality. However, the study found that CO2 levels exceeded this limit in all classrooms, regardless of the AC type used [9]. The case studies’ height was set to 3.5 m to improve air quality, as larger classroom volumes generally result in lower CO2 levels, although adequate ventilation remains essential. In Taif, the prevailing wind orientation is toward the North, which aligns with one of the two window orientations used in the case studies [4,5,8].

3.6. Outdoor Linkage Properties

In all cases, the windowsill was set 1 m above the floor. According to standards, the windowsill should be no more than 1 m from the floor to allow students to rest their eyes and maintain a connection to nature. Light entering through a window with a sill height of less than 0.90 m is considered ineffective [3,5]. As previously mentioned, the window-to-wall ratio (WWR) is either 37% or 50% for all case studies. This results in a varied but generally narrow lintel above the window openings (ranging from 0 to 0.4 m), designed while considering the other requirements outlined in previous sections.

3.7. Energy Use Properties

In all case studies, the inputs were based on the default classroom parameters in the simulation program, ensuring compatibility with the Saudi Building Code (SBC). The interior lighting power was set according to SBC 601, at 15.1 W/m2 for classrooms [23,41,45]. Fluorescent lamps with electronic ballast were chosen to minimize flicker [5]. Natural ventilation was the only ventilation method allowed. While conditioners or fans could improve air quality if natural ventilation proves insufficient, mechanical ventilation for heating and cooling was excluded from the simulation program to focus on passive solutions. Various studies on KSA classrooms encourage the use of natural systems and cross-ventilation, confirming that KSA has no heating demand, even in winter [13,28,46].

4. Results

The following sections present the measurement of the achievement of different internal environmental functions for the case studies. These results were then compared against the minimum required values specified by the verification references. Simulation and analysis tools were used to conduct these evaluations. To ensure the reliability and robustness of the simulation models, a validation process was conducted by comparing some of the model results with real-world measurements from a classroom in Taif City, KSA, as mentioned in the following sections. The validation classroom represents the Case 3 model. Key parameters related to visual and thermal comfort were measured and compared with the simulation results.

4.1. Visual Comfort Accomplishment

4.1.1. Viewing Angles and Sight Lines Accomplishment

The case studies feature two different external/internal wall ratios. In Cases 1 and 5, the longer sides are perpendicular to the external wall, while in all other cases, the longer sides serve as the external wall. The distance from the board may affect viewing quality, depending on the students’ abilities. Generally, symbols, letters, and numbers of various sizes can be read and measured from a distance of 6.10 m. For whiteboards with a reading distance exceeding 8 m, it is recommended to use markers up to 1 cm in size to ensure readability [36,47]. This consideration may favor Cases 1 and 5 over the others. However, since the distance from the farthest student to the board does not exceed 8 m in any of the cases, all cases were evaluated without bias regarding this issue.
As previously mentioned, the angle at which students view the board without turning their heads or moving their eyes significantly is crucial for visual comfort [36,37]. Cases 1 and 5 face a challenge related to the viewing angle because the board is positioned on its wider side. However, this issue can be mitigated through appropriate furniture arrangements. For example, fixed desks can be angled to provide a better view of the board, or flexible furniture can be marked with patterns or signs on the floor to indicate the optimal viewing angles without permanently fixing the furniture. Classroom seating arrangements that improve visibility and connectivity between students, the board, and the teacher can also foster better cooperative and supportive behavior among students.
To assess students’ ability to view the board comfortably, especially from the sides, the appropriate viewing angles must be determined. Several studies have identified comfortable viewing angles for the eyes as follows:
  • A 45° angle from the eye center: Some studies, such as the CEN European Daylight Standard (EN 17037) [48], have determined that the maximum visual discomfort occurs at horizontal viewing angles greater than 45° or less than −45° from the center of the eyes.
  • A 60° angle from the eye center: Other studies suggest that the best text recognition occurs within ±10° from the central axis of the eyes. Horizontal eye rotation can occur within ±15°, resulting in a maximum viewing angle of 25° on either side. Students seated far from the board may need to rotate their necks excessively to read the text on the board or screen. Neck rotation up to 35° does not cause physical strain, but exceeding this angle can lead to significant neck stress and pressure on muscles and joints. Therefore, in classrooms, physical discomfort can be minimized if students’ viewing angles to the board are within ±25° from the central axis [47].
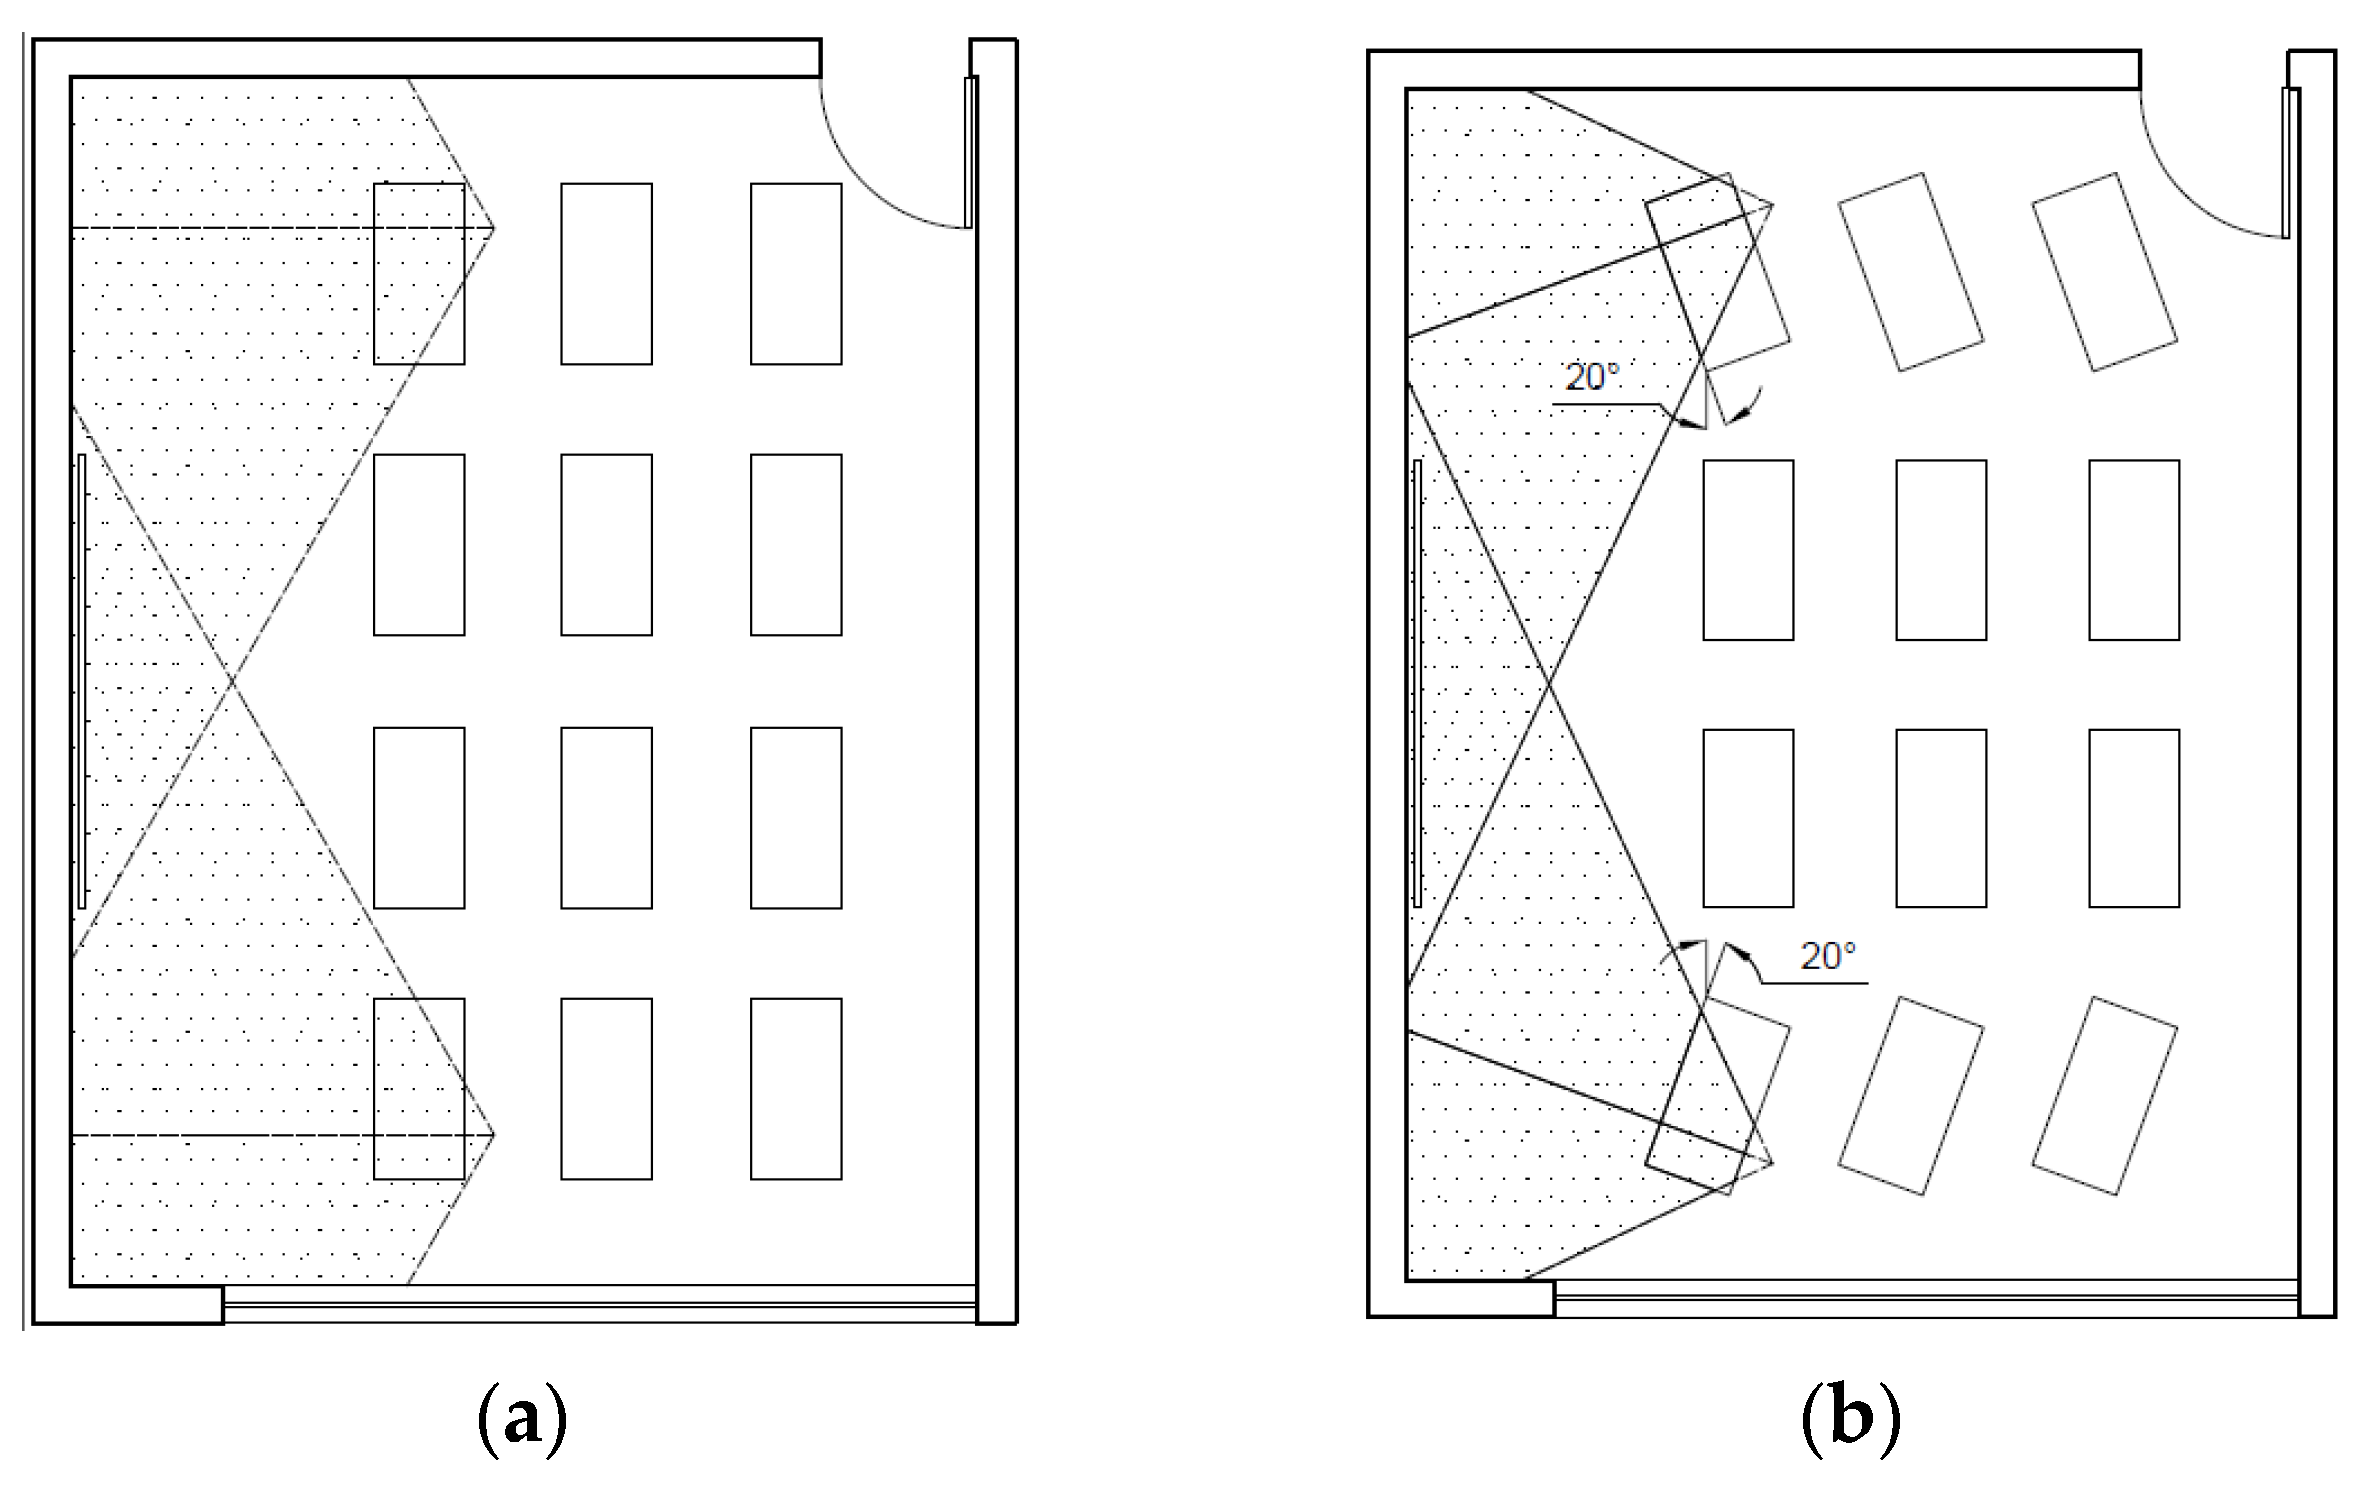
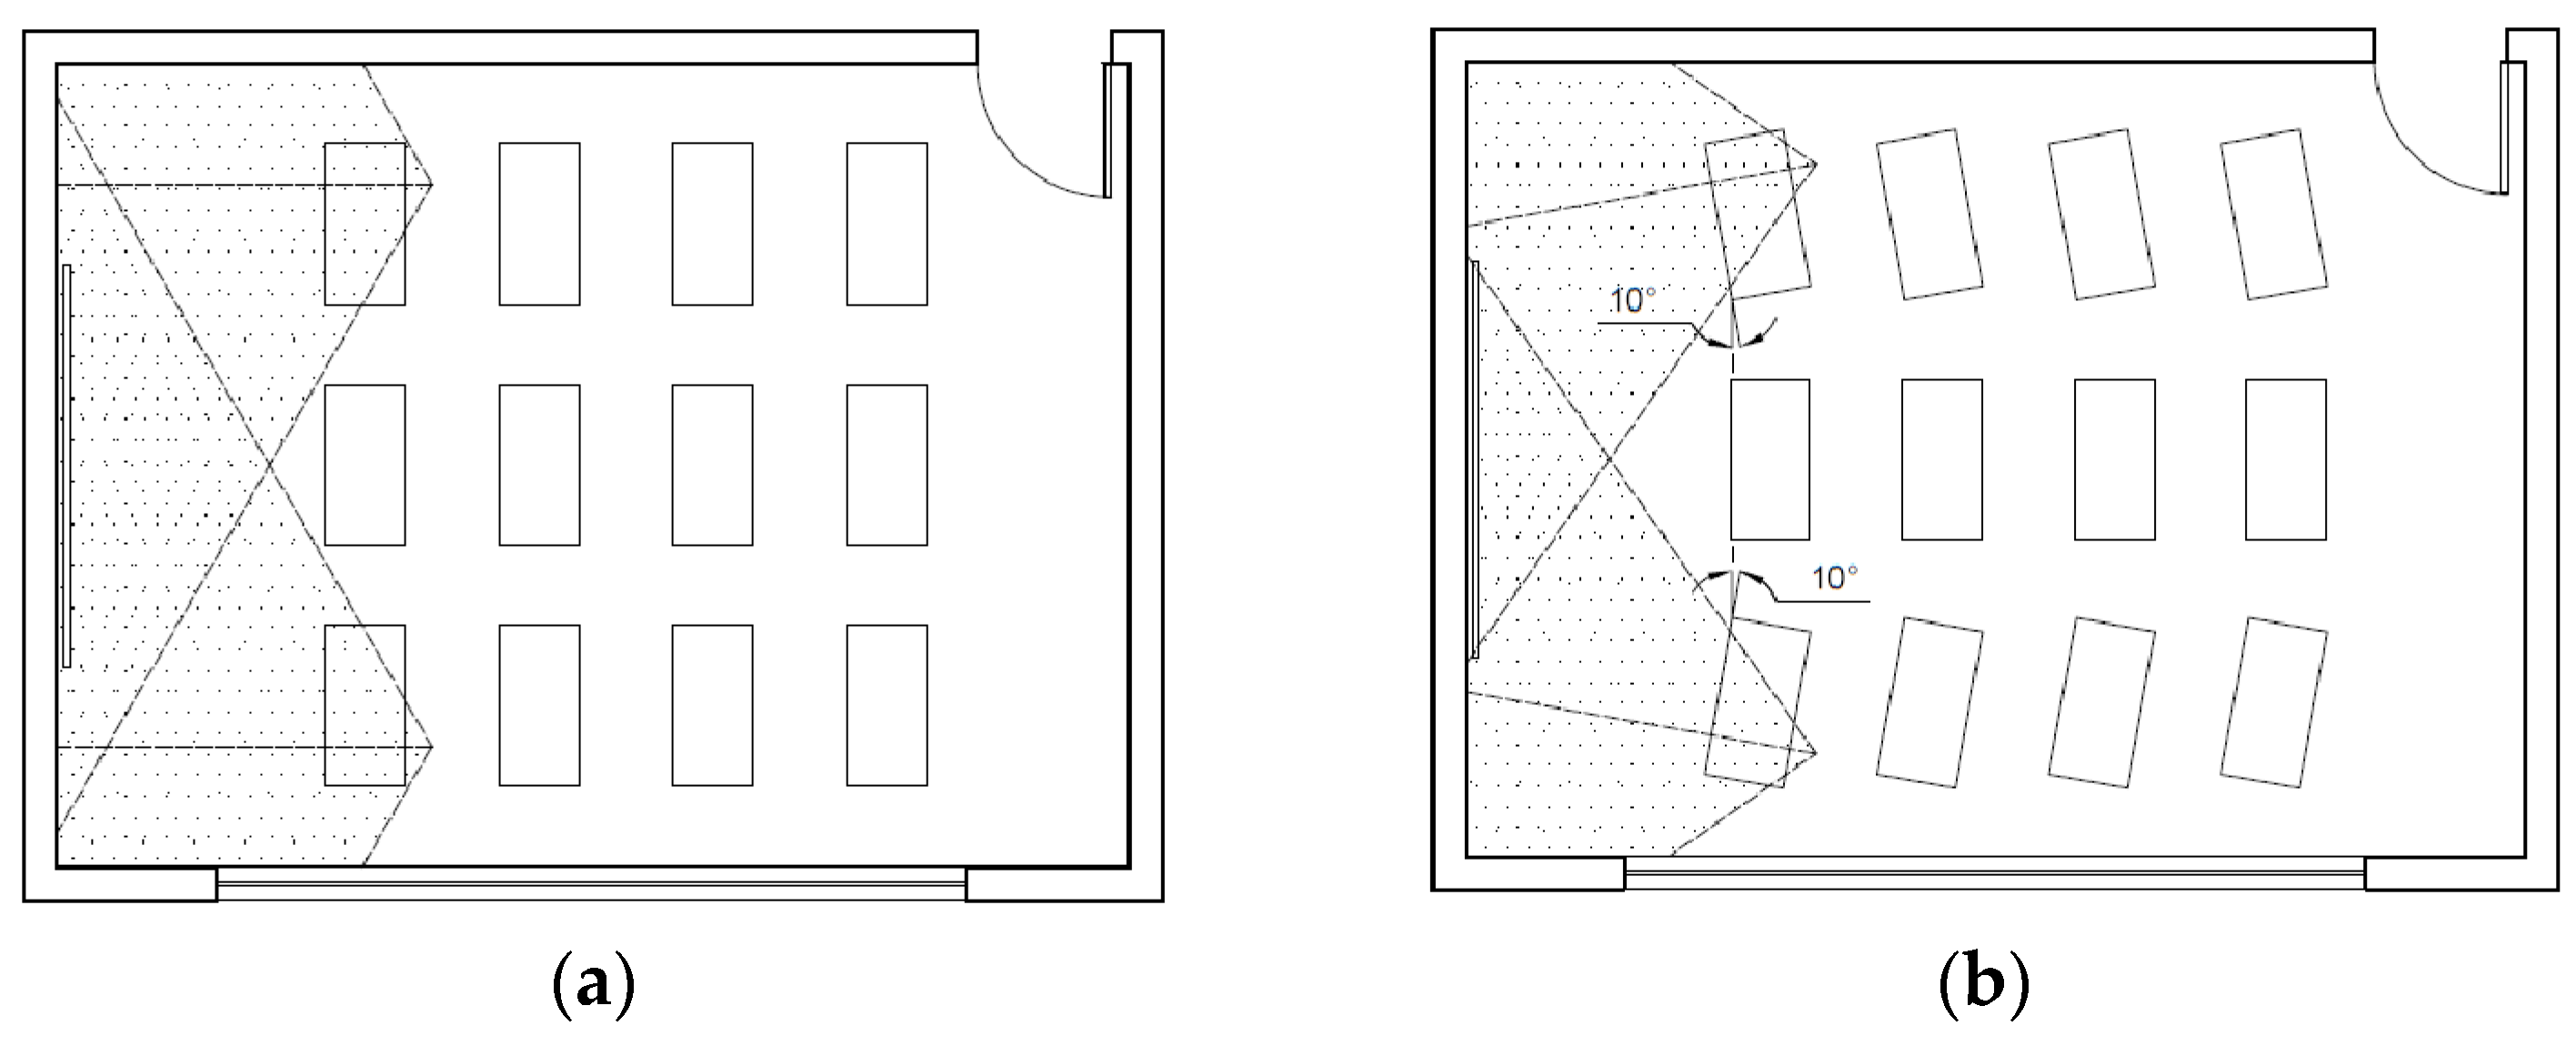
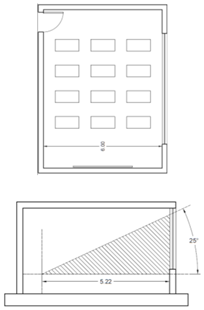
Figure 4 and Figure 5 illustrate the seating arrangements that help achieve the proper visual angles to the board for the two different classroom ratios, based on viewing angles of 45° and 60° from the eye center. Note that both classroom ratios require slightly tilted desks for students seated on the sides: 10° for shallower classrooms and 20° for deeper classrooms.

4.1.2. Illuminance Levels and Glare Avoidance Accomplishment

Achieving the required illuminance levels in classrooms is a critical assessment criterion in various Green Building Rating Systems (GBRSs) [1,15,31]. According to LEED, the natural illuminance level should range between 300 and 3000 lux between 9 a.m. and 3 p.m. at the appropriate work plane height, covering at least 75% of the floor area. This range ensures that artificial lighting is used when illuminance levels fall below 300 lux, while levels above 3000 lux may cause visual discomfort or glare. Measurements should be taken during regularly occupied months, as specified in the LEED guidelines [1]. According to Mostadam, the daylight illuminance should be at least 300 lux for 75% of the occupied area, and the Saudi Building Code (SBC 201) requires that the minimum net glazed area should not be less than 8% of the floor area [2,31,35,49].
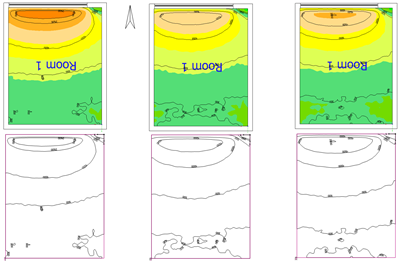
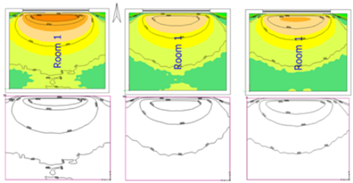
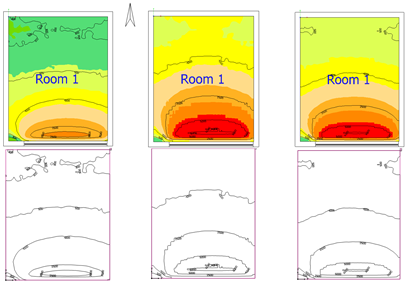
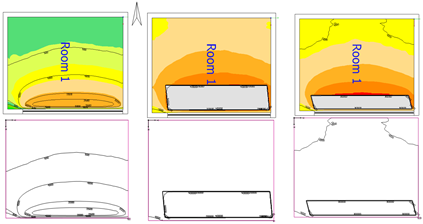
The eight classroom case studies were simulated using the DIAlux Evo software to evaluate their light-level performance. The location data were configured based on Taif City’s geographical details, with assistance from the Climate Consultant software tool. According to Taif’s sun path diagram, the simulated days were selected to represent the lowest and highest sun elevations: 21 December (lowest sun elevation) and 21 June (highest sun elevation) [15,33,50,51]. Additionally, 21 February was simulated for all cases to meet LEED requirements. LEED specifies that a second measurement of daylight illuminance levels should be taken in February or October if the first measurement is conducted in June [1]. The lux levels were calculated according to Mostadam standards for a clear sky at 0.75 m above the floor, with artificial lighting excluded from the calculations [2]. Table 3 presents the simulation results for the case studies, while Table 4 summarizes the achievement of the required illuminance levels and glare avoidance according to LEED and Mostadam standards for the eight case studies.

Visual Comfort (Illuminance Levels and Glare Avoidance) Validation

Daylight illuminance levels were measured using a lux meter at multiple points in a real classroom resembling Case 3 on 21 December and 21 February 2023, during break time (11:30 a.m.). The simulation results indicated that 24.6% of the occupied area had daylight illuminance levels below 300 lux (insufficient), while 0% of the area exceeded 3000 lux (risk of glare). Real-world measurements confirmed these findings, with 25% of the occupied area recording illuminance levels below 300 lux and no areas exceeding 3000 lux. This close agreement (a deviation of only 1.6% for insufficient daylight) validates the accuracy of the visual comfort model.

4.1.3. Color Temperature and Circadian Rhythms Accomplishment

The case studies were designed to integrate natural light effectively, supporting circadian rhythms and enhancing the learning environment. In all cases, the educational spaces featured large window areas to maximize the use of natural light during school hours. This design choice not only reduced reliance on artificial lighting but also ensured that students were exposed to dynamic changes in color temperature and light intensity throughout the day, aligning with their natural circadian rhythms. Additionally, the large window areas provided adequate vertical illuminance at eye level, a critical factor in regulating melatonin production and maintaining healthy sleep–wake cycles. By allowing natural light to penetrate deeply into the learning spaces, the design ensured that students received sufficient light exposure to support their circadian rhythms, even when seated away from windows.
The author had previously researched the physiological Lighting Effect in educational spaces, which included spaces in the same city where the current manuscript proposes case studies (Taif City) [53]. This earlier study highlighted the importance of window orientation and its impact on color temperature and circadian rhythms. Specifically, it was found that south-oriented windows provided better dynamic lighting conditions, which are crucial for reinforcing circadian rhythms and enhancing students’ alertness and well-being. In the current manuscript, the eight case studies are designed with varying window orientations, and window-to-wall ratios (WWR). Based on the findings from the previous study, it is evident that some cases perform better than others in terms of color temperature and circadian rhythm reinforcement. For instance, cases with south-oriented windows (Cases 5, 6, 7, and 8) are expected to provide more effective circadian lighting due to the higher exposure to natural light variations throughout the day. In contrast, north-oriented windows (Cases 1, 2, 3, and 4) may offer less dynamic lighting, which could impact the students’ circadian rhythms and overall physiological well-being. Table 5 compares the eight case studies based on room dimensions, window orientation, window dimensions, window area, and WWR based on previous studies [15,53].

4.2. Thermal Comfort Accomplishment

According to LEED and Mostadam, thermal modeling should be conducted to evaluate comfort levels using the Predicted Mean Vote (PMV) and Predicted Percentage Dissatisfied (PPD) methods, following ISO 7730:2005 [54]. PMV should range between −0.5 and 0.5, and PPD should be less than 10 [1,2,40]. Previous research in KSA indicates that there is no need for heating in winter. The coldest month in Taif is January, with an average winter air temperature of 18 °C. Therefore, the thermal comfort assessment focused primarily on cooling demands [13,28,33]. The DesignBuilder software was used to determine the thermal characteristics of the eight case studies. It is important to note that the case studies already complied with the local Saudi Building Code (SBC) requirements, which Mostadam relies on for its assessment. The simulation results were then used to calculate PMV and PPD using an online calculator. Additional input data were gathered from the Climate Consultant software tool. While several online tools are available for calculating PMV and PPD, the primary tool used in this study was the Center for the Built Environment (CBE) thermal comfort tool, Version 2.4.3, which is based on ASHRAE-55 (2020) standards [40,55,56]. A manual verification was also performed using basic PMV and PPD equations, based on the simulation inputs.
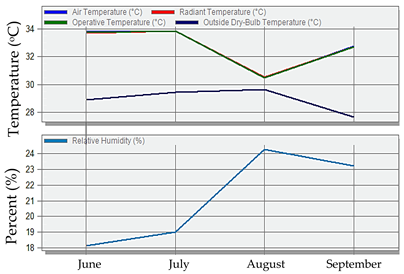
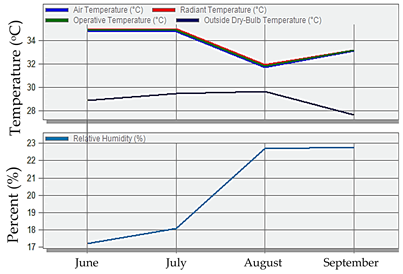
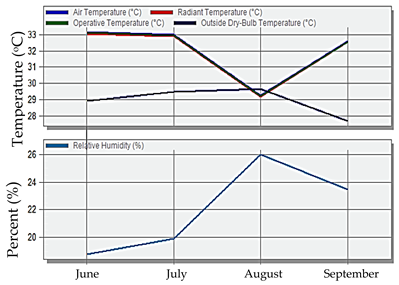
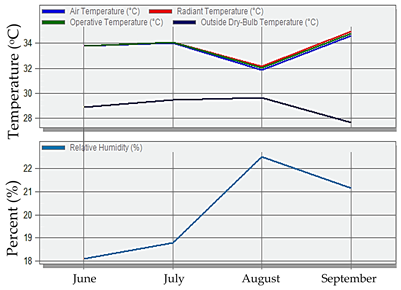
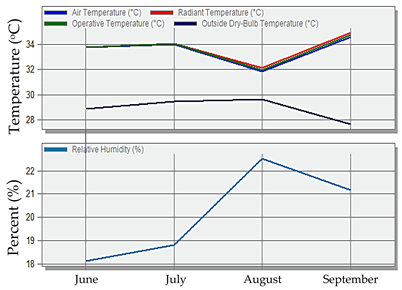
The clothing insulation (Icl) was set at 0.50 clo for summer conditions, and the metabolic energy production rate was determined to be 58.2 W/m2 for classroom activities. The rate of effective mechanical work was set to 0 W/m2 for normal activity [40,56,57,58,59,60,61]. Based on Taif’s climate characteristics, the average airspeed was determined to be 4 m/s in June and 3.2 m/s in September, with local control [33]. The inputs were calculated within the maximum school occupancy duration (from 6:00 a.m. to 4:00 p.m.), meaning the air temperature (Ta) was evaluated during this period. The school year in Taif typically runs from September to June, so results for July and August were excluded, even though these months may include peak temperature values, as observed in Cases 1, 2, and 3. Generally, June is the warmest month in Taif, though peak temperatures can occasionally occur in July [33,45].
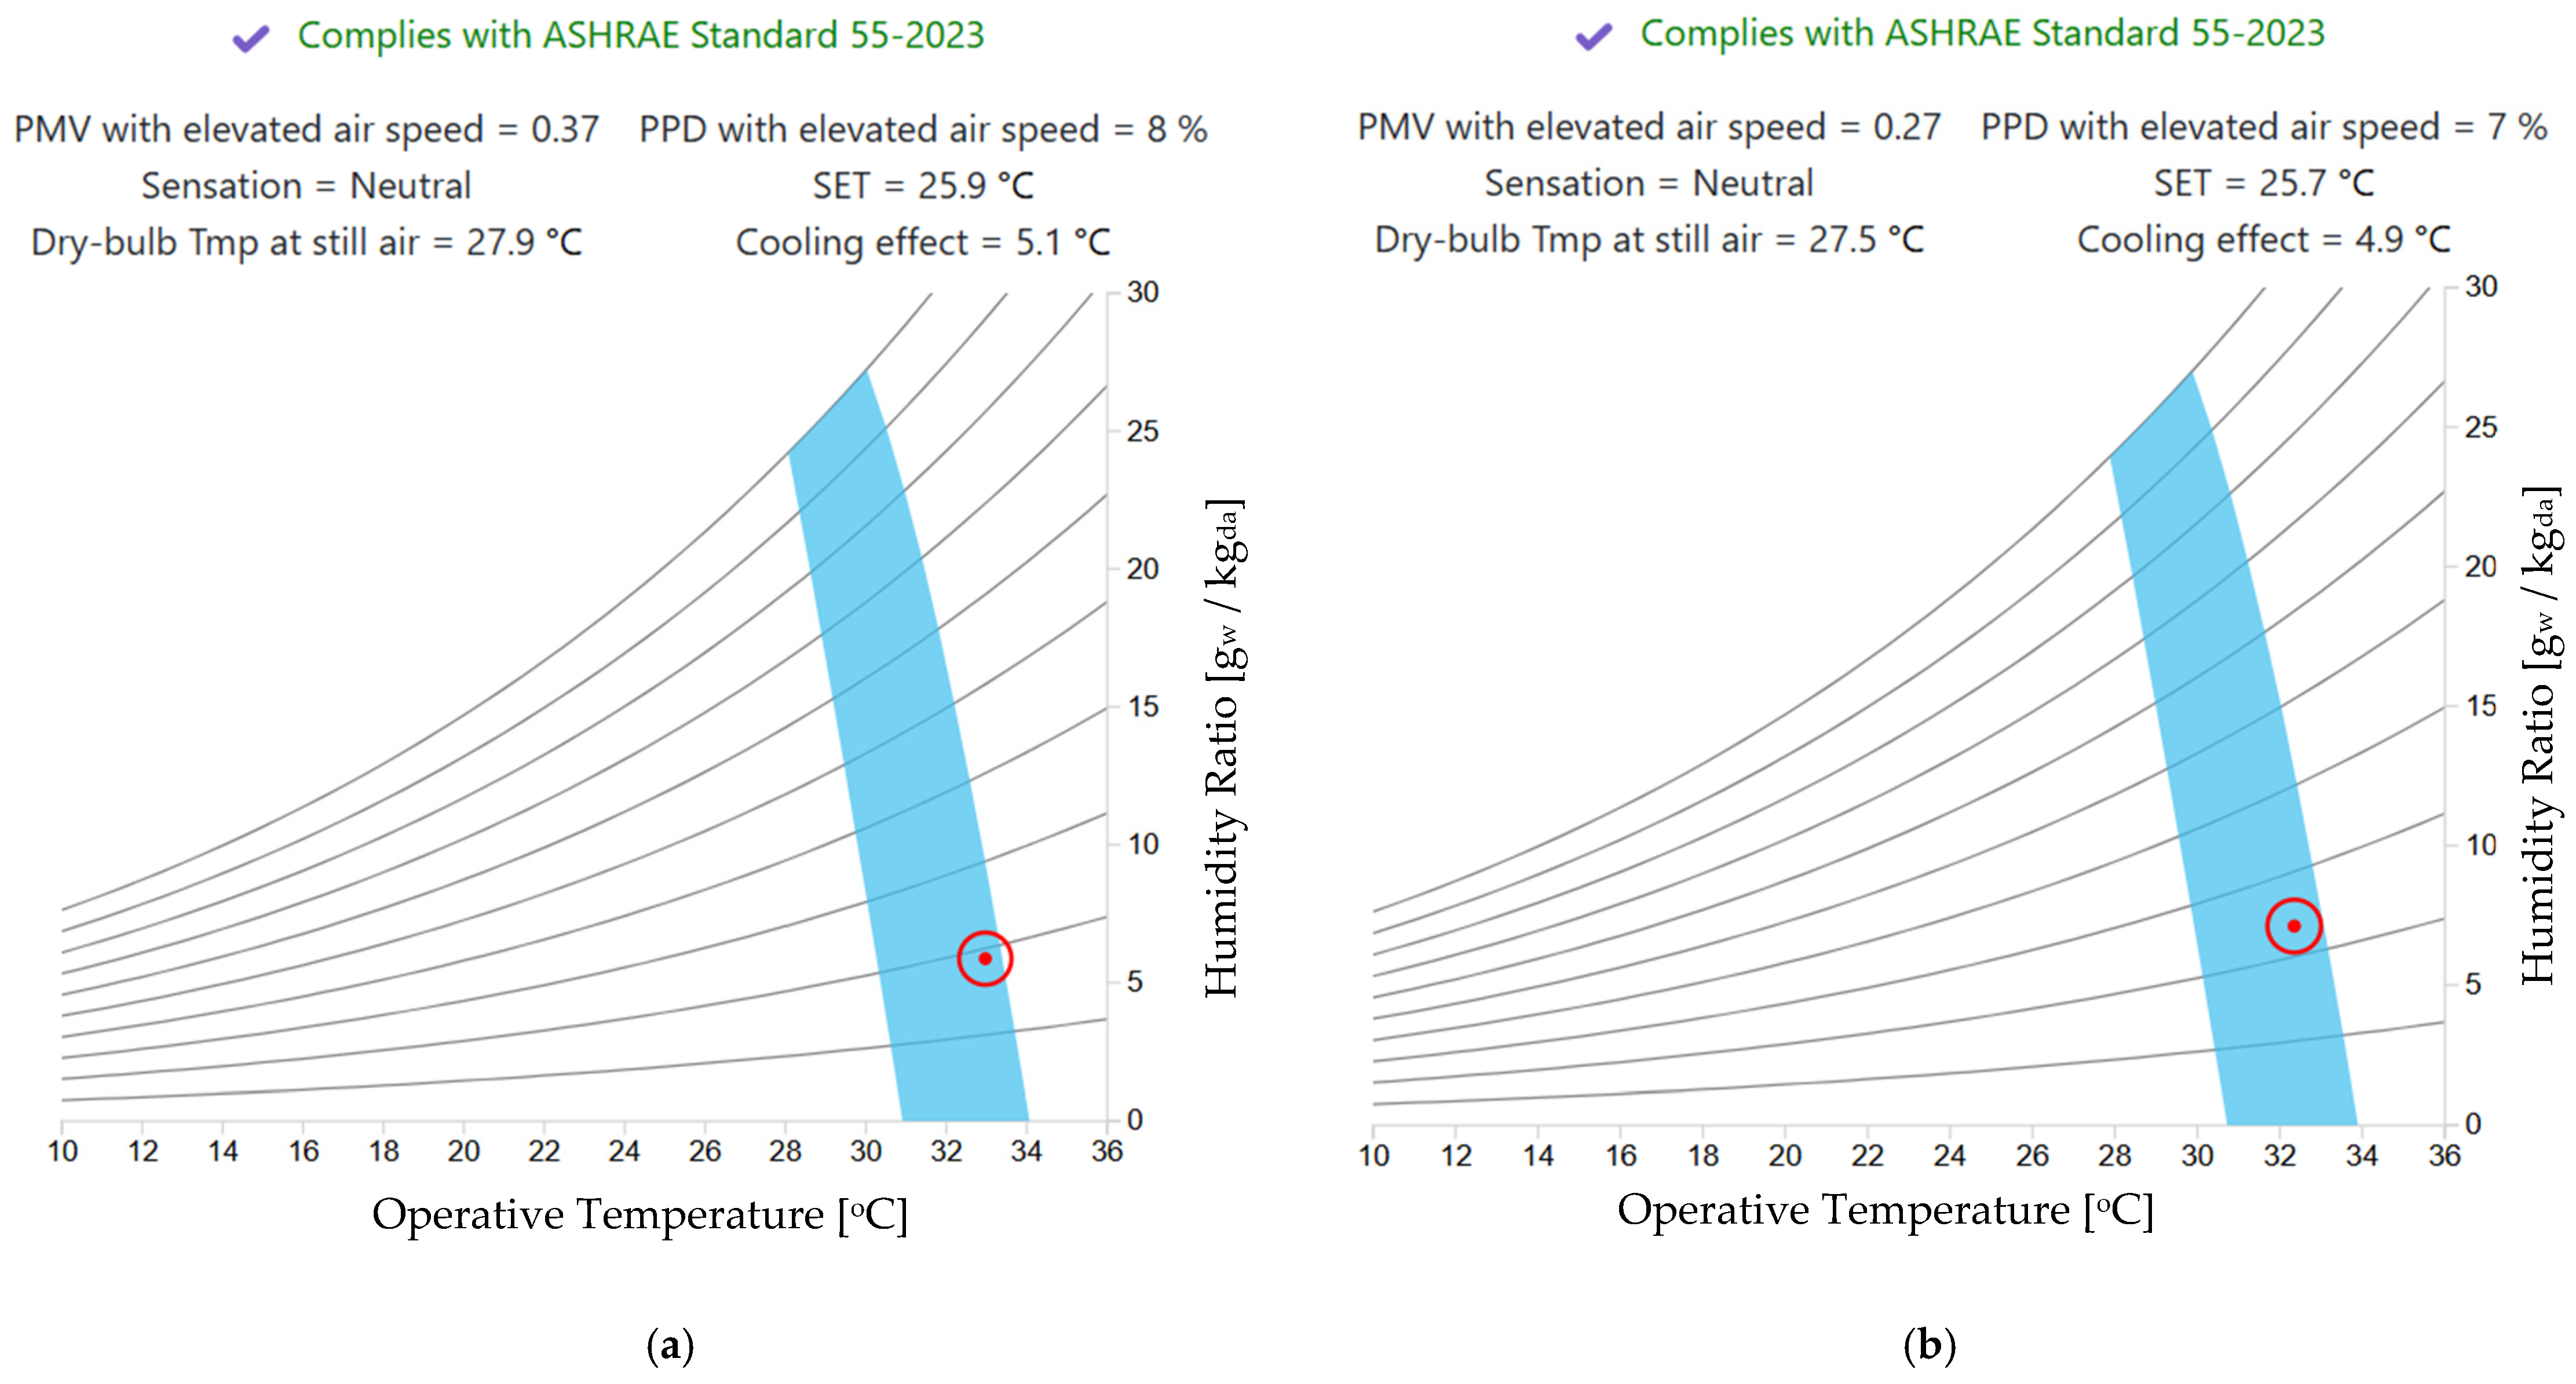
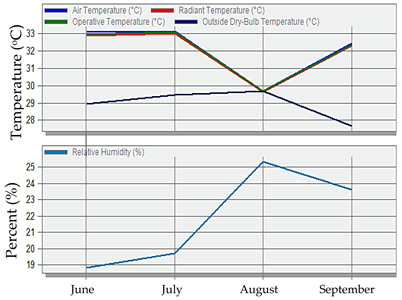
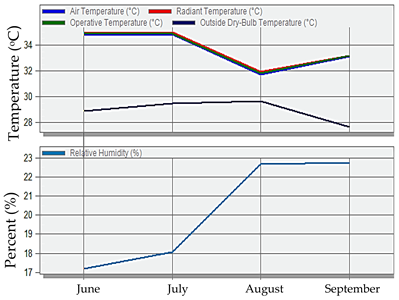
The simulation results for the summer months are presented in Table 6. The PMV and PPD results are shown in Table 7, along with their compliance with the required ranges specified by LEED and Mostadam. Figure 6 provides screenshots of the tool used to calculate PMV and PPD for Case 1.

4.2.1. Thermal Comfort Validation

Indoor temperature and relative humidity were measured in a real classroom resembling the Case 3 model using a portable thermal comfort meter over one week during typical school hours in September 2023. The measured operative temperature was 33.5 °C, closely matching the simulated value of 33.61 °C, with a deviation of less than 0.3%. The measured relative humidity (RH) was 23.5%, compared to the simulated value of 23.21%, showing a deviation of 1.2%. These results confirm the accuracy of the thermal comfort model, with minor discrepancies attributed to variations in occupancy patterns and HVAC system performance.
To validate the results of the Predicted Mean Vote (PMV) and Predicted Percentage Dissatisfied (PPD) obtained from the CBE thermal comfort tool, PMV, and PPD were manually calculated using Fanger’s thermal comfort model, following the standard methodology outlined in ISO 7730 and ASHRAE 55 standards for Case 3 inputs [55,56,58,60]. The inputs for the Case 3 classroom in September, as previously assumed and calculated using the simulation software, are as follows: operative temperature (Top): 32.72 °C, relative humidity (RH): 23.21%, clothing insulation (Icl): 0.50 clo, metabolic rate (M): 58.2 W/m2, effective mechanical work (W): 0 W/m2, and air velocity (v): 3.2 m/s

4.2.2. Manual Calculations

  • Step 1: Convert Inputs to SI Units
    Clothing insulation (Icl): 1 clo = 0.155 m2·K/W
Icl = 0.50 clo × 0.155 = 0.0775 m2⋅K/W
  • Step 2: Calculate partial water vapor pressure (Pa).
The partial water vapor pressure (Pa) is calculated using the relative humidity and saturation vapor pressure at the operative temperature.
Saturation vapor pressure (Psat):
Use the Antoine equation or empirical formula:
Psat = 610.78 × exp ((17.27 × Top)/(Top + 237.3))      
Substituting Top = 32.72 °C               
Psat = 610.78 × exp ((17.27 × 32.72)/(32.72 + 237.3)) = 4756.6 Pa
Partial water vapor pressure (Pa):
Pa = (RH/100) × Psat = (23.21/100) × 4756.6 = 1103.8 Pa
  • Step 3: Calculate PMV.
The PMV equation is as follows:
        PMV = (0.303 × e−0.036M + 0.028) × ((M − W) − 3.05 × 10−3 × [5733 − 6.99 (M − W) − Pa] − 0.42 × [(M − W) − 58.15] −
1.7 × 10⁻⁵ M (5867 − Pa) − 0.0014 M (34 − Top) − 3.96 × 10⁻⁸ fcl (Tcl4 − Tr4) − fcl hc (Tcl − Top))
where fcl: Clothing area factor, Tcl: clothing surface temperature, Tr: mean radiant temperature (assumed equal to Top), hc: convective heat transfer coefficient
  • Step 3.1: Calculate clothing area factor (fcl).
fcl = 1.0 + 0.2 × Icl = 1.0 + 0.2 × 0.50 = 1.1
  • Step 3.2: Calculate convective heat transfer coefficient (hc).
For air velocity v > 0.2 m/s:
h c = 12.1   ×   v = 12.1   ×   3.2 = 21.8   W / m 2 · K
  • Step 3.3: Calculate clothing surface temperature (Tcl).
Tcl = 35.7 − 0.028 (M − W) − Icl (3.96 × 10⁻⁸ fcl (Tcl4 − Tr4) + fcl hc (Tcl − Top))
This equation is iterative. For simplicity, assume Tcl ≈ 34 °C.
  • Step 3.4: Substitute values into the PMV equation
Substitute all values into the PMV equation and solve. This step involves detailed calculations, but for brevity and after performing the calculations, the result is as follows:
PMV = 0.39 (exactly matching the online tool result, indicating good agreement and validating the accuracy of the manual calculations).
  • Step 4: Calculate PPD.
The PPD is calculated from the PMV using the following equation:
PPD = 100 − 95 × exp (−0.03353 × PMV4 − 0.2179 × PMV2)
Substitute PMV = 0.39.
PPD = 8.6% (very close to the result of 8% obtained from the online tool).
From previous manual calculations, both the PMV and PPD values closely match the online tool (the CBE thermal comfort tool), validating its results.

4.3. Acoustical Comfort Accomplishment

According to Mostadam, the internal acceptable noise levels should be at least 35 dBA [2]. For learning spaces smaller than 566 cubic meters, LEED specifies that acoustic comfort can be confirmed either by ensuring that the area of sound-absorbent finishes equals or exceeds the total ceiling area of the room or by verifying through calculations that the room meets a reverberation time (RT) between 0.6 and 0.7 s, as per ANSI Standard 12.60-2010 Part 1 [1,8]. It is important to note that RT is influenced by the room’s shape, and teachers are more easily heard when the seating arrangement allows students to be closer to the teacher, as in Cases 1 and 5 [5]. Using an RT calculator, all case studies yielded an RT of 0.6 s, assuming the ceiling area was covered with effective sound-absorbing materials as required by LEED [59]. As a result, no comparison could be made between the cases regarding LEED ranges.
To assess compliance with Mostadam’s noise level requirements, an Internal Noise Calculator tool was used. This tool estimates noise levels based on inputs such as reverberation time (set to 0.6 s, as previously calculated), external noise level (assumed to be 60 dB), sound reduction in the external wall and its area, sound reduction in openings and their areas, and room dimensions (length, width, and height). Calculations were performed under the assumption that the sound reduction values for the external wall and openings were consistent across all cases. These values were set to establish Case 1 as the base case against which the other cases were compared. This setup ensured that Case 1 met the maximum internal ambient noise level specified by Mostadam (35 dBA). The results of the internal noise levels, with Case 1 as the base case, are presented in Table 8 [62].

4.4. Ventilation Accomplishment

According to Mostadam, based on SBC 501 requirements, the minimum operable area to the outdoors must not be less than 8% of the space floor area being ventilated and must not be less than 2.3 m2 [2]. LEED, based on ANSI/ASHRAE Standard 62.1 [40], specifies a maximum CO2 level of 1500 ppm (practically) or 1000 ppm (theoretically). The minimum acceptable air ventilation rate is 15 cubic feet of fresh air per minute (cfm) per person to ensure the dilution and removal of pollutants from classroom air [1,8,9].
In most cities in KSA, the hot climate often leads to windows being kept closed for extended periods, which can result in high levels of pollutants and CO2 concentration, as documented in several studies on school air quality in KSA [9,63]. However, Taif City benefits from the ability to achieve thermal comfort naturally without relying on mechanical ventilation [33]. Therefore, the case studies were designed with the assumption that windows would remain open, as previously mentioned and proposed in the thermal comfort calculations, with local control capabilities.
According to previous studies on KSA classrooms, CO2 levels remain low and have no significant impact as long as mechanical systems are not installed [9,63]. Consequently, the LEED requirements were excluded, and only Mostadam’s requirements related to ventilation through operable window areas were evaluated. Table 9 shows the relationship between the case studies and Mostadam’s required ranges.

4.5. Linking to Nature Accomplishment

Both LEED and Mostadam define the achievement of linking to nature by ensuring that at least 75% of the occupied floor area has a direct line of sight to the outside through vision glazing. Additional requirements in LEED related to external features can also be assumed to be met in the case studies [1,2]. When applying the viewing angles to all case studies, the wide windows easily meet the required criteria. It is important to note that the horizontal viewing field angles are at least 60° to the left and right from the eye’s center, while the vertical viewing field angles are at least 25° above the horizon (elevation angle) and 35° below it (depression angle) [47,64]. Furthermore, studies on vertical vision have established a relationship between the eye’s focus on distant objects and the provision of muscular relief, which minimizes strain risks based on the distance from the window. For instance, one study introduced the concept of the Observer Landscape Distance (OLD), a metric that quantifies the distance of the window view landscape from the occupant. These studies suggest that people experience greater satisfaction when urban features are viewed from a distance. The European Standard EN 17037 [48] and the Society of Light and Lighting (SLL) guide also recommend that the minimum distance for an outdoor view should be at least 6 m. The quality of the view is categorized as “sufficient”, “good”, and “excellent” for outdoor distances of ≥6 m, 20 m, and 50 m, respectively, providing clear design targets. Visual discomfort symptoms, such as eyestrain and visual fatigue, can occur when occupants focus on objects that are too close to their visual field, emphasizing the importance of maintaining adequate viewing distances [48,65]. Table 10 presents the achievement of vertical viewing angles for the different case studies, their compliance with Mostadam and LEED requirements, and the proportion of occupants with a viewing distance of ≥ 6 m from the window, ensuring visual satisfaction.

4.6. Users’ Preferences of Rectangular Classroom External/Internal Wall Ratio

As previously mentioned in the Introduction section, the shape, size, and proportion of a classroom directly influence students’ educational quality, performance, achievement, and working efficiency, as well as teachers’ ability to educate [11]. Therefore, in addition to addressing the architectural and physical needs of students, this manuscript also considers the psychological aspects. A questionnaire was conducted to determine users’ preferences between the two proposed external/internal wall ratios for classrooms. These preferences were assessed based on how different ratios affect internal factors, such as student seating arrangements and their distance from the board.
The questionnaire was administered to fourth and sixth-grade students from three different schools in Taif City. It was also distributed to their teachers and parents. The classrooms in question had a capacity of 24 students. A total of 74 students, 55 parents, and 11 teachers responded to the questionnaire. The results are presented in Figure 7, Figure 8 and Figure 9. Table 11 summarizes the findings and provides the percentage of users’ preferences regarding the two proposed external/internal wall ratios for rectangular classrooms in Taif City.

4.7. Environmental Functions Accomplishment According to the Verification References

The primary objective of this manuscript is to determine the optimal external/internal wall ratio for rectangular classrooms in Taif City, KSA, based on an environmental assessment. The assessment primarily relies on the Mostadam and LEED rating systems to evaluate the impact of the proposed case studies on indoor environmental functions. To facilitate this evaluation, a point scheme was developed using the credits of related items in LEED and Mostadam. Table 12 outlines the available points for the related Indoor Environmental Quality (EQ) items in LEED and the Health and Comfort (HC) items in Mostadam when achieved.
Table 13 proposed assessment items and their corresponding points based on the LEED and Mostadam systems to assess the case studies. The average assessment points from these systems were used to evaluate case studies. Additionally, three extra items were added: viewing angles, color temperatures, and circadian rhythms (physiological comfort), and user preferences (psychological comfort), which add important human needs that are not in the current LEED and Mostadam methods to assess classrooms. The items are not separately assessed in LEED or Mostadam, but are crucial for the environmental assessment of classrooms.
Table 14 shows the assessment of the eight case studies according to the proposed assessment points in Table 13. The gained points relied on the manuscript findings and discussion as follows:
  • For the viewing angles and sight lines item, Cases 1 and 5 earn 0.4 points (80% of 0.5 points), while other cases earn 0.45 points (90% of 0.5 points).
  • For the illuminance levels and glare avoidance item, Cases 2, 4, and 5 earn 2 points because more than 90% of their floor area is within the required ranges, while other cases earn 1 point because the required level covers between 90% and 75% of the floor area.
  • For the color temperature and circadian rhythm items, Cases 5, 6, and 8 earn 0.5 points (full achievement), Cases 1, 2, 4, and 7 earn 0.4 points (80% achievement), and Case 3 earns 0.32 points (65% achievement).
  • For the thermal comfort item, Cases 1 and 5 earn 2 points (full achievement), while other cases earn 0 points.
  • For the acoustic comfort item, Cases 1 and 5 earn 1.5 points (full achievement), while other cases earn 1.35 points (90% achievement).
  • For the ventilation item, all cases earn 1.5 points (full achievement).
  • For the linking to nature item, Cases 1 and 5 earn 1 point (full achievement), while other cases earn 0.75 points (75% achievement).
  • For the users’ preferences item, Cases 1 and 5 earn 1.38 points (69% of 2 points), while other cases earn 0.62 points (31% of 2 points), these ratios represent the users’ preferences as shown in Table 10.
From the table above, it is evident that the cases featuring classrooms with shallower external walls achieved higher overall scores regarding indoor environmental functions in Taif City. This suggests that the common classroom design, which typically features wider external walls, should be reconsidered to better align with Taif City’s environmental characteristics. Similarly, other design standards related to spatial variables and their impact on environmental functions should be evaluated for efficiency. Further research is needed to determine the classroom design’s optimal ratio values and dimensions.

5. Discussion

Architectural spaces are reaction products. Architects could consider changing the usual design of classrooms if they find a good reason to do so, such as a better impact on users. If users already desire a certain classroom proportion, architects may study its effect on the functions to decide whether to adopt or discard it. If the alternative composition provides the same or higher performance for overall architectural values, the new composition should be considered and applied. This manuscript investigates the common rectangular classroom proportion to determine whether it is the best way to design a rectangular classroom in Taif City, KSA, by examining its effect on classroom environmental functions. The results from the previous sections can be analyzed and discussed as follows:

5.1. Visual Comfort: Findings and Discussion

5.1.1. Viewing Angles and Sight Lines

All case studies achieved the required viewing angles and sight lines to the board by optimizing seating arrangements and furniture placement. However, classrooms with wider external walls had an advantage over those with shallower walls. For a 45° sight angle from the eye center, wall-side seats in shallower classrooms required a 20° rotation toward the board, compared to only 10° in wider classrooms.

5.1.2. Illuminance Levels

The achievement of illuminance levels was acceptable in all cases, as shown in Table 4. However, several points could be noted:
  • Window area and window-to-wall ratio (WWR) were key factors in achieving the minimum internal illuminance levels.
  • Although Cases 1, 3, 5, and 7 had the same window area, Cases 1 and 5 achieved higher illuminance levels due to their larger WWR. This indicates that even with shallower external walls, larger WWRs can improve illuminance levels.
  • Southern-oriented windows easily exceeded the minimum illuminance requirements compared to northern-oriented ones. However, southern-oriented cases also faced a higher risk of glare, as most exceeded the 3000 lux threshold set by LEED. Only Case 5, with a shallower external wall, avoided exceeding this threshold, suggesting an advantage in glare reduction for south-facing classrooms.
  • While increasing WWR and window area may provide visual advantages, it also increases the risk of glare in southern-oriented cases.

5.1.3. Color Temperature and Circadian Rhythms

Significant variations were observed based on window orientation and design:
  • South-oriented windows (Cases 5, 6, 7, and 8) provided more dynamic lighting, supporting circadian rhythms and physiological comfort.
  • North-oriented windows (Cases 1, 2, 3, and 4) offered less dynamic lighting, potentially impacting circadian regulation. Cases 4 and 7, with lower WWR, performed worse than other cases with the same orientation.

5.2. Thermal Comfort: Findings and Discussion

Despite relying solely on passive solutions, all cases approached Mostadam and the LEED thermal comfort requirements. This could be attributed to Taif City’s generally acceptable climatic conditions throughout the year [33]. Although all case studies were built according to SBC recommendations, only two cases, Cases 1 and 5, achieved the thermal requirements in both summer-occupied months, as shown in Table 7. This may be due to their shallower external walls, which helped reduce solar heat gain to the internal spaces through their exposed walls. It should be noted that KSA places significant emphasis on achieving thermal comfort in internal spaces compared to other human comforts, as reflected in the high corresponding points allocated to thermal comfort in Mostadam compared to other comfort items and rating systems. This emphasis may stem from the high energy consumption in KSA to achieve thermal comfort when passive solutions are insufficient [2,41]. Additionally, natural ventilation, allowed with local control, contributes to thermal comfort achievement in Taif City and helped Cases 1 and 5 succeed. However, ventilation should be directed above the students’ work area to avoid discomfort from paper movement.
Cases 3 and 7 achieved the required thermal comfort levels in only one summer month and failed in the other, likely due to their wider external walls. Case 7’s failure in June may also be attributed to its southern orientation, which increased exposure to direct solar radiation. Other cases failed in both summer-occupied months, possibly due to their wider external walls combined with high WWR or southern orientation.
To further improve thermal comfort in cases with wider external walls, additional passive cooling strategies could be considered. For example, the use of advanced thermal insulation materials or shading devices, such as horizontal light shelves or external louvers, could reduce solar heat gain while maintaining adequate daylight levels. Studies on passive cooling strategies in hot climates, such as those conducted in KSA, have demonstrated the effectiveness of such measures in improving thermal performance without compromising energy efficiency [13,30].

5.3. Acoustic Comfort: Findings and Discussion

All cases can achieve the required Mostadam and LEED requirements when using proper acoustic materials with appropriate areas. However, it is evident that the closer the students are to their teacher, the better the sound clarity and arrival. A slight difference in noise levels was observed in Table 8 when comparing Cases 1 and 5 with other cases. This comparison revealed a slight advantage for Cases 1 and 5, which have shallower external walls, likely due to the more central and closer positioning of the teacher to a larger number of students in these cases.

5.4. Ventilation: Findings and Discussion

Taif City’s climate conditions allow for natural ventilation, which can be controlled locally and directed away from the students’ work area, as previously mentioned. As a result, the occurrence of high CO2 levels is unlikely, and the ventilation assessment primarily relied on the operable window area. Only 8% of the space floor area is required to be operable, a requirement that can be easily met due to the high percentage of window area relative to the floor area, as shown previously in Table 9.

5.5. Linking to Nature: Findings and Discussion

All case studies could easily achieve the horizontal and vertical viewing angles required to comply with Mostadam and LEED standards, thanks to their wide windows and window-to-wall ratio (WWR). If all cases were built in the same location and site, their external environment aspects would be unified. Therefore, it can be assumed that all required features related to the external environment in Mostadam and LEED are achieved. A satisfying distance to link students to the outdoors is a key aspect of this assessment. When comparing Cases 1 and 5 in terms of the ability to provide visual satisfaction for occupants with a viewing distance ≥ 6 m from the window, 25% of students are guaranteed to achieve such satisfaction, as shown in Table 10. This may give these cases an advantage over other cases regarding this issue.

5.6. Users’ Preferences: Findings and Discussion

Regarding users’ preferences, which reflect the psychological aspect of user comfort, classrooms with deeper board walls (shallower external walls) were identified as the preferred rectangular classroom proportion, as shown in Table 11. This result was derived from an applied questionnaire. Users preferred designs that support a longer board wall, which inherently supports shallower external wall cases. In this preferred proportion, students can more easily perform tasks that require proximity to the board, such as viewing the board, listening to teachers, and reading or copying from the board or nearby materials. These tasks occupy more than half of the school day. Therefore, not only do children with reduced vision prefer front-row seating for better visibility, but most other students also favor this arrangement. Additionally, students tended to prefer seating farther from windows, which aligns with the viewing satisfaction results and may stem from concerns about thermal or visual discomfort if windows are not properly treated. These findings are consistent with previous studies in Kenya, which linked seat position to learning gains and demonstrated that front-row seating positively and significantly impacts learning outcomes in primary school classrooms [12].

5.7. Energy Conservation: Discussion

Regarding energy conservation, which should remain a focus when addressing environmental issues, all case studies were designed to reduce reliance on artificial energy in favor of natural solutions. Although classrooms with shallower external walls may require more artificial lighting compared to other cases, they may need less artificial cooling. Both natural and artificial energy systems can be combined to achieve the required comfort levels with reduced energy consumption. Thermal devices with thermostatic control and mechanical ventilation can help adjust the internal thermal environment when necessary. Lighting control is equally important, as lighting preferences vary depending on the time of day, the activity, and individual student requirements. Window shielding control devices and shade control can positively impact both thermal and lighting conservation, especially when managed with proper supervision [3,8,16].
Smart lighting systems could further enhance energy conservation and visual comfort by regulating light temperature and mimicking natural daylight. These systems can dynamically adjust light intensity and color temperature throughout the day, reinforcing students’ circadian rhythms and improving their overall well-being. For example, cooler light temperatures during morning hours can promote alertness, while warmer tones in the afternoon can help reduce eye strain and prepare students for rest. Such systems not only improve visual comfort but also contribute to energy efficiency by optimizing light usage based on natural daylight availability [15,25].

5.8. Broader Implications: Discussion

5.8.1. Region-Specific Adaptations

The primary goal of this manuscript was to investigate whether the commonly adopted classroom ratio remains effective under different conditions, particularly in light of the holistic environmental assessment approach. It is important to recognize that each country, and even regions within the same country, has unique environmental characteristics that influence architectural design and performance. These variations are often tied to differences in climatic zones. Therefore, recommendations for building environmental functions should not be generalized across regions but should instead be tailored to local conditions.
The findings of this study are highly dependent on the specific environmental conditions of Taif City, which significantly influenced the study’s outcomes. For instance, the optimal window-to-wall ratio (WWR) and classroom orientation were determined based on the need to balance natural light penetration with thermal comfort, particularly during the hot summer months. In other regions with different climatic conditions, such as colder climates or more humid environments, these parameters might need to be adjusted. For example:
  • In colder climates, a higher WWR might be necessary to maximize natural light while minimizing heat loss.
  • In humid climates, additional considerations for ventilation and moisture control might be required to maintain indoor air quality [9,16].
These region-specific adaptations highlight the importance of tailoring classroom designs to local environmental conditions. For instance, in regions with hot and arid climates, such as parts of the Middle East, North Africa, and the southwestern United States, the optimal classroom design identified in this study (e.g., shallower external walls, higher WWR) could be similarly effective in balancing thermal and visual comfort. The use of shading devices and high-performance glazing, as recommended in this study, could help mitigate solar heat gain while ensuring adequate daylight penetration [13,15].

5.8.2. Implications for Educational Models

The findings also have implications for different educational models beyond the traditional “scholar on a box” layout. In collaborative learning environments, where students work in groups rather than facing a single board, the optimal classroom design might prioritize flexible seating arrangements and multiple focal points (e.g., whiteboards or projectors on multiple walls). For example, the findings on acoustic comfort (e.g., sound insulation and absorption) could be particularly relevant in open-plan classrooms to minimize noise distractions and ensure speech clarity [5,38].
In technology-integrated classrooms, the glare avoidance strategies discussed in this study could be adapted to reduce glare on digital screens, while the findings on thermal comfort could inform the placement of heat-generating equipment (e.g., computers, projectors) to minimize their impact on indoor temperatures [8,16]. These adaptations demonstrate the versatility of the design strategies proposed in this study.

5.8.3. Policy and Design Recommendations

To ensure the widespread applicability of these findings, we recommend the development of region-specific green building guidelines for educational buildings. These guidelines could emphasize the importance of shading devices, high-performance glazing, and natural ventilation in hot climates while focusing on maximizing daylight and minimizing heat loss in colder climates [13,15]. Additionally, conducting post-occupancy evaluations (POEs) in classrooms could provide valuable feedback on how well the design strategies perform in practice and identify areas for improvement. For example, POEs could assess the effectiveness of glare control measures or the adequacy of natural ventilation in real-world settings [3,5]. These evaluations would help refine design strategies and ensure that classrooms meet the needs of their occupants.

5.9. Future Research Directions

Future research could explore the environmental performance of alternative classroom shapes (e.g., L-shaped, circular, or hexagonal classrooms) to determine whether they offer advantages over rectangular designs. For instance, circular classrooms might provide more uniform daylight distribution, while L-shaped classrooms could offer better flexibility for collaborative learning activities [11,24]. Additionally, investigating the use of dynamic lighting systems that adjust light intensity and color temperature throughout the day could reinforce circadian rhythms and improve student well-being [19,25]. Finally, research on how cultural and behavioral factors influence the effectiveness of classroom design strategies in different regions could provide valuable insights for designing culturally responsive learning environments. For example, seating preferences or teaching styles might vary across cultures, requiring tailored design solutions [12,16].

6. Conclusions

Some deeply ingrained architectural norms may hinder the exploration of alternative designs that could offer greater advantages. Scientific evidence suggests that reconsidering conventional rectangular classroom proportions could yield benefits, particularly in Taif City, KSA. Contrary to the standard classroom design commonly applied in KSA, a classroom with a shallower external wall was found to be more environmentally effective.
In this manuscript, several case studies were proposed to represent both common and unconventional rectangular classroom designs, with variations in window dimensions, window-to-wall ratios (WWR), and orientations. Simulations and calculations were conducted to compare these case studies based on key internal environmental functions, including visual comfort, thermal comfort, acoustic comfort, ventilation, and linking to nature. These functions are crucial and vary in importance depending on the building’s purpose. The comparison utilized the Mostadam and LEED rating systems, which are widely recognized for environmental assessment, to establish the required performance ranges for these functions. Additionally, the manuscript emphasized user preferences, which contribute to psychological comfort and are linked to students’ academic performance and achievement.
The results were analyzed to determine the final findings through a holistic assessment of the case studies. The proposed assessment criteria and related points were based on the Mostadam and LEED systems. The assessment revealed that classrooms with shallower external walls outperformed those with wider external walls in terms of environmental efficiency. These cases scored higher overall, indicating better achievement of environmental functions over longer periods and fewer conflicts among them.
The key takeaway is that no architectural standard should be rigidly adhered to without first being evaluated under the specific conditions that influence its related functions. Case studies 1 and 5, featuring shallower external walls, demonstrated superior environmental performance, earning higher overall points than the other cases. It is recommended to identify the optimal classroom design for Taif City, which may differ from designs suitable for other locations, even within KSA. Furthermore, it is advisable to reconsider architectural designs in light of all related internal functions, rather than focusing solely on the most critical aspects of a particular building type. Modern building assessments should adopt a holistic perspective, especially concerning environmental considerations.
Based on the findings of this study, several recommendations are proposed to enhance classroom design in Taif City and similar regions. First, adopting shallower external wall configurations (as in Cases 1 and 5) is recommended to improve thermal, visual, and acoustic comfort while reducing energy consumption. Future research should explore other classroom shapes and configurations, as well as the impact of design on collaborative learning environments. User preferences, which favor shallower external walls for better engagement and proximity to the board, should be integrated into design decisions. Additionally, region-specific green building guidelines should be developed to tailor standards to local climatic and cultural contexts. Finally, the use of simulation tools like DesignBuilder and DIAlux Evo should be encouraged during the design phase, and post-occupancy evaluations should be conducted to assess real-world performance and refine future designs.

Funding

The authors would like to acknowledge Deanship of Graduate Studies and Scientific Research, Taif University for funding this work.

Institutional Review Board Statement

Ethical review and approval were waived for this study due to legal regulations. The use of anonymous questionnaires does not require Institutional Review Board (IRB) approval under the ethical guidelines established by the National Committee of Bioethics (NCBE) in the Kingdom of Saudi Arabia. According to Article 10.19 of the NCBE Guidelines, research involving anonymous questionnaires that do not collect identifiable personal information and pose minimal risk to participants is exempt from formal IRB review [66].

Informed Consent Statement

Informed consent was obtained from all subjects involved in the study.

Data Availability Statement

The data supporting the findings of this study are available within the manuscript.

Acknowledgments

The authors would like to acknowledge Deanship of Graduate Studies and Scientific Research, Taif University for funding this work.

Conflicts of Interest

The author declares no conflicts of interest.

References

  1. USGBC. LEED v4 for Building Design and Construction; United States Green Building Council (USGBC): Washington, DC, USA, 2019. [Google Scholar]
  2. KSA Ministry of Housing; Sustainable Building Institute; Saudi Real Estate Institute. Mostadam Rating System: Commercial Buildings—D+C Manual. 2019. Available online: https://subdivision-prod.ruh-s3.bluvalt.com/s3fs-public/mostadam/2024-05/Mostadam%20for%20Commercial%20Buildings%20(D%2BC).pdf (accessed on 15 May 2024).
  3. Barrett, P.; Davies, F.; Zhang, Y.; Barrett, L. The impact of classroom design on pupils’ learning: Final results of a holistic, multi-level analysis. Build. Environ. 2015, 89, 118–133. [Google Scholar] [CrossRef]
  4. Widiastuti, K.; Susilo, M.J.; Nurfinaputri, H.S. How classroom design impacts for student learning comfort: Architect perspective on designing classrooms. Int. J. Eval. Res. Educ. 2020, 9, 469–477. [Google Scholar] [CrossRef]
  5. Barrett, P.; Zhang, Y.; Davies, F.; Barrett, L. Clever Classrooms: Summary Report of the HEAD Project. Manchester, 2015. [Online]. Available online: http://usir.salford.ac.uk/35221/ (accessed on 15 May 2024).
  6. Cheryan, S.; Ziegler, S.A.; Plaut, V.C.; Meltzoff, A.N. Designing Classrooms to Maximize Student Achievement. Education 2014, 1, 4–12. [Google Scholar] [CrossRef]
  7. Gremmen, M.; van den Berg, Y.H.M.; Segers, E.; Cillessen, A.H.N. Considerations for Classroom Seating Arrangements and the Role of Teacher Characteristics and Beliefs. Soc. Psychol. Educ. 2016, 19, 749–774. [Google Scholar] [CrossRef]
  8. Baker, L. A History of School Design and its Indoor Environmental Standards, 1900 to Today; National Clearinghouse for Educational Facilities: Washington, DC, USA, 2012. [Google Scholar]
  9. Alama, A.; Sabbagh, M. Indoor Air Quality Assessment Inside Secondary Public Classrooms in Jeddah, Saudi Arabia. J. Eng. Res. 2022, 10, 28–43. [Google Scholar] [CrossRef]
  10. López-Chao, V.; Lorenzo, A.A.; Saorín, J.L.; La Torre-Cantero, J.D.; Melián-Díaz, D. Classroom Indoor Environment Assessment through Architectural Analysis for the Design of Efficient Schools. Sustainability 2020, 12, 2020. [Google Scholar] [CrossRef]
  11. Zhang, A.; Bokel, R.; van den Dobbelsteen, A.; Sun, Y.; Huang, Q.; Zhang, Q. The Effect of Geometry Parameters on Energy and Thermal Performance of School Buildings in Cold Climates of China. Sustainability 2017, 9, 1708. [Google Scholar] [CrossRef]
  12. Ngware, M.W.; Ciera, J.; Musyoka, P.K.; Oketch, M. The Influence of Classroom Seating Position on Student Learning Gains in Primary Schools in Kenya. Creat. Educ. 2013, 4, 705–712. [Google Scholar] [CrossRef]
  13. Alwetaishi, M.; Taki, A. Investigation into Energy Performance of a School Building in a Hot Climate: Optimum of Window-to-Wall Ratio. Indoor Built Environ. 2020, 29, 24–39. [Google Scholar] [CrossRef]
  14. Shamseldin, A.K.M. Assessment of Minimizing the Environmental Functions Conflict in Buildings. J. Build. Constr. Plan. Res. 2016, 4, 119–129. [Google Scholar] [CrossRef]
  15. Shamseldin, A.; Alwetaishi, M.; Alzaed, A. Visual Comfort Achievement In Compliance with Thermal Comfort Recommendations In Educational Buildings In Taif City, KSA. In Proceedings of the International Conference of Women in Data Science at Taif University (WiDSTaif), Taif, Saudi Arabia, 30–31 March 2021. [Google Scholar] [CrossRef]
  16. Wall, G. The Impact of Physical Design on Student Outcomes; New Zealand Government: Wellington, New Zealand, 2016. [Google Scholar]
  17. Leccese, F.; Rocca, M.; Salvadori, G.; Belloni, E.; Buratti, C. A multicriteria method to identify and rank IEQ criticalities: Measurements and applications for existing school buildings. Energy Built Environ. 2025, 6, 387–401. [Google Scholar] [CrossRef]
  18. Catalina, T.; Iordache, V. IEQ assessment on schools in the design stage. Build. Environ. 2012, 49, 129–140. [Google Scholar] [CrossRef]
  19. Leccese, F.; Salvadori, G.; Rocca, M.; Buratti, C.; Belloni, E. A method to assess lighting quality in educational rooms using analytic hierarchy process. Build. Environ. 2020, 168, 106501. [Google Scholar] [CrossRef]
  20. Frontczak, M.; Wargocki, P. Literature survey on how different factors influence human comfort in indoor environments. Build. Environ. 2011, 46, 922–937. [Google Scholar] [CrossRef]
  21. Zhang, F.; de Dear, R.; Hancock, P. Effects of moderate thermal environments on cognitive performance: A multidisciplinary review. Appl. Energy 2019, 236, 760–777. [Google Scholar] [CrossRef]
  22. Wang, C.; Zhang, F.; Wang, J.; Doyle, J.K.; Hancock, P.A.; Mak, C.M.; Liu, S. How indoor environmental quality affects occupants’ cognitive functions: A systematic review. Build. Environ. 2021, 193, 107647. [Google Scholar] [CrossRef]
  23. Shamseldin, A.K. Proposed Role of the Local Saudi Building Codes in Assessing the Energy Performance of Buildings in KSA’s GBRS. Ain Shams Eng. J. 2022, 14, 101966. [Google Scholar]
  24. Neufert, E.; Neufert, P. Neufert Architect’s Data; Willey-Blackwell: Wiesbaden, Germany, 2012. [Google Scholar]
  25. Shrestha, H.D.; Pribadi, K.S.; Lim, E. Handbook of Typical School Design (General) 2 Classrooms and 3 Classrooms; Save the Children: Nairobi, Kenya, 2009. [Google Scholar]
  26. Alwetaishi, M. Human Thermal Comfort and Building Performance of Schools in Hot and Humid Climate with a Particular Reference to Saudi Arabia, Jeddah. Ph.D. Thesis, University of Nottingham, Nottingham, UK, 2015. [Google Scholar]
  27. Alwetaishi, M.; Alzaed, A.; Sonetti, G.; Shrahily, R.; Jalil, L. Investigation of school building microclimate using advanced energy equipment: Case study. Environ. Eng. Res. 2018, 23, 10–20. [Google Scholar] [CrossRef]
  28. Alwetaishi, M.; Balabel, A. Numerical Study of Micro-Climatically Responsive School Building design in Saudi Arabia. J. King Saud Univ.-Eng. Sci. 2019, 31, 224–233. [Google Scholar] [CrossRef]
  29. Alwetaishi, M.; Gadi, M. Toward sustainable school building design: A case study in hot and humid climate. Cogent Eng. 2018, 5, 1452665. [Google Scholar] [CrossRef]
  30. Alwetaishi, M. Impact of Glazing to Wall Ratio in Various Climatic Regions: A Case Study. J. King Saud Univ.-Eng. Sci. 2019, 31, 6–18. [Google Scholar] [CrossRef]
  31. Alama, A.M.S.; Sabbagh, M. Comparing Daylight Distribution Between Two Classroom Prototypes in Jeddah Public Schools. In Proceedings of the 86th Research World International Conference, Jeddah, Saudi Arabia, 14 March 2020. [Google Scholar]
  32. Shamseldin, A.; Balabel, A.; Alwetaishi, M.; Abdelhafiz, A.; Issa, U.; Sharaky, I.; Al-Surf, M.; Al-Harthi, M. Adjustment of the indoor environmental quality assessment field for Taif city-Saudi Arabia. Sustainability 2020, 12, 10275. [Google Scholar] [CrossRef]
  33. Climate Consultant 6.0. 2023, Parallels Software International, Inc.: 6. [Online]. Available online: https://climate-consultant.informer.com/6.0/ (accessed on 14 March 2025).
  34. Shamseldin, A.K. Adaptation Opportunities for Balconies to Achieve Continuity of Their Environmental Functions. Alex. Eng. J. 2022, 67, 287–299. [Google Scholar]
  35. Qahtan, A.M. Daylight Illuminance in Classrooms Adjacent to Covered and Uncovered Courtyards Under the Clear Sky of Najran City, Saudi Arabia. Emir. J. Eng. Res. (EJER) 2019, 24, 4. [Google Scholar]
  36. Kızılaslan, A. Teaching Students with Visual Impairment; no. April; Nova Science Publisher: Hauppauge, NY, USA, 2020. [Google Scholar]
  37. University Planning, Design and Construction (UPDC) and Classroom Management Committee. Appendix VI Classroom Design Guidelines: Classroom and Lecture Hall Design Guidelines; University Planning Architectural and Engineering Services: Storrs, CT, USA, 2020; Available online: https://updc.uconn.edu/wp-content/uploads/sites/1525/2020/09/Appendix-VI-Classroom-Design-Standards-August-2020.pdf (accessed on 15 May 2024).
  38. Recalde, J.M.; Palau, R.; Márquez, M. How Classroom Acoustics Influence Students and Teachers: A Systematic Literature Review. J. Technol. Sci. Educ. 2021, 11, 245–259. [Google Scholar] [CrossRef]
  39. Shamseldin, A.K.M. Considering coexistence with Nature in the Environmental Assessment of Buildings. Hous. Build. Natl. Res. Cent. 2018, 14, 243–254. [Google Scholar] [CrossRef]
  40. ANSI/ASHRAE Standard 55-2010; Thermal Environmental Conditions for Human Occupancy. American Society of Heating Refrigerating and Air-Conditioning Engineers Standards Committee: Atlanta, GA, USA, 2010. Available online: https://www.ashrae.org/technical-resources/standards-and-guidelines/standards-addenda (accessed on 15 May 2024).
  41. SBC 601-AR; Saudi Energy Conservation Code-Non-Residential. Saudi Building Code National Committee: Riyadh, Saudi Arabia, 2018.
  42. WELL. The WELL Building Standard v2 with Q1 2019 Addenda; WELL Building Institute: New York, NY, USA, 2019. [Google Scholar]
  43. International WELL Building Institute. 2020. Available online: https://standard.wellcertified.com/light/surface-design (accessed on 15 May 2024).
  44. Pelegrin-Garcia, D.; Brunskog, J. Classroom Acoustics Design Guidelines Based on the Optimization of Speaker Conditions. In European Conference on Noise Control (Euronoise); European Acoustics Association: Prague, Czech Republic, 2012; pp. 61–66. [Google Scholar]
  45. DesignBuilder v7. 2022, DesignBuilder Software Ltd. [Online]. Available online: https://designbuilder.co.uk/download/release-software (accessed on 15 May 2024).
  46. Alwetaishi, M.; Gadi, M.; Issa, U.H. Reliance of building energy in various climatic regions using multi criteria. Int. J. Sustain. Built Environ. 2017, 6, 555–564. [Google Scholar] [CrossRef]
  47. van der Zanden, P. Readability in Classrooms; Delft University of Technology: Delft, The Netherlands, 2014. [Google Scholar]
  48. EN 17037; CEN European Daylight Standard. VELUX Group: Hørsholm, Denmark, 2019.
  49. SBC 201; The Saudi Building Code-General. The Saudi Building Code National Committee: Riyadh, Saudi Arabia, 2020.
  50. Kamis, A.S. Future Domestic Water Demand for Jeddah City. Mt. Res. Dev. 2018, 12, 93–103. [Google Scholar] [CrossRef]
  51. GAISMA. Available online: https://www.gaisma.com/en/location/at-taif.html (accessed on 15 May 2024).
  52. DIAlux evo Software. 2023, DIAL GmbH, Lüdenscheid: 12. [Online]. Available online: https://www.dialux.com/en-GB/download (accessed on 15 May 2024).
  53. Shamseldin, A. Improvement of the psychological lighting effect assessment in the environmental building rating systems. J. Sustain. Archit. Civ. Eng. 2021, 29, 102–120. [Google Scholar] [CrossRef]
  54. ISO 7730; Ergonomics of the thermal environment—Analytical Determination and Interpretation of Thermal Comfort Using Calculation of the PMV and PPD Indices and Local Thermal Comfort Criteria. ISO Central Secretariat: Geneva, Switzerland, 2024.
  55. Tartarini, F.; Schiavon, S.; Cheung, T.; Hoyt, T. CBE Thermal Comfort Tool: Online tool for thermal comfort calculations and visualizations. SoftwareX 2020, 12, 100563. [Google Scholar]
  56. Gao, C. Calculation of Predicted Mean Vote (PMV), and Predicted Percentage Dissatisfied (PPD). [Online]. Available online: https://www.design.lth.se/english/the-department/research-laboratories/aerosol-climate-laboratory/climate/tools/calculation-of-pmv-and-ppd/ (accessed on 15 May 2024).
  57. Kuklane, K.; Toma, R. Common Clothing Area Factor Estimation Equations are Inaccurate for Highly Insulating (Icl>2 clo) and Non-Western Loose-Fitting Clothing Ensembles. Ind. Health 2021, 59, 107–116. [Google Scholar] [CrossRef] [PubMed]
  58. Dyvia, H.A.; Arif, C. Analysis of Thermal Comfort with Predicted Mean Vote (PMV) Index Using Artificial Neural Network. In IOP Conf. Series: Earth and Environmental Science 622 (2021) 012019; ISCEE 2020, Ed.; IOP Publishing: Bristol, UK, 2021. [Google Scholar] [CrossRef]
  59. Ekici, C. A Review of Thermal Comfort and Method of Using Fanger’s PMV Equation. In Proceedings of the 5th International Symposium on Measurement, Analysis and Modelling of Human Functions, ISHF 2013, Vancouver, BC, Canada, 27–29 June 2013; pp. 61–64. [Google Scholar]
  60. da Silva, M.C.G. Spreadsheets for the Calculation of Thermal Comfort Indices PMV and PPD; University of Coimbra: Coimbra, Portugal, 2014. [Google Scholar] [CrossRef]
  61. Cakó, B.; Zoltán, E.S.; Girán, J.; Medvegy, G.; Miklós, M.E.; Nyers, Á.; Grozdics, A.T.; Kisander, Z.; Bagdán, V.; Borsos, Á. An Efficient Method to Compute Thermal Parameters of the Comfort Map Using a Decreased Number of Measurements. Energies 2021, 14, 5632. [Google Scholar] [CrossRef]
  62. WKC Group Environment Consultants. Internal Noise Calculator. [Online]. Available online: https://www.wkcgroup.com/tools-room/internal-noise-calculator/ (accessed on 20 December 2022).
  63. El-Sharkawy, M.F.M. Study the Indoor Air Quality Level Inside Governmental Elementary Schools of Dammam City in Saudi Arabia. Int. J. Environ. Health Eng. 2014, 3, 22. [Google Scholar] [CrossRef]
  64. Su, S.; Gu, S.; Zhao, Y.; Chen, Z.; Wang, H.; Yang, W. Human Ocularc Physiological Characteristics Based Adaptive Console Design. IEEE Access 2020, 8, 109596–109607. [Google Scholar] [CrossRef]
  65. Kent, M.; Schiavon, S. Evaluation of the Effect of Landscape Distance Seen in Window Views on Visual Satisfaction. Build. Environ. 2020, 183, 107160. [Google Scholar] [CrossRef]
  66. National Committee of BioEthics (NCBE). Implementing Regulations of the Law of Ethics of Research on Living Creatures, Version 3; King Abdulaziz City for Science and Technology: Riyadh, Saudi Arabia, 2022; [Online]. Available online: https://researchcompliance.kaust.edu.sa/IBEC/guidelines/Implementing%20Regulations%20of%20the%20Law%20of%20Ethics%20of%20Research%20on%20Living%20Creatures_%20Version%203_2022.pdf (accessed on 14 March 2025).
Figure 1. Psychrometric chart for Taif City illustrating the proportion of comfortable thermal hours achievable (66.7%) through only passive and natural design strategies (strategies no. 1,2,3,4,7,10,11 and 12) [Author using Climate Consultant software [33]].
Sustainability 17 03198 g001
Figure 2. Verification criteria based on Mostadam and LEED references for assessing the environmental functions achievement of the case studies.
Sustainability 17 03198 g002
Figure 3. The framework flow chart illustrates the study’s methodology, including the tools used and verification references, to derive results and recommendations.
Sustainability 17 03198 g003
Figure 4. Seating arrangement to accomplish visual comfort angles for Cases 1 and 5. (a) Considering the visual comfort angle of 60° from the eye center; (b) considering the visual comfort angle of 45°, noting that the side desks were rotated by 20° toward the board.
Sustainability 17 03198 g004
Figure 5. Seating arrangement to accomplish visual comfort angles for Cases 2, 3, 4, 6, 7, and 8. (a) Considering the visual comfort angle of 60° from the eye center; (b) considering the visual comfort angle of 45°, noting that the side desks were rotated by 10° toward the board.
Sustainability 17 03198 g005
Figure 6. Screenshots from the CBE thermal comfort tool showing PMV and PPD calculations for Case 1, based on inputs from the DesignBuilder program and Climate Consultant tool: (a) June; (b) September [Author using the CBE thermal comfort tool [55]]. Note: The red dot marks the current operative temperature and humidity, while the blue shaded area represents the ASHRAE Standard 55-2023 comfort zone [40].
Sustainability 17 03198 g006
Figure 7. Questionnaire results of students’ and parents’ preferences regarding seating position in the classroom: (a) through rows; (b) through columns.
Sustainability 17 03198 g007
Figure 8. Questionnaire results of students’, parents’, and teachers’ opinions on the effect of students’ proximity to the board wall: (a) on their academic achievement; (b) on their class engagement.
Sustainability 17 03198 g008
Figure 9. Questionnaire results of students’, parents’, and teachers’ opinions on the effect of students’ proximity to the board wall: (a) on their social development; (b) on the preferred rectangular classroom proportions.
Sustainability 17 03198 g009
Table 1. Four KSA school prototype plans with hatched classrooms illustrating the common classroom proportions in KSA. (Drawings created by the author based on references [26,27,28,29,30]).
Sustainability 17 03198 i001Sustainability 17 03198 i002
Prototype of boys’ schools—the most common, replicated in every town and city.Prototype of boys’ schools—usually used for the primary level.
Sustainability 17 03198 i003Sustainability 17 03198 i004
Prototype of boys’ schools—designed for the three school levels.Prototype of boys’ schools for the three school levels.
Table 2. Dimensions and ratios of the case studies.
Aspects of the Case StudiesCase 1Case 2Case 3Case 4Case 5Case 6Case 7Case 8
Sustainability 17 03198 i005Sustainability 17 03198 i006Sustainability 17 03198 i007Sustainability 17 03198 i008Sustainability 17 03198 i009Sustainability 17 03198 i010Sustainability 17 03198 i011Sustainability 17 03198 i012
Room dimensions (m)
(depth:external wall length)
8:66:86:86:88:66:86:86:8
Window orientationNorthNorthNorthNorthSouthSouthSouthSouth
Window dimensions (m)
(Width:height)
5:2.15.6:2.55.25:27:25:2.15.6:2.55.25:27:2
Window area (m2)10.51410.5 1410.51410.5 14
WWR (%)5050375050503750
Table 3. Illuminance levels simulation results of the case studies across different months (June, December, and February) as simulated in DIAlux Evo software. Note: The North direction is always upward [Author using DIAlux evo software [52]].
Sustainability 17 03198 i013
Color Ruler used for the Illuminance Levels (Lux)
Case 1
JuneDecemberFebruary
Sustainability 17 03198 i014
Case 2
JuneDecemberFebruary
Sustainability 17 03198 i017
Case 3
JuneDecemberFebruary
Sustainability 17 03198 i020
Case 4
JuneDecemberFebruary
Sustainability 17 03198 i023
Case 5
JuneDecemberFebruary
Sustainability 17 03198 i026
Case 6
JuneDecemberFebruary
Sustainability 17 03198 i029
Case 7
JuneDecemberFebruary
Sustainability 17 03198 i032
Case 8
JuneDecemberFebruary
Sustainability 17 03198 i035
Table 4. Achievement of illuminance levels and glare avoidance according to LEED and Mostadam’s required ranges for the classroom case studies.
Case No% of the Occupied Area with Daylight Illuminance Less than 300 lux (Insufficient)% of the Occupied Area with Daylight Illuminance of More than 3000 lux (Risk of Glare)Achievement of Mostadam and LEED Ranges
JuneDecemberFebruaryJuneDecemberFebruary
Case 15.6%16%20.6%0%0%0%
Case 20.6%0.9%0.7%0%0%0%
Case 314.6%24.6%20.7%0%0%0%
Case 40.5%1%0.7%0%0%0%
Case 59.7%0%0%0%0%0%
Case 60.7%0%0%0%23%13.4%
Case 714.2%0%0%0%9.9%8.8%
Case 80.3%0%0%0%21.6%15.2%
Table 5. Performance of case studies in color temperature and circadian rhythms based on previous studies.
Window OrientationWindow Area (m2)WWR (%)Expected Performance in Color Temperature and Circadian Rhythms According to Previous Studies.
Case 1North10.550Moderate
Case 2North1450Moderate
Case 3North10.537Low
Case 4North1450Moderate
Case 5South10.550High
Case 6South1450High
Case 7South10.537Moderate
Case 8South1450High
Table 6. Thermal characteristics of the classroom case studies during summer months [Author using DesignBuilder software [45]].
Case 1Case 2
Sustainability 17 03198 i038Sustainability 17 03198 i039
Case 3Case 4
Sustainability 17 03198 i040Sustainability 17 03198 i041
Case 5Case 6
Sustainability 17 03198 i042Sustainability 17 03198 i043
Case 7Case 8
Sustainability 17 03198 i044Sustainability 17 03198 i045
Table 7. PMV and PPD results for the classroom case studies and their compliance with LEED and Mostadam required ranges [Author using the CBE thermal comfort tool [55]].
Case No.Occupied Summer Months InputsOutputsAchievement of Mostadam and LEED Ranges
Operative Temperature Top (°C)Relative Humidity rh (%)PMVPPD (%)
Case 1June32.9718.840.378
September32.3523.610.277
Case 2June34.8717.210.9926X
September33.6122.730.6915X
Case 3June33.7418.160.6213X
September32.7223.210.398
Case 4June34.8517.230.9825X
September33.1422.750.5311X
Case 5June32.8117.020.5010
September32.4023.470.4710
Case 6June33.7918.110.6313X
September34.7721.151.0629X
Case 7June34.3317.690.8119X
September32.9222.970.469
Case 8June33.7718.130.6313X
September34.7521.181.0629X
Table 8. Internal noise levels for the classroom case studies, relative to Mostadam’s required ranges, after assuming Case 1 as a base case [Author using Internal Noise Calculator [62]].
Case No.The Internal Ambient Noise LevelComparable Achievement of Mostadam Ranges (Considering Case 1 Model as a Base Case).
Cases 1 and 535
Cases 2, 4, 6, and 836.5X
Cases 3 and 736.1X
Table 9. Ventilation accomplishment for the classroom case studies and their compliance with Mostadam’s required range.
Case No.% of the Window to the Floor AreaAchievement of Mostadam Range (>8%)
Cases 1, 3, 5, and 721.9
Cases 2, 4, 6, and 829.2
Table 10. Linking to nature accomplishment results concerning Mostadam and LEED required ranges and satisfactory viewing distance achievement.
Cases 1 and 5Cases 2 and 6Cases 3, 4, 7, 8
Sustainability 17 03198 i046Sustainability 17 03198 i047Sustainability 17 03198 i048
Achievement of Mostadam and LEED ranges (75% of floor area with a direct sight line and an elevation angle of 25°)
The ratio of students with guaranteed satisfactory viewing (distance from the window ≥ 6 m)25%0%0%
Table 11. Users’ preferences for external/internal wall ratios of rectangular classrooms in Taif City.
Case No.% of Users’ Preference
Case 1, 569%
Cases 2, 3, 4, 6, 7, and 831%
Table 12. LEED and Mostadam related items to the indoor environmental physical functions used to assess the case studies and their corresponding achievement points.
Indoor Environmental Physical FunctionsLEED Related ItemsCorresponding PointsMostadam Related ItemsCorresponding Points
Visual ComfortEQ Credit: Daylight (Option 3)3 (illuminance levels > 90% of floor area)HC-07 Daylight and Views (Daylight Item)1
2 (illuminance levels > 75% of floor area)
Thermal ComfortEQ Credit: Thermal Comfort1HC-02 Indoor Thermal Comfort3
Acoustic ComfortAcoustic Performance1HC-09 Acoustics2
VentilationIndoor Air Quality Assessment2HC-03 Ventilation1
Linking to NatureQuality Views1HC-07 Daylight and Views (Views Item)1
Table 13. Proposed assessment items and their corresponding points based mainly on LEED and Mostadam systems to assess the case studies.
Indoor Environmental FunctionsCorresponding Points
PhysicalVisual ComfortViewing Angles and Sight Lines0.5
Illuminance Levels and Glare Avoidance2 (illuminance levels > 90% of floor area)
1 (illuminance levels > 75% of floor area)
PhysiologicalColor Temperature and Circadian Rhythms0.5
PhysicalThermal Comfort2
Acoustic Comfort1.5
Ventilation1.5
PsychologicalLinking to Nature1
Users’ Preferences2
Table 14. Case studies assessment according to the proposed assessment items and points regarding the achievement of the indoor environmental functions.
Assessment ItemCase Studies
Case 1Case 2Case 3Case 4Case 5Case 6Case 7Case 8
Viewing Angles and Sight Lines
(1 point)
0.40.450.450.450.40.450.450.45
Illuminance Levels and Glare Avoidance
(1–2 points)
12122111
Color Temperature and Circadian Rhythms0.40.40.320.40.50.50.40.5
Thermal Comfort
(2 points)
20002000
Acoustic Comfort
(1.5 points)
1.51.351.351.351.51.351.351.35
Ventilation
(1.5 points)
1.51.51.51.51.51.51.51.5
Linking to Nature
(1 point)
10.750.750.7510.750.750.75
Users’ Preferences
(2 points)
1.380.620.620.621.380.620.620.62
Total points/1110.187.075.997.0710.687.077.077.17
Disclaimer/Publisher’s Note: The statements, opinions and data contained in all publications are solely those of the individual author(s) and contributor(s) and not of MDPI and/or the editor(s). MDPI and/or the editor(s) disclaim responsibility for any injury to people or property resulting from any ideas, methods, instructions or products referred to in the content.