1. Introduction
In the context of globalization and urbanization, rural decline has emerged as a prominent phenomenon characterized by the ongoing migration of people from rural areas to urban centers, resulting in depopulation, industrial contraction, and gradual economic weakening in rural regions [
1,
2]. Rural resource loss and degradation have emerged as a global challenge [
3,
4]. As one of the countries most significantly impacted by this phenomenon, China is confronted with the critical challenge of rural decline [
5]. In response to this challenge, the Chinese government introduced a significant development initiative, the “Rural Revitalization Strategy”, in October 2017. Subsequently, in September 2018, the Strategic Plan for Rural Revitalization (2018–2022) was developed to promote industrial prosperity, ecological livability, rural civilization, life affluence, and effective governance in rural areas.
Currently, there is a growing focus within the academic community on rural revitalization. The related literature mainly focuses on two core areas: exploring the connotations and methods of rural revitalization, and assessing and measuring its level. In terms of analyzing the connotation and realization approach of rural revitalization, Zhou et al. [
6] investigated how land consolidation helps revitalize rural areas. Research by Nizam and Tatari [
7] suggests that Geographical Indications (GI) could potentially serve as a viable strategy for the revitalization of rural areas in Turkey. Geng et al. [
8] examined the implications of rural revitalization from the perspective of coordinated development. Based on panel data from 31 provinces in China spanning 2011 to 2020, Wang [
9] discovered that digital inclusive finance plays a significant role in promoting rural revitalization. Deng et al. [
10] used data from 20 prefecture-level cities in Guangdong Province from 2011 to 2021 to assess the influence of the digital economy on rural revitalization. Sun et al. [
11] analyzed the rural revitalization mechanism based on spatial governance in China from the perspective of development rights.
Existing research on measuring the level of rural revitalization primarily focuses on analyzing rural development levels, often overlooking the pace and long-term trajectory of rural development. Li et al. [
12] constructed a rural system evaluation model with many factors weighted. Feng and Zhang [
13] measured the level of rural revitalization in China using the entropy weight TOPSIS method. Sun et al. [
14] integrated the Variable Fuzzy Pattern Evaluation (VFPE) model with the analytic hierarchy process-entropy (AHP-E) model for the dynamic and continuous assessment of rural living environments. Wang et al. [
15] employed an entropy-based TOPSIS model to assess the level of green development in agricultural and rural areas of China.
Symbiosis, a fundamental concept in biological sciences, describes the coexistence of different biological entities [
16]. At present, the theory of symbiosis is widely used in economics, sociology, and other disciplines [
17,
18,
19,
20]. Rural revitalization encompasses the comprehensive rejuvenation of industry, talent, culture, ecology, and organization. The interplay and coordinated advancement of these five facets form a holistic framework of rural revitalization, with each being complementary and indispensable [
8,
21,
22]. However, existing research lacks an in-depth analysis of the symbiotic relationships among the various subsystems of rural revitalization and overlooks the dynamic changes in the speed of rural revitalization. To address this, our research aims to: (1) investigate the symbiotic mechanism among the five subsystems, namely, industrial prosperity, ecological livability, rural civilization, effective governance, and life affluence; and (2) propose a novel dynamic evaluation framework that integrates both static levels and developmental speeds of rural revitalization.
Our findings contribute to rural revitalization research in three key ways. First, we analyze the connotation of rural revitalization from a symbiotic perspective. Second, the dynamic comprehensive evaluation model addresses the limitations of traditional static assessment by capturing the temporal evolution patterns ignored by previous studies. Finally, based on the model proposed in this study, we classify provinces into four types: “high-high”, “high-low”, “low-high”, and “low-low”. This lays a solid theoretical foundation for implementing a differentiated rural revitalization strategy.
Further material is divided into several parts. Thus, in
Section 2, we establish the theoretical framework underpinning this research, providing the conceptual foundation for subsequent analysis.
Section 3 presents a comprehensive exposition of both static and dynamic evaluation models developed based on the established framework.
Section 4 systematically documents the results obtained by applying these models. Finally,
Section 5 synthesizes key findings and draws substantive conclusions from the study.
2. Theoretical Framework
2.1. Connotation of Rural Revitalization from the Perspective of Symbiosis
The rural area is a typical multilayer, multidimensional, multifunctional, and multipurpose complex system composed of multiple subjects [
23,
24,
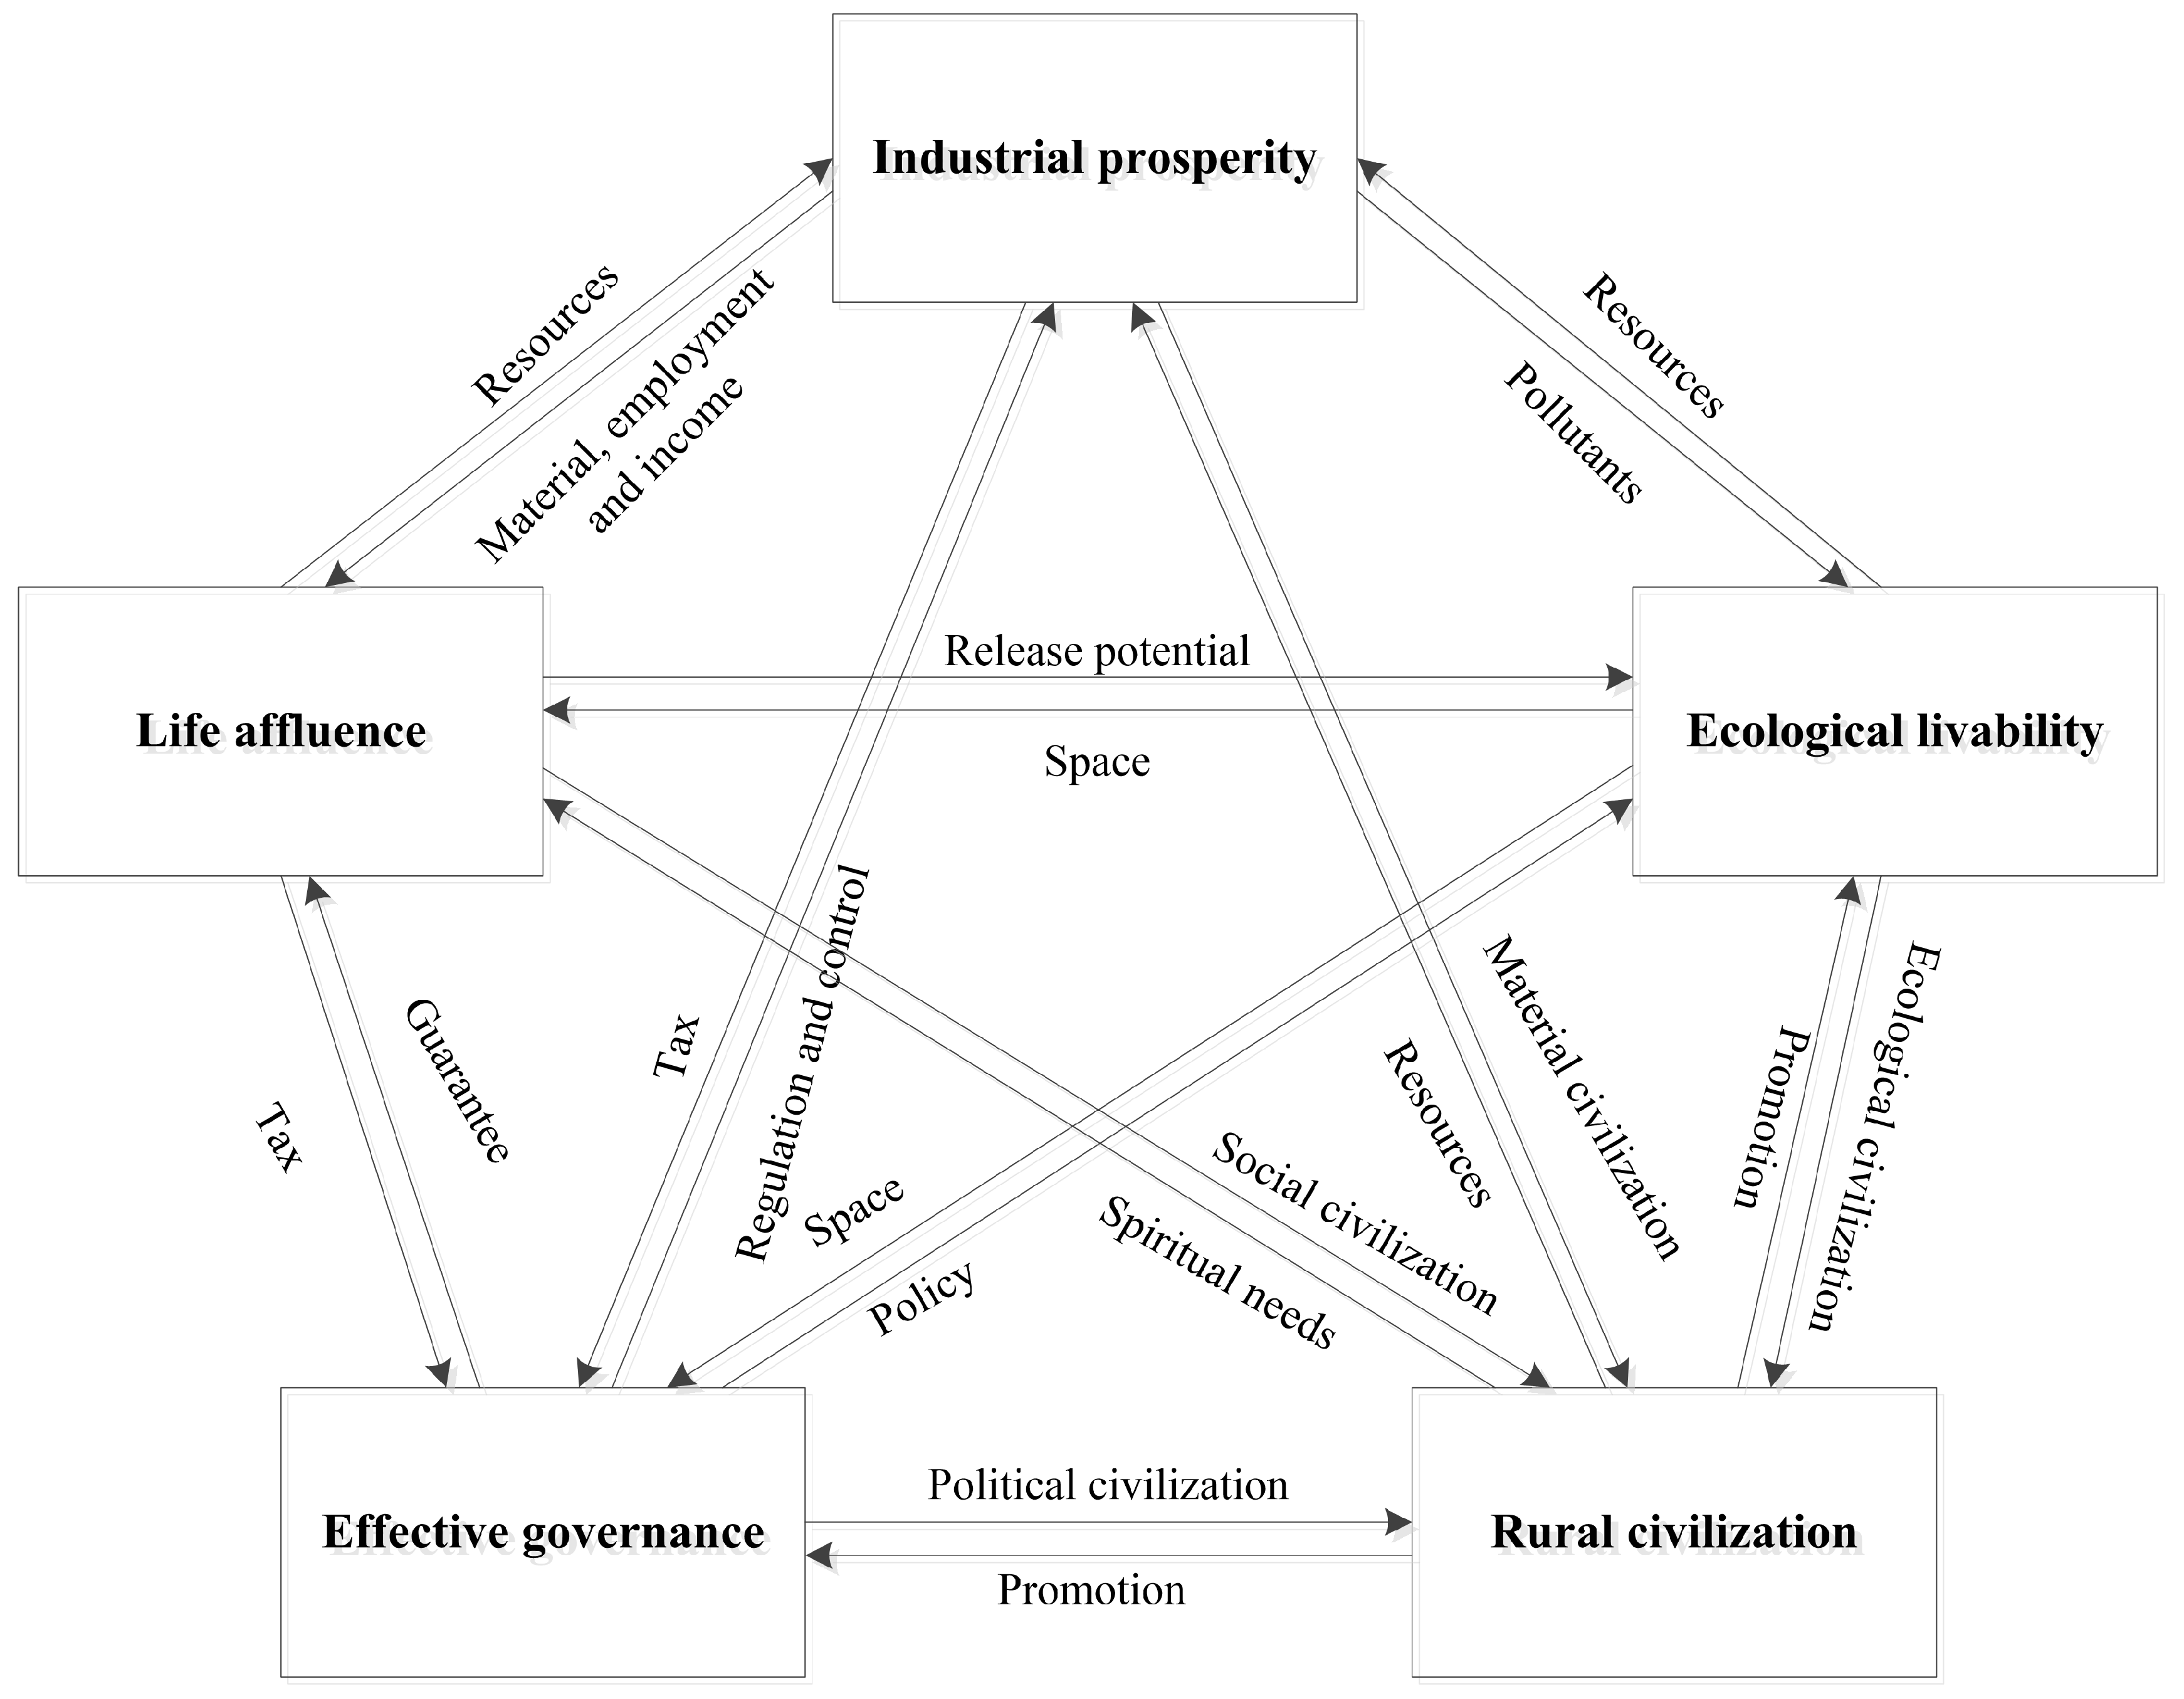
25]. The Strategic Plan for Rural Revitalization (2018–2022) outlines rural revitalization as encompassing five subsystems: industrial prosperity, ecological livability, rural civilization, effective governance, and life affluence. The ultimate goal of rural revitalization is to achieve the highly harmonious and fully integrated development of these five subsystems. Each subsystem supports the others in a mutually beneficial symbiosis.
The industrial prosperity subsystem absorbs ecological resources, cultural resources, capital, human resources, and other factors of production in the rural areas to produce the goods needed by rural residents, satisfying their material needs and providing them with employment opportunities. At the macro level, the subsystem provides sustainable financial support for grassroots governance through taxation, thus promoting the functional reconstruction and value regeneration of the rural ecosystem and catalyzing the innovative transformation of traditional cultural resources [
26,
27,
28].
The subsystem of ecological livability encompasses the natural environment in rural areas, providing essential space and energy for the survival of rural residents and development of rural industries [
29]. It also plays a vital role in decomposing pollutants generated during production processes. Additionally, the rural ecological environment contributes to the distinctiveness of rural culture [
30].
The rural civilization subsystem covers multiple dimensions of rural material, political, spiritual, social, and ecological civilization. Therefore, the development of the other four subsystems constantly enriches the connotation of rural culture and promotes the development of the rural civilization subsystem. At the same time, the continuous progress of the rural civilization subsystem can better meet the spiritual and cultural needs of rural residents, open up new paths for the diversified development of rural industries, improve the efficiency of grassroots governance, and provide a solid support environment for the improvement of the rural ecological environment [
8].
The subsystem of life affluence is the core of the rural revitalization system and the ultimate criterion for the “people-oriented” rural revitalization strategy [
31]. Rural residents are the main part of this subsystem, as they consume the products provided by rural enterprises and provide them with capital and labor, accelerating the development of rural industries. In addition, rural residents are the creators, inheritors, and advocates of rural culture and the major participants in rural governance and ecological construction. Improving the quality of life of rural residents helps to enhance their willingness to participate in rural governance and green ecological construction, thereby increasing the quality of rural governance and promoting the ecological environment of rural areas.
The subsystem of effective governance is the main body of cross-regional regulation and control of materials, energy, information, and other elements in the system of rural revitalization. The quality of rural governance directly influences the effectiveness of rural revitalization. Even if rural areas possess bountiful resource endowments, a chaotic and disordered social environment in rural areas will not only increase the local costs of production, but also hinder the influx of external capital, thereby inhibiting rural development. Therefore, an effective governance subsystem is essential to ensure the development of other subsystems [
32].
Under the symbiotic perspective, the connotation of a rural revitalization system can be defined as a harmonious symbiotic composite system formed through the mutual constraints, interdependencies, and reciprocal reinforcement among various subsystems within a specific region. Centered around rural residents as the core bond, these subsystems consciously coordinate their development through competition mechanisms to achieve balanced progress.
Figure 1 briefly presents the complex and tightly knit symbiotic relationships among the subsystems of rural revitalization that are deeply dissected in this study.
2.2. Construction of the Evaluation Index System
Based on the principles of scientificity, universality, operability, applicability, and systematicity, according to the connotations of rural revitalization from the perspective of symbiosis, by referring to existing relevant studies, we build a comprehensive framework for evaluating rural revitalization, as shown in
Table 1.
Industrial prosperity is the primary task of rural revitalization. Favorable production conditions form the foundation of industrial prosperity, improved production efficiency serves as its hallmark, and integrated rural industrial development constitutes its ultimate objective. Accordingly, this study employs land productivity and labor productivity [
8,
10] to measure agricultural production efficiency, total agricultural machinery power per unit area and per capita rural electricity consumption to quantify production conditions [
10,
31], and per capita productive building area to reflect rural industrialization levels [
9].
Ecological livability, representing the most practical and fundamental aspiration of rural residents, encompasses five sub-indicators: Intensity of agricultural fertilizer use and pesticide use, together with forest coverage rate, are indicators reflecting the natural environment of rural areas [
14]. Road paving ratio and rural sanitary latrine penetration rate are indicators reflecting the living environment [
8].
Rural civilization is not only a direct manifestation of rural social progress, but also an important driving force to promote rural revitalization. In this study, we use the average number of health workers per thousand rural residents to reflect the level of social security [
8], the coverage rate of cultural stations to measure the level of public cultural development [
8], the proportion of full-time primary school teachers with a bachelor’s degree or higher to measure the quality of rural education [
8], the proportion of expenditures in culture, education, and entertainment, as well as the proportion of rural residents with a high school diploma or higher to assess cultural literacy [
8,
13].
Effective governance, as the institutional safeguard for rural revitalization, includes four sub-indicators: the proportion of villages with overall planning, the proportion of rural residents receiving subsistence allowance, per capita subsistence allowance, and village committee coverage [
31,
33].
Life affluence, the ultimate criterion for evaluating rural revitalization, is measured across three dimensions: income level, consumption level, and quality of life. Income level is measured by per capita disposable income of rural residents [
34]. Per capita consumption expenditure and the Engel coefficient of rural residents are used to measure the consumption level [
8]. Quality of life is measured by the number of computers owned by rural residents and per capita residential area [
8,
13].
3. Models
To achieve the research objectives, we developed a two-stage evaluation model: (1) to measure the level of rural revitalization based on the symbiotic coordination model; and (2) to analyze the change trajectory of the level of rural revitalization by applying the speed characteristic model based on the measured level of rural revitalization.
3.1. Symbiotic Coordination Model
Drawing on existing relevant studies [
35,
36], this study constructs an evaluation model for the level of rural revitalization from a symbiotic perspective. Based on the calculation of the internal symbiotic development level of each subsystem of rural revitalization, this model further assesses the symbiotic development between the subsystems and derives the development level of the rural revitalization system from a symbiotic perspective. The specific steps to calculate are as follows.
First, assuming that the order parameter of each subsystem of rural revitalization is denoted by
, where
represents the
j-th order parameter of subsystem
i, and
n is the number of order parameters of subsystems, with
. It is assumed that in subsystem
i,
are positive influencing factors and
are negative influencing factors. Then, the order degree of the order parameter
is
Next, the weights of the order parameters of the subsystems are determined using the correlation coefficient method. Let
denote the correlation coefficient matrix of subsystem
i, where
is the total influence of the
j-th order parameter in the
i on other
order parameters.
Normalizing
, we obtain the weight
of the order parameter
j in subsystem
i:
Furthermore, the internal symbiotic development level of each subsystem of rural revitalization, denoted by
, can be calculated by the following equation using geometric weighting:
Finally, the value of the static comprehensive evaluation of provincial rural revitalization from a symbiotic perspective, denoted by
S, can be calculated by combining the correlation coefficient and geometric weighting. The larger the
S, the higher the rural revitalization level.
3.2. Speed Characteristic Model
The static evaluation results of rural revitalization only capture the regional conditions of rural revitalization in China at a specific point in time. However, they fail to comprehensively reflect the evolving trends in the rural revitalization and the disparities in revitalization speed among provinces. To address this limitation, we propose the use of a speed characteristic model to assess the speed and trends in provincial rural revitalization based on the static model. Drawing on existing studies [
37,
38,
39,
40], this study constructs a dynamic comprehensive evaluation model of rural revitalization from a symbiotic perspective. Assuming there are
p regions to be evaluated, the time series information matrix is formed by the static evaluation results of rural revitalization across
periods:
Let
denote the changing velocity of rural revitalization in region
i across the time interval
. Then, the changing velocity information matrix of regional rural revitalization in China is formed.
As can be seen from (
8) and (
9), when
, the rural revitalization level of the region
i presents a growing trend. When
, the rural revitalization level of
i shows a declining trend. During
, the rural revitalization level of
i remains unchanged. On that basis, suppose the regional rural revitalization level changes at a consistent pace during a certain period, then
where
denotes the overall state of changing velocity of the rural revitalization level of the region
i across the period
. Equation (
10) adequately illustrates the positive/negative state of the rural revitalization level of the region
i across the period
and the relevant changing trajectories. Based on (
9), the changing rate of rural revitalization of the region
i across the period
, denoted by
, and that in the period
, denoted by
, can be obtained. Thus, the linear growth rate of the changing velocity of the rural revitalization level in the period
can be expressed as
In light of the development trend of changing velocity, assuming
f is a function of
, the changing velocity trend model of regional rural revitalization can be established:
where
is a monotonic increasing function of
, when
,
; when
,
,
has an inflection point
, and the growth rate of
gradually increases within the interval
, and the growth rate of
gradually decreases within the interval
. As such, the incentive or penalty correction of velocity in the region
i can be conducted based on the function
. The parameter
in (
12) can be solved using the special value method, assuming that
,
, and it can be derived that
.
Based on (
10)–(
12), the changing velocity state is corrected by changing the velocity trend. When
,
, and
are multiplied by a coefficient of 1, no correction is conducted on smooth changing velocity; when
,
, and
are multiplied by a coefficient larger than 1, incentive is awarded to the changing velocity of growth trend; when
,
, and
are multiplied by a coefficient smaller than 1, declining changing velocity is penalized. The changing velocity state
and changing velocity trend
jointly determine
, the changing condition of the rural revitalization level of the region
i across the period of
. On this basis, the dynamic comprehensive evaluation value
of rural revitalization of the region
i across the period
can be further obtained using the weighted mean.
Specifically, indicates that the rural revitalization level of the region i across the period is growing, indicates that the rural revitalization level is declining, and larger represents better overall conditions of rural revitalization.
4. Results
The data in this study are mainly from the China Statistical Yearbook, China Rural Statistical Yearbook, Yearbook of China’s Insurance, China Statistical Yearbook on Environment, China Urban–Rural Construction Statistical Yearbook, China Civil Affairs’ Statistical Yearbook, China Social Statistical Yearbook, Educational Statistics Yearbook of China, China Population and Employment Statistical Yearbook, and local statistical yearbook in China. In addition, data were obtained from the China Economic Database and the China Stock Market and Accounting Research Database (CSMAR). Partially missing data were obtained using interpolation. Given the serious lack of data in Tibet and the lack of comparability in Hong Kong, Macao, and Taiwan, the data of the remaining 30 provinces in China from 2011 to 2020, except for the above four provinces, are the original data of this study.
4.1. Static Evaluation Results Based on Symbiotic Coordination Model
According to the established index system in the second part, the static level of rural revitalization in 30 provinces in China from 2011 to 2020 was calculated using the static evaluation model, as shown in
Table 2.
The level of rural revitalization in the Chinese provinces from 2011 to 2020 was relatively low, with obvious disparities among provinces and cities.
Table 2 shows the 12 provinces with an average rural revitalization level greater than 0.2 in 2011–2020, including Beijing, Zhejiang, Tianjin, Jiangsu, Shanghai, Fujian, Shandong, Hebei, Guangdong, Liaoning, Hubei, and Shaanxi. Most of these provinces are located in coastal areas with favorable opening-up situations. Relying on the Beijing–Tianjin–Hebei Capital Economic Circle, the Yangtze River Delta Economic Region, and the Guangdong–Hong Kong–Macao Greater Bay Area, these regions have relatively developed economies as a whole, providing a solid foundation for rural revitalization. In contrast, Guizhou (0.123), Yunnan (0.135), Gansu (0.139), Guangxi (0.140), Qinghai (0.148), and Xinjiang (0.153), which rank at the bottom of the country in terms of rural revitalization level, are all located in remote areas.
The rural revitalization system consists of five subsystems: industrial prosperity, ecological livability, rural civilization, effective governance, and life affluence. The development of each subsystem has an impact on the development of the others. The average development level of the rural revitalization subsystem in China from 2011 to 2020 was obtained according to the static evaluation model, as shown in
Figure 2.
Figure 2 depicts the consistent development trend of each subsystem of rural revitalization in China from 2011 to 2020, with an overall annual increase. However, the level of development among the subsystems varies significantly. The subsystems of ecological livability, life affluence, and effective governance all developed at a higher level than the overall level of rural revitalization, whereas the subsystems of rural civilization and industrial prosperity developed at a lower level than that of rural revitalization. Specifically, the development level of the ecological livability subsystem is always higher than that of the other subsystems, with development levels of 0.434 and 0.625 in 2011 and 2020, respectively. The development of the life affluence subsystem was the fastest, with an average annual growth rate of 10.5%, from 0.161 in 2011 to 0.383 in 2020. The development level of the effective governance subsystem was in the middle, increasing from 0.19 in 2011 to 0.34 in 2020. The social etiquette and civility subsystems are highly consistent with the overall level and changing trend of rural revitalization. The level of development of the industrial prosperity subsystem ranks lowest among the five subsystems, with a development level of 0.091 in 2011 and 0.161 in 2020. In summary, China’s rural areas in various regions are currently characterized by a high level of governance, better development of the ecological environment, gradual improvement of social etiquette and civility, and increasing prosperity of farmers. Nevertheless, the overall level of rural revitalization is constrained by the relatively backward development of rural industries.
4.2. Dynamic Evaluation Results Based on the Speed Characteristic Model
To scientifically assess rural revitalization in various provinces, we employed a speed characteristic model to obtain the dynamic evaluation value of rural revitalization. The value is positive, indicating that the rural revitalization of the corresponding provinces increased during the evaluation period. If the value is negative, then the opposite is true. For provincial ranking results, see
Table 3.
Table 3 shows that the dynamic evaluation values of the rural revitalization in 30 provinces are all positive. It reflects the overall good trend of rural revitalization in China. The top 10 provinces in dynamic evaluation are Zhejiang, Guizhou, Qinghai, Gansu, Chongqing, Fujian, Hubei, Ningxia, Yunnan, and Hainan, among which Guizhou, Qinghai, Gansu, Ningxia, and Yunnan rank lower in static evaluation. Despite the low level of rural revitalization in these provinces, they have begun to make continuous efforts to catch up with other provinces. The top ten provinces should, with the aid of their advantages, make use of relevant policies and maintain a good development state. The bottom five provinces are Anhui, Shanxi, Liaoning, Beijing, and Jilin. Of these, Jilin, which ranks last, also has a relatively low static evaluation ranking, suggesting that rural revitalization in Jilin is poor and the momentum is relatively weak. Beijing ranks last in the dynamic ranking and first in the static level of rural revitalization. That demonstrates that after the rapid growth of the past 20 years, Beijing’s rural areas have gradually entered the stage of diminishing marginal growth rates. It is necessary to change the way of rural development and improve the quality of rural development.
4.3. Results of Comprehensive Evaluation
The combination of static and dynamic evaluations can comprehensively analyze the current situation and changes in rural revitalization in different provinces. The results of the static and dynamic evaluations were depicted in a two-dimensional coordinate diagram. The horizontal axis represents the average value of the static evaluation of the rural revitalization level. The vertical axis indicates the dynamic score for rural revitalization. Based on the static and dynamic averages of all provinces, they are divided into four types: “high-high” area, “high-low” area, “low-high” area, and “low-low” area.
Figure 3 presents the four regions of the 30 provinces divided by the two mean lines. The “high-high” area (the upper right corner of
Figure 3) includes Zhejiang, Fujian, and Hebei. The static and dynamic evaluation scores in these provinces were higher than the average. This means that there is a high level of rural revitalization and strong momentum for positive development in these regions. The “low-high” area (the upper left corner of
Figure 3) includes Guizhou, Hainan, Hunan, Hubei, Chongqing, Ningxia, Guangxi, Gansu, Yunnan, Qinghai, Sichuan, and Heilongjiang. Rural revitalization static scores in these provinces are below average, whereas dynamic scores are above average. This implies a low level of rural revitalization but a strong momentum of positive development in these regions. The “low-low” area (the lower left corner of
Figure 3) includes the provinces of Anhui, Inner Mongolia, Henan, Shanxi, Jiangxi, Jilin, Xinjiang, and Shaanxi. Both the static and dynamic evaluation values of rural revitalization in these provinces are lower than the average, indicating a backward level of rural revitalization and the slow pace of rural revitalization in these regions. The “high-low” area (lower right corner of
Figure 3) includes Shanghai, Jiangsu, Shandong, Guangdong, Liaoning, Beijing, and Tianjin. The static score for rural revitalization in these provinces is above average and the dynamic score is below average, reflecting a high level of rural revitalization but a weak pace of development in these regions.
Additionally, the number of provinces on the right side of the static average is much smaller than that on the left side, indicating that the level of rural revitalization in most provinces has not yet reached the overall average. Rural revitalization in eastern provinces such as Shanghai and Beijing is far more advanced. The level of rural vitalization in some western provinces was very low. There is a particularly strong polarization. The number of provinces above the dynamic average is approximately the same as the number of provinces below the dynamic average. Overall, the pace of rural revitalization is relatively uniform.
5. Conclusions
The goal of rural revitalization is to achieve a highly harmonious and fully integrated development of the five subsystems of industrial prosperity, ecological livability, rural civilization, effective governance, and life affluence. On this basis, the connotation and internal relationship of rural revitalization are analyzed from the perspective of the symbiotic coordination of the five subsystems. Subsequently, a dynamic evaluation model is established based on the speed characteristic model. Finally, the level and speed of rural revitalization were measured using provincial panel data from 2011 to 2020. The findings were as follows.
From a static perspective, regional differences in the level of rural revitalization in China are obvious. The development level of each subsystem varies widely. The levels of ecological livability, life affluence, and effective governance were higher than the overall level of rural revitalization, whereas the levels of rural civilization and industrial prosperity were lower than the overall level of rural revitalization.
From a dynamic perspective, the overall trend of rural revitalization is good; however, the pace of development varies widely from province to province. The development speed of areas with a higher level of rural revitalization is slower, whereas that of areas with a lower level is faster.
Based on the static and dynamic evaluation results of rural revitalization level, the 30 provinces can be divided into four categories: “high-high”, “high-low”, “low-high”, and “low-low”. Most provinces are located in the “low-high” area, where the level of rural revitalization is lower but the pace of development is faster. The “high-high” area includes only Zhejiang, Fujian, and Hebei provinces, whose static and dynamic rural revitalization scores are higher than average. The “low-low” area, the backward level of rural revitalization and the slow pace of rural revitalization, includes eight provinces. The provinces in the “high-low” area were located in the eastern coastal areas. They have a high level of rural revitalization, but their pace of development is weak.
Based on the above findings, we propose the following: comprehensive promotion of rural revitalization requires targeted initiatives that take into account the actual situation of rural development in each region. The development advantages for the “high-high” areas should be maintained. "High-low" areas should stimulate the vitality of rural entities and integrate local natural and social resources to promote the development of weak relationships. For the “low-high” areas, they should analyze the current driving force of rural revitalization, strengthen communication with high-level provinces, share and learn from their advanced experience, develop advantageous industries according to local conditions, and continuously narrow the gap with high-level provinces. For “low-low” areas, they should analyze the reasons for the lack of endogenous force of rural revitalization, learn from the experience of “low-high” areas, explore the new force of rural revitalization in the light of the actual situation, create special industries and projects, and promote capital to special industries and projects.
This study primarily examines disparities in rural revitalization levels across provinces, yet it does not provide an in-depth analysis of the underlying causes of these regional differences, particularly between “low-high” and “low-low” areas. A critical gap remains in understanding the driving forces behind rural revitalization in these regions, which is essential for informing targeted policy interventions. Furthermore, the study does not investigate how less-developed regions could leverage enhanced communication and collaboration with more advanced provinces to accelerate their development.
Future research should prioritize identifying the key determinants of rural revitalization success, with a specific focus on comparative analyses between “low-high” and “low-low” regions. Additionally, exploring mechanisms for transferring best practices and innovative solutions from high-performing regions to their less-developed counterparts could provide actionable pathways for reducing regional disparities.
Author Contributions
Conceptualization, X.L.; methodology, X.L.; formal analysis, X.L.; writing—original draft preparation, X.L.; writing—review and editing, X.L. and X.Q.; supervision, Y.Z.; funding acquisition, Y.Z. All authors have read and agreed to the published version of the manuscript.
Funding
This research was funded by the Humanities and Social Science Fund of the Ministry of Education of China under Grant 21YJA630128; and the Emergency Management Project of the National Natural Science Foundation of China under Grant 72141019.
Institutional Review Board Statement
Not applicable.
Informed Consent Statement
Not applicable.
Data Availability Statement
The data in this study are mainly from the China Statistical Yearbook, China Rural Statistical Yearbook, Yearbook of China’s Insurance, China Statistical Yearbook on Environment, China Urban-Rural Construction Statistical Yearbook, China Civil Affairs’ Statistical Yearbook, China Social Statistical Yearbook, Educational Statistics Yearbook of China, China Population and Employment Statistical Yearbook, and local statistical yearbook in China. In addition, data were obtained from the China Economic Database and the China Stock Market and Accounting Research Database (CSMAR).
Conflicts of Interest
The authors declare no conflicts of interest.
References
- Li, Y.; Westlund, H.; Zheng, X.; Liu, Y. Bottom-up initiatives and revival in the face of rural decline: Case studies from China and Sweden. J. Rural. Stud. 2016, 47, 506–513. [Google Scholar] [CrossRef]
- Amcoff, J.; Westholm, E. Understanding rural change—Demography as a key to the future. Futures 2007, 39, 363–379. [Google Scholar] [CrossRef]
- Liu, Y.; Li, Y. Revitalize the world’s countryside. Nature 2017, 548, 275–277. [Google Scholar] [CrossRef] [PubMed]
- Li, Y.; Westlund, H.; Liu, Y. Why some rural areas decline while some others not: An overview of rural evolution in the world. J. Rural. Stud. 2019, 68, 135–143. [Google Scholar] [CrossRef]
- Li, W.; Li, J.; Cui, J. Exploring rural decline with the perspective of demographics: Case study of Hubei, China. Phys. Chem. Earth Parts A/B/C 2020, 120, 102917. [Google Scholar] [CrossRef]
- Zhou, Y.; Li, Y.; Xu, C. Land consolidation and rural revitalization in China: Mechanisms and paths. Land Use Policy 2020, 91, 104379. [Google Scholar] [CrossRef]
- Nizam, D.; Tatari, M.F. Rural revitalization through territorial distinctiveness: The use of geographical indications in Turkey. J. Rural. Stud. 2022, 93, 144–154. [Google Scholar] [CrossRef]
- Geng, Y.; Liu, L.; Chen, L. Rural revitalization of China: A new framework, measurement and forecast. Socio-Econ. Plan. Sci. 2023, 89, 101696. [Google Scholar] [CrossRef]
- Wang, J. Digital inclusive finance and rural revitalization. Financ. Res. Lett. 2023, 57, 104157. [Google Scholar] [CrossRef]
- Deng, X.; Huang, M.; Peng, R. The impact of digital economy on rural revitalization: Evidence from Guangdong, China. Heliyon 2024, 10, e28216. [Google Scholar] [CrossRef]
- Sun, P.; Ge, D.; Yuan, Z.; Lu, Y. Rural revitalization mechanism based on spatial governance in China: A perspective on development rights. Habitat Int. 2024, 147, 103068. [Google Scholar] [CrossRef]
- Li, J.; Liu, Y.; Yang, Y.; Jiang, N. County-rural revitalization spatial differences and model optimization in Miyun District of Beijing-Tianjin-Hebei region. J. Rural. Stud. 2021, 86, 724–734. [Google Scholar] [CrossRef]
- Feng, G.; Zhang, M. The Coupling Coordination Development of Rural E-commerce and Rural Revitalization: A Case Study of 10 Rural Revitalization Demonstration Counties in Guizhou. Procedia Comput. Sci. 2022, 199, 407–414. [Google Scholar] [CrossRef]
- Sun, X.; Chu, D.; Li, Q.; Shi, Y.; Lu, L.; Bi, A. Dynamic successive assessment of Rural Human Settlements Environment in China. Ecol. Indic. 2023, 157, 111177. [Google Scholar] [CrossRef]
- Wang, L.; Li, N.; Xie, Q. Dynamic evolution and obstacle factor analysis of green development in China’s agriculture and rural areas based on entropy-based TOPSIS model. Heliyon 2024, 10, e27248. [Google Scholar] [CrossRef]
- Weng, X. Study on the Implementation Mechanism of Symbiosis Theory Used in Economic Field. Economics 2016, 5, 56. [Google Scholar] [CrossRef]
- Zhu, J.; Ruth, M. The development of regional collaboration for resource efficiency: A network perspective on industrial symbiosis. Comput. Environ. Urban Syst. 2014, 44, 37–46. [Google Scholar] [CrossRef]
- Xie, X.; Wei, B.; Hu, S.; Chen, D.j. Integrated network analysis on industrial symbiosis: Case study of Qinghai salt lake industrial park. J. Clean. Prod. 2023, 429, 139235. [Google Scholar] [CrossRef]
- Sourmelis, S.; Pontikes, Y.; Myers, R.J.; Tennant, M. Business models for symbiosis between the alumina and cement industries. Resour. Conserv. Recycl. 2024, 205, 107560. [Google Scholar] [CrossRef]
- Ren, W.; Xu, Y.; Ni, J. Evolution of marine ecology-industry symbiosis patterns and ecological security assessment: New evidence from coastal areas of China. Ocean. Coast. Manag. 2024, 247, 106939. [Google Scholar] [CrossRef]
- Huang, A.; Liu, B.; Zhang, A.; Zhan, J. Coordinated development of rural habitat in China: A study of measurement, spatio-temporal evolution and convergence. J. Clean. Prod. 2023, 398, 136651. [Google Scholar] [CrossRef]
- Chu, V.H.; Lam, W.F.; Williams, J.M. Building robustness for rural revitalization: A social-ecological system perspective. J. Rural. Stud. 2023, 101, 103042. [Google Scholar] [CrossRef]
- Wang, J.; Qu, L.; Li, Y.; Feng, W. Identifying the structure of rural regional system and implications for rural revitalization: A case study of Yanchi County in northern China. Land Use Policy 2023, 124, 106436. [Google Scholar] [CrossRef]
- Liu, Y.; Zhou, Y.; Li, Y. Rural regional system and rural revitalization strategy in China. Acta Geogr. Sin. 2019, 74, 2511–2528. [Google Scholar]
- Long, H.; Ma, L.; Zhang, Y.; Qu, L. Multifunctional rural development in China: Pattern, process and mechanism. Habitat Int. 2022, 121, 102530. [Google Scholar] [CrossRef]
- Li, X.; Wang, Y.; Wang, Z. Quantifying the industrial development modes and their capability of realizing the ecological value in rural China. Technol. Forecast. Soc. Chang. 2024, 203, 123386. [Google Scholar] [CrossRef]
- Chen, K.; Tian, G.; Tian, Z.; Ren, Y.; Liang, W. Evaluation of the Coupled and Coordinated Relationship between Agricultural Modernization and Regional Economic Development under the Rural Revitalization Strategy. Agronomy 2022, 12, 990. [Google Scholar] [CrossRef]
- Chen, X.; Wu, R. How can rural industrial revitalization and rural education level reduce the urban–rural income gap? Financ. Res. Lett. 2025, 73, 106592. [Google Scholar] [CrossRef]
- Juanjuan, Y.; Wei, P. The path of promoting rural ecological revitalization under the perspective of system concept. Ecol. Front. 2024, 44, 950–957. [Google Scholar] [CrossRef]
- Yang, Y.; Bao, W.; Liu, Y. Coupling coordination analysis of rural production-living-ecological space in the Beijing-Tianjin-Hebei region. Ecol. Indic. 2020, 117, 106512. [Google Scholar] [CrossRef]
- Jin, S.; Zhao, D.; Bao, B. Dynamic evaluation and obstacle factor diagnosis of rural human settlements quality in the Dabie mountains old revolutionary Base area under the background of rural revitalization. Habitat Int. 2025, 156, 103256. [Google Scholar] [CrossRef]
- Peng, Y.; Peng, X.; Li, X.; Lu, M.; Yin, M. Effectiveness in Rural Governance: Influencing Factors and Driving Pathways—Based on 20 Typical Cases of Rural Governance in China. Land 2023, 12, 1452. [Google Scholar] [CrossRef]
- Xu, Q.; Zhong, M.; Dong, Y. Digital finance and rural revitalization: Empirical test and mechanism discussion. Technol. Forecast. Soc. Chang. 2024, 201, 123248. [Google Scholar] [CrossRef]
- Xiong, Z.; Huang, Y.; Yang, L. Rural revitalization in China: Measurement indicators, regional differences and dynamic evolution. Heliyon 2024, 10, e29880. [Google Scholar] [CrossRef]
- Wang, Y.; Xie, Y.; Qi, L.; He, Y.; Bo, H. Synergies evaluation and influencing factors analysis of the water–energy–food nexus from symbiosis perspective: A case study in the Beijing–Tianjin–Hebei region. Sci. Total Environ. 2022, 818, 151731. [Google Scholar] [CrossRef]
- Hua, E.; Han, X.; Bai, Y.; Engel, B.A.; Li, X.; Sun, S.; Wang, Y. Synergy of water use in water-energy-food nexus from a symbiosis perspective: A case study in China. Energy 2023, 283, 129164. [Google Scholar] [CrossRef]
- Liu, W.; Shi, C.; Zhao, S. Dynamic comprehensive evaluation model with the feature of speed. Syst. Eng.-Theory Pract. 2013, 33, 705–710. [Google Scholar]
- Du, D.; Zeng, X. A dynamic and comprehensive evaluation of the innovation capability of Chinas high-tech firms from the perspective of speed characteristics. Sci. Res. Manag. 2017, 38, 44–53. [Google Scholar]
- Yin, J.; Wang, D. Dynamic evaluation of green innovation efficiency of patent-intensive industries: Evidence from the new equipment manufacturing. Technol. Anal. Strateg. Manag. 2021, 1–14. [Google Scholar] [CrossRef]
- Li, J.; Zou, Y.; Li, M. Dynamic evaluation of the technological innovation capability of patent-intensive industries in China. Manag. Decis. Econ. 2022, 43, 3198–3218. [Google Scholar] [CrossRef]
| Disclaimer/Publisher’s Note: The statements, opinions and data contained in all publications are solely those of the individual author(s) and contributor(s) and not of MDPI and/or the editor(s). MDPI and/or the editor(s) disclaim responsibility for any injury to people or property resulting from any ideas, methods, instructions or products referred to in the content. |
© 2025 by the authors. Licensee MDPI, Basel, Switzerland. This article is an open access article distributed under the terms and conditions of the Creative Commons Attribution (CC BY) license (https://creativecommons.org/licenses/by/4.0/).


