Article

The Mediating Effect of the Sustainability Committee on the Relationship of Size of Board of Directors with Environmental Sustainability Disclosures: A Study in the Transportation Sector

1
Department of Automotive Engineering, Faculty of Engineering and Natural Sciences, Süleyman Demirel University, Isparta 32200, Turkey
2
Engine Vehicles Application and Research Center, Süleyman Demirel University, Isparta 32200, Turkey
3
Republic of Turkey Ministry of National Education, Accounting and Finance, Isparta 32200, Turkey
*
Author to whom correspondence should be addressed.
Sustainability 2025, 17(7), 3165; https://doi.org/10.3390/su17073165
Submission received: 5 March 2025 / Revised: 19 March 2025 / Accepted: 31 March 2025 / Published: 2 April 2025
(This article belongs to the Section Sustainable Management)

Abstract

Recently, studies have highlighted the impact of factors such as environmental, corporate governance, and social performances on companies’ sustainability activities. Therefore, the current study focuses on the impact of environmental and social activities of manufacturing and service enterprises operating in the transportation sector, which is at the forefront of pollutant component production, on sustainability disclosures. For this purpose, how the size of the board of directors in the transportation sector affects environmental sustainability disclosures and the mediating effect of the existence of a sustainability committee (SC) on ecological sustainability disclosures are discussed. For this, panel data analysis was carried out with the data of 47 companies operating in the transportation sector of European Union member countries between 2005 and 2020. The paper’s conclusions demonstrate that increasing board size and adding an SC to the board of directors will improve a company’s environmental performance. They also shows that the relationship between board size and environmental sustainability performance will be improved by the presence of an SC. The paper demonstrates that incorporating environmental sustainability initiatives into the strategic decision-making procedures of manufacturing and service firms in the transportation sector can offer another perspective to its stakeholders, policymakers, and sector organizations.

1. Introduction

The increase in regional and global emission levels because of the increase in heavy industry production and the poor management of hazardous wastes poses problems such as global warming and climate change that threaten the entire world. This situation is alarming for both developed and developing countries, and controlling the formation of emissions is becoming increasingly difficult and complex [1]. Therefore, the increase in greenhouse gas emissions, which are the main cause of global warming and climate change, has become a matter of concern for people, businesses, governments, and all other stakeholders [2]. To eliminate the negative effects of global warming, governments and international organizations are trying to implement various global efforts that include measures and policies to reduce greenhouse gas emissions [3].
In addition to the negative effects of climate change, humanity is faced with many challenges that affect public health and social life on a global scale, such as geopolitical conditions, income inequalities, and pandemics. This situation necessitates the development of international sustainable development goals with various development strategies that can provide better performance in social and corporate management [4]. Sustainable development is defined by the World Commission on Environment and Development (WCEED) as meeting today’s needs without jeopardizing the ability of future generations to meet their own needs, and the importance of sustainable development increases with the emergence of high levels of environmental awareness. Sustainability is a concern not only for governments but also for all businesses. In a commercial sense, sustainability is considered a business strategy that includes important investment decisions and aims to meet the demands of current and future investors by effectively utilizing the activities of a company [1]. Therefore, businesses need to take environmental issues seriously and engage in positive environmental activities. However, not all businesses can exhibit similar capabilities in this regard, and therefore, the environmental sustainability levels of businesses need to increase with environmental policies and regulations [5].
The financial and environmental impacts of strategic and operational management decisions of businesses need to be disclosed to relevant stakeholders in terms of establishing global environmental protection policies and effectively managing environmental activities. Business management should conduct their business activities with sustainable responsibility by considering the well-being of all sub-units within the supply chain, including employees. Because the ability of businesses to be financially profitable also affects the sustainability of businesses in economic terms, the economic sustainability of businesses depends on their financial success. However, today, businesses are expected to be successful in environmental sustainability as well as economic sustainability. Therefore, the efforts of business boards to prevent or reduce the negative impacts on the environment that may occur due to the activities of the businesses are taken into consideration [6]. The increasing interest in sustainability issues directs businesses to engage in more activities within the scope of environmental, social responsibility, and CG programs and to scale and report growth. Reporting the environmental activities of businesses requires determining the ESG performance, which consists of the sum of three main components, the corporate governance, social, and environmental activities of businesses. In other words, environmental performance is an indicator of the innovation and emission reduction efforts of businesses and the resource use that emerges for this purpose.
The transportation sector is a significant air polluter that plays a critical role in growing economies, as it ensures the delivery of manufactured goods to consumers. Although the development of the transportation sector seems positive in terms of the growth of national economies and the increase in people’s living standards, it triggers environmental and social negativities due to the environmental pollution caused by resource consumption, transportation vehicles, and facilities [7]. However, the transportation sector causes high carbon emissions due to the consumption of fossil fuels [8]. Growing concerns about sustainability and green logistics due to stakeholder pressures are forcing the corporate governance of the transportation sector to become more environmentally friendly [9]. While companies operating in the transportation sector directly contribute to emissions production, companies producing machinery and equipment for the transportation sector also indirectly cause emissions production.
Previous studies focusing on the relationship between corporate activities and sustainability reveal the willingness of companies to report on environmental, managerial, and social performance [10], but it is seen that the mediating effect of the sustainability committee on the relationship between board size and environmental sustainability disclosures has not been taken into account. In addition, there is a significant deficiency in studies addressing the sustainability studies of companies providing both production and service in the transportation sector, which is a significant source of air pollutants. Therefore, the current study addresses the mediating effect of the presence of a sustainability committee (SC) in the management of transportation companies traded on the stock exchanges of the European Union (EU) member states, as well as the mediating effect of the presence of a sustainability committee (SC) in the firm’s management on the effect of board size on environmental performance. The review of literature studies is conducted in Section 2, and hypotheses are created in line with the objectives of the study. In Section 3, the research methodology, data, and variables are explained. In Section 4, the analysis findings regarding the study models are presented, and in the last section, the conclusion, discussion, and recommendations of the study are given.

2. Literature Review and Hypothesis Development

2.1. Corporate Governance

Stakeholder theory shows that independent directors contribute more to sustainability performance levels because they are subject to less stakeholder pressure than internal directors [11]. On the other hand, companies are trying to develop more environmentally friendly products to adapt to climate change and to manage resources more effectively by turning to innovative applications and green projects that can reduce emissions. Thus, companies will be able to improve their environmental and carbon performance and, at the same time, gain a competitive advantage over their competitors, thanks to their environmental initiatives and strategies [3]. In this context, it is possible to say that ESG indirectly supports sustainable development by encouraging companies to take more social responsibility to reduce market risks [12]. On the other hand, large companies face greater public pressure to engage in environmental activities [13,14]. As a positive effect, the company size can provide the opportunity to access capital and manpower more easily and to produce environmentally friendly machinery and equipment [15]. On the other hand, management of companies with high debt ratios may try to increase their corporate image in a positive way by making greater efforts to improve their environmental sustainability [16], but firms with high debt ratios are also likely to give less importance to environmental sustainability activities and reporting [17].
CG is important for businesses to carry out and monitor emission reduction activities in terms of assessing environmental risks. Boards of directors are significant players in achieving business goals, correctly analyzing activities, and improving the quality of information sharing. Having a strong and effective board of directors also drives better environmental performance [18]. Companies can create larger and more balanced boards by including members of different ages, genders, education levels, and nationalities on their boards. While young board members offer benefit through innovative ideas and flexibility in large boards, older board members contribute experience and wisdom to companies. Having directors from different nationalities allows companies to benefit from international perspectives, while educational diversity encourages compliance with legal regulations and increased ESG investments [19]. For boards of directors to operate more effectively and transparently, the size, independence, gender diversity, and number of meetings come to the fore. For this reason, CG literature continues to show interest in the qualities of the board of directors.
An effective board of directors can reduce the opportunistic accrual preferences of managers in favor of stakeholders. Therefore, companies may be more willing to establish an effective board of directors or a strong control structure [18]. However, the literature on the link between board size and corporate environmental activities provides ambiguous results.
While it is emphasized that an increase in board size, when combined with other board diversity dimensions such as age, education, and gender, improves ESG performance, the literature provides evidence of complex relationships between board diversity dimensions and ESG performance [20]. Large boards of directors provide companies with access to more information and the opportunity to benefit from the knowledge and experience of different managers. In addition, larger boards may have a greater opportunity to benefit from the advice of members who are experts on environmental issues and the implementation of green initiatives. Large boards are more likely to include members with experience in environmental performance issues, as business boards increasingly need people with expertise in the uncertain opportunities and risks of environmental issues. Therefore, large boards are more likely to have directors with different focuses and skills to advise on the challenges and opportunities related to environmental responsibilities [21]. Firms with fewer board members are likely to have higher stock performance if they have more independent directors on their boards [22]. However, there are also views that the size of the board of directors reduces the board’s communication and decision-making effectiveness and negatively affects its control and monitoring functions [11]. It has also been noted that larger boards can be less efficient, as they can lead to greater difficulty in closing deals [23].
The agency theory approach recognizes that independent members are a significant factor in controlling management behavior. Independent members can develop different perspectives and evaluate strategic decisions to be taken by the board of directors more objectively thanks to the knowledge and experience they gain outside the company [24]. Board independence can encourage companies to present more accurate information [25] and increase disclosures about environmental activities [26]. Additionally, they may be more willing to develop sustainable behaviors since independent directors generally have longer-term expectations [27]. However, studies have shown that board size and independence can also lead to lower environmental performance [17]. Independent board members are likely to support the proper control of costly emission projects, maximize the benefits of these projects, and make long-term environmental investments. Independent directors are also more likely to resist pressure to ignore or delay environmental investments than corporate board members from within the company [28]. Studies have shown that increasing the frequency of board meetings increases the transparency of disclosures regarding environmental activities [29], while regular meetings encourage companies to turn to more environmentally friendly practices [30]. Regularly holding board meetings also indicates high efficiency and better monitoring of the board. Therefore, it is considered a factor that increases the transparency of the business and reduces information pollution [31]. Executive compensation will have a high potential to contribute to social and environmental legitimacy and corporate sustainability, as it is likely to positively improve social and environmental performance [32]. However, there are also studies that show that frequent board meetings during the year and separate roles for the CEO and the chairman of the board have no impact on stakeholders [22]. Few studies have investigated the link between board characteristics and sustainability-related executive compensation policies in terms of their impact on carbon reduction initiatives and greenhouse gas emissions [33].

2.2. Corporate Governance and Sustainability

The resource dependency theory can create intangible resources that can increase the competitiveness of companies in the market, such as investor support, customer loyalty, and brand reputation. In this direction, companies having a strong ESG performance can increase the trust and support of capital investors in the company by reducing environmental risks and social conflicts, as well as having a positive brand image in the market [34]. Resource-based theory assumes that companies’ disclosures of their emission reduction efforts will positively affect company values and contribute to a sustainable competitive advantage. In this context, companies can effectively manage their environmental footprint by strategically investing more in green innovation [35,36]. The efforts of companies towards environmental protection and social responsibility can increase the company’s market share and revenue potential by supporting consumers’ positive perspectives and loyalty towards the brand [37]. In addition, institutional theory accepts that legal sanctions and regulatory environments are important external forces in encouraging companies to engage in sustainability-related activities and to encourage the necessary investments. The legal enforcement of strict environmental policies will force companies to develop strategies for more innovation and resource planning and more financing for emission reduction by engaging in sustainability activities [38]. Therefore, the study focuses on the importance of board structures in developing sustainability activities and improving the sustainability performance of firms with the assumption of both resource dependence theory and institutional theory, as well as stakeholder theory and agency theory.
The level and standard of sustainability disclosures provided by companies may vary depending on the characteristics of the companies [5]. CG is important and positively impacts the environmental sustainability of firms [39]. To improve sustainability performance, it is important to increase diversity in age, gender, education level, and nationality on boards of directors [19]. The board of directors’ sustainability committee directly affects environmental disclosures and indirectly improves financial performance [40]. The existence of a sustainability committee supports reporting according to the Sustainable Development Goals framework due to the knowledge and expertise of the committee members [41]. Companies with large boards of directors are also more likely to have a sustainability committee [42]. The presence of an SC on the board of directors of businesses is an important element in solving environmental problems, encouraging stakeholder participation, increasing accountability, and introducing best sustainability practices [43,44]. However, there is a lack of studies in the literature on how the board SC affects performance results [3]. There are a few studies investigating the effect of the presence of a specific committee on sustainability issues [9,11]. In this study, the mediating effect of the presence of an SC on the board of directors on the relationship between CG attributes and environmental performances is evaluated. For this purpose, the study first focuses on the size of the board of directors, one of the CG features, and the H1 hypothesis is created regarding its effect on ESG disclosures.
Hypothesis_1 (H1):
Board size has a positive influence on disclosure of ESG performance.
Each board member can bring different qualifications to the firm, providing expertise, knowledge, skills, and greater insight into the external environment. Therefore, board size is expected to increase the likelihood of engaging in sustainability practices and demonstrating better ESG performance [20,45]. Companies that want to improve their ESG performance need to establish boards of directors that reflect different perspectives [19]. The study also focused on the sub-disclosures of ESG performance, and the following hypotheses were created with the assumption of the effect of board size on environmental, corporate governance, and social sustainability disclosures.
Hypothesis_2a (H2a):
Board size has a positive influence on disclosure of environmental sustainability performance.
Hypothesis_2b (H2b):
Board size has a positive influence on disclosure of corporate governance sustainability performance.
Companies make various investments in traffic safety programs and technologies, but automobile accidents in transportation cause significant social costs. Therefore, the performance of transportation sector stakeholders regarding their investments and activities regarding social problems is of interest [46].
Hypothesis_2c (H2c):
Board size has a positive influence on disclosure of social sustainability performance.
Firms whose production is dependent on carbon-intensive activities may face serious difficulties in transitioning to a low-carbon sustainable economy, and their firm performance may be negatively affected [47]. Focusing on the sub-disclosures of environmental performance, the study has created the following hypotheses regarding the impact of board size on sustainability disclosures regarding emissions, innovation, and resource use.
Hypothesis_3a (H3a):
Board size has a positive influence on disclosure of emissions performance.
The transportation industry needs to plan its investments by taking into account the rapid transformations in production and correctly determine its long-term strategies regarding the production process. In this direction, transportation companies are expected to consider the environmental impacts of resource use and innovation investments in their evaluations of their long-term operations [1].
Hypothesis_3b (H3b):
Board size has a positive influence on disclosure of innovation performance.
Hypothesis_3c (H3c):
Board size has a positive influence on disclosure of resource use performance.
The perspective that the existence of sustainability committees on boards of directors improves ESG performance allows companies that want to achieve sustainability goals to structure their boards of directors in a way that is more environmentally sustainable and conscious by establishing a sustainability committee [48]. The presence of a sustainability committee on the board of directors is expected to improve the disclosure of information to meet the demands of investors and stakeholders, as it will ensure more effective use of emission reduction strategies [42]. The following hypotheses were created assuming that the SC mediates the effect of board size on the performances related to ESG and its sub-expansions.
Hypothesis_4 (H4):
The presence of a sustainability committee has a mediating influence on the relationship between board size and environmental sustainability practices.
Investors, who are important stakeholders of businesses, are pressuring businesses they invest in to act more ethically and reduce emissions related to their business activities to ensure that their long-term corporate performance is sustainable [49]. Emission reduction projects often require long-term financial commitments without short-term financial gain. Therefore, it is important for emission reduction projects to be supported by a strong management team in the long term to be successful [28]. The study aims to provide useful information to all stakeholders, such as academics, regulators, practitioners, and policymakers, by examining the mediation of the presence of an SC in the link between board size and environmental performance.

3. Methodology

In the study, panel data analysis was used to examine the influence of CG features on environmental performance in the context of the transportation sector. In line with the purpose of the study, the focus was on production and service companies in the transportation sector. A sample was created consisting of companies that regularly disclosed ESG performance between 2005 and 2020 and that provide production or services for the transportation sector.
To determine the influence of CG features on environmental performance, the model estimate
determined primarily in the study is as follows.
E S G S C O R E i , t = α + β 1 B O A R D i , t + β 2 B O A R D I N D i , t   + β 3 B O A R D M i , t + β 4 C O M P S E S G i , t   + β 5 S U S T C O M i , t + β 6 R O A i , t + β 7 S I Z E i , t   + β 8 L E V i , t + ε i , t
ENVSCORE, CGSCORE, and SOCSCORE variables were used as dependent variables in the models to examine the second hypotheses of the study.
E N V S C O R E i , t = α + β 1 B O A R D i , t + β 2 B O A R D I N D i , t + β 3 B O A R D M i , t     + β 4 C O M P S E S G i , t + β 5 S U S T C O M i , t + β 6 R O A i , t + β 7 S I Z E i , t     + β 8 L E V i , t + ε i , t
C G S C O R E i , t = α + β 1 B O A R D i , t + β 2 B O A R D I N D i , t + β 3 B O A R D M i , t         + β 4 C O M P S E S G i , t + β 5 S U S T C O M i , t + β 6 R O A i , t + β 7 S I Z E i , t         + β 8 L E V i , t + ε i , t
S O C S C O R E i , t = α + β 1 B O A R D i , t + β 2 B O A R D I N D i , t + β 3 B O A R D M i , t       + β 4 C O M P S E S G i , t + β 5 S U S T C O M i , t + β 6 R O A i , t + β 7 S I Z E i , t       + β 8 L E V i , t + ε i , t
In addition, EMISSION, INNOVATION, and RESOURCE variables were used as dependent variables in the models to examine the third hypotheses of the study and to check the robustness of the models.
E M I S S I O N i , t = α + β 1 B O A R D i , t + β 2 B O A R D I N D i , t   + β 3 B O A R D M i , t + β 4 C O M P S E S G i , t   + β 5 S U S T C O M i , t + β 6 R O A i , t + β 7 S I Z E i , t   + β 8 L E V i , t + ε i , t
I N N O V A T I O N i , t   = α + β 1 B O A R D i , t + β 2 B O A R D I N D i , t + β 3 B O A R D M i , t + β 4 C O M P S E S G i , t + β 5 S U S T C O M i , t + β 6 R O A i , t + β 7 S I Z E i , t + β 8 L E V i , t + ε i , t
R E S O U R C E i , t     = α + β 1 B O A R D i , t + β 2 B O A R D I N D i , t   + β 3 B O A R D M i , t + β 4 C O M P S E S G i , t   + β 5 S U S T C O M i , t + β 6 R O A i , t + β 7 S I Z E i , t   + β 8 L E V i , t + ε i , t
Then, models were created to examine the fourth hypothesis and determine the mediating effect of SC on the effect of board size on ESG disclosure for all models used in the study. The final models determined for the H4 hypothesis, which was created to determine the mediating effect of SC on the effect of board size on ESG disclosure, are shown below.
E S G i , t = α + β 1 B O A R D i , t + β 2 B O A R D I N D i , t + β 3 B O A R D M i , t       + β 4 C O M P S E S G i , t + β 5 S U S T C O M i , t + β 6 R O A i , t       +   β 7 S I Z E i , t + β 8 L E V i , t + β 9 B O A R D i , t         S U S T C O M i , t + ε i , t
Carbon management strategies consist of efforts made by businesses to address ecological issues [33]. Emission performance is an important element in both improving environmental activities and contributing to the fight against climate change by reducing emissions.

3.1. Sample Data Design

In recent years, growing economies, developing technologies, and increasing transportation volumes have caused the need for more equipment production for the transportation sector. The production of transportation equipment to meet transportation services triggers environmental negativities such as resource consumption and emission spread. Sustainable production activities and environmental performances of companies producing equipment for the transportation sector are important for sustainable development. For example, manufacturers of fully electric vehicles may prioritize environmental impacts throughout the product life cycle, while other transportation equipment manufacturers may also prioritize environmental impacts [50]. The study focuses on companies that manufacture equipment and provide transportation services for the transportation sector. In this respect, the study focuses on companies that produce equipment and provide transportation services for the transportation sector in order to determine stakeholder interest in environmental activities and emission reduction efforts of the transportation sector, which directly contributes to emission production. The transportation sector is an important part of the supply chain as a sub-component of other sectors. Data on the companies included in the study sample were obtained from the Refinitiv Eikon database. The dataset contains 752 observations of 47 companies operating in the transportation sector on the stock exchanges of EU member countries between 2005 and 2020. Stata16.0 software was used for data processing. The year 2005 was determined as the starting year to increase the number of sample companies, since it was observed that non-financial data on ESG and sub-performances began to be reported more intensively in 2005. Companies voluntarily report on their ESG activities and performances with a delay compared to financial data. Additionally, the sample period was determined as 2015–2020 to purify the data from the negative effects of the COVID-19 pandemic in the 2021–2022 period.
The dataset of the study was created by determining the relevant industrial and service companies in the transportation sector using SIC codes. SIC codes, which were created to better understand the sectors during the economic recovery process after the Great Depression, indicate the sectors in which the companies operate. Thus, industrial companies producing equipment for the transportation sector and companies providing services in air, land, and sea transportation were included in the study sample. In this context, the study examines the impact of board size in terms of environmental, social, and CG by focusing on companies that manufacture or provide services in the transportation sector. Then, it was evaluated whether the board size and the presence of an SC had a mediating effect on this relationship.

3.2. Explanation of Variables

In the study, ESG performances were primarily used as the dependent variable. (ESG) scores are a general evaluation score that represents the total percentage score scaled between 0 and 100 regarding the activities carried out for environmental, social, and governance purposes. In the second stage of the study, where the sub-expansions of ESG performances were taken into account, environmental score (ENVSCORE), corporate governance score (CGSCORE), and social score (SOCSCORE) were used as dependent variables. The CG score covers the CG practices of the enterprises, shareholder equality, and corporate social responsibility strategies. The social score shows a company’s gender and opportunity equality among employees, its importance to human health and safety, its sensitivity to human rights, its support for social development, and its care in presenting the products it produces to people. Environmental scores consist of emission reduction activities, resource use, and innovation scores that companies disclose to the public [51]. In the third stage of the study, the emission reduction score (EMISSION), resource use score (INNOVATION), and innovation score (RESOURCE) were used as dependent variables, taking into account the sub-expansions of the environmental score.
Regarding the board of directors’ qualifications, the board size, the ratio of independent board members, the number of board meetings, and the implementation status of ESG-related management compensation policies were determined as independent variables of the working model as CG qualifications. In addition, the SUSTCOM dummy variable was added to the study model to determine the effect of the presence of the SC on the relationship between CG attributes and environmental performance. In the study, the active return ratio (ROA), firm size (SIZE), and debt structure (LEV) variables were also included in the model as financial performance indicators for enterprises.
The variables determined for the analysis of the hypotheses created for the purpose of the paper consist of both financial and non-financial variables. Symbols and measurement forms for variable definitions used in the model of the paper are given in Table 1.

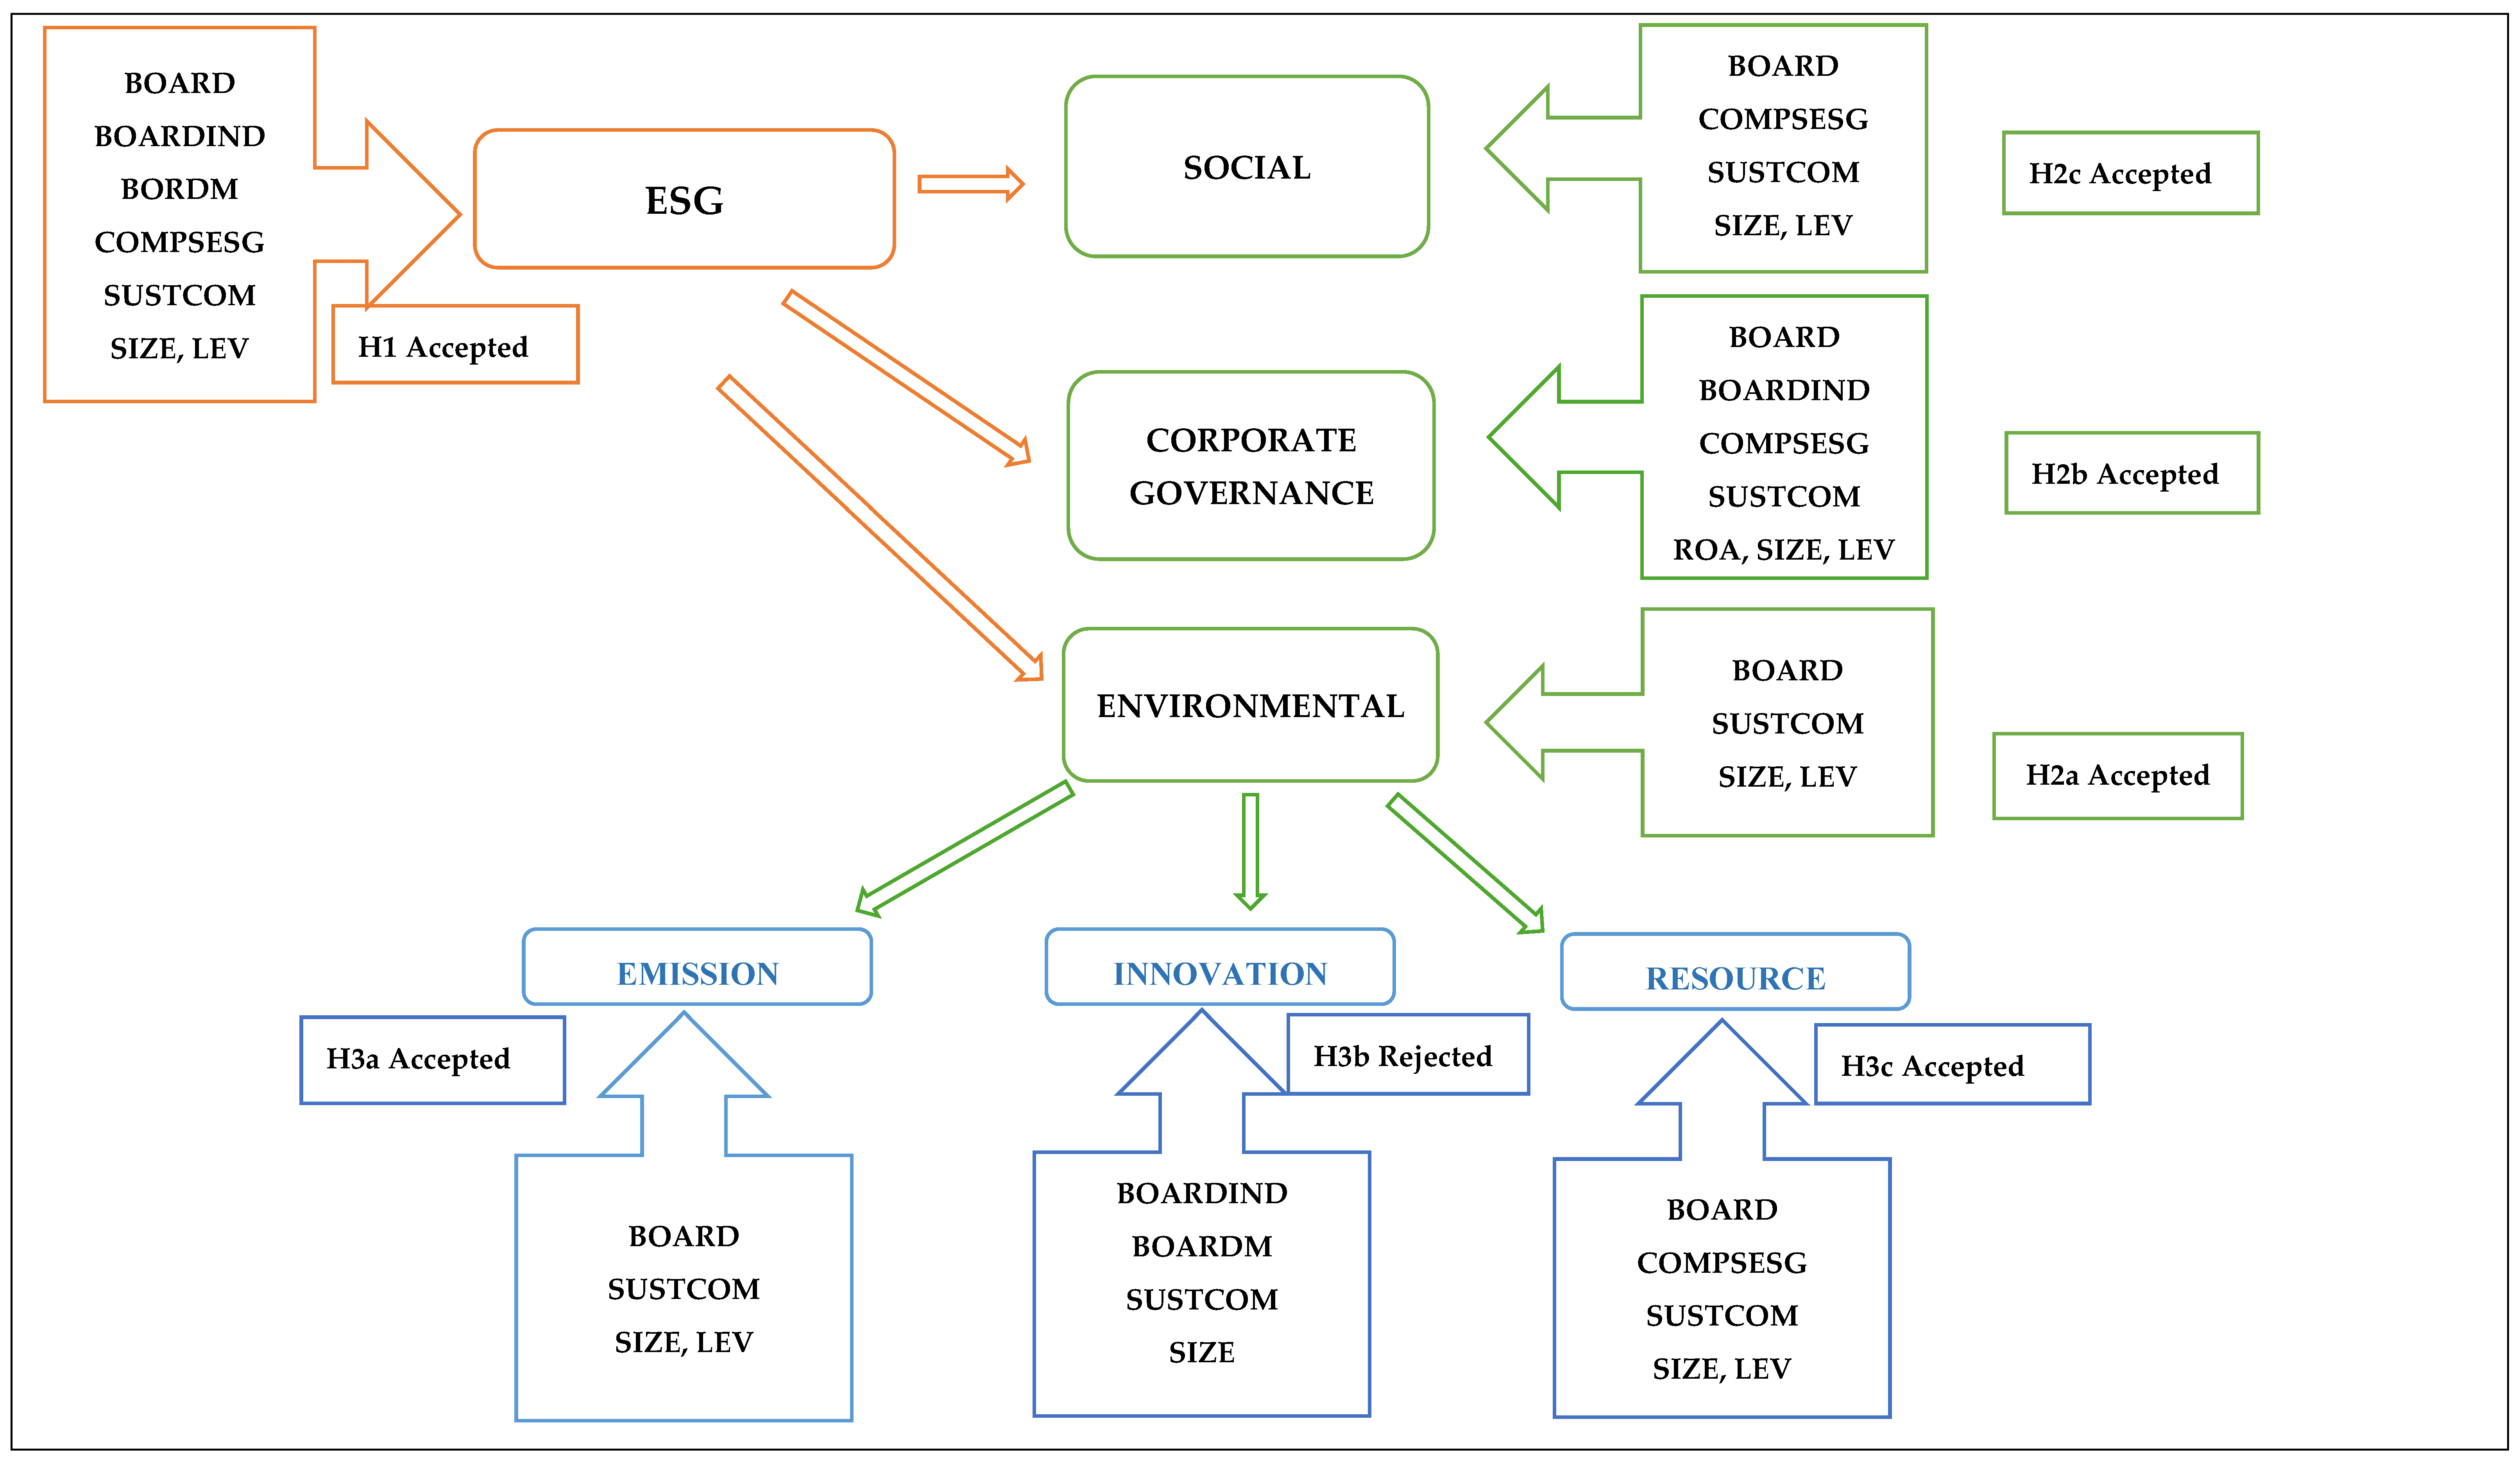
4. Empirical Results and Discussion

In this part of the study, panel data analysis findings regarding the models used are included.

4.1. Statistical Evaluation

In this section, which includes research findings obtained through panel data analysis, descriptive statistical information regarding the variables used in the study is given first. Descriptive statistics regarding the variables used in the study are shown in Table 2.
Table 2 shows the mean value, standard deviation, minimum, and maximum values of all variables. The highest value in the ESG scores of businesses is 94.57, while the average value is 58.49. The highest value in environmental scores was determined to be 99.20, and the average value was determined to be 59.37. The average value in emission scores was 62.11, the average value in innovation scores was 46.23, and the average score for resource use was 59.46. Table 2 shows that the size of the board of directors varies between 6 and 26 members, and the ratio of independent members has an average value of 45.37. It is also seen that the average annual number of board meetings is 8.49. As seen in Table 2, the standard deviation values of ESG and subcomponents are significantly high. A high standard deviation is an indication that a wide range of distribution has emerged in the dataset and that there are values far from the mean. This indicates that the ESG performances of the companies that were part of the analysis differ significantly from one another. The ESG performances of companies based on voluntary participation in environmental activities still vary significantly between companies due to the lack of legal obligations. Furthermore, the high standard deviation of the BOARDIND variable is also caused by the notable differences in the rates of independent members on the boards of directors.
It was first determined whether there was a multicollinearity problem between the independent variables since the emergence of a multicollinearity problem in the datasets used in panel data analysis may cause incorrect results in panel data analysis. Variance inflation factor (VIF) analysis was applied to the model variables applied in the study. It is seen that there is no linear connection problem in the study since the average VIF value for the study variables was determined to be 1.49. In addition, Pearson correlation was applied to investigate the level of link between the study variables. The Pearson correlation findings regarding the variables included in the study model are shown in Table 3.
The correlation findings given in Table 3 show that there is not a very strong relationship between environmental score variables and variables related to board qualifications and firm performance. There is a high correlation relationship between variables related to ESG, environmental, governance, and social scores and emissions, innovation, and resource use scores, but these variables are not used in the same model. In general, correlation results indicate a low or medium level of a positive relationship between the variables. However, there are significant relationships regarding the negative impact of the ROA variable on the environmental activities of firms.
In the study, the presence of an autocorrelation problem was investigated with Durbin–Watson and Baltagi–Wu LBI tests. While cross-sectional dependency was examined with the Breusch–Pagan LM test, the modified Wald test was used to determine whether there was a variance problem. To eliminate the cross-sectional dependency, autocorrelation, and heteroscedasticity problems identified in the study, model estimates were made with Driscoll–Kraay standard errors, one of the robust estimators.

4.2. Regression Results

This section of the research includes the model findings obtained because of the panel data analysis. In panel data analysis, the F test, Breusch and Pagan LM test, and Hausman test performed to make estimations with the correct model show that the models are suitable for estimation with fixed effects. Accordingly, the models were estimated according to fixed effects with the Driscoll–Kraay standard errors robust estimator.
First, the research addresses the effect of board size on ESG disclosures. Then, the effect on ENVS, SOCS, and GOVS disclosures is examined. The analysis findings regarding the effects of board size on ESG disclosures as well as ENVS, SOCS, and GOVS variables are shown in Table 4.
In line with the purpose of the study, environmental, corporate governance, and social performance indicators are examined separately. For this purpose, the total number of board members (BOARD), the ratio of independent board members (BOARDIND), the total number of meetings held by the board (BORDM), and the ESG-related management compensation received by the directors (COMPSESG) were determined as variables related to the management structure of the companies. In addition, the dummy variable created for the presence of a sustainability committee in the firms (SUSTCOM) is used to evaluate the possible mediating effects on environmental performance indicators. The return on assets (ROA), firm size (SIZE), and financial debt ratio (LEV) are used as control variables in the study.
Table 4, which presents the empirical results of the study, reflects the model findings aimed at determining the possible effects of board size on environmental performance indicators reflecting environmental sustainability views. The findings in Table 4 show that the size of the board of directors has a positive and significant effect on the ESG scores as well as the environmental and social disclosures of the company but does not have any significant effect on the social performance indicators. The findings indicate that the number of independent members on the board of directors positively affects the ESGS and GOVS disclosures.
The study provides evidence that the presence of an SC in companies has a significant and positive effect on ESG disclosure as well as on ENVS, SOCS, and GOVS variables. In addition, the presence of ESG-related executive compensation is also seen to have significant effects on ESG, SOCS, and GOVS variables. The study findings indicate that the ROA variable used as a financial performance indicator does not have any significant effect on ESG disclosure. On the other hand, there are findings that show that the firm size (SIZE) and financial debt ratio (LEV) of companies also have a significant effect on ESG scores.
The model findings used in the study to determine the effects of board size on emissions, innovation, and resource use, which constitute environmental scores, are shown in Table 5.
In the study, robust checks were carried out by evaluating the effects of board size on emissions, innovation, and resource use, which constitute environmental scores. Table 5 shows empirical findings regarding the effects of board size on EMISSION, INNOVATION, and RESOURCE variables. The findings support the significant effect of board size on all dependent variables. While supporting the positive effect of the board size on the EMISSION and RESOURCE variables, they indicate a negative effect on the INNOVATION variable. It was found that the independent member ratios and the number of meetings of the board only affect the INNOVATION variable. The study provides evidence that the presence of an SC in companies improves ESG disclosure by positively affecting EMISSION, INNOVATION, and RESOURCE variables. In addition, the SIZE variable positively affects the EMISSION, INNOVATION, and RESOURCE disclosures, while the LEV variable has a positive and significant contribution only to emission disclosures.
The model results used to determine whether the presence of an SC has a mediating influence on the link between board size and ESG disclosures are given in Table 6. Table 6 shows the model findings used in the study to determine whether the presence of an SC has a mediating effect on the relationship between board size and ESG disclosures. It is seen that the presence of an SC has a mediating effect on the disclosure of all variables except the SOCS and RESOURCE variables. Table 6 reveals that the presence of an SC negatively mediates the effect of board size on ESG-related disclosures. This result indicates that the presence of an SC improves ESG-related disclosures more in firms with fewer board members. Thus, it is emphasized that the effectiveness of the SC decreases in disclosures regarding ESG activities as the size of the board increases. The results of Table 4 and Table 5 and Table 6 are summarized in Figure 1 and Figure 2, respectively.

4.3. Robustness Test

The emission, innovation, and resource use scores that make up the environmental score were also completed for robust controls. Emission performances express the efforts of companies in their production and operational activities to reduce environmental emissions. Company activities aimed at using new environmental technologies and designing more environmentally friendly products to reduce environmental costs are explained with the concept of innovation. Companies’ activities aimed at reducing material, energy, or water usage or developing more environmentally friendly methods in supply chain management are measured with resource usage performance. Therefore, environmental performances are formed by the sum of EMISSION, INNOVATION, and RESOURCE performances. In robust tests, companies’ emission reduction efforts, resource usage rates, and environmental performances related to product innovations were used.
In addition, the Arellano–Bond dynamic GMM method is used in the study to reach more robust results by taking into account the endogeneity bias. Therefore, the analysis findings made with the Arellano and Bond (1991) dynamic panel estimation performed with the lagged value of the dependent variable are shown in Table 7.
Table 7 includes the GMM method findings. In this context, Sargan and autocorrelation tests were performed to make inferences with the GMM method. Sargan test findings indicate that there is no over-identification restriction problem in the models. Since the AR (1) test findings performed for the detection of autocorrelation regarding the application of the GMM method revealed that there was no second-degree autocorrelation problem in the models, inferences were made with the analysis findings. In addition, the findings also show that the Wald statistics values for all models are significant.
Table 7 indicates that the one-year lagged values of all dependent variables are significant. The GMM analysis findings support the positive effect of the BOARD variable on all sustainability disclosures. It is seen that independent members improve all sustainability disclosures except the SOCS variable. The findings support the contribution of COMPSESG and SUSTCOM variables to sustainability disclosure. In addition, the existence of a sustainability committee supports the main model findings, indicating that the size of the board of directors has an adverse effect on sustainability disclosures. The findings reveal that the existence of a sustainability committee contributes more, especially to small boards of directors.

4.4. Discussion

The environmental efforts of business managements that produce or provide ser-vices in the transportation sector are important since the transportation sector has created the source of a significant portion of air pollutant emissions. The awareness of global environmental problems by service businesses operating in the transportation sector and businesses that produce to meet the needs of the sector and the environmental activities they will carry out to reduce emissions can significantly affect carbon management on a global scale. For this reason, transportation sector business management is expected to make the necessary innovation and resource planning regarding the production of transportation equipment to ensure both business and environmental sustainability and to prioritize projects that will reduce environmental and social negativity to reduce emission values originating from production facilities. In addition, the necessary financial resources should be created for various environmental investment projects, such as the development of emission-reducing products. In this context, the study focuses on the importance of boards of directors’ disclosures regarding environmental activities in the transportation sector. The study aims to determine how the size of the board of directors in the transportation sector affects environmental sustainability disclosures. It also examines whether the size of the board of directors and the presence of an SC have a moderating effect on environmental sustainability disclosures. For this purpose, the study focuses on manufacturing and service enterprises operating in the transportation sector, which is one of the main emission-polluting sectors.
The study hypotheses and models were created to determine the mediating effect of the size of the board of directors of production and service enterprises operating in the transportation sector and the presence of an SC on environmental sustainability disclosures. In line with the purpose of the study, a dataset consisting of companies operating in the transportation sector within the EU was established. In the study, a dataset containing 752 observations of 47 transportation sector companies between 2005 and 2020 was used in panel data analysis.
The analysis first determined the effect of the size of the board of directors on environmental sustainability disclosures. Therefore, first the ESGS variable was used as the dependent variable, and then robust checks were performed using the ENVSCORE, CGSCORE, and SOCSCORE variables. In addition, robust checks were continued with the EMISSION, INNOVATION, and RESOURCE variables regarding the subsections of environmental disclosures. The second stage of the study focused on trying to determine, the mediating effect of the presence of an SC on environmental sustainability disclosures of the board size of directors.
The findings regarding the effect of board size on environmental sustainability disclosures indicate a positive and significant relationship between board size and ESGS disclosures. In addition, the number of independent board members, ESG engagement executive compensation, and the presence of an SC are also seen to be effective in ESG disclosure. The findings also support the positive effect of board size on the disclosure of ENVS and SOCS variables. In addition, it is seen that the presence of the SC continues to be effective in all sub-variables as well as in ESGS disclosure. The number of independent board members is only associated with the GOVS variable. ESG connection executive compensation is seen to affect the GOVS and SOCS variables, while no significant effect is observed regarding the ENVS variable. The study findings also indicate that the size of the board of directors and the SC have a significant effect on EMISSION, INNOVATION, and RESOURCE variables. The positive effect of firm size on environmental performance emphasizes that as firm size increases, firms will have the ability to act more comfortably in financial terms regarding environmental sustainability practices and that environmentally sensitive systems can be easily procured. In addition, firm size allows for the creation of more environmentally sensitive human resources and the allocation of more resources to emission reduction projects.
The findings regarding the mediating effect of the presence of an SC on board size on environmental sustainability disclosures emphasize that both board size and the SC committee have a direct positive effect on all variables. However, it was determined that ESG-linked executive compensations have an impact on ESG, GOVS, and SOCS variables. The study findings on the mediating effect of the presence of an SC on the environmental sustainability disclosures of the size of the board of directors generally show that the presence of an SC has a mediating effect on all variables except the SOCS variable. However, it is seen that the mediation effect decreases as the size of the board of directors increases in the effectiveness of the SC in environmental sustainability disclosures. Therefore, the results provide evidence that the presence of an SC improves ESG-related disclosures more in firms with fewer board members. Larger boards of directors can occasionally give more space to issues such as age, education, experience, gender diversity, and foreign member ratio, as they have more diversity of members. The study shows direct positive developments in the sustainability disclosures of the board of directors. The size of the board of directors can also greatly increase the need for the effectiveness of sustainability committees, which are presented to allow for diversity in board members. However, in the boards of directors with fewer members, due to limited diversity of members, not enough attention is paid to sustainability activities and reporting. Therefore, in companies that do not have a sufficient board size, a professional sustainability committee may be needed more. Thus, the indirect effect of a sustainability committee on sustainability disclosures can be seen more strongly in small boards of directors. In fact, Table 7 indicates that keeping a sustainability committee on smaller boards of directors positively improves sustainability disclosures.
Contrary to the findings of studies that did not find any effect between board size and environmental sustainability disclosures [10,24], the study findings provide evidence for studies that emphasize a positive and significant relationship between board size and environmental sustainability disclosures [6,26]. This is consistent with the findings of the study that revealed the positive relationship between board sustainability committees and corporate environmental and social performance [3]. Thus, the results of the study show that the presence of an SC in businesses supports the environmental and social performance of companies [10]. The study findings showing that CG has a significant positive impact on the environmental sustainability of firms are confirmed in terms of board size and sustainability committees [25]. Our findings regarding the significant relationship between the number of board meetings and INNOVATION disclosures confirm the findings of studies that more frequent board meetings are an indicator of board diligence and greater attention to stakeholder needs [12].

5. Conclusions and Recommendations

The study focuses on determining how the CG structures of the transportation sector’s production and service enterprises are effective in disclosing the environmental performance indicators they display based on their environmental efforts. The findings on the effect of board size on environmental sustainability disclosures provide evidence that board size improves environmental sustainability disclosures. The findings on the mediating effect of the presence of an SC on environmental sustainability disclosures of board size reveal that the mediating effect of the SC on environmental sustainability disclosures decreases as the size of the board increases. The findings reveal that the existence of a sustainability committee contributes more, especially to small boards of directors. The positive effect of firm size on environmental performance emphasizes that as firm size increases, firms will have the ability to act more comfortably in financial terms regarding environmental sustainability practices and that environmentally sensitive systems can be easily procured.
This study may contribute to the evaluation of environmental sustainability activities in the strategic decision-making processes of manufacturing and service companies in the competitive transportation sector. The study also emphasizes that board size will improve the activities related to emissions, innovation, and resource use in companies as well as ESG disclosure. The study provides several contributions to existing literature. First, it is expected that the study will contribute to CG and sustainability literature. While examining the effect of the size of the board of directors on environmental performance, the study also evaluates whether the presence of an SC in companies has a mediating effect on this relationship. In addition to the effect on ESG disclosure, the study also performs controls by revealing detailed results on environmental, corporate, and social performances and the sub-indicators of environmental performances such as emission, innovation, and resource use performances. It is expected that the study will contribute to relevant stakeholders and policymakers in terms of increasing environmental activities and reducing emissions, especially in the transportation, production, and service sectors. The study has several limitations, such as the small size of the dataset and focusing only on EU countries and a single sector. It is thought that different sectoral and regional comparisons can be made with a wider dataset in future studies. Additionally, future research could address the role of regulatory environments in developed countries such as the EU as well as emerging markets using different variables and methods.

Author Contributions

Conceptualization, H.G. and C.G.; Formal analysis, H.G. and C.G.; methodology, H.G. and C.G.; data curation, H.G. and C.G.; writing—review and editing, H.G. and C.G.; visualization, H.G. and C.G. All authors have read and agreed to the published version of the manuscript.

Funding

This research received no external funding.

Institutional Review Board Statement

Not applicable.

Informed Consent Statement

Not applicable.

Data Availability Statement

The original contributions presented in the study are included in the article; further inquiries can be directed to the corresponding author.

Conflicts of Interest

The authors declare no conflicts of interest.

References

  1. Kuo, K.C.; Yu, H.Y.; Lu, W.M.; Le, T.T. Sustainability and corporate performance: Moderating role of environmental, social, and governance investments in the transportation sector. Sustainability 2022, 14, 4095. [Google Scholar] [CrossRef]
  2. Downar, B.; Ernstberger, J.; Reichelstein, S.; Schwenen, S.; Zaklan, A. The impact of carbon disclosure mandates on emissions and financial operating performance. Rev. Account. Stud. 2021, 26, 1137–1175. [Google Scholar] [CrossRef]
  3. Orazalin, N.S.; Ntim, C.G.; Malagila, J.K. Board sustainability committees, climate change initiatives, carbon performance, and market value. Br. J. Manag. 2024, 35, 295–320. [Google Scholar] [CrossRef]
  4. Chen, W.; Xie, Y.; He, K. Environmental, social, and governance performance and corporate innovation novelty. Int. J. Innov. Stud. 2024, 8, 109–131. [Google Scholar] [CrossRef]
  5. Ghosh, S.; Pareek, R.; Nath Sahu, T. How far corporate governance and firms’ characteristics are relevant toward environmental sustainability? An empirical investigation. Rajagiri Manag. J. 2023, 17, 183–197. [Google Scholar] [CrossRef]
  6. Burki, U.; Ersoy, P.; Dahlstrom, R. Achieving triple bottom line performance in manufacturer-customer supply chains: Evidence from an emerging economy. J. Clean. Prod. 2018, 197, 1307–1316. [Google Scholar] [CrossRef]
  7. Wang, G.; Bai, S.; Ogden, J.M. Identifying contributions of on-road motor vehicles to urban air pollution using travel demand model data. Transp. Res. Part D Transp. Environ. 2009, 14, 168–179. [Google Scholar] [CrossRef]
  8. Herold, D.M.; Lee, K.H. Carbon management in the logistics and transportation sector: An overview and new research directions. Carbon Manag. 2017, 8, 79–97. [Google Scholar] [CrossRef]
  9. Govindan, K.; Kilic, M.; Uyar, A.; Karaman, A.S. Drivers and value-relevance of CSR performance in the logistics sector: A cross-country firm-level investigation. Int. J. Prod. Econ. 2021, 231, 107835. [Google Scholar] [CrossRef]
  10. Buallay, A. Is sustainability reporting (ESG) associated with performance? Evidence from the European banking sector. Manag. Environ. Qual. Int. J. 2019, 30, 98–115. [Google Scholar] [CrossRef]
  11. Hussain, N.; Ringini, U.; Orij, R.P. Corporate governance and sustainability performance: Analysis of triple bottom line performance. J. Bus. Ethics 2018, 149, 411–432. [Google Scholar]
  12. Taliento, M.; Favino, C.; Netti, A. Impact of environmental, social, and governance information on economic performance: Evidence of a corporate ‘sustainability advantage’ from Europe. Sustainability 2019, 11, 1738. [Google Scholar] [CrossRef]
  13. Brammer, S.; Pavelin, S. Factors influencing the quality of corporate environmental disclosure. Bus. Strateg. Environ. 2008, 17, 120–136. [Google Scholar]
  14. Da Silva Monteiro, S.M.; Guzman, B.A. The influence of the Portuguese environmental accounting standard on the environmental disclosures in the annual reports of large companies operating in Portugal. Environ. Qual. Manag. 2010, 21, 414–435. [Google Scholar]
  15. Younis, H.; Sundarakani, B. The impact of firm size, firm age and environmental management certification on the relationship between green supply chain practices and corporate performance. Benchmark. Int. J. 2020, 27, 319–346. [Google Scholar]
  16. Andrikopoulos, A.; Kriklani, N. Environmental disclosure and financial characteristics of the firm: The case of Denmark. Corp. Soc. Responsib. Environ. Manag. 2013, 20, 55–64. [Google Scholar] [CrossRef]
  17. Walls, J.L.; Berrone, P.; Phan, P.H. Corporate governance and environmental performance: Is there really a link? Strateg. Manag. J. 2012, 33, 885–913. [Google Scholar]
  18. Amran, A.; Lee, S.P.; Devi, S.S. The influence of governance structure and strategic corporate social responsibility toward sustainability reporting quality. Bus. Strategy Environ. 2014, 23, 17–235. [Google Scholar]
  19. EmadEldeen, R.; Elbayuomi, A.F.; Elmoursy, H.; Bouaddi, M.; Basuony, M.A.K. Does board diversity drive sustainability? Evidence from UK-Listed Companies. Sustainability 2025, 17, 1177. [Google Scholar] [CrossRef]
  20. Jeyhunov, A.; Kim, J.D.; Bae, S.M. The effects of board diversity on Korean Companies’ ESG performance. Sustainability 2025, 17, 787. [Google Scholar] [CrossRef]
  21. De Villiers, C.; Naiker, V.; Van Staden, C.J. The effect of board characteristics on firm environmental performance. J. Manag. 2011, 37, 1636–1663. [Google Scholar]
  22. Awad, A.B.; Gharios, R.; Abu Khalaf, B.; Seissian, L.A. Board characteristics and bank stock performance: Empirical evidence from the MENA Region. Risks 2024, 12, 81. [Google Scholar] [CrossRef]
  23. Boone, A.L.; Field, L.C.; Karpoff, J.M.; Raheja, C.G. The determinants of corporate board size and composition: An empirical analysis. J. Financ. Econ. 2007, 85, 66–101. [Google Scholar]
  24. Pearce, J.A.; Patel, P.C. Board of director efficacy and firm performance variability. Long Range Plann. 2018, 51, 911–926. [Google Scholar]
  25. Donnelly, R.; Mulcahy, M. Board structure, ownership, and voluntary disclosure in Ireland. Corp. Gov. Int. Rev. 2008, 16, 416–429. [Google Scholar]
  26. Shrivastava, P.; Addas, A. The impact of corporate governance on sustainability performance. J. Sustain. Finance Invest. 2014, 4, 21–37. [Google Scholar]
  27. Slawinski, N. Short on Time: The Role of Organizational Time Orientation in Business Sustainability; School of Graduate and Postdoctoral Studies, Western University: London, ON, Canada, 2010. [Google Scholar]
  28. Liao, L.; Luo, L.; Tang, Q. Gender diversity, board independence, environmental committee and greenhouse gas disclosure. Br. Account. Rev. 2015, 47, 409–425. [Google Scholar]
  29. Masud, M.A.K.; Nurunnabi, M.; Bae, S.M. The effects of corporate governance on environmental sustainability reporting: Empirical evidence from South Asian countries. Asian J. Sustain. Soc. Responsib. 2018, 3, 3–26. [Google Scholar]
  30. Katmon, N.; Mohamad, Z.Z.; Norwani, N.M.; Al Farooque, O. Comprehensive board diversity and quality of corporate social responsibility disclosure: Evidence from an emerging market. J. Bus. Ethics 2017, 157, 447–481. [Google Scholar]
  31. Lipton, M.; Lorsch, J.W. A modest proposal for improved corporate governance: Business source. Bus. Lawyer 1992, 48, 59–77. [Google Scholar]
  32. Mahoney, L.S.; Thorn, L. An examination of the structure of executive compensation and corporate social responsibility: A Canadian investigation. J. Bus. Ethics 2006, 69, 149–162. [Google Scholar] [CrossRef]
  33. Haque, F. The effects of board characteristics and sustainable compensation policy on carbon performance of UK firms. Br. Account. Rev. 2017, 49, 347–364. [Google Scholar] [CrossRef]
  34. Lee, M.T.; Raschke, R.L.; Krishen, A.S. Signaling green! firm ESG signals in an interconnected environment that promote brand valuation. J. Bus. Res. 2022, 138, 1–11. [Google Scholar] [CrossRef]
  35. Alkaraan, F.; Elmarzouky, M.; Hussainey, K.; Venkatesh, V.G.; Shi, Y.; Gulko, N. Reinforcing green business strategies with Industry 4.0 and governance towards sustainability: Natural-resource-based view and dynamic capability. Bus. Strategy Environ. 2024, 33, 3588–3606. [Google Scholar] [CrossRef]
  36. Paillé, P.; Halilem, N. Systematic review on environmental innovativeness: A knowledge-based resource view. J. Clean. Prod. 2019, 211, 1088–1099. [Google Scholar]
  37. Chuang, S.-P.; Huang, S.-J. The effect of environmental corporate social responsibility on environmental performance and business competitiveness: The mediation of green information technology capital. J. Bus. Ethics 2018, 150, 991–1009. [Google Scholar] [CrossRef]
  38. Tang, Y.; Zhu, J.; Ma, W.; Zhao, M. A study on the impact of institutional pressure on carbon information disclosure: The mediating effect of enterprise peer influence. Int. J. Environ. Res. Public Health 2022, 19, 4174. [Google Scholar] [CrossRef]
  39. Irshad, A.u.R.; Safdar, N.; Younas, Z.I.; Manzoor, W. Impact of corporate governance on firms’ environmental performance: Case study of environmental sustainability-based business scenarios. Sustainability 2023, 15, 7775. [Google Scholar] [CrossRef]
  40. Muneer, S.; Singh, A.; Choudhary, M.H.; Alshammari, A.S.; Butt, N.A. Does environmental disclosure and corporate governance ensure the financial sustainability of Islamic Banks? Adm. Sci. 2025, 15, 54. [Google Scholar] [CrossRef]
  41. Bose, S.; Khan, H.Z.; Bakshi, S. Determinants and consequences of sustainable development goals disclosure: International evidence. J. Clean. Prod. 2024, 434, 140021. [Google Scholar] [CrossRef]
  42. Driss, H.; Drobetz, W.; El Ghoul, S.; Guedhami, O. The Sustainability committee and environmental disclosure: International evidence. J. Econ. Behav. Organ. 2024, 221, 602–625. [Google Scholar]
  43. Luo, L.; Tang, Q. Corporate governance and carbon performance: Role of carbon strategy and awareness of climate risk. Account. Finance 2021, 61, 2891–2934. [Google Scholar] [CrossRef]
  44. Orazalin, N. Do board sustainability committees contribute to corporate environmental and social performance? The mediating role of corporate social responsibility strategy. Bus. Strat. Environ. 2020, 29, 140–153. [Google Scholar]
  45. Dong, Y.; Liang, C.; Wanyin, Z. Board diversity and firm performance: Impact of ESG activities in China. Econ. Res.-Ekon. Istraž. 2023, 36, 1592–1609. [Google Scholar] [CrossRef]
  46. Litman, T. Toward more comprehensive evaluation of traffic risks and safety strategies. Res. Transp. Bus. Manag. 2018, 29, 127–135. [Google Scholar] [CrossRef]
  47. Shahrour, M.H.; Rohani, A.; Wojewodzki, M.; Tran, D.V. Carbon performance and financial performance: How R&D makes a difference Pre-and Post-Paris Accord. Int. J. Financ. Econ. 2024, 1–13. [Google Scholar] [CrossRef]
  48. Handayati, P.; Tham, Y.H.; Yuningsih, Y.; Sun, Z.; Nugroho, T.R.; Rochayatun, S. ESG performance and corporate governance –The moderating role of the big four auditors. J. Risk Financ. Manag. 2025, 18, 31. [Google Scholar] [CrossRef]
  49. Benlemlih, M.; Arif, M.; Nadeem, M. Institutional ownership and greenhouse gas emissions: A comparative study of the UK and the USA. Br. J. Manag. 2023, 34, 623–647. [Google Scholar] [CrossRef]
  50. Figge, F.; Hahn, T. Is green and profitable sustainable? Assessing the trade-off between economic and environmental aspects. Int. J. Prod. Econ. 2012, 140, 92–102. [Google Scholar] [CrossRef]
  51. LSEG ESG Scores. ESG Scores Methodology. 2024. Available online: https://www.lseg.com/en/data-analytics/sustainable-finance/esg-scores (accessed on 14 November 2024).
Figure 1. Effect of board size on environmental performance.
Sustainability 17 03165 g001
Figure 2. Sustainability committee mediating effect on the relationship between board size and environmental performance.
Sustainability 17 03165 g002
Table 1. Symbols and measurement forms for variable definitions used in the model.
Dependent Variables
ESGThe overall company score obtained by combining ESG sub-scores (environmental, corporate governance, and social)
ENVSCOREEnvironmental score
CGSCORECorporate governance score
SOCSCORESocial score
EMISSIONEmission reduction score
INNOVATIONResource usage score
RESOURCEInnovation score
Independent Variables
BOARDTotal number of board members
BOARDINDRatio of the number of independent board members to total members
BOARDMNumber of meetings held by the board of directors
COMPSESGDummy variable with value ‘1’ if there is ESG-related management compensation and ‘0’ otherwise
Moderator Variable
SUSTCOMDummy variable with value ‘1’ if there is a sustainability committee and ‘0’ otherwise.
Control Variables
ROAThe ratio of period profit to lagged total assets
SIZELogarithm of total assets
LEVTotal liabilities to total assets ratio
Table 2. Descriptive statistical information.
VariablesMeanStd. Def.Min.Maxs.
ESG58.4921.45094.57
ENVSCORE59.3727.10099.20
CGSCORE55.0620.96098.05
SOCSCORE59.9524.25097.99
EMISSION62.1130.98099.74
INNOVATION46.2334.86099.73
RESOURCE59.4632.76099.89
BOARD13.624.95626
BOARDIND45.3729.610100
BOARDM8.493.95234
COMPSESG0.400.4901
SUSTCOM0.650.4801
ROA0.050.05−0.290.42
SIZE7.130.765.378.709
LEV0.310.1701.726
Table 3. Correlation and multicollinearity problem results.
VARIABLES(1)(2) (3) (4) (5) (6) (7) (8) (9) (10) (11) (12) (13) (14) (15) (16)
(1) ESG1.00
(2) ENVSCORE0.91 ***1.00
(3) CGSCORE0.71 ***0.50 ***1.00
(4) SOCSCORE0.94 ***0.83 ***0.51 ***1.00
(5) EMISSION0.85 ***0.91 ***0.47 ***0.78 ***1.00
(6) INNOVATION0.54 ***0.58 ***0.42 ***0.43 ***0.33 ***1.00
(7) RESOURCE0.84 ***0.92 ***0.40 ***0.81 ***0.84 ***0.37 ***1.00
(8) BOARD0.53 ***0.56 ***0.20 ***0.52 ***0.59 ***0.12 ***0.55 ***1.00 2.21
(9) BOARDIND0.10 ***0.010.33 ***0.03−0.030.21 ***−0.06−0.36 ***1.00 1.36
(10) BORDM0.11 ***0.10 ***0.10 ***0.11 ***0.11 ***0.020.09 **−0.18 ***0.20 ***1.00 1.21
(11) COMPSESG0.41 ***0.35 ***0.32 ***0.40 ***0.33 ***0.15 ***0.36 ***0.27 ***0.09 **0.13 ***1.00 1.34
(12) SUSTCOM0.62 ***0.60 ***0.46 ***0.55 ***0.55 ***0.31 ***0.58 ***0.27 ***0.19 ***0.15 ***0.44 ***1.00 1.46
(13) ROA−0.33 ***−0.35 ***−0.15 ***−0.33 ***−0.36 ***−0.13 ***−0.35 ***−0.35 ***0.14 ***−0.12 ***−0.14 ***−0.25 ***1.00 1.29
(14) SIZE0.69 ***0.67 ***0.39 ***0.68 ***0.63 ***0.47 ***0.65 ***0.56 ***−0.010.16 ***0.23 ***0.35 ***−0.42 ***1.00 1.85
(15) LEV0.36 ***0.34 ***0.20 ***0.34 ***0.37 ***0.040.31 ***0.35 ***−0.040.10 ***0.25 ***0.17 ***−0.16 ***0.32 ***1.001.22
(16) VIFMean VIF1.49
Note: “*** and **” signs indicate statistical significance at the 1% and 5% levels, respectively.
Table 4. Empirical results of basic models.
Independent VariableESGSENVSGOVSSOCS
Coef.Coef.Coef.Coef.
BOARD0.763 ***
(0.052)
1.153 ***
(0.168)
0.217
(0.141)
0.737 ***
(0.089)
BOARDIND0.071 ***
(0.018)
0.016
(0.044)
0.212 ***
(0.030)
0.020
(0.016)
BORDM−0.088
(0.051)
0.027
(0.155)
−0.230
(0.149)
0.004
(0.130)
COMPSESG3.430 **
(1.222)
0.734
(0.964)
4.191 ***
(1.281)
5.124 **
(1.837)
SUSTCOM15.738 ***
(1.016)
21.391 ***
(1.261)
11.504 ***
(1.192)
14.826 ***
(1.451)
ROA1.657
(12.649)
−7.600
(23.070)
1.860
(16.763)
2.742
(16.821)
SIZE12.199 ***
(1.687)
13.768 ***
(1.734)
6.609 ***
(1.292)
14.402 ***
(1.816)
LEV10.512 **
(3.574)
11.601 ***
(3.217)
6.812
(6.227)
10.164 **
(4.573)
Cons−56.167 ***
(12.908)
−72.671 ***
(14.755)
−13.952 *
(7.203)
−68.559 ***
(15.794)
R-squared0.680.640.360.61
F Statistics
(Prob)
425.79
(0.000)
2692.21
(0.000)
980.39
(0.000)
1735.21
(0.000)
Notes: The signs “***, **, and *” indicate statistical significance at the 1%, 5%, and 10% levels, respectively. Robust standard errors in parentheses.
Table 5. Empirical results of sub-models on environmental performances.
Independent VariableEMISSIONINNOVATIONRESOURCE
Coef.Coef.Coef.
BOARD1.995 ***
(0.251)
−1.392 ***
(0.196)
1.299 ***
(0.287)
BOARDIND0.028
(0.062)
0.148 **
(0.068)
−0.052
(0.034)
BORDM0.447
(0.309)
−1.292 ***
(0.284)
0.082
(0.152)
COMPSESG−0.513
(1.391)
1.869
(1.987)
3.390 *
(1.867)
SUSTCOM21.508 ***
(1.055)
12.285 ***
(4.083)
25.017 ***
(1.610)
ROA13.511
(22.077)
32.582
(36.756)
−5.258
(34.458)
SIZE11.693 ***
(2.987)
27.185 ***
(2.319)
16.314 ***
(1.998)
LEV19.678 ***
(5.231)
−17.512
(10.107)
7.603
(4.673)
Cons−72.441 ***
(19.835)
−129.292 ***
(14.402)
−92.364 ***
(17.819)
R-squared0.610.330.60
F Statistics
(Prob)
4285.77
(0.000)
1893.29
(0.000)
1647.45
(0.000)
Notes: The signs “***, **, and *” indicate statistical significance at the 1%, 5%, and 10% levels, respectively. Robust standard errors in parentheses.
Table 6. Empirical results for moderating effects.
Independent VariableESGSENVSGOVSSOCSEMISSION INNOVATIONRESOURCE
Coef Coef Coef Coef Coef Coef Coef
BOARD1.290 ***
(0.112)
1.734 ***
(0.192)
1.347 ***
(0.294)
0.780 ***
(0.139)
2.527 ***
(0.314)
−0.614
(0.355)
1.761 ***
(0.343)
BOARDIND0.062 ***
(0.018)
0.005
(0.045)
0.191 ***
(0.028)
0.020
(0.016)
0.018
(0.064)
0.134 *
(0.066)
−0.061
(0.038)
BORDM−0.093 *
(0.049)
0.023
(0.145)
−0.239
(0.130)
0.004
(0.132)
0.442
(0.301)
−1.298 ***
(0.275)
0.078
(0.158)
COMPSESG4.156 ***
(1.385)
1.534
(1.159)
5.747 ***
(1.291)
5.182 **
(1.921)
0.219
(1.242)
2.939
(2.245)
4.028 *
(2.099)
SUSTCOM27.269 ***
(1.822)
34.101 ***
(3.616)
36.231 ***
(3.061)
15.758 ***
(2.742)
33.149 ***
(4.066)
29.286 ***
(5.510)
35.146 ***
(6.466)
ROA12.318
(14.501)
4.150
(27.289)
24.720 *
(11.801)
3.604
(17.068)
−2.748
(28.268)
48.299
(37.433)
4.106
(41.252)
SIZE12.723 ***
(1.628)
14.345 ***
(1.728)
7.732 ***
(1.137)
14.444 ***
(1.888)
12.221 ***
(2.998)
27.957 ***
(2.227)
16.773 ***
(2.161)
LEV12.755 ***
(3.368)
14.073 ***
(3.257)
11.624 *
(6.018)
10.345 **
(4.472)
21.942 ***
(5.402)
−14.206
(9.432)
9.573 *
(5.429)
BOARD * SUSTCOM−0.915 ***
(0.125)
−1.008 ***
(0.252)
−1.962 ***
(0.219)
−0.074
(0.222)
−0.924 **
(0.314)
−1.349 ***
(0.381)
−0.804
(0.464)
Cons−66.964 ***
(11.953)
−84.571 ***
(15.178)
−37.105 ***
(5.310)
−69.431 ***
(17.051)
−83.341 ***
(20.541)
−145.209 ***
(12.908)
−101.849 ***
(21.469)
R-squared0.690.640.400.610.610.330.61
F
(Prob)
3233.23
(0.000)
8886.00
(0.000)
621.37
(0.000)
1649.07
(0.000)
7940.55
(0.000)
2184.12
(0.000)
2812.05
(0.000)
Notes: The signs “***, **, and *” indicate statistical significance at the 1%, 5%, and 10% levels, respectively. Robust standard errors in parentheses.
Table 7. Robustness test for endogeneity correction.
Independent VariableESGSENVSGOVSSOCSEMISSION INNOVATIONRESOURCE
Coef Coef Coef Coef Coef Coef Coef
Dependent Variable L10.541 *** (0.058)0.289 *** (0.060)0.184 *** (0.071)0.601 *** (0.036)0.228 *** (0.051)0.097 ** (0.046)0.302 *** (0.059)
BOARD1.142 *** (0.282)0.617 ** (0.301)1.799 *** (0.491)1.579 *** (0.219)0.526 ** (0.226)1.041 *** (0.351)1.123 *** (0.330)
BOARDIND0.043 *** (0.016)0.079 *** (0.011)0.070 *** (0.023)−0.019 (0.018)0.056 *** (0.014)0.087 *** (0.012)0.027 * (0.015)
BORDM0.052 (0.070)0.004 (0.069)0.043 (0.112)0.029 (0.082)0.209 *** (0.073)0.157 (0.112)0.096 (0.079)
COMPSESG2.167 *** (0.577)1.696 *** (0.438)3.411 *** (1.143)2.685 *** (0.812)2.198 *** (0.766)1.611 * (0.867)3.103 *** (0.801)
SUSTCOM10.808 *** (2.894)14.283 *** (3.793)16.459 *** (4.289)15.176 *** (2.371)13.884 *** (3.116)11.506 *** (3.783)27.132 *** (3.147)
ROA−4.329 (4.051)2.337 (3.468)−17.543 *** (5.802)−0.425 (5.035)−6.383 (4.735)15.205 *** (2.662)−5.976 (6.479)
SIZE11.628 *** (1.605)16.245 *** (3.396)16.421 *** (3.353)13.143 *** (2.363)8.595 *** (2.153)9.743 *** (2.090)10.616 ** (4.140)
LEV3.061 ** (1.423)4.136 *** (1.480)3.940 *** (1.465)3.456 * (1.913)2.788 * (1.607)−1.430 (1.471)8.353 *** (2.971)
BOARD ∗ SUSTCOM−0.527 ** (0.210)−0.447 * (0.247)−1.016 *** (0.277)−0.857 *** (0.153)−0.534 *** (0.201)−0.476 ** (0.238)−1.327 *** (0.199)
Cons−77.045 *** (10.384)−91.557 *** (20.420)−101.221 *** (28.033)−93.070 *** (15.773)−28.445 * (16.388)−53.947 *** (11.633)−59.195 ** (26.334)
Wald chi2 (Prob)3486.63 (0.000)2063.40 (0.000)369.96 (0.000)5525.55 (0.000)251.44 (0.000)491.61 (0.000)1065.32 (0.000)
Sargan test (Prob)32.335 (0.182)33.515 (0.148)37.582 (0.066)37.684 (0.065)36.998 (0.075)27.285 (0.3945)36.972 (0.075)
AR (1) (Prob)−5.037 (0.000)−3.355 (0.008)−4.102 (0.000)−4.673 (0.000)−3.851 (0.000)−1.557 (0.031)−3.437 (0.001)
AR (2) (Prob)2.112 (0.348)0.459 (0.646)−1.176 (0.240)1.304 (0.192)−0.667 (0.505)−2.155 (0.119)−0.398 (0.691)
Notes: The signs “***, **, and *” indicate statistical significance at the 1%, 5%, and 10% levels, respectively. Standard errors in parentheses.
Disclaimer/Publisher’s Note: The statements, opinions and data contained in all publications are solely those of the individual author(s) and contributor(s) and not of MDPI and/or the editor(s). MDPI and/or the editor(s) disclaim responsibility for any injury to people or property resulting from any ideas, methods, instructions or products referred to in the content.

