
The Efficiency Measurement and Spatial Spillover Effect of Green Technology Innovation in Chinese Industrial Enterprises


Abstract
1. Introduction
2. Literature Review
2.1. Study on the Connotation of GTI
2.2. Study on the Measurement of GTIE
2.3. Study on the Influencing Factors of GTIE
2.4. Literature Evaluation
3. Study Design and Data Description
3.1. Data Sources and Processing
3.2. Variable Selection
- (1)
- Input Variables Selection
- (2)
- Output Variables Selection
- (3)
- Environment Variables Selection
3.3. Study Methods
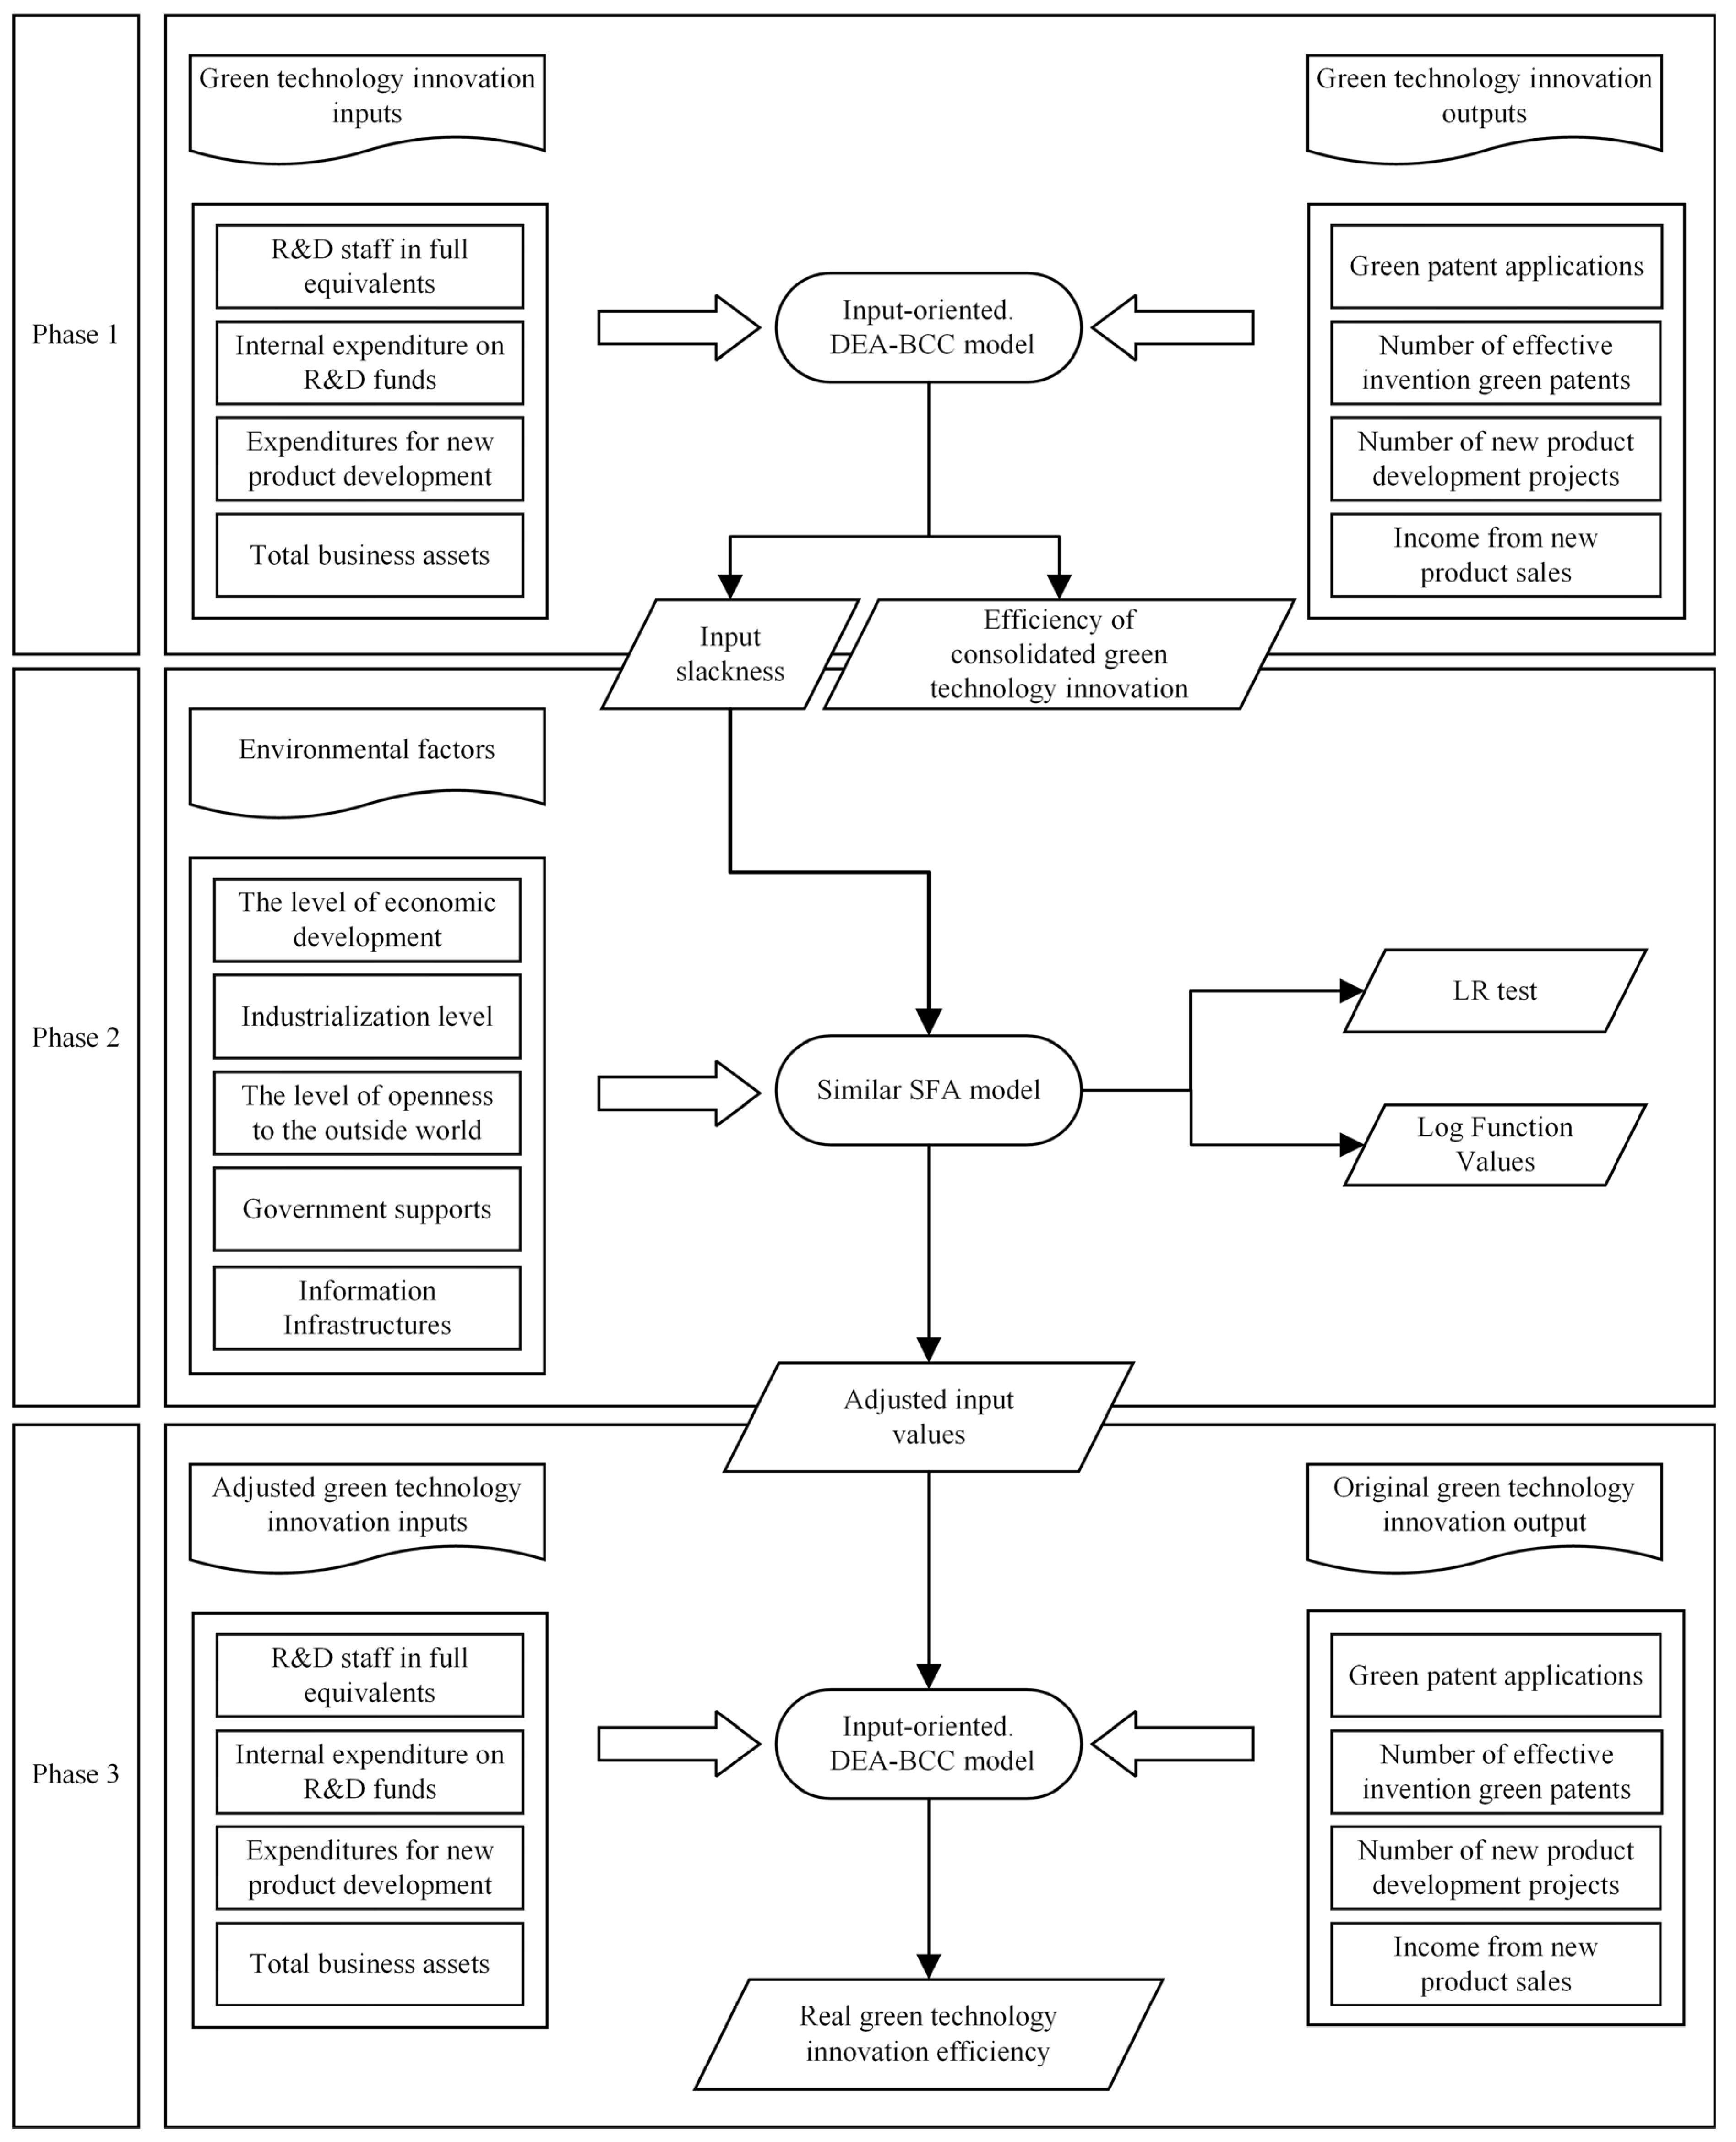
3.3.1. Three-Stage DEA Model
Phase 1: Traditional DEA Modeling
Phase 2: Similar SFA Models
Phase 3: Adjusted DEA Modeling
3.3.2. Spatial Self-Relation
3.3.3. Spatial Measurement Models
- (1)
- Spatial Lag Model (SAR)
- (2)
- Spatial Error Model (SEM)
- (3)
- Spatial Durbin Model (SDM)
4. Empirical Analysis
4.1. Phase 1: Traditional DEA Results Analysis
- (1)
- Nationally, from 2013 to 2022, the GTIE values of Chinese industrial firms are all greater than 0.8, with an overall trend of steady growth. Over the ten-year period, the mean GTIE stood at 0.869, which suggests that the GTIE of industrial firms in China remains at a relatively high level. This has been driven by a combination of policy support, technological advances, market demand, environmental regulations, and regional synergies.
- (2)
- In the four major areas, from 2013 to 2022, the GTIE averages of China’s east, central, west, and northeast areas are generally on an upward trend, and the gap between areas is gradually narrowing. In the decade, the GTIE averages were 0.913, 0.873, 0.840, and 0.822, revealing a trend of east > central > west > northeast. Possible reasons for this are as follows: the eastern area has a developed economy, abundant innovation resources and strong policy support, and has a better foundation for GTI. The central area has benefited from industrial transfer and policy support, and its innovation capacity has gradually improved. The western area shows advantages in resource endowment, but is constrained by infrastructure and talent shortage. The northeast area is relatively inefficient due to the high proportion of traditional industries and the pressure of transformation and upgrading. Overall, regional coordinated advancement policies and the promotion of GTI have contributed to the gradual narrowing of inter-regional disparities.
- (3)
- By province, the GTIE of Zhejiang, Guangdong, Hainan, Anhui, and Tibet between 2013 and 2022 is one, while that of Beijing, Tianjin, Shanghai, Hunan, and Jilin is one or close to one in most years, which does not reflect the change in efficiency over the 10 years. The GTIE means of Hebei, Fujian, and Shandong are 0.749, 0.756, and 0.764, respectively, which is not consistent with our perception that the eastern area has high innovation capacity. This is due to the fact that Hebei, Fujian, and Shandong, although located in the east part of the country, may be affected by industrial structure (e.g., a high proportion of heavy industry), unequal distribution of resources, or differences in the implementation of policies, resulting in a relatively low GTIE.
4.2. Phase 2: SFA Regression Results
4.2.1. The Level of Economic Development
4.2.2. Industrialization Level
4.2.3. The Extent of External Openness
4.2.4. Government Supports
4.2.5. Information Infrastructures
4.3. Phase 3: DEA Results Analysis with Adjusted Input Factors
- (1)
- Nationally, after barring environmental and random elements, the average value of GTIE for the period 2013–2022 is 0.625, which is 0.244 lower than that of the first stage, as shown in Table 3. It demonstrates how the GTIE value of Chinese industrial firms is overestimated as a result of stochastic disturbances and environmental elements. Meanwhile, Chinese industrial firms have a low GTIE value, and much more can be done to improve it. Therefore, firms should focus on the optimization of the external environment and the advancement of the internal management level in the process of GTI.
- (2)
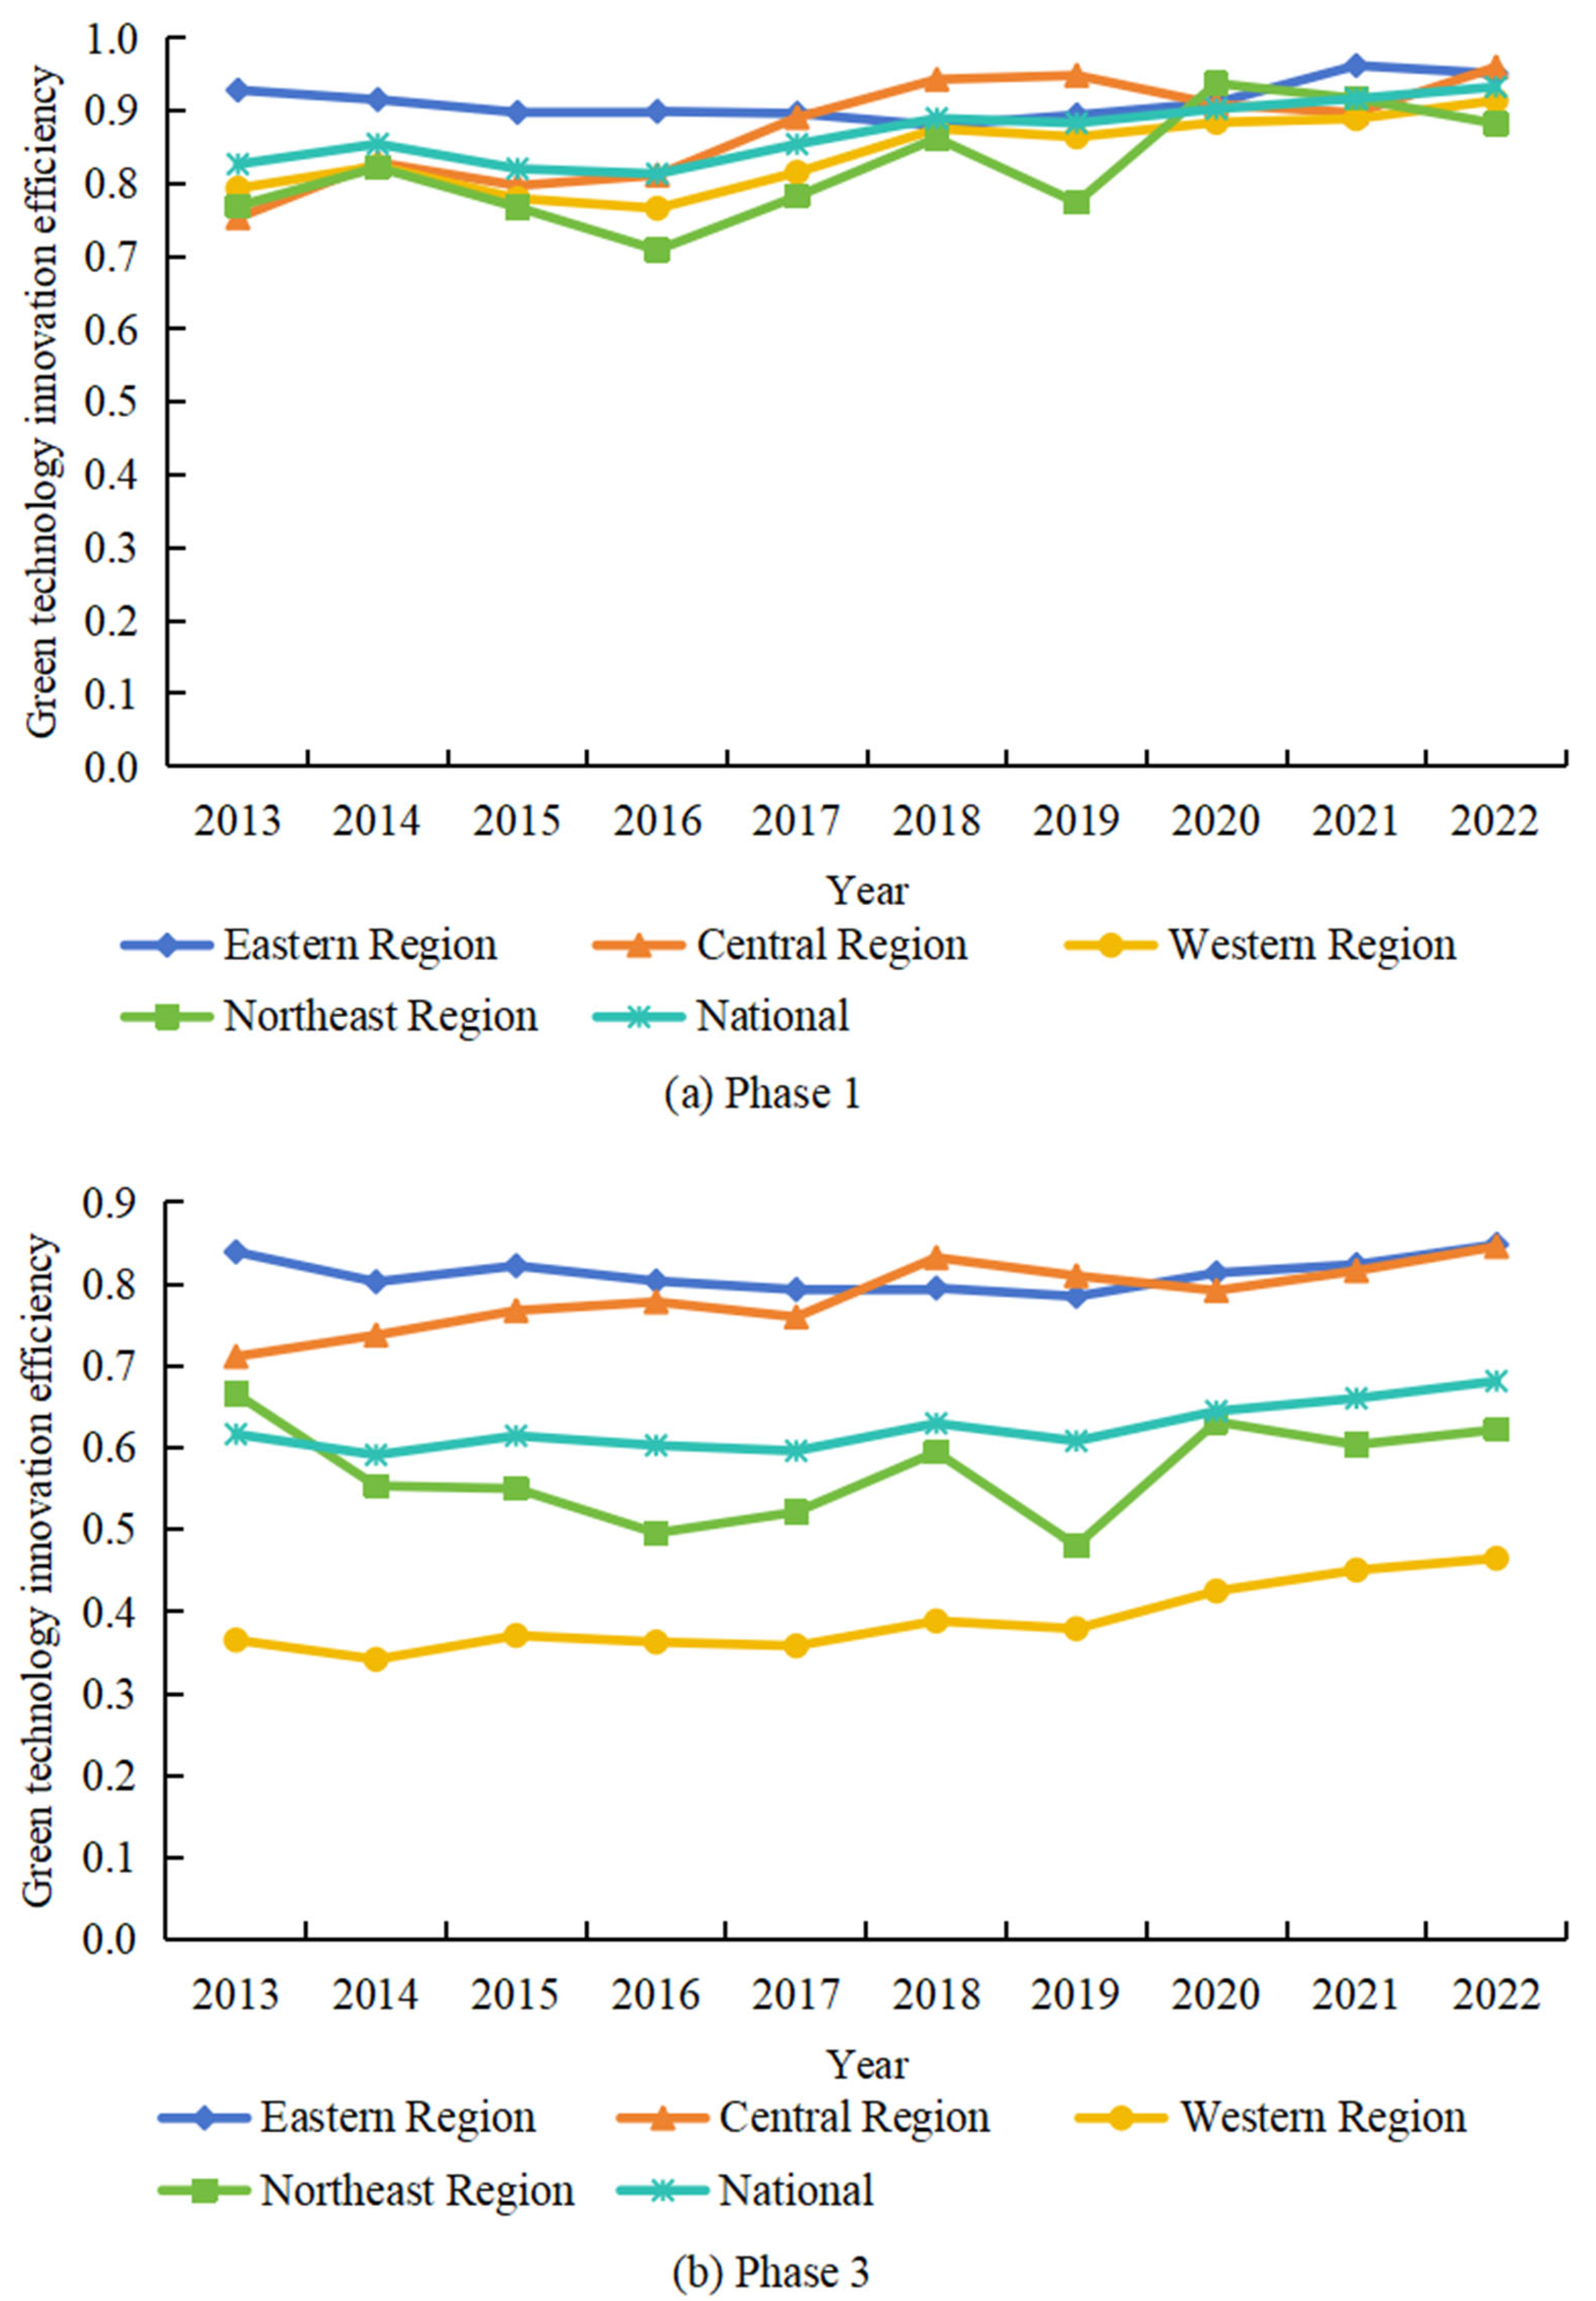
- Regionally, for the years 2013–2022, the first stage’s GTIE value is greater than the third stage in each of the four areas, as seen in Figure 2. Of these, the GTIE value of the western area decreased the most in the third stage, suggesting that external environmental elements have a greater impact on the western area’s GTIE. This is a result of resource-based industries dominating the western area’s industrial structure and the relative lack of enthusiasm for GTI, which has increased resistance to technology transfer and application. In addition, the GTIE value’s change trend remains constant throughout the first and third phases. Of these, the GTIE value for the eastern area declines and then rises, the central and western areas show an annual increase, and the northeastern area fluctuates and changes over a specific time period. Figure 2a shows that the inter-regional differences are negligible and the gap between the GTIE values of the four areas in the first stage is small. Figure 2b shows that the GTIE values of the four areas in the third stage differ significantly after stochastic and environmental disturbances are eliminated. It reveals the trend of east > central > northeast > west. Meanwhile, the eastern and central areas’ GTIE values are above the national mean, while the areas of the northeast and west are below the national average.
- (3)
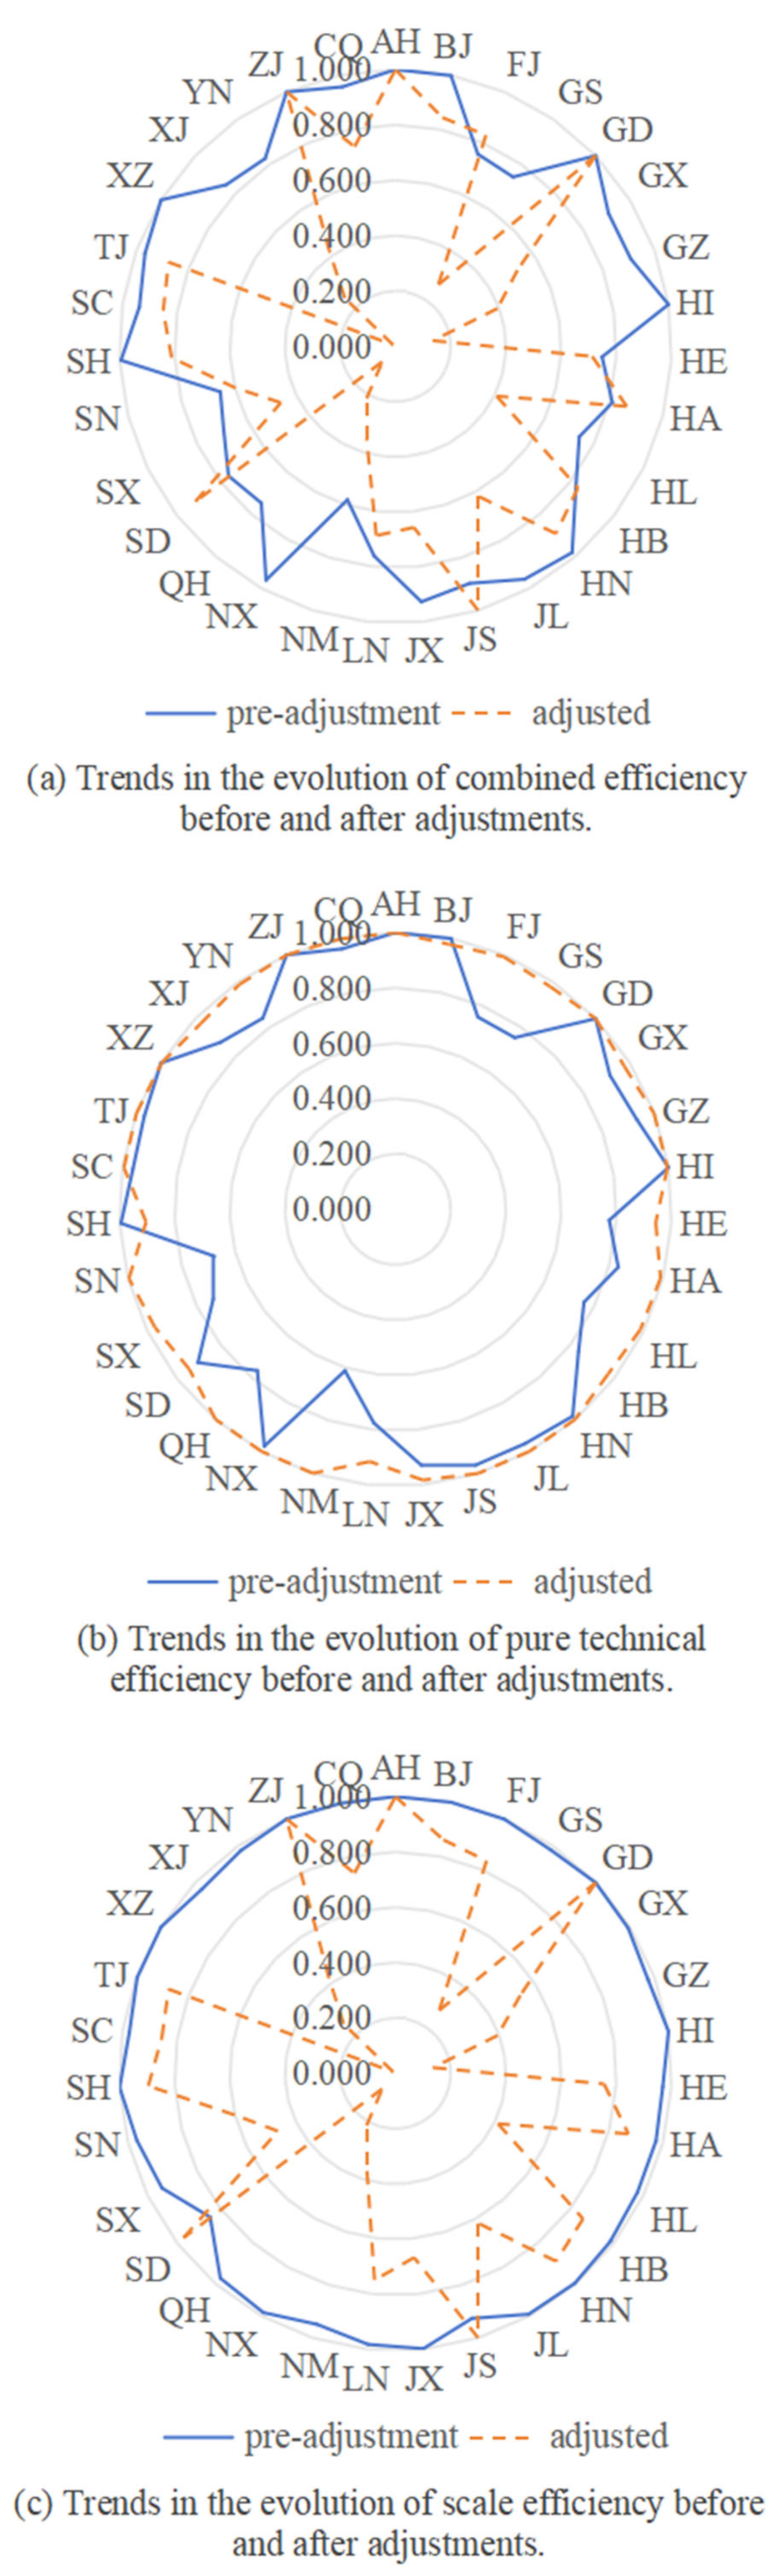
- In terms of provinces, the GTIE in the first and third stages is decomposed as follows. As shown in Figure 3a, the crste values before and after adjustment in Zhejiang and Guangdong are both one, which are both in the effective frontier, while the crste values of the rest of the provinces have obvious differences before and after adjustment. Most of the provinces have decreased crste values after adjustment, among which the crste differences before and after adjustment in Tibet, Hainan, Ningxia, Qinghai, Xinjiang, and Guizhou are all greater than 0.5; they are 0.990, 0.863, 0.750, 0.673, 0.594, and 0.515, respectively. It indicates that environmental elements lead to a serious overstatement of the efficiency of GTI. The opposite is true for Jiangsu, Fujian, Shandong, Henan, and Hubei, where the difference in crste before and after adjustment is less than zero. As shown in Figure 3b, the adjusted vrste values are generally higher than those before adjustment, and the adjusted vrste values of the provinces are all greater than 0.9, which is at a higher level. Among them, 24 provinces have higher vrste values after adjustment, four provinces have lower vrste values after adjustment, and the vrste values before and after adjustment of three provinces, Zhejiang, Guangdong, and Anhui, are all one, which are all at the effective frontier. A comparison of vrste values before and after adjustment shows that the vrste values of most provinces will be underestimated if the influence of environmental elements is not excluded. As shown in Figure 3c, the scale values of all provinces are close to one before adjustment. After the adjustment, only Zhejiang and Guangdong scale values remain unchanged and reach the effective frontier, Jiangsu and Shandong scale values increase, and the remaining provinces’ scale values decrease. Among them, the adjusted scale values of Tibet, Qinghai, Hainan, Ningxia, Xinjiang, and Gansu decrease rapidly, and the difference between the pre- and post-adjustment values is greater than 0.7, which is 0.9899, 0.8999, 0.8624, 0.771, 0.7075, and 0.7063, respectively. It demonstrates how stochastic disturbances and environmental elements greatly affect scale, and that future resource allocation should be greatly expanded.
- (4)
- Taking 2013 and 2022 as the time nodes, we use the natural break point method to categorize the GTIE of Chinese industrial firms and their decomposition efficiency into five grades: low, sub-low, medium, sub-high, and high. ArcGIS 10.8 software was used to map the spatial and temporal evolution of GTIE of Chinese industrial firms, excluding environmental and stochastic disturbances, as depicted in Figure 4.
4.4. Spatial Metrics Analysis
4.4.1. Spatial Correlation Test
4.4.2. Spatial Durbin Regression Analysis
4.4.3. Spatial Impact Effects Analysis
5. Results and Discussion
5.1. Results
5.2. Recommendations
5.3. Study Limitations and Future Perspectives
Author Contributions
Funding
Institutional Review Board Statement
Informed Consent Statement
Data Availability Statement
Conflicts of Interest
References
- Wang, Q.; Ren, S. Evaluation of green technology innovation efficiency in a regional context: A dynamic network slacks-based measuring approach. Technol. Forecast. Soc. Change 2022, 182, 121836. [Google Scholar]
- Lin, S.; Lin, R.; Sun, J.; Wang, F.; Wu, W. Dynamically evaluating technological innovation efficiency of high-tech industry in China: Provincial, regional and industrial perspective. Socio-Econ. Plan. Sci. 2021, 74, 100939. [Google Scholar]
- Zhu, L.; Luo, J.; Dong, Q.; Zhao, Y.; Wang, Y.; Wang, Y. Green technology innovation efficiency of energy-intensive industries in China from the perspective of shared resources: Dynamic change and improvement path. Technol. Forecast. Soc. Chang. 2021, 170, 120890. [Google Scholar]
- Zheng, Z.; Han, X.; Xiao, Y. Quantity or quality? Regional innovation policy and green technology innovation. Environ. Sci. Pollut. Res. 2023, 30, 77358–77370. [Google Scholar]
- Song, D.; Li, C.; Li, X. Does the construction of new infrastructure promote the quantity and quality of green technological innovation evidence from the national smart city pilot. China Popul. Resour. Environ. 2021, 31, 155–164. [Google Scholar]
- Huang, X.; Liu, W.; Zhang, Z.; Zou, X.; Li, P. Quantity or quality: Environmental legislation and corporate green innovations. Ecol. Econ. 2023, 204, 107684. [Google Scholar]
- Du, K.; Cheng, Y.; Yao, X. Environmental regulation, green technology innovation, and industrial structure upgrading: The road to the green transformation of Chinese cities. Energy Econ. 2021, 98, 105247. [Google Scholar]
- Hu, D.; Jiao, J.; Tang, Y.; Han, X.; Sun, H. The effect of global value chain position on green technology innovation efficiency: From the perspective of environmental regulation. Ecol. Indic. 2021, 121, 107195. [Google Scholar]
- Braun, E.; Wield, D. Regulation as a means for the social control of technology. Technol. Anal. Strateg. Manag. 1994, 6, 259–272. [Google Scholar]
- Fernando, Y.; Jabbour, C.J.C.; Wah, W.X. Pursuing green growth in technology firms through the connections between environmental innovation and sustainable business performance: Does service capability matter? Resour. Conserv. Recycl. 2019, 141, 8–20. [Google Scholar]
- Tong, X. The Relevance of Clusters for “Green” Innovation: A Case Study of the Diffusion of Lead-Free Soldering in Electronics Industry in China. China Popul. Resour. Environ. 2007, 17, 66–71. [Google Scholar]
- Zeng, H.; Liu, S.; Li, J. Research on the Relationship Between Multi-driven Green Innovation and Corporate Performance. J. Ind. Technol. Econ. 2020, 39, 13–22. [Google Scholar]
- Zhang, Q.; Yan, F.; Li, K.; Ai, H. Impact of market misallocations on green TFP: Evidence from countries along the Belt and Road. Environ. Sci. Pollut. Res. 2019, 26, 35034–35048. [Google Scholar] [CrossRef] [PubMed]
- Chen, C.; Gao, B. Component decomposition and regional characteristics of Chinese TFP change: 2001–2014. J. Cent. S. Univ. (Soc. Sci.) 2019, 25, 83–90. [Google Scholar]
- Liu, C.; Gao, X.; Ma, W.; Chen, X. Research on regional differences and influencing factors of green technology innovation efficiency of China’s high-tech industry. J. Comput. Appl. Math. 2020, 369, 112597. [Google Scholar]
- Zhang, J.; You, O.; Ballesteros-Pérez, P.; Li, H.; Philbin, S.P.; Li, Z.; Skitmore, M. Understanding the impact of environmental regulations on green technology innovation efficiency in the construction industry. Sustain. Cities Soc. 2021, 65, 102647. [Google Scholar]
- Liu, P.; Huang, T.; Shao, Y.; Jia, B. Environmental regulation, technology density, and green technology innovation efficiency. Heliyon 2024, 10, e23809. [Google Scholar] [CrossRef]
- Liu, H.; Yang, G.; Liu, X.; Song, Y. R&D performance assessment of industrial enterprises in China: A two-stage DEA approach. Socio-Econ. Plan. Sci. 2020, 71, 100753. [Google Scholar]
- Wang, Q.; Hang, Y.; Sun, L.; Zhao, Z. Two-stage innovation efficiency of new energy enterprises in China: A non-radial DEA approach. Technol. Forecast. Soc. Change 2016, 112, 254–261. [Google Scholar] [CrossRef]
- Wu, Y.; Hou, L.; Yuan, Y.; Ma, S.; Zeng, H. Green credit policy’s influence on construction firm ESG performance: A difference in differences estimation. J. Asian Archit. Build. Eng. 2025, 1–13. [Google Scholar] [CrossRef]
- Qin, Y.; Zhang, P.; Deng, X.; Liao, G. Innovation efficiency evaluation of industrial technology research institute based on three-stage DEA. Expert Syst. Appl. 2023, 224, 120004. [Google Scholar]
- Zhong, M.; Huang, G.; He, R. The technological innovation efficiency of China’s lithium-ion battery listed enterprises: Evidence from a three-stage DEA model and micro-data. Energy 2022, 246, 123331. [Google Scholar]
- Fu, Y.; Supriyadi, A.; Wang, T.; Wang, L.; Cirella, G.T. Effects of regional innovation capability on the green technology efficiency of China’s manufacturing industry: Evidence from listed companies. Energies 2020, 13, 5467. [Google Scholar] [CrossRef]
- Wang, H.; Liu, H. Foreign direct investment, environmental regulation, and environmental pollution: An empirical study based on threshold effects for different Chinese regions. Environ. Sci. Pollut. Res. 2019, 26, 5394–5409. [Google Scholar]
- Li, D.; Zeng, T. Are China’s intensive pollution industries greening? An analysis based on green innovation efficiency. J. Clean. Prod. 2020, 259, 120901. [Google Scholar] [CrossRef]
- Fan, F.; Lian, H.; Liu, X.; Wang, X. Can environmental regulation promote urban green innovation Efficiency? An empirical study based on Chinese cities. J. Clean. Prod. 2021, 287, 125060. [Google Scholar] [CrossRef]
- Chen, L.; Wang, N.; Li, Q.; Zhou, W. Environmental regulation, foreign direct investment and China’s economic development under the new normal: Restrain or promote? Environ. Dev. Sustain. 2023, 25, 4195–4216. [Google Scholar]
- Li, T.; Liang, L.; Han, D. Research on the efficiency of green technology innovation in China’s provincial high-end manufacturing industry based on the RAGA-PP-SFA model. Math. Probl. Eng. 2018, 2018, 9463707. [Google Scholar]
- Wen, L.; Ma, S.; Zhao, G.; Liu, H. The Impact of Environmental Regulation on the Regional Cross-Border E-Commerce Green Innovation: Based on System GMM and Threshold Effects Modeling. Pol. J. Environ. Stud. 2024, 34, 1347–1362. [Google Scholar] [CrossRef]
- Zhang, J.; Liang, X.; Chen, Y. Green technology innovation efficiency in China: A spatial Durbin model analysis. Environ. Sci. Pollut. Res. 2021, 28, 18945–18958. [Google Scholar]
- Fang, Z.; Razzaq, A.; Mohsin, M.; Irfan, M. Spatial spillovers and threshold effects of internet development and entrepreneurship on green innovation efficiency in China. Technol. Soc. 2022, 68, 101844. [Google Scholar] [CrossRef]
- Zhao, P.; Lu, Z.; Kou, J.; Du, J. Regional differences and convergence of green innovation efficiency in China. J. Environ. Manag. 2023, 325, 116618. [Google Scholar] [CrossRef]
- Chen, L.; Xie, X.; Tao, S. An improved slack based measure model for evaluating green innovation efficiency based on asymmetric data. Symmetry 2024, 16, 429. [Google Scholar] [CrossRef]
- Wang, K.; Xu, R.; Cheng, Y.; Miao, Z.; Sun, H. Understanding the overall difference, distribution dynamics and convergence trends of green innovation efficiency in China’s eight urban agglomerations. Ecol. Indic. 2023, 148, 110101. [Google Scholar] [CrossRef]
- Han, B.; Feng, X.; Su, Y.; Liang, D. Innovation efficiency measurements and influencing factors of Chinese new energy vehicle listed enterprises: An analysis based on three-stage DEA and Tobit panel model. Sci. Technol. Prog. Policy 2023, 40, 110–120. [Google Scholar]
- Fried, H.O.; Lovell, C.A.K.; Schmidt, S.S.; Yaisawarng, S. Accounting for environmental effects and statistical noise in data envelopment analysis. J. Prod. Anal. 2002, 17, 157–174. [Google Scholar] [CrossRef]
- Xu, L.; Yang, Z.; Chen, J.; Zou, Z.; Wang, Y. Spatial-temporal evolution characteristics and spillover effects of carbon emissions from shipping trade in EU coastal countries. Ocean Coast. Manag. 2024, 250, 107029. [Google Scholar] [CrossRef]
- Li, H.; Lin, S. Do environmental regulations affect industrial efficiency? A three-stage DEA analysis of China’s regional industrial sector. J. Clean. Prod. 2019, 238, 117893. [Google Scholar]
- Zeng, H.; Abedin, M.Z.; Lucey, B.; Ma, S. Tail risk contagion and multiscale spillovers in the green finance index and large US technology stocks. Int. Rev. Financ. Anal. 2024, 97, 103865. [Google Scholar] [CrossRef]
- Wen, L.; Ma, S.; Lyu, S. The influence of internet celebrity anchors’ reputation on consumers’ purchase intention in the context of digital economy: From the perspective of consumers’ initial trust. Appl. Econ. 2024, 56, 9189–9210. [Google Scholar] [CrossRef]
- Wu, Y.; Zeng, H.; Hao, N.; Ma, S. The impact of economic policy uncertainty on the domestic value added rate of construction enterprise exports—Evidence from China. J. Asian Archit. Build. Eng. 2025, 1–15. [Google Scholar] [CrossRef]
- Wang, Z.; Ma, S. Research on the impact of digital inclusive finance development on carbon emissions—Based on the double fixed effects model. Glob. NEST J. 2024, 26, 06227. [Google Scholar]
- Zou, F.; Ma, S.; Liu, H.; Gao, T.; Li, W. Do Technological Innovation and Environmental Regulation Reduce Carbon Dioxide Emissions? Evidence from China. Glob. NEST J. 2024, 26, 06291. [Google Scholar]
- Li, Y.; Cong, R.; Zhang, K.; Ma, S.; Fu, C. Four-way game analysis of transformation and upgrading of manufacturing enterprises relying on industrial internet platform under developers’ participation. J. Asian Archit. Build. Eng. 2024, 1–22. [Google Scholar] [CrossRef]


| Variable Type | Variable Name | Variable Symbols | Description of Variables | Unit (of Measure) |
|---|---|---|---|---|
| Input variable | Staffing inputs | I1 | R&D staff full-time equivalent | man-year |
| capital investment | I2 | Internal investment in R&D funds | billions | |
| I3 | Expenses for new product advancement | billions | ||
| Asset investment | I4 | Total business assets | billions | |
| Output variables | Scientific and technical outputs | O1 | Number of green patent applications | piece |
| O2 | Number of effective green invention patents | piece | ||
| Economic output | O3 | Number of new product advancement projects | term | |
| O4 | Revenue from sales of new products | billions | ||
| Environment variable | Level of economic development | pgdp | GDP per capita | Yuan/person |
| Industrialization level | ind | Industrial value added/regional GDP | % | |
| Egypt’s open-door policy towards the outside world | open | Total exports and imports/regional GDP | % | |
| Government support | gov | Government funded R&D expense/regional R&D expense | % | |
| Information infrastructure | int | Internet penetration | % |
| O1 | O2 | O3 | O4 | I1 | I2 | I3 | I4 | |
| O1 | 1 | |||||||
| O2 | 0.951 *** | 1 | ||||||
| O3 | 0.964 *** | 0.881 *** | 1 | |||||
| O4 | 0.966 *** | 0.883 *** | 0.961 *** | 1 | ||||
| I1 | 0.954 *** | 0.847 *** | 0.941 *** | 0.972 *** | 1 | |||
| I2 | 0.941 *** | 0.868 *** | 0.920 *** | 0.975 *** | 0.965 *** | 1 | ||
| I3 | 0.982 *** | 0.940 *** | 0.951 *** | 0.980 *** | 0.957 *** | 0.975 *** | 1 | |
| I4 | 0.877 *** | 0.802 *** | 0.868 *** | 0.921 *** | 0.918 *** | 0.952 *** | 0.918 *** | 1 |
| Area | Province | 2013 | 2016 | 2019 | 2022 | Average | |||||
|---|---|---|---|---|---|---|---|---|---|---|---|
| Pre-Adjustment | Adjusted | Pre-Adjustment | Adjusted | Pre-Adjustment | Adjusted | Pre-Adjustment | Adjusted | Pre-Adjustment | Adjusted | ||
| East area | Beijing | 1.000 | 0.887 | 1.000 | 0.758 | 1.000 | 0.857 | 1.000 | 1.000 | 0.999 | 0.844 |
| Tianjin | 1.000 | 1.000 | 1.000 | 0.941 | 1.000 | 0.827 | 1.000 | 0.814 | 0.967 | 0.876 | |
| Anhui | 0.723 | 0.679 | 0.647 | 0.666 | 0.761 | 0.728 | 0.877 | 0.787 | 0.749 | 0.713 | |
| Shanghai | 1.000 | 1.000 | 1.000 | 0.719 | 1.000 | 0.762 | 0.951 | 0.805 | 0.995 | 0.812 | |
| Jiangsu | 0.978 | 1.000 | 0.902 | 1.000 | 0.799 | 1.000 | 0.901 | 1.000 | 0.897 | 1.000 | |
| Zhejiang | 1.000 | 1.000 | 1.000 | 1.000 | 1.000 | 1.000 | 1.000 | 1.000 | 1.000 | 1.000 | |
| Fujian | 0.766 | 0.732 | 0.728 | 0.901 | 0.723 | 0.802 | 0.775 | 0.876 | 0.756 | 0.830 | |
| Shandong | 0.809 | 1.000 | 0.707 | 0.920 | 0.651 | 0.757 | 1.000 | 1.000 | 0.764 | 0.916 | |
| Guangdong | 1.000 | 1.000 | 1.000 | 1.000 | 1.000 | 1.000 | 1.000 | 1.000 | 1.000 | 1.000 | |
| Hainan | 1.000 | 0.097 | 1.000 | 0.133 | 1.000 | 0.117 | 1.000 | 0.202 | 1.000 | 0.137 | |
| average | 0.928 | 0.840 | 0.898 | 0.804 | 0.893 | 0.785 | 0.950 | 0.848 | 0.913 | 0.813 | |
| Central area | Shanxi | 0.487 | 0.379 | 0.432 | 0.324 | 0.888 | 0.572 | 0.924 | 0.619 | 0.692 | 0.462 |
| Anhui | 1.000 | 1.000 | 1.000 | 1.000 | 1.000 | 1.000 | 1.000 | 1.000 | 1.000 | 1.000 | |
| Jiangxi | 0.703 | 0.480 | 0.896 | 0.536 | 1.000 | 0.765 | 1.000 | 0.849 | 0.928 | 0.658 | |
| Henan | 0.628 | 0.634 | 0.802 | 1.000 | 0.874 | 0.860 | 0.861 | 0.900 | 0.811 | 0.865 | |
| Hubei | 0.698 | 0.794 | 0.736 | 0.813 | 1.000 | 0.872 | 0.970 | 0.925 | 0.826 | 0.836 | |
| Hunan | 1.000 | 0.982 | 1.000 | 0.997 | 0.925 | 0.792 | 1.000 | 0.783 | 0.982 | 0.892 | |
| average | 0.753 | 0.712 | 0.811 | 0.778 | 0.948 | 0.810 | 0.959 | 0.846 | 0.873 | 0.785 | |
| West area | Inner Mongolia | 0.448 | 0.280 | 0.394 | 0.282 | 0.595 | 0.382 | 0.811 | 0.475 | 0.581 | 0.349 |
| Guangxi | 0.738 | 0.471 | 0.808 | 0.501 | 1.000 | 0.470 | 1.000 | 0.572 | 0.909 | 0.520 | |
| Chongqing | 1.000 | 0.745 | 1.000 | 0.852 | 0.809 | 0.629 | 0.942 | 0.724 | 0.957 | 0.736 | |
| Sichuan | 1.000 | 0.989 | 0.827 | 0.792 | 0.972 | 0.794 | 0.918 | 0.857 | 0.938 | 0.851 | |
| Guizhou | 0.765 | 0.294 | 0.946 | 0.356 | 0.956 | 0.426 | 0.906 | 0.503 | 0.909 | 0.394 | |
| Yunnan | 0.634 | 0.261 | 1.000 | 0.395 | 0.677 | 0.408 | 0.847 | 0.545 | 0.827 | 0.419 | |
| Tibet | 1.000 | 0.009 | 1.000 | 0.008 | 1.000 | 0.010 | 1.000 | 0.017 | 1.000 | 0.010 | |
| Shaanxi | 0.817 | 0.666 | 0.524 | 0.506 | 0.684 | 0.581 | 0.659 | 0.681 | 0.655 | 0.599 | |
| Gansu | 0.952 | 0.283 | 0.554 | 0.243 | 0.783 | 0.266 | 0.982 | 0.352 | 0.746 | 0.272 | |
| Qinghai | 0.599 | 0.030 | 0.354 | 0.034 | 0.885 | 0.083 | 0.993 | 0.133 | 0.746 | 0.073 | |
| Ningxia | 1.000 | 0.188 | 0.916 | 0.165 | 1.000 | 0.239 | 0.903 | 0.320 | 0.966 | 0.215 | |
| Xinjiang | 0.562 | 0.169 | 0.863 | 0.222 | 1.000 | 0.263 | 1.000 | 0.405 | 0.847 | 0.253 | |
| average | 0.793 | 0.365 | 0.766 | 0.363 | 0.863 | 0.379 | 0.913 | 0.465 | 0.840 | 0.391 | |
| Northeast area | Liaoning | 0.702 | 0.791 | 0.598 | 0.568 | 0.882 | 0.695 | 0.732 | 0.751 | 0.762 | 0.687 |
| Jilin | 1.000 | 0.819 | 0.946 | 0.544 | 0.763 | 0.395 | 1.000 | 0.630 | 0.962 | 0.620 | |
| Heilongjiang | 0.604 | 0.388 | 0.581 | 0.375 | 0.675 | 0.351 | 0.913 | 0.485 | 0.741 | 0.408 | |
| average | 0.769 | 0.666 | 0.708 | 0.496 | 0.773 | 0.480 | 0.882 | 0.622 | 0.822 | 0.572 | |
| Overall average | 0.826 | 0.617 | 0.813 | 0.603 | 0.883 | 0.608 | 0.932 | 0.681 | 0.869 | 0.625 | |
| Environment Variables | R&D Staff Full-Time Equivalent Slack Variable | R&D Staff Costs Internal Expense Slack Variables | New Product Advancement Expense Slack Variable | Enterprise Asset Total Slack Variables |
|---|---|---|---|---|
| pgdp | 0.143 *** | 0.000996 *** | 0.000691 *** | 0.049423 *** |
| (7.031) | (3.034) | (3.583) | (3.727) | |
| ind | 45,189.461 *** | 24.050 | 20.182 | 27,120.685 *** |
| (45,188.035) | (0.344) | (0.478) | (26,916.620) | |
| open | −12,871.431 *** | −59.371 ** | −36.419 ** | −12,408.272 *** |
| (−12,870.531) | (−2.141) | (−2.133) | (−11,591.177) | |
| gov | −7202.369 *** | 48.710 | 37.250 | −9669.647 *** |
| (−7202.280) | (0.348) | (0.455) | (−9630.417) | |
| int | −3410.786 *** | −81.535 | −69.687 * | 4758.096 *** |
| (−3410.684) | (−1.183) | −1.672 | (4756.231) | |
| _cons | −22,010.006 *** | −21.526 | −8.593 | −12,500.454 *** |
| (−22,007.086) | (−0.469) | (−0.308) | (−11,711.694) | |
| σ2 | 396,514,760 *** | 14,780.068 *** | 4852.250 *** | 161,887,270 *** |
| (396,514,760) | (1635.493) | (4.566) | (161,887,270) | |
| γ | 0.72 *** | 0.62 *** | 0.60 *** | 0.70 *** |
| (29.948) | (19.771) | (6.476) | (28.113) | |
| Log Function Values | −3342.547 | −1805.820 | −1639.876 | −3214.305 |
| LR One-sided Test | 145.638 *** | 104.557 *** | 67.355 *** | 128.002 *** |
| Year | (W1) | (W2) | (W3) | |||
|---|---|---|---|---|---|---|
| Moran’s I | Geary’s c | Moran’s I | Geary’s c | Moran’s I | Geary’s c | |
| 2013 | −0.094 *** | 1.071 *** | 0.289 *** | 0.646 *** | 0.118 ** | 0.864 ** |
| 2014 | −0.111 *** | 1.085 *** | 0.316 *** | 0.629 *** | 0.097 ** | 0.889 * |
| 2015 | −0.113 *** | 1.083 *** | 0.306 *** | 0.631 *** | 0.101 ** | 0.901 * |
| 2016 | −0.123 *** | 1.093 *** | 0.301 *** | 0.639 *** | 0.092 ** | 0.904 |
| 2017 | −0.132 *** | 1.104 *** | 0.327 *** | 0.603 *** | 0.072 * | 0.912 |
| 2018 | −0.129 *** | 1.102 *** | 0.324 *** | 0.594 *** | 0.048 | 0.957 |
| 2019 | −0.131 *** | 1.107 *** | 0.371 *** | 0.565 *** | 0.100 ** | 0.899 * |
| 2020 | −0.126 *** | 1.105 *** | 0.324 *** | 0.596 *** | 0.084 ** | 0.909 |
| 2021 | −0.128 *** | 1.105 *** | 0.334 *** | 0.586 *** | 0.085 ** | 0.909 |
| 2022 | −0.128 *** | 1.106 *** | 0.334 *** | 0.582 *** | 0.090 ** | 0.914 |
| Variables | OLS | W1 | W2 | W3 | |||||||||
|---|---|---|---|---|---|---|---|---|---|---|---|---|---|
| SEM | SAR | SDM | SEM | SAR | SDM | SEM | SAR | SDM | |||||
| pgdp | 2.85 × 10⁻⁶ *** | 4.94 × 10⁻⁷ | 1.37 × 10⁻⁷ | 1.77 × 10⁻⁶ ** | −9.44 × 10⁻⁷ * | −2.54 × 10⁻⁷ | −6.57 × 10⁻⁸ | −2.12 × 10⁻⁹ | −7.66 × 10⁻⁸ | 1.13 × 10⁻⁶ * | |||
| (7.09 × 10⁻⁷) | (6.46 × 10⁻⁷) | (5.57 × 10⁻⁷) | (7.59 × 10⁻⁷) | (5.62 × 10⁻⁷) | (5.82 × 10⁻⁷) | (6.02 × 10⁻⁷) | (5.73 × 10⁻⁷) | (5.7 × 10⁻⁷) | (6.25 × 10⁻⁷) | ||||
| ind | 1.607 *** | 0.728 *** | 0.713 *** | 0.643 *** | 0.856 *** | 0.799 *** | 0.778 *** | 0.772 *** | 0.776 *** | 0.754 *** | |||
| (0.129) | (0.140) | (0.133) | (0.151) | (0.132) | (0.136) | (0.129) | (0.136) | (0.135) | (0.138) | ||||
| open | 0.282 *** | 0.199 *** | 0.180 *** | 0.249 *** | 0.231 *** | 0.197 *** | 0.287 *** | 0.193 *** | 0.192 *** | 0.192 *** | |||
| (0.0594) | (0.0716) | (0.0673) | (0.0835) | (0.0679) | (0.0692) | (0.0684) | (0.0690) | (0.0694) | (0.0716) | ||||
| gov | −0.467 * | 0.183 | 0.183 | 0.114 | 0.259 * | 0.220 | 0.191 | 0.192 | 0.193 | 0.270 * | |||
| (0.268) | (0.142) | (0.139) | (0.142) | (0.146) | (0.143) | (0.142) | (0.144) | (0.144) | (0.146) | ||||
| int | 0.289 ** | 0.255 *** | 0.207 ** | 0.399 *** | 0.121 | 0.189 ** | 0.0972 | 0.230 ** | 0.208 ** | 0.281 ** | |||
| (0.146) | (0.0989) | (0.0907) | (0.117) | (0.0933) | (0.0930) | (0.0918) | (0.0986) | (0.0943) | (0.110) | ||||
| W × pgdp | 1.71 × 10⁻⁵ ** | −3.77 × 10⁻⁶ *** | 3.62 × 10⁻⁶ | ||||||||||
| (6.07 × 10⁻⁶) | (1.02 × 10⁻⁶) | (2.39 × 10⁻⁶) | |||||||||||
| W × ind | −0.735 | 0.622 ** | −0.199 | ||||||||||
| (1.492) | (0.286) | (0.531) | |||||||||||
| W × open | −0.528 | 0.338 ** | 0.161 | ||||||||||
| (0.975) | (0.146) | (0.259) | |||||||||||
| W × gov | −1.212 | 0.224 | −0.0564 | ||||||||||
| (2.006) | (0.282) | (0.716) | |||||||||||
| W × int | 3.374 *** | −0.504 ** | 1.479 *** | ||||||||||
| (1.271) | (0.244) | (0.361) | |||||||||||
| _cons | −0.294 *** | ||||||||||||
| (0.0886) | |||||||||||||
| ρ | −1.193 *** | −1.091 *** | −0.829 ** | −0.378 *** | −0.161 | −0.234 ** | −0.159 | −0.124 | −0.209 | ||||
| (0.412) | (0.380) | (0.379) | (0.123) | (0.104) | (0.109) | (0.141) | (0.135) | (0.137) | |||||
| σ2 | 0.00342 *** | 0.00344 *** | 0.00325 *** | 0.00348 *** | −0.161 | 0.00316 *** | 0.00363 *** | 0.00364 *** | 0.00340 *** | ||||
| (0.000285) | (0.000284) | (0.000266) | (0.000284) | (0.104) | (0.000255) | (0.000292) | (0.000293) | (0.000273) | |||||
| N | 310 | 310 | 310 | 310 | 310 | 310 | 310 | 310 | 310 | 310 | |||
| R2 | 0.537 | 0.504 | 0.564 | 0.094 | 0.352 | 0.447 | 0.100 | 0.486 | 0.480 | 0.345 | |||
| LM-error | 7.087 *** | 11.770 *** | 6.523 ** | ||||||||||
| RobustLM-error | 10.818 *** | 0.911 | 7.881 *** | ||||||||||
| LM-lag | 47.325 *** | 40.686 *** | 0.056 | ||||||||||
| RobustLM-lag | 51.055 *** | 29.827 *** | 1.414 | ||||||||||
| Hausman test | 23.93 *** | 157.50 *** | −7.07 | ||||||||||
| Wald test | 22.08 *** | 20.57 *** | 44.01 *** | 37.16 *** | 21.68 *** | 21.15 *** | |||||||
| LR test | 21.60 *** | 21.37 *** | 40.96 *** | 34.91 *** | 20.82 *** | 20.34 *** | |||||||
| Variables | W1 | W2 | W3 | |||
|---|---|---|---|---|---|---|
| Direct Effect | Indirect Effect | Direct Effect | Indirect Effect | Direct Effect | Indirect Effect | |
| pgdp | 1.48 × 10⁻⁶ ** | 9.59 × 10⁻⁶ ** | 8.96 × 10⁻⁸ | −3.17 × 10⁻⁶ *** | 1.08 × 10⁻⁶ * | 3.03 × 10⁻⁶ |
| (7.18 × 10⁻⁷) | (4.52 × 10⁻⁵) | (6.18 × 10⁻⁷) | (9.63 × 10⁻⁷) | (6.42 × 10⁻⁷) | (2.07 × 10⁻⁶) | |
| ind | 0.661 *** | −0.799 | 0.756 *** | 0.368 | 0.756 *** | −0.316 |
| (0.136) | (0.954) | (0.125) | (0.248) | (0.134) | (0.477) | |
| open | 0.271 *** | −0.410 | 0.283 *** | 0.228 * | 0.197 *** | 0.100 |
| (0.0728) | (0.569) | (0.0675) | (0.123) | (0.0694) | (0.225) | |
| gov | 0.134 | −0.684 | 0.181 | 0.170 | 0.270 * | −0.0518 |
| (0.137) | (1.185) | (0.136) | (0.228) | (0.138) | (0.597) | |
| int | 0.341 *** | 1.859 ** | 0.115 | −0.443 ** | 0.250 ** | 1.229 *** |
| (0.107) | (0.915) | (0.0919) | (0.211) | (0.108) | (0.317) | |
| N | 310 | 310 | 310 | 310 | 310 | 310 |
| R2 | 0.094 | 0.094 | 0.100 | 0.100 | 0.345 | 0.345 |
Disclaimer/Publisher’s Note: The statements, opinions and data contained in all publications are solely those of the individual author(s) and contributor(s) and not of MDPI and/or the editor(s). MDPI and/or the editor(s) disclaim responsibility for any injury to people or property resulting from any ideas, methods, instructions or products referred to in the content. |
© 2025 by the authors. Licensee MDPI, Basel, Switzerland. This article is an open access article distributed under the terms and conditions of the Creative Commons Attribution (CC BY) license (https://creativecommons.org/licenses/by/4.0/).
Share and Cite
Li, Y.; Yang, X.; Ma, S. The Efficiency Measurement and Spatial Spillover Effect of Green Technology Innovation in Chinese Industrial Enterprises. Sustainability 2025, 17, 3162. https://doi.org/10.3390/su17073162
Li Y, Yang X, Ma S. The Efficiency Measurement and Spatial Spillover Effect of Green Technology Innovation in Chinese Industrial Enterprises. Sustainability. 2025; 17(7):3162. https://doi.org/10.3390/su17073162
Chicago/Turabian StyleLi, Yanhua, Xiaolei Yang, and Shenglin Ma. 2025. "The Efficiency Measurement and Spatial Spillover Effect of Green Technology Innovation in Chinese Industrial Enterprises" Sustainability 17, no. 7: 3162. https://doi.org/10.3390/su17073162
APA StyleLi, Y., Yang, X., & Ma, S. (2025). The Efficiency Measurement and Spatial Spillover Effect of Green Technology Innovation in Chinese Industrial Enterprises. Sustainability, 17(7), 3162. https://doi.org/10.3390/su17073162