Article

A Dynamic Evolution and Spatiotemporal Convergence Analysis of the Coordinated Development Between New Quality Productive Forces and China’s Carbon Total Factor Productivity

School of Economics, Hebei GEO University, Shijiazhuang 050031, China
*
Author to whom correspondence should be addressed.
Sustainability 2025, 17(7), 3137; https://doi.org/10.3390/su17073137
Submission received: 25 February 2025 / Revised: 23 March 2025 / Accepted: 28 March 2025 / Published: 1 April 2025
(This article belongs to the Section Economic and Business Aspects of Sustainability)

Abstract

:
The core hallmark of new quality productive forces (NQPFs) is a substantial increase in total factor productivity. Developing NQPFs tailored to local conditions significantly promote green, low-carbon, and environmentally sustainable development. This paper selects 30 provinces and municipalities in China (excluding Hong Kong, Macao, Taiwan, and Tibet) as research samples. It employs the super-efficiency Slacks-Based Measure (SBM) model, coupling coordination degree analysis, kernel density estimation, Dagum Gini coefficient, and β-convergence analysis to measure and analyze the coupling coordination degree between NQPFs and carbon total factor productivity (CTFP). The results indicate that CTFP exhibits an upward trend overall. At the same time, the NQPFs show an initial increase, followed by a decline, with significant regional variations observed in both. There is notable regional heterogeneity in the coupling coordination degree between NQPFs and CTFP. The eastern region demonstrates the highest coupling coordination degree, followed by the central, western, and northeastern regions. The primary cause of this differential distribution is inter-regional disparities, particularly widening the gap between the eastern region and others. Further analysis reveals that, except for the eastern region, the dynamic evolution trend of coupling coordination nationwide and in other regions tends to converge. Regarding absolute β-convergence, the northeastern region converges the fastest, while the western region converges the slowest. Regarding conditional β-convergence, the convergence speeds in the central, western, and northeastern regions are consistent, but the convergence results remain unchanged. This study provides important theoretical support for achieving a balanced development of NQPFs and comprehensively enhancing CTFP, ensuring significant contributions to the sustainable development of a low-carbon economy.

1. Introduction

In March 2024, during the Second Session of the 14th National People’s Congress, new quality productive forces (NQPFs) were elevated to the level of a national strategy. It was noted that NQPFs, with an enhancement of total factor productivity as its core indicator, represents an inherent requirement and a crucial focus for driving high-quality development. Furthermore, it constitutes a powerful impetus for achieving low-carbon and green economic growth. New quality productive forces (NQPFs), as a complex form of productivity, are characterized primarily by their multidimensionality, dynamism, and synergy. The multidimensionality of NQPFs is manifested in their inclusion of not only traditional productivity factors (such as labor, capital, and technology) but also the deep integration of emerging elements like knowledge, information, and ecological resources, forming a complex system with multiple dimensions and layers. Secondly, NQPFs exhibit significant dynamism, with their constituent elements and their interrelationships continuously evolving alongside technological advancements, institutional changes, and environmental shifts, demonstrating nonlinearity, adaptability, and path dependency. Furthermore, the efficient integration and positive interaction among these elements, through the synergistic effects of technological innovation, organizational optimization, and resource allocation, highlight the synergy of NQPFs, driving the overall enhancement of the productivity system. This stage is both a critical period for ensuring China’s achievement of carbon peaking and a vital window for solidifying the sustainable development of a low-carbon economy. Achieving the “dual-carbon” goals and the sustainable development of a low-carbon economy are intrinsic requirements for implementing new development concepts, constructing a new development paradigm, and promoting high-quality development. Under the important guidance of Xi Jinping’s new thought on ecological civilization, the Chinese economy is advancing towards a green and low-carbon trajectory, fostering a solid green foundation for sustainable development. In July of the same year, at the Third Plenary Session of the 20th Central Committee, Xi Jinping further emphasized, “Green development is the foundation of high-quality development, and NQPF is inherently green productivity.” China has achieved remarkable results in developing NQPFs, exemplified by advancements in China’s high-speed rail, 5G technology, and new energy vehicles. These achievements facilitate the advancement of economic structure and inject new impetus into pollution reduction and carbon emission decrease, guaranteeing the sustainable development of a low-carbon economy. Currently, there is a close relationship between technological innovation capability and the sustainable development of a low-carbon economy. Statistics indicate that in the first half of 2024, China’s average monthly carbon emissions trading volume reached 3.6682 million tons, marking a year-on-year increase of 174.90%. Concurrently, the digital infrastructure of the national carbon market has become increasingly mature. Furthermore, with the power generation sector already included and high-emission enterprises soon to be incorporated into the carbon market, this provides a crucial avenue for achieving advancements in low-carbon technologies. Meanwhile, technological innovation continues to facilitate the green transformation of the energy structure, reducing the costs associated with developing and applying new energy technologies and promoting a decline in carbon emission intensity, which has given rise to numerous low-emission enterprises. However, we must remain acutely aware that China still faces challenges, including insufficient endogenous driving forces for green transformation and a structural composition dominated by energy-intensive and high-carbon emissions that are difficult to alter in the short term. Consequently, to achieve sustainable development in the low-carbon economy, it is imperative to develop NQPF vigorously, enhance China’s total carbon factor productivity, and narrow the interregional differences in green development, all of which underscore the significance of promoting green technological innovation.

2. Literature Review

2.1. Research Progress on NQPFs

In the new stage of development, with the thorough implementation of the new development paradigm and the joint construction of a new development pattern, technological innovation has become prevalent, and the development of the digital economy is driving the digital transformation of traditional productivity. Currently, research on new quality productive mainly focuses on two directions: characteristics and index measurement. Regarding its development characteristics, NQPFs are driven by technological innovation and grounded in Marxist productivity theory, representing a new type of productivity that achieves fundamental reforms in production methods and economic structures [1]. Compared to traditional productivity, labor—the most creative production factor—is the first to exhibit new forms. Modern technologies such as artificial intelligence and robotics have created a substitution effect with traditional labor, leading to a qualitative leap in productivity [2]. Secondly, the objects and materials of labor have also undergone corresponding changes that reflect the times. Digital technology, automated machinery, and other new material resources have been incorporated into production for NQPFs. However, issues such as insufficient investment in scientific and technological innovation, a weak industrial foundation, and an imperfect institutional environment are key areas that need to be tackled for the comprehensive formation of NQPFs [3]. Thus, scientific and technological innovation, coupled with green and low-carbon practices, are important concepts for the sustainable development of a low-carbon economy, value orientations, and practical guides for forming NQPFs [4,5]. The relationship between new quality productive forces and economic modernization as well as sustainable development is profound, yet its uniqueness lies in its deep integration of the dual objectives of technological innovation and green development. Economic modernization emphasizes upgrading industrial structures and technological advancement, while sustainable development focuses on resource conservation and environmental protection. NQPFs not only encompass the core elements of economic modernization, such as technological innovation and industrial transformation but also internalize the principles of sustainable development as their developmental goals, driving qualitative changes in productivity through green technologies and a low-carbon economy [6]. This fusion of dual objectives enables NQPFs to transcend the singular dimensions of traditional economic modernization and sustainable development in their theoretical framework, forming a more comprehensive and forward-looking theoretical system of productivity. Currently, the measurement of NQPF indicators primarily focuses on technological innovation and green development, although there are slight differences in measurement perspectives. Xie [7] considered productivity as a whole and categorized it into three types—technological, green, and digital productivity—integrating them to derive NQPF. In contrast, most scholars prefer to deconstruct and measure from the perspective of the three essential factors of productivity [8]. They select high-level talent as the new quality labor force and incorporate measurement indicators related to digital technology and green environmental protection into the new quality means and objects of labor, comprehensively fitting these to derive NQPF indicators [9,10]. New quality productive forces not only require a clear theoretical definition but also necessitate quantification through scientifically objective methods such as the entropy weight method, thereby providing theoretical support for a deeper understanding of the essence of NQPFs and their role in promoting economic and social development. This measurement approach not only reflects the uniqueness of NQPFs in terms of technological innovation and green development but also reveals their fundamental differences from traditional productivity through a quantitative analysis [11]. For instance, traditional productivity measurement often focuses on the input–output efficiency of labor and capital, whereas the measurement of NQPFs places greater emphasis on the comprehensive contributions of emerging factors such as technological innovation capabilities, the application of green technologies, and digitalization levels. This shift in measurement perspective not only enriches the theoretical connotation of productivity but also provides a new quantitative tool for the practice of economic modernization and sustainable development.

2.2. Research Progress of CTFP

While pursuing rapid economic development, it is imperative to prioritize the sustainable development of a low-carbon economy. China’s traditional economic growth pattern has been characterized by “three highs and one low”, neglecting the positive impact of ecological civilization construction on economic advancement [12]. However, recent scholarly research has shown that when enterprises adopt low-carbon production practices, there is significant enhancement in the green production benefits of industries; conversely, failure to do so can lead to a deceleration in economic growth [13,14]. Further studies indicate that the comprehensive implementation of carbon reduction measures can effectively influence corporate behavior, fostering green industrial transformation, with a more pronounced effect observed in non-mining cities [15,16]. This suggests that current carbon reduction efforts serve as the starting point in environmental governance and the foundation for enhancing production efficiency and promoting the sustainable development of a low-carbon economy. Zhu argues that incorporating carbon dioxide emissions as undesired outputs while considering labor, capital, and energy inputs alongside regional economic output can effectively measure the coordinated relationship between carbon emissions and economic growth, namely CTFP [17]. Therefore, the improvement of CTFP stems from increasing efficient outputs and reducing undesired outputs, that is, to reduce the intensity of carbon emission. Currently, industrial production remains the primary contributor to carbon emissions. However, its CTFP has been rising annually in recent years. This trend highlights low-carbon technological innovation as a significant driver of improvement, with a more substantial promoting effect on CTFP observed at higher levels of technological innovation [18,19], particularly in less developed regions. Conversely, developed regions face constraints from relatively low technological efficiency in significantly enhancing their CTFP [20,21]. The development of advanced technological productivity is crucial for improving enterprises’ CTFP. It is readily apparent that the development of advanced technological productivity is pivotal to enhancing enterprises’ CTFP. Furthermore, regions with high CTFP emphasize resource input efficiency, particularly the importance of environmental protection resources [22,23]. In this context, technological innovation plays a crucial role in both resource allocation efficiency and the development of new low-carbon energy sources, representing another significant aspect in achieving growth in CTFP [24,25]. Regarding measurement methodologies, the primary logic underlying the assessment of CTFP focuses on efficiency evaluation. Numerous scholars have employed models such as Data Envelopment Analysis (DEA), super-efficiency Slacks-Based Measure (SBM), and undesirable super-efficiency Epsilon-Based Measure (EBM). For comprehensive comparisons, the combination of directional distance functions based on the SBM model with the Global Malmquist–Luenberger (GML) index can account for redundancy issues and provide a more objective and comprehensive reflection of CTFP [26,27]. The principle of using the SBM model combined with the GML index to measure carbon total factor productivity lies in the ability of the SBM model to simultaneously account for the slack variables of inputs, desirable outputs, and undesirable outputs. This effectively addresses the limitations of traditional DEA models, which overlook undesirable outputs and slack issues, thereby enabling a more accurate assessment of efficiency. The GML index, by constructing a global production technology frontier, avoids the infeasibility problem associated with the traditional ML index and dynamically measures changes in carbon total factor productivity, including technological progress and improvements in technical efficiency. This approach not only comprehensively reflects resource utilization efficiency and environmental constraints but also provides a scientific basis for low-carbon economy policies. In extended research on total factor productivity, methods such as Difference-in-Differences (DID), convergence analysis, mediation effects, and kernel density estimation have also been widely applied [28,29,30]. As a comprehensive method for evaluating input–output efficiency, total factor productivity has become an effective tool for analyzing the production efficiency of the low-carbon economy in the context of the “dual-carbon” goals.

2.3. Research on the Coordinated Development of NQPFs and CTFP

Accelerating the formation of NQPFs injects new momentum into enhancing CTFP while ensuring a high level of CTFP, which provides stable support for the mature development of these NQPFs. The coordinated development between the two is crucial for breaking the current economic green and low-carbon transformation impasse. In his study on agricultural CTFP, Lin pointed out that the digital transformation of agricultural technology can enhance agricultural CTFP through various aspects such as scale operation, technological innovation, structural upgrading, and industrial agglomeration [31,32]. However, in regions with lower agricultural CTFP, the marginal utility of digital technology is relatively low. A similar pattern is observed in industrial production, albeit with a longer transformation cycle [33,34]. The promoting effect of digital technology becomes more pronounced in the later stages of industrial transformation. In contrast, the early stages emphasize green factors’ input and usage efficiency [35,36]. Thus, to fully leverage the benefits of NQPFs for the sustainable development of a low-carbon economy, it is indispensable to investigate the coordinated development between NQPFs and CTFP. Currently, in studying the degree of coordinated development among different systems, the academic community often employs the coupling coordination degree model for measurement. The coupling coordination degree is a quantitative indicator that measures the interaction and synergistic development between systems or among elements within a system. Its core lies in evaluating the compatibility and synergy of various elements during the dynamic evolution of a system [37]. Coordinated development emphasizes the sustainable and balanced state achieved through positive interactions among subsystems or elements during the overall evolution of a system. The coupling coordination degree can represent the level of coordinated development because it quantifies the degree of synergy between systems or among internal elements through mathematical models, reflecting the system’s performance in resource allocation, functional complementarity, and dynamic balance. Therefore, the coupling coordination degree is not only a quantitative expression of coordinated development but also an essential tool for assessing and optimizing the level of coordinated development within systems.
In summary, to achieve sustainable development in a low-carbon economy, it is important to ensure complementary and coordinated development between NQPFs and CTFP. However, a significant imbalance exists in the regional development of CTFP, with most provinces still unable to fully unleash the effectiveness of NQPFs. Therefore, the comparative analysis from the perspective of time and space is more conducive to obtaining the evolution trend of coupling coordination degree between the two systems and analyzing the causes of the difference. Throughout the literature, there is no relevant research on the coordinated development relationship between NQPFs and CTFP with the help of the coupling coordination degree model. There are even fewer from the dual perspectives of spatial and temporal evolution. Therefore, this paper combines the directional distance function of the super-efficiency Slacks-Based Measure (SBM) model and the Global Malmquist–Luenberger (GML) index to calculate CTFP. The entropy weight method is utilized to comprehensively measure NQPFs across three dimensions: new quality laborers, new quality means of labor, and new quality objects of labor. By employing the coupling coordination degree model, the coordinated development relationship between NQPFs and carbon total factor productivity is measured. Additionally, the kernel density estimation method is applied to conduct a dynamic evolution analysis of its overall trend from a temporal perspective. Spatial differences are analyzed using the Dagum Gini coefficient and a β-convergence analysis. Finally, relevant suggestions are proposed regarding the causes of these differences and ways to mitigate them. They provide a theoretical basis for achieving coordinated development between NQPFs and CTFP.

3. Materials and Methods

3.1. The Selection of an Index System

3.1.1. Selection of CTFP Index

This paper uses the Slacks-Based Measure (SBM) directional distance function and the Luenberger analysis method to measure CTFP using capital, labor, and energy as input indicators [38]. Capital input is reflected by each province’s annual fixed capital stock, which is processed using the perpetual inventory method [39,40]. Labor input is represented by the total population of each province, considering that carbon emissions are related to production and consumption activities [41]. The total energy consumption of each province reflects energy input. The output indicators include desired and undesired outputs. The GDP of each province represents the desired output [42]. In contrast, the undesired output is reflected by carbon dioxide emissions, which are measured using the Intergovernmental Panel on Climate Change (IPCC) method [43,44]. Data sources include the China Statistical Yearbook, China Energy Yearbook, and the China Economic Information Network Database.

3.1.2. Selection of NQPF Index

Based on the mainstream measurement approaches in the current academic field, this paper comprehensively constructs indicators of NQPF from three perspectives: new quality labor, new quality means of production, and new quality objects. Within the indicators for new quality means of production and new quality objects of production, digital technology, and green environmental protection indicators are integrated. The entropy weight-TOPSIS method is employed to measure each province’s NQPF. Specifically, the measurement of industrial robot penetration follows the approach of Chen et al. [45], utilizing the installation volumes of industrial robots in various industries in China published by the IRF Alliance [46]. The degree of digital economy development is rated based on the two significant systems of internet development and digital inclusive finance [47,48]. The construction of the NQPF indicator system is presented in Table 1.

3.2. Model Construction

3.2.1. SBM Model Construction

Drawing on Fukuyama’s ideas, we combine the traditional Slacks-Based Measure (SBM) method with the directional distance function to establish a non-angular, non-radial SBM directional distance function. This approach considers inputs and outputs and enables an in-depth analysis of inefficiency contributions [49]. We construct the frontier using 30 provinces as Decision-Making Units (DMUs), where each production unit has P types of inputs ( x ), M types of desirable outputs ( y ), and N types of undesirable outputs ( b ). The SBM directional distance function for the   i   th province is formulated as Equation (1):
I E t ( x , y , b , g x , g y , g b ) = max 1 P m = 1 P s p x / g x + 1 M + N ( r = 1 M s m y / g y + t = 1 N s n b / g b ) 2                          s . t . n = 1 K x p k t λ k t + s p x = x k p t ; n = 1 K y m k t λ k t s m y = y k m t ; n = 1 K b n k t λ k t + s n b = b k n t ; n = 1 K λ k t = 1 , λ k t 0 , s p x 0 , s m y 0 , s n b 0 , p , m , n , k
Here, ( S p x , S m y , S n b ) represents the slack variables for inputs and outputs, and ( g x , g y , g b ) denotes the directional vectors for inputs and outputs. In the constraint conditions, K is the number of DMUs, with a total of 30 DMUs in this study. ( x p k t , y m k t , b p k t ) indicates the quantity of the p -th input, the m -th desirable output, and the n -th undesirable output for the k -th DMU in the t -th period. λ k t is the weight coefficient for the k -th DMU in the t -th period, used to construct the production frontier. The inefficiency value I E t obtained using Equation (1) is then used to calculate the efficiency value E t , as shown in Equation (2):
E t = 1 I E t = 1 I E t ( x , y , b , g x , g y , g b )
Compared to the adjacent benchmarked Malmquist–Luenberger (ML) index, the global benchmarked Generalized Malmquist–Luenberger (GML) index exhibits a more cyclical advantage in capturing multi-period efficiency growth dynamics. Based on the aforementioned SBM function, the GML index is derived, which can be decomposed into the technological efficiency change index (GEC) and technological change index (GTC). Furthermore, GEC can be further decomposed into the pure technological efficiency change index (GPEC) and the scale efficiency change index (GSEC). The specific calculation formulas are as follows:
G M L t t + 1 = 1 I E t ( x t , y t , b t ; g x , g y , g b ) 1 I E t ( x t , y t , b t ; g x , g y , g b ) = G E C t t + 1 G T C t t + 1
Here, G M L t t + 1 represents the GML index, which indicates the change in efficiency from period t to period t + 1 . If the GML index is greater than 1, it signifies an increasing trend in total factor carbon productivity; if it is less than 1, it indicates a decreasing trend, and if it equals 1, it suggests a long-term steady state. 1 I E t ( x t , y t , b t ; g x , g y , g b ) denotes the directional distance function value for period t , measuring the degree of inefficiency in period t . A smaller directional distance function value indicates higher efficiency.

3.2.2. Entropy Weight Method

The entropy weight method is based on the principle of information entropy, which objectively calculates weights by analyzing the dispersion degree of each indicator’s data. This approach avoids the bias introduced by subjective judgment in traditional weighting methods, ensuring the objectivity and fairness of weight allocation. Additionally, the entropy weight method fully utilizes the intrinsic information of the indicator data, allowing for dynamic adjustment of weights based on the distribution characteristics of the data, thereby more accurately reflecting the importance of each indicator within the system. The calculation steps are as follows:
Step 1: Calculate the proportion p i j of each indicator λ i j within the three major elements of NQPF, where m represents the number of provinces or cities, as shown in Equation (4).
p i j = λ i j i = 1 m λ i j
Step 2: Calculate the information entropy e j of each indicator λ i j , where 0 e j 1 , as shown in Equation (5).
e j = 1 ln m i = 1 m p i j ln p i j
Step 3: Calculate the comprehensive weight ω j , where n is the number of evaluation indicators, as shown in Equation (6).
ω j = 1 e j j = 1 n ( 1 e j )
Using Equation (7), evaluate the new quality productive force index U based on the entropy weights of each indicator.
U = i = 0 n ω j λ i j

3.2.3. Dagum Gini Coefficient Decomposition

Leveraging the Gini coefficient’s characteristic of representing balance, the Dagum Gini coefficient decomposition method can decompose the degree of coupling coordination disparities between regional NQPFs and CTFP. This analysis examines the contribution degrees from three perspectives—intra-regional disparities ( G w ), inter-regional disparities ( G n b ), and trans variation density ( G t )—thereby identifying the leading causes of these disparities. The relationship among these three components satisfies G = G w + G n b + G t , as defined in Equation (8).
G = j = 1 k h = 1 k i = 1 n j r = 1 n h y j i y h r / 2 n 2 y ̄
In this context, y j i ( y h r ) represents the coupling coordination degree of any region within j ( h ) China’s four major regions, y ¯ denotes the average coupling coordination degree across regions, n is the total number of provinces and municipalities, k is the number of divided regions, and n j ( n h ) is the number of j ( h ) regions within an area.

3.2.4. Calculation of Coupling Coordination Degree and Spatio-Temporal Evolution Model

Using the coupling coordination degree model, Equation (9) measures the coupling degree ( C ) between NQPFs and CTFP. A higher value of C indicates a lower degree of dispersion between systems and stronger interactions, whereas a lower value suggests less pronounced interactions. U x represents the evaluation index of NQPFs, and U y represents the evaluation index of CTFP. The general expression for the coupling degree model is shown in Equation (9).
C = 2 × U x × U y U x + U y
Let T denote the comprehensive coordination index for “NQPFs and CTFP,” with α and β being undetermined parameters representing the respective importance of the two subsystems in coordinated development, satisfying the condition α + β = 1 . This paper assumes that NQPFs and CTFP are equally important. Thus, α and β ’s probable values are set at 0.5.
T = α U x + β U y
Let D represent the coupling coordination degree between “NQPFs and CTFP” calculated using Equation (11). Existing research [50] for the classification of coupling coordination degrees is cited (Table 2).
D = C T = 2 × U x × U y U x + U y ( α U x + β U y )
Kernel density estimation (KDE) is a non-parametric statistical method used to estimate the probability density function of a random variable. It reveals the overall trends and characteristics of data by smoothing the distribution of data points. In this paper, kernel density estimation is employed to describe the spatiotemporal evolution trends of the coupling coordination degree between NQPFs and CTFP. The calculation process of kernel density estimation is as follows, as shown in Equation (12):
f ^ ( x ) = 1 n h i = 1 n K x X i h
Here, f ^ ( x ) represents the kernel density estimate at point x , which is the probability density of the coupling coordination degree. n is the number of observed samples, and h is the bandwidth, controlling the smoothness of the kernel function. X i denotes the i -th observed value of the coupling coordination degree, and K is the kernel function used to smooth the distribution of data points. A commonly used kernel function is the Gaussian kernel function, as shown in Equation (13), where u is defined as x X i h .
K ( u ) = 1 2 π e 1 2 u 2

4. Results

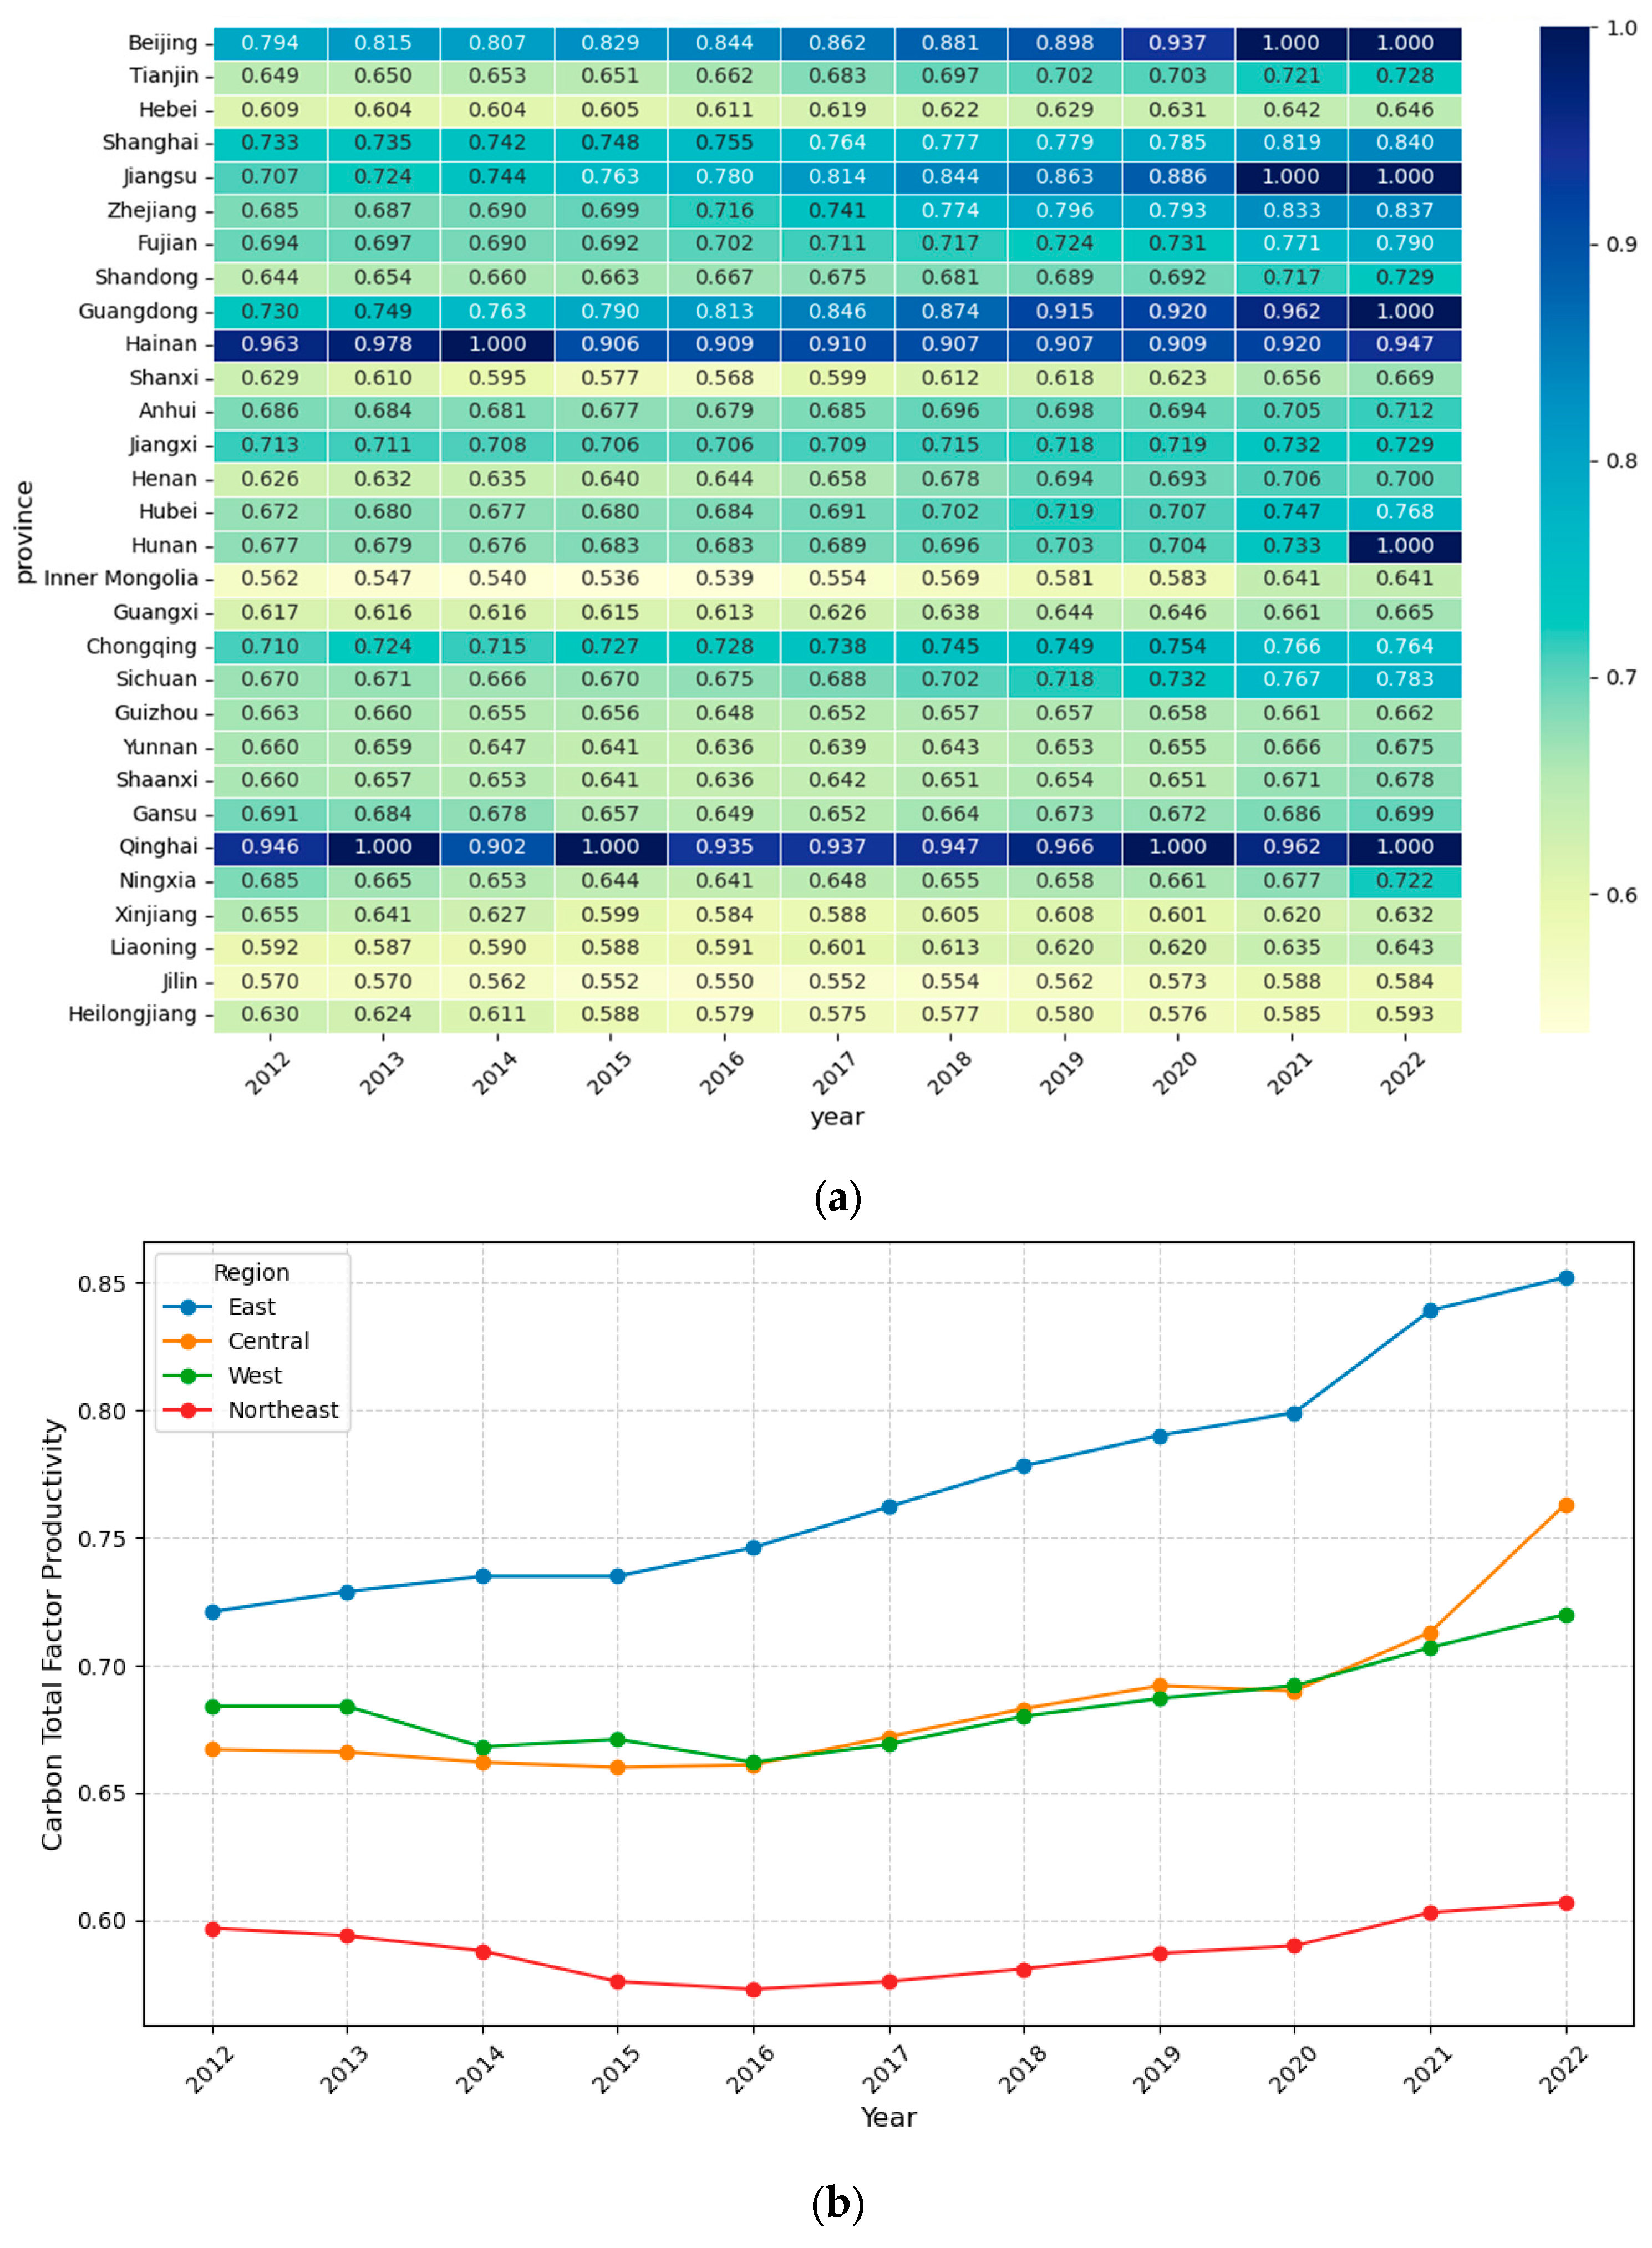
4.1. CTFP Measurement Results and Change Analysis

The change results of CTFP across 30 provinces and municipalities were measured using the SBM-GML methodology. The comprehensive level of CTFP for each region is represented by the average CTFP within that region. The results are shown in Figure 1.
As indicated in Figure 1, in terms of individual provinces, Qinghai consistently ranked high in CTFP over the 11 years, followed by Beijing, Guangdong, Jiangsu, and Shanghai. Except for Shanghai, Qinghai, Beijing, Guangdong, and Jiangsu, all reached the efficiency frontier. In contrast, Inner Mongolia, Heilongjiang, Jilin, and Liaoning exhibited relatively low CTFP, with the highest not exceeding 0.64. From a regional perspective, CTFP follows a descending order of eastern regions > central regions > western regions > northeastern regions. This may be correlated with the developmental disparities among provinces within these regions, as provinces with higher CTFP are primarily located in the eastern regions. Within the central regions, Hunan achieved the efficiency frontier in CTFP in 2022, thereby enhancing the overall CTFP level of the central regions to a certain extent. CTFP is influenced by production efficiency and green and low-carbon environmental factors. In 2022, Qinghai Province’s GDP was only CNY 362.33 billion, but its total CO2 emissions amounted to 59.1526 million tons, far lower than those of other provinces and municipalities. This is the primary reason for Qinghai’s consistently high CTFP. Meanwhile, Beijing, Guangdong, Jiangsu, and Shanghai benefit from their high levels of technological innovation and advanced productivity, leading to higher output levels and sustained increases in CTFP. Eastern regions have widened the economic gap with other regions due to their advanced scientific and technological research and development, digital economy development, and innovation capabilities. This serves as the primary productive force for enhancing production efficiency and increasingly becomes a crucial driving force for low-carbon economic development. Therefore, the continuous improvement in NQPFs has become a key factor determining whether the CTFP of various provinces can continue to rise.
The factors influencing CTFP primarily include industrial production inputs and outputs, carbon emission elements, and policy interventions. Given China’s focus on industrial development, industrial energy input intensity (IE) and industrial value-added (IV) are selected as influencing factors, measured by the natural logarithm of total industrial energy consumption and the natural logarithm of industrial value-added, respectively [51]. For carbon emission elements, carbon emission intensity, a widely used metric in mainstream research for measuring carbon reduction efficiency, is chosen as an influencing factor, calculated as CO2 emissions per unit of GDP [52]. In terms of policy, the primary policy tools for carbon reduction tend to combine command-and-control measures with incentive-based approaches. The impact of command-and-control policies is mainly assessed through environmental regulation (ER), while incentive-based policies promote low-carbon production by encouraging green technology innovation in enterprises (GTIs). Therefore, environmental regulation and the level of green technology innovation are selected as influencing factors. Environmental regulation is measured by the proportion of annual investment in industrial pollution control projects to GDP, and the level of green technology innovation is measured by the ratio of authorized green patents to the total number of green patent applications [53]. Table 3 presents the descriptive statistics.
Table 4 presents the results of the dual fixed-effects panel regression. From column (1), it can be observed that the extensive input of industrial production energy has a positive but insignificant impact on CTFP. In contrast, the increase in industrial value-added significantly and positively affects CTFP, indicating that the current use of energy in industrial production has not yet demonstrated a significant positive impact on CTFP. As the dominant driver of regional economic development, the growth of industrial output is a key factor influencing CTFP. From the perspective of carbon emission environments, carbon emission intensity has a significant negative impact on CTFP, as CTFP primarily treats CO2 emissions as an undesirable output. Higher carbon emission intensity represents lower efficiency in low-carbon production, which aligns with the conclusions drawn in the previous analysis. In terms of policy interventions, environmental regulation currently has a significant negative impact on CTFP. However, incentivizing green technology innovation in enterprises is more conducive to enhancing local CTFP levels and improving production efficiency while providing more possibilities for low-carbon production. Considering the differences in development scale and the effectiveness of policy implementation between municipalities directly under the central government and administrative provinces, column (2) presents the panel regression results after excluding municipalities. The impact and significance of each factor remain consistent with column (1). A further analysis suggests that China’s most significant policy measure to achieve “dual carbon” goals is the implementation of carbon emission trading pilot programs. Starting in 2013, Beijing, Shanghai, Tianjin, Chongqing, Hubei, Guangdong, and Fujian were designated as pilot regions. The effectiveness of carbon reduction policies and environmental governance levels in these regions may be higher than in other provinces and cities. Therefore, column (3) shows the panel regression results after excluding the pilot regions. Except for energy input, the impact and significance of the remaining variables on CTFP remain unchanged, verifying the robustness of the regression results.

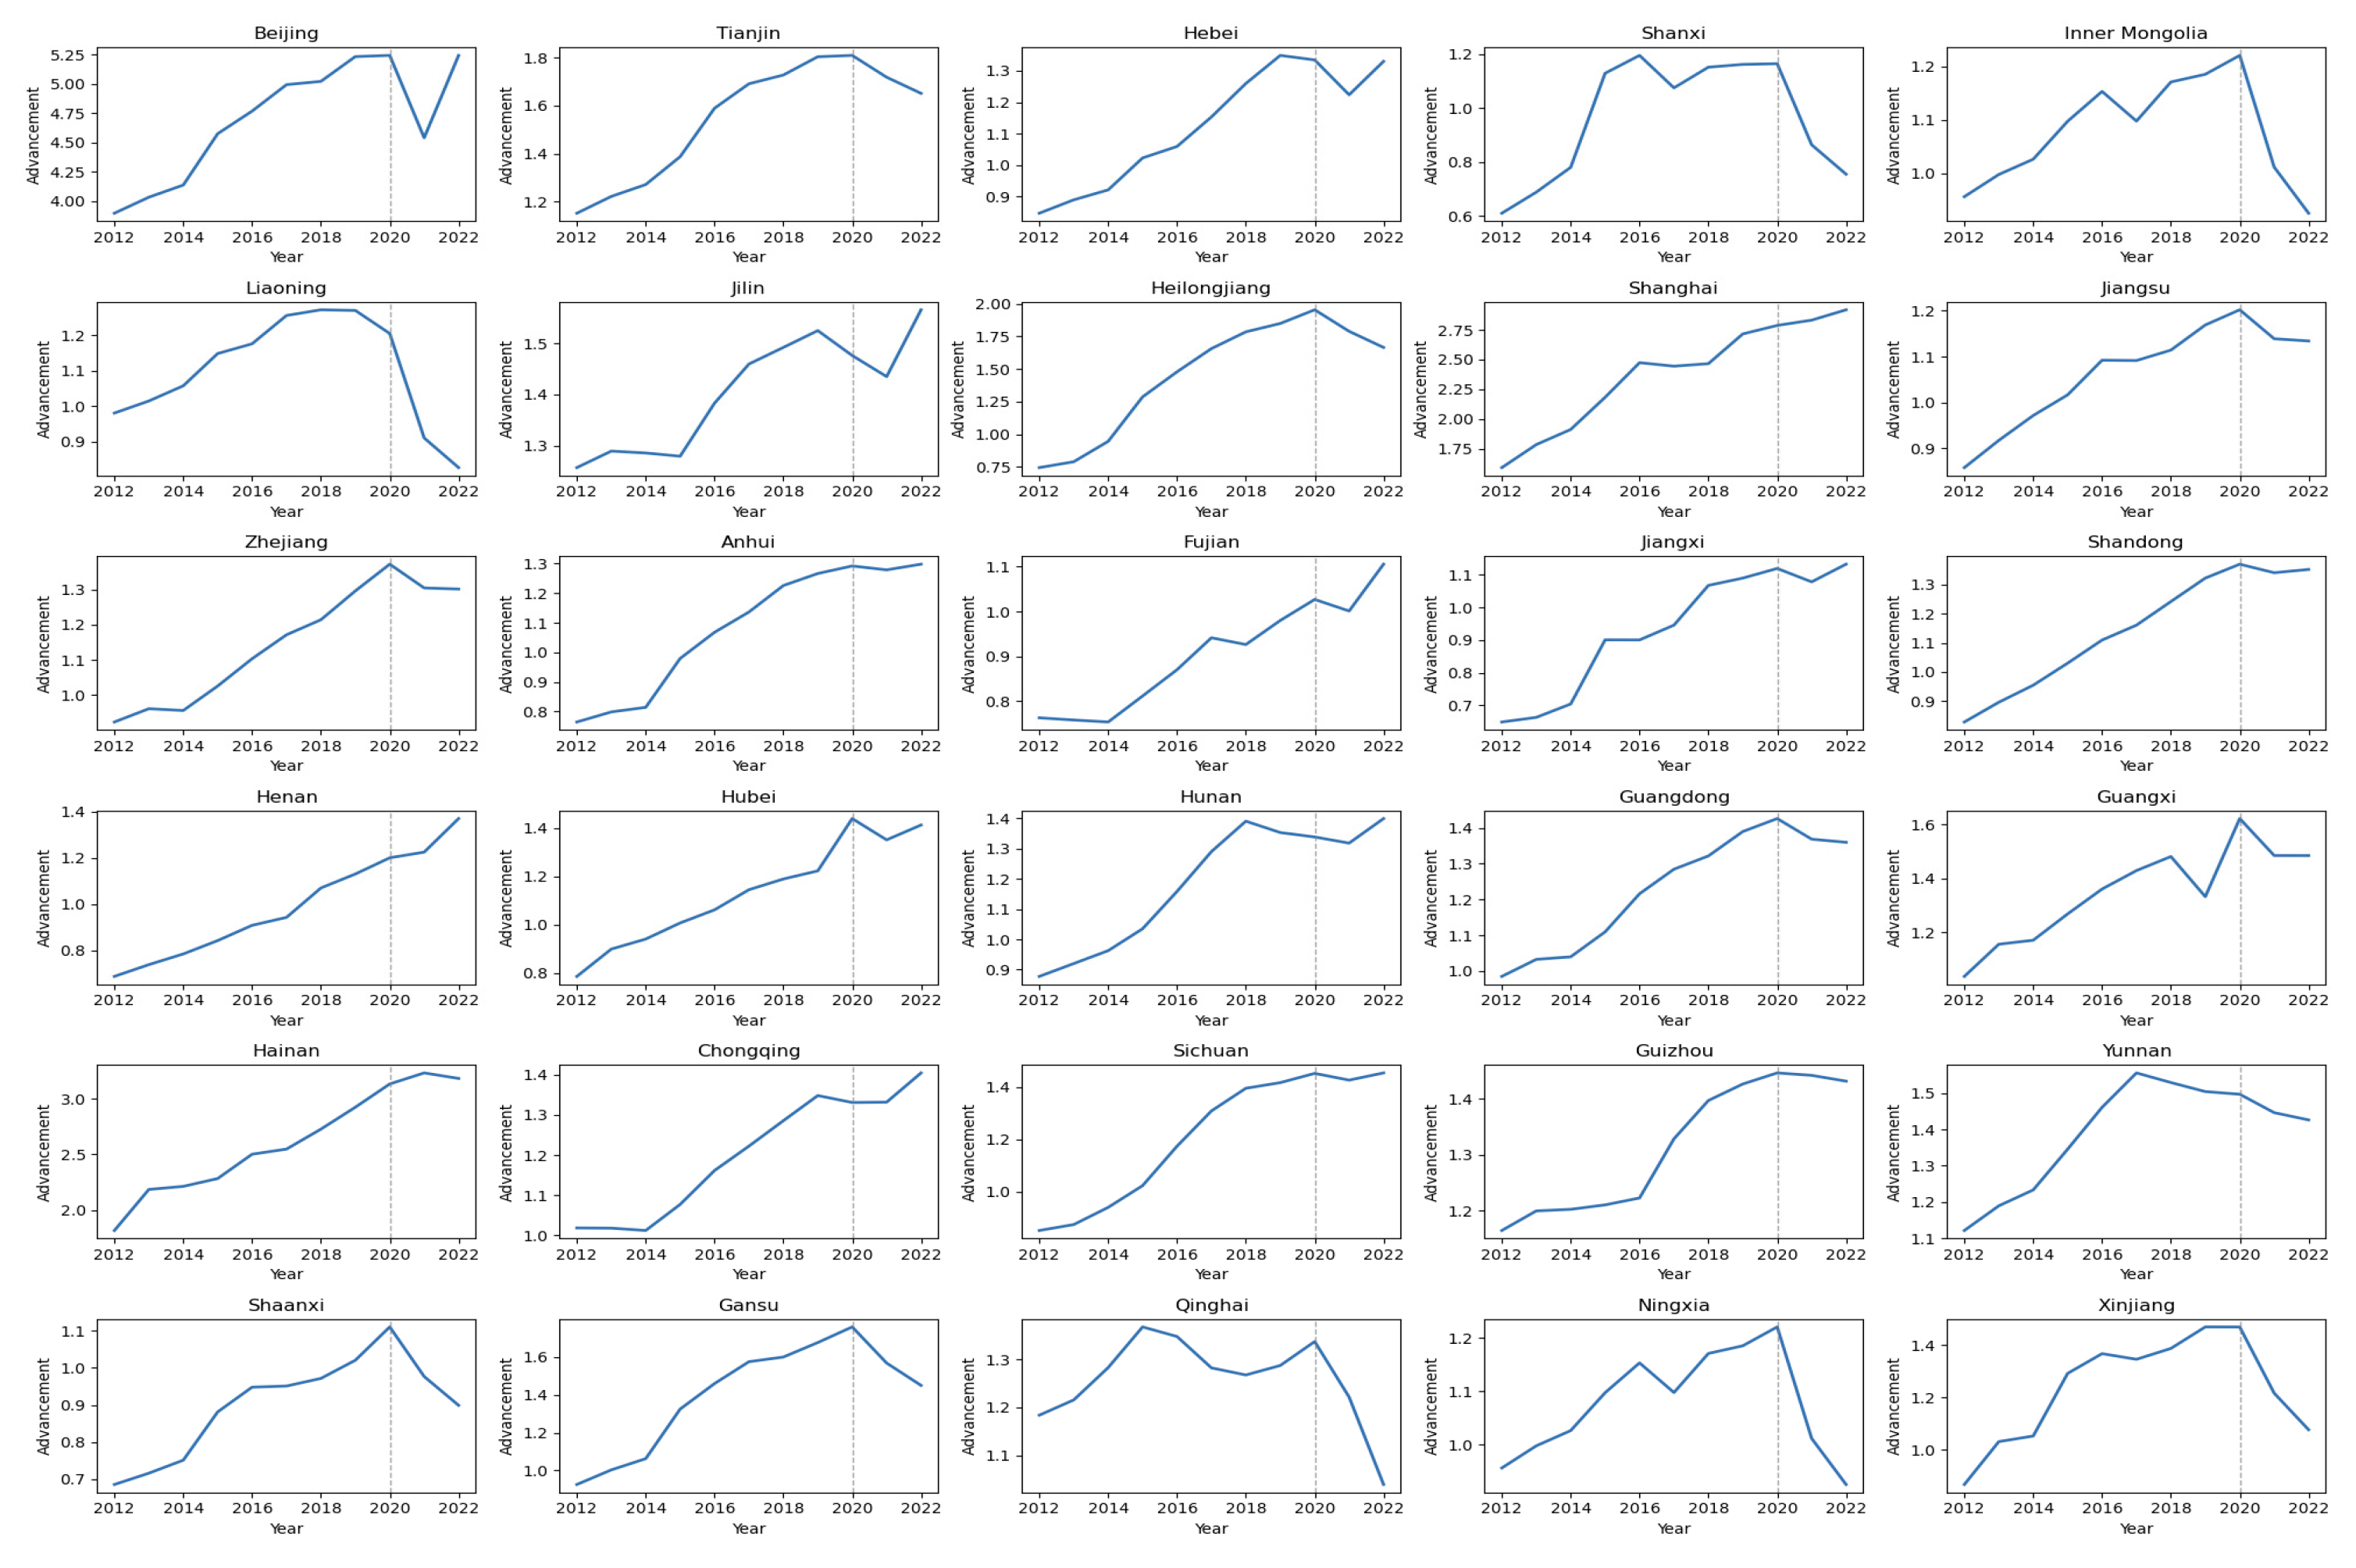
4.2. The Changing Trend of NQPFs

Compared to traditional productive forces, the development of NQPFs reflects a region’s level of scientific and technological innovation, the degree of digitalization of the economy, and the potential for green and low-carbon economic transformation. Figure 2 illustrates the changes in the level of NQPFs among provinces and municipalities within the four major regions.
Overall, the trend of NQPFs in the four major regions exhibits an initial increase, followed by a decline, peaking in 2020. On the one hand, this may be because after the “dual-carbon” targets were proposed in 2020, the economic structures of various provinces and municipalities successively entered a phase of low-carbon transformation. Additionally, the increase in marginal output from scientific and technological research and development is accompanied by regional heterogeneity and time lag characteristics, leading to a temporary mismatch between NQPFs and existing industrial structures. On the other hand, this trend may also be constrained by macroeconomic factors such as the downward pressure on the global economy since 2020, impacting the growth rate of NQPFs after 2020.
Regionally, the eastern region was relatively less affected overall, with a modest decline after 2020 and an average above 0.4 since 2017. Beijing and Guangdong have the highest levels of NQPFs, approaching 0.6 in 2020 and 2022, while Hainan has the lowest, with only 0.1 in 2022. The central and western regions have similar average levels of NQPFs and similar trends. However, in 2022, the provinces and municipalities in the central region gradually surpassed those in the western region, with levels ranging from 0.15 to 0.20. Except for Sichuan, Chongqing, Guangxi, and Shaanxi, the levels of NQPFs are only around 0.1 in the western region. The northeastern region has the lowest levels of NQPFs, with a peak below 0.2, and the levels from high to low are Liaoning, Jilin, and Heilongjiang, showing a gradual increase spatially from north to south. Due to differences in resource endowments and regional economic development, there are significant spatial and temporal variations in the distribution of NQPFs. The distribution characteristics of differences in CTFP are similar to those of NQPFs. Therefore, the degree of coupling coordination between NQPFs and CTFP is crucial for comprehensively assessing various provinces’ advanced production efficiency levels under the “dual-carbon” target.
The essence of NQPFs lies in green productivity, which is not only influenced by the process of informatization but may also be related to economic development and the advancement of green finance. The reversal in the trend of NQPFs around 2020 may be associated with the industrial upgrading transformation driven by the proposal of the “dual carbon” goals [54]. Therefore, the industrial structure advancement index (Structure) is selected to assess its relationship with NQPFs, measured by the ratio of the value added for the tertiary industry to that of the secondary industry. For control variables, per capita GDP (PGDP) is chosen to represent the level of economic development [55]. Informatization level (IL) is measured by the proportion of mobile phone subscribers to the total population at the end of the year in each province [55]. Green finance (GF) is calculated by fitting a green finance development index using the entropy weight method based on green financial instruments such as green bonds, green credit, green support, and green funds [56]. Additionally, considering the impact of high-level talent (HT), the natural logarithm of the average years of education per capita in each province is selected as the talent resource indicator [57]. Table 5 presents the descriptive statistics.
As shown in Table 6, column (1) presents the overall impact effects without dividing the period from 2012 to 2022. The results indicate that industrial structure advancement has a significant positive impact on NQPFs, meaning that achieving industrial upgrading drives the development of NQPFs. In addition to education level, economic development, informatization, and green finance development all have significant positive effects on enhancing NQPFs. Columns (2) and (3) present the dual fixed-effects panel regression results for the periods 2012–2019 and 2020–2022, respectively. Whether before or after 2020, industrial structure advancement has a significant positive impact on the formation of NQPFs. Notably, the coefficient of industrial structure advancement has slightly increased compared to the pre-2020 period, indicating that industrial upgrading is increasingly becoming a focal point for the formation of NQPFs. As illustrated in Figure 3, the growth rate of industrial structure advancement has slowed after 2020, with some regions even experiencing a decline. Combined with the results in Table 6, it is evident that industrial structure adjustments have influenced changes in NQPFs after 2020.

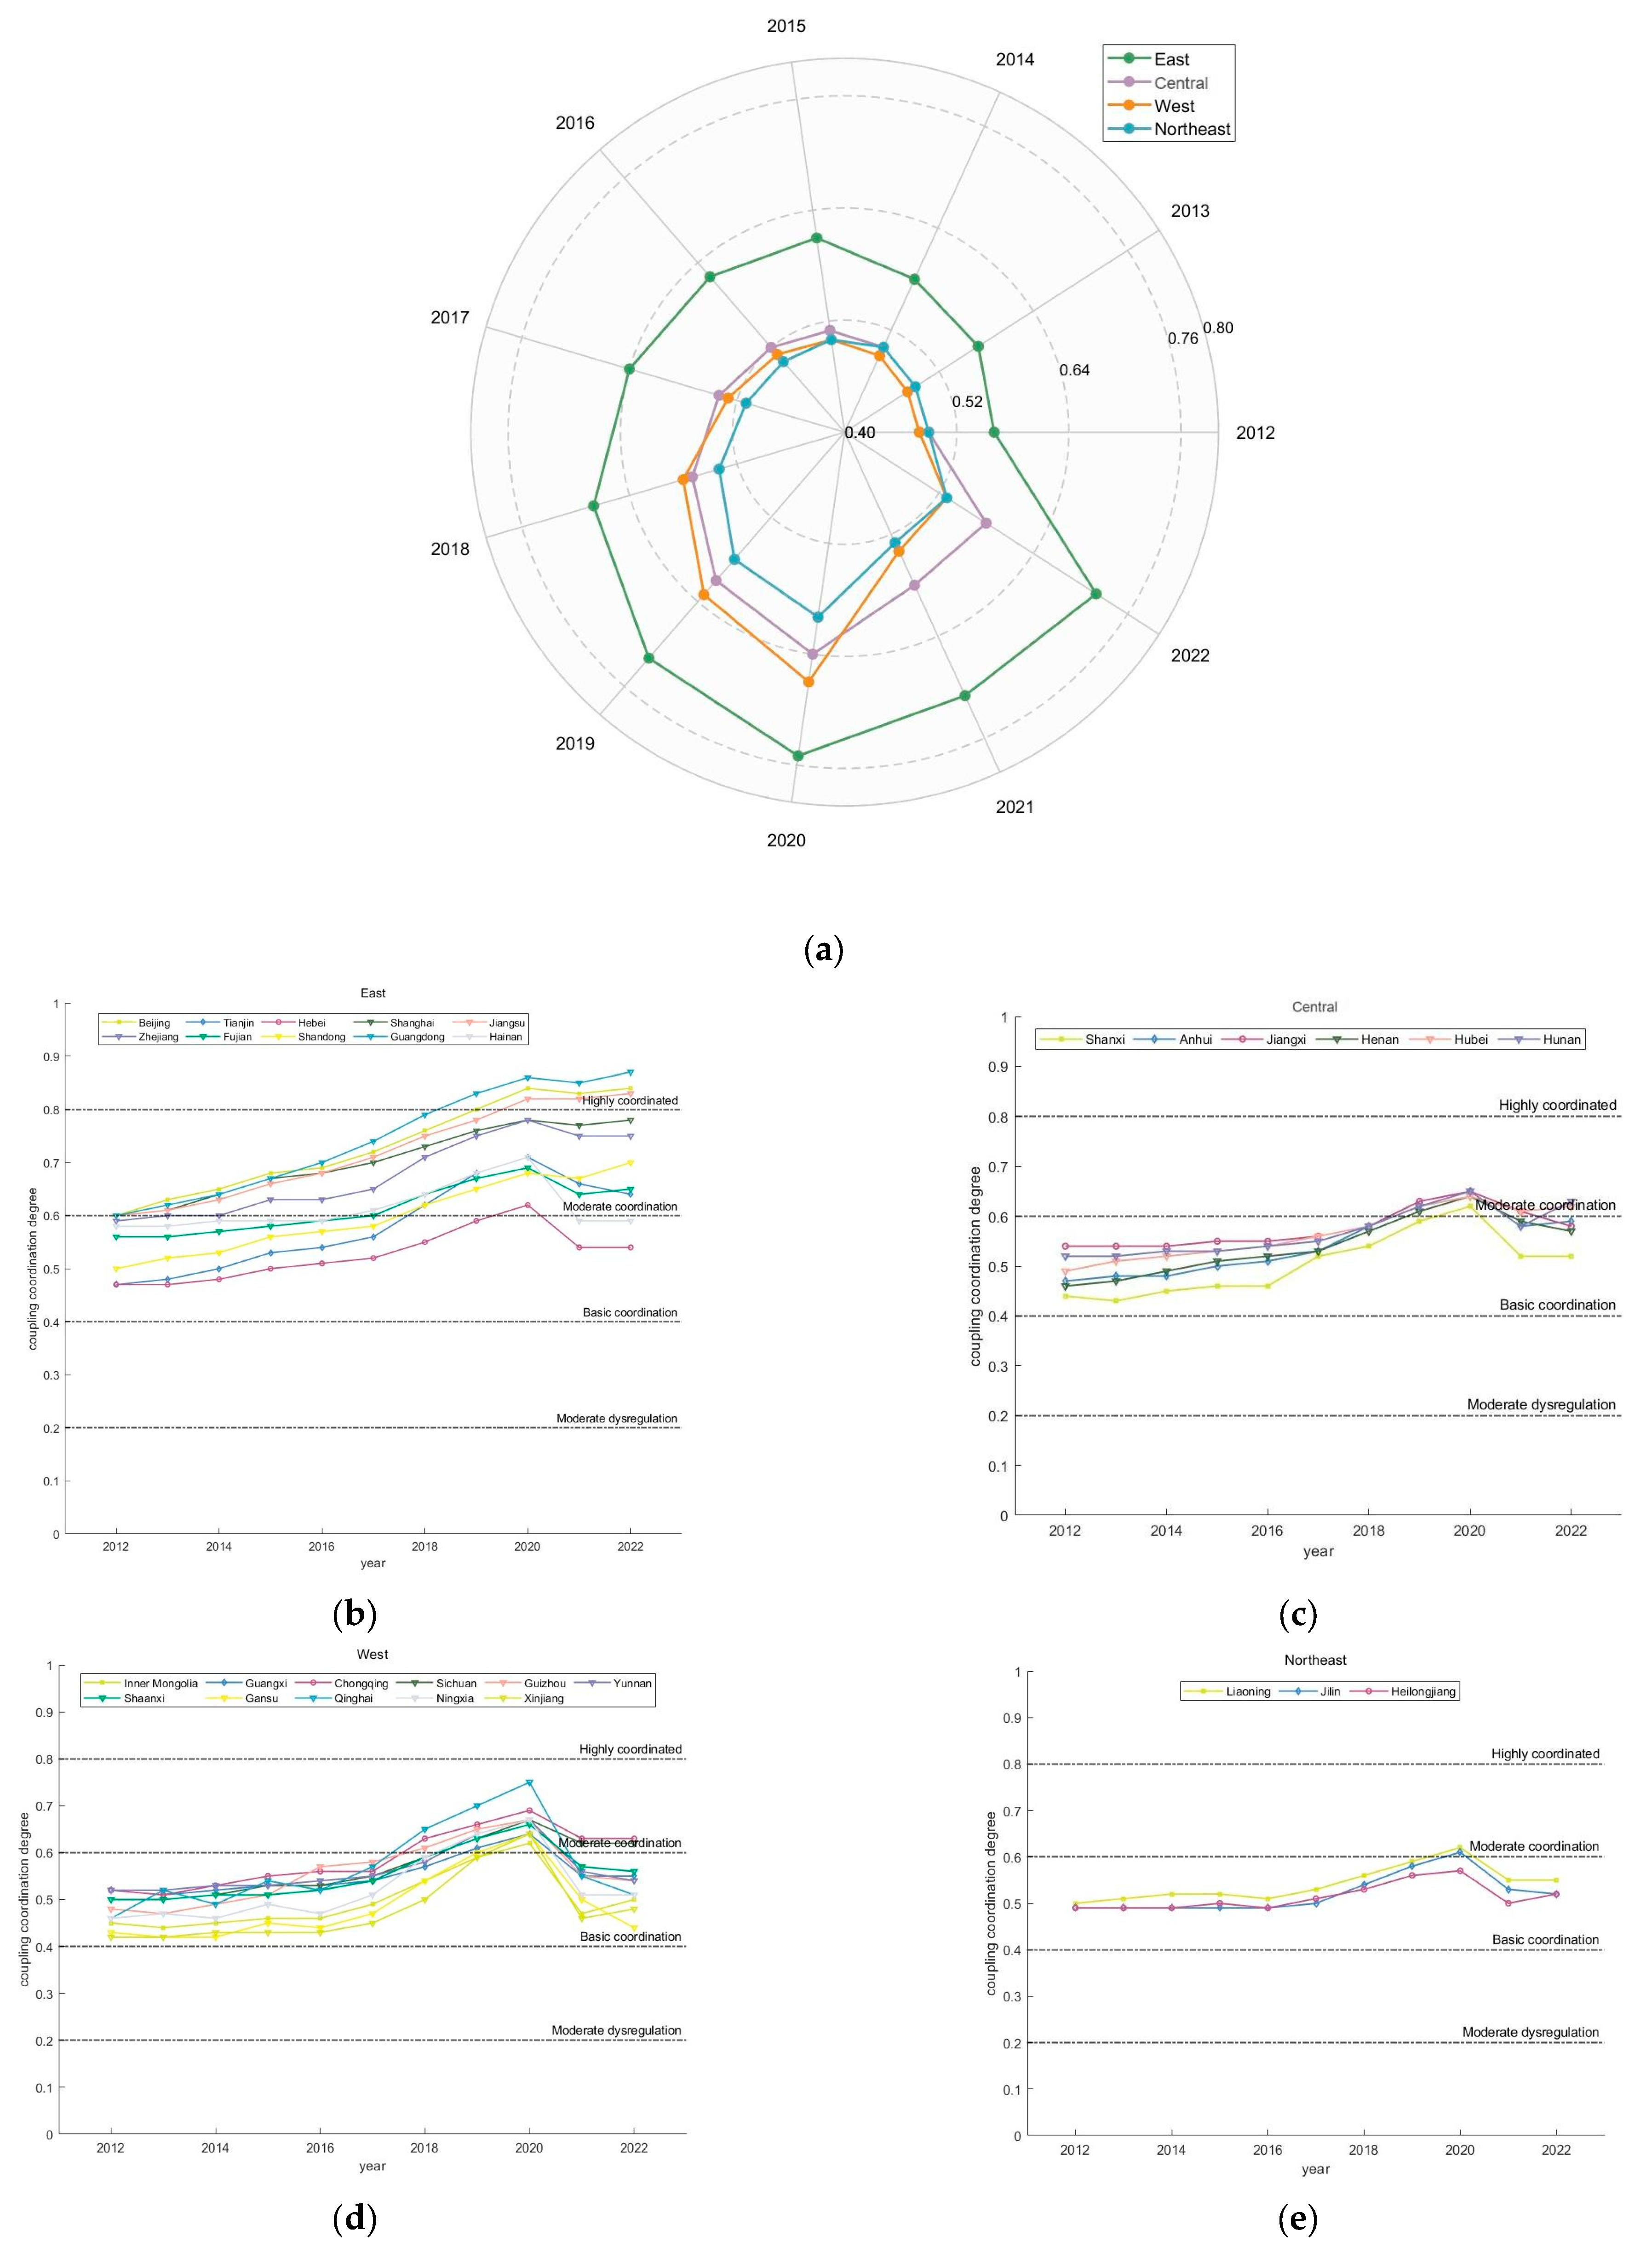
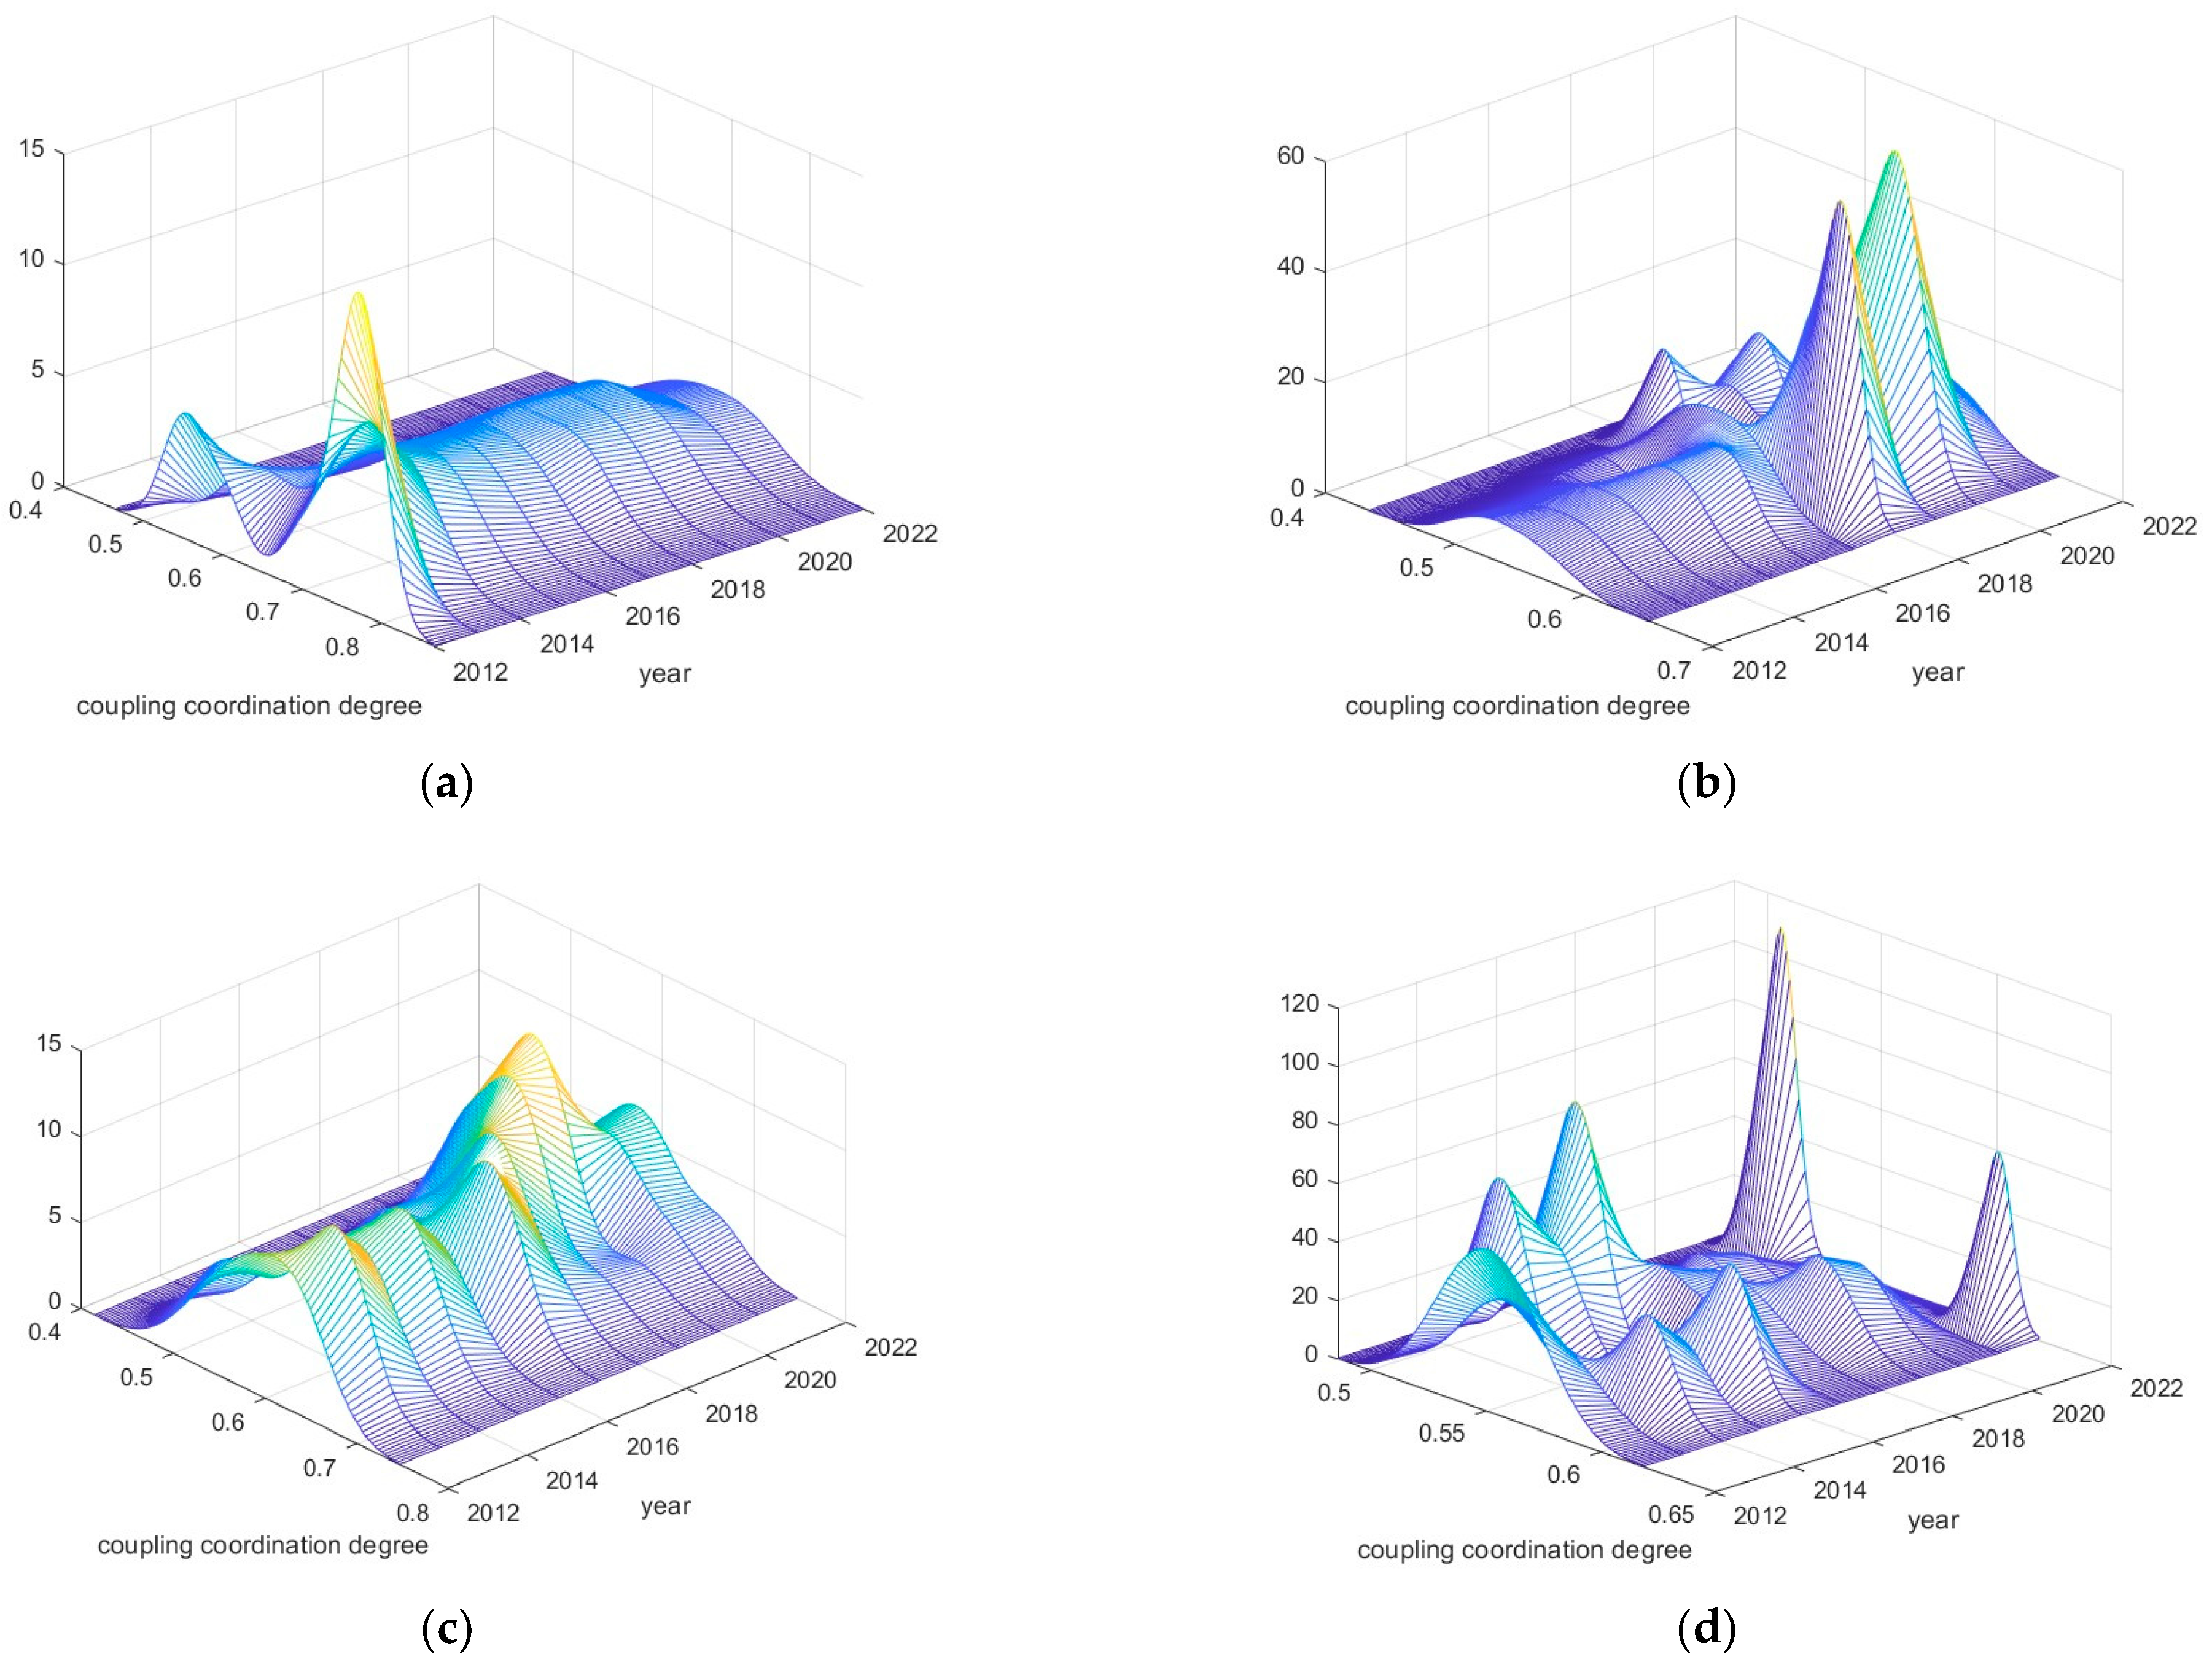
4.3. Dynamic Evolution Trend of Coupling Coordination Degree Between NQPFs and CTFP

To more intuitively observe the growth trends of the coupling coordination degree between NQPFs and CTFP in China, MATLAB (R2023b) is utilized to generate radar charts and line charts of the coupling coordination degree from the perspective of the four major regions (Figure 4). As shown in Figure 4, the coupling coordination degree between NQPFs and CTFP is highest in the eastern region, followed by the central and western regions, and lowest in the northeastern region. Regarding trends, the change in the coupling coordination degree between NQPFs and CTFP exhibits similar characteristics to the change in NQPFs. A turning point was observed in the coupling coordination degree in 2020. Before 2020, the degree of coupling coordination in the western region was higher than in the central region, ranking second. However, after 2020, it dropped sharply, approaching the level of the northeastern region. This further indicates that the coupling coordination relationship between NQPFs and CTFP is primarily influenced by NQPFs, which are crucial for green and low-carbon production and industrial upgrading. After 2020, the decline rates in the eastern, central, and northeastern regions were relatively low, suggesting that these three regions are gradually adapting to new development models during the economic transformation stage. However, significant gaps in coupling coordination levels still exist. Therefore, the kernel density estimation method is employed to analyze the intraregional difference distribution characteristics of the four major regions, as shown in Figure 5.
The kernel density plot illustrates the probability density distribution of data through a smooth curve, and its shape can intuitively reflect the distribution characteristics and changing trends of the coupling coordination degree. First, if the curve exhibits a unimodal shape, it indicates that the distribution of the coupling coordination degree is relatively concentrated, with most data clustered around the peak, suggesting small differences in coordination among regions or time points. If the peak is located in a higher-value region, it signifies an overall high level of coordination. Conversely, if the curve shows a multimodal shape, it indicates a clear stratification in the distribution of the coupling coordination degree, potentially reflecting the presence of multiple subgroups, which often highlights regional development disparities. If the curve evolves from unimodal to multimodal, it suggests a trend toward uneven development, likely leading to polarization or multi-polarization (polarized distribution). Second, the width of the curve reflects the degree of data dispersion: a wider curve indicates a more dispersed distribution of the coupling coordination degree, with greater differences among regions or time points; a narrower curve suggests a more concentrated data distribution, with smaller differences. Figure 5 demonstrates the temporal evolution of the difference distribution in coupling coordination degrees within the four major regions. According to Figure 5a, the eastern region exhibited a bimodal distribution in 2012, indicating severe polarization in the internal coupling coordination degree at the beginning of the survey period. Over time, the bimodal peaks gradually disappeared, and the kernel density plot became smoother, with the prominent peak shifting to the right. By 2022, the prominent peak concentrated near 0.7, suggesting that the eastern region’s polarization phenomenon was eliminated. However, the plot distribution was quite divergent, indicating significant differences in internal coupling coordination degrees. Figure 5b illustrates the internal difference distribution in the central region. In contrast to the eastern region, the plot was relatively flat at the beginning of the survey period. After 2018, a side peak emerged on the left, indicating weak polarization distribution. This was primarily due to the slightly higher growth rates in the coupling coordination degrees between NQPFs and CTFP in Hunan, Hubei, Jiangxi, and Anhui compared to those in Shanxi and Henan. By 2022, these provinces reached a basic coordination level, leading to a weak polarization phenomenon within the central region. Geographically, these provinces are adjacent to the southeast of China, close to those with high coupling coordination levels, and regional coordinated development has brought development dividends to the central region.
Figure 5c presents the distribution of coupling coordination degrees in the western region. Overall, there is no polarization phenomenon within the western region. However, the prominent peak has a high concentration and shifts leftwards year by year, indicating that the coupling coordination degrees within the western region tend to converge. However, there is considerable pressure to increase the average coupling coordination level. Mainly after 2018, the prominent peak is concentrated at near 0.5. After 2020, the peak value decreased, suggesting that there are still internal differences in coupling coordination degrees in the western region, and the low coupling coordination degree remains a significant issue. Figure 5d shows the status of internal coupling coordination in the northeastern region. Multi-peaks, staggered peaks, and unevenness are typical characteristics of the kernel density function plot for the northeastern region, indicating a persistent polarization in coupling coordination degrees and significant internal differentiation. This may be due to the small sample size, which results in poor fitting of the kernel density results. Further exploration of the evolution of internal differences requires Dagum’s Gini coefficient and a β-convergence analysis. However, potential reasons, such as the long-standing development gap between Liaoning and Heilongjiang, may also exist, which is the main factor hindering the growth rate of coupling coordination degrees in the northeastern region.

4.4. Analysis of Regional Differences in Coupling and Coordination Degree

The analysis of spatial differences among the four major regions (Table 7 and Table 8) reveals the following findings: Firstly, overall, the Gini coefficient exhibits a slow upward trend, indicating that overall spatial disparities are gradually widening, necessitating vigilance against excessive disparities that could lead to polarization, which aligns with previous conclusions. Secondly, within the four regions, internal disparities in the central region have been declining annually, while those in the eastern and western regions have been increasing, suggesting that the central region has achieved a better level of overall coordinated development, demonstrating regional advantages. The relatively low level of internal coordination in the western region may be related to the slower pace of technological innovation development in Xinjiang, Gansu, Inner Mongolia, and other regions compared to the eastern region. In contrast, through the coordinated development of technological innovation urban agglomerations and high-tech industrial parks, the eastern region has continuously broken through innovation development bottlenecks, resulting in varying growth rates of internal coupling coordination degrees. As the most economically developed region in China, the eastern region exhibits significantly higher capabilities in technological innovation and industrial upgrading compared to other areas. For instance, the Yangtze River Delta, Pearl River Delta, and Beijing–Tianjin–Hebei urban agglomerations have formed strong regional synergistic effects through the deep integration of high-tech industries and green low-carbon economies. In contrast, the western region, constrained by geographical conditions, infrastructure, and technological resources, lags behind in development, leading to widening internal disparities. Thirdly, in terms of inter-regional differences among the four regions, the gap between the eastern region and the other three regions gradually widens. The primary reason is the continuously improving development level and input of innovative factors in the eastern region, where the coupling coordination level is generally at a high level of coordination, and the excessively rapid development has created a significant gap with the other three regions. The gap between the central region and the western and northeastern regions is gradually narrowing, indicating that the central region has played a vital bridging role in the national economy’s green and low-carbon transformation and the flow of technological innovation factors. This aligns with the previous spatial analysis results and further demonstrates that, in the new stage of development, leveraging regional coordinated development advantages is more effective. The central region, leveraging its geographical advantages and industrial foundation, plays a significant role in undertaking industrial transfers from the eastern region and promoting green and low-carbon transformation. For example, provinces such as Hubei, Hunan, and Henan have gradually narrowed the gap with the eastern region by developing advanced manufacturing and green energy industries. Fourthly, regarding the contribution of differences, inter-regional differences among the four regions contribute the most, followed by intra-regional differences, while super-variable density contributes the least. This precisely reflects the imbalance in regional economic development in China, where the efficient development model of the eastern region contrasts sharply with the traditional industrial model of the central and western regions. Future policies should place greater emphasis on coordinated development among regions, leveraging technological innovation and the promotion of green and low-carbon technologies to narrow regional disparities.

4.5. Analysis of Spatial Convergence of Coupling Coordination Degree

4.5.1. Spatial Correlation Test

As shown in Table 9 and Figure 6, Moran’s I index for the coupling coordination degree between NQPFs and CTFP across 30 provinces and municipalities in China from 2012 to 2022 is significantly positive at the 1% confidence level. This indicates that the coupling coordination relationship between NQPFs and CTFP exhibits spatial correlation, thus necessitating the consideration of spatial correlation when conducting a convergence analysis. This further validates the linkage effects of economic and industrial development across regions. It demonstrates that the technological innovation and green low-carbon development model of the eastern region have generated significant spillover effects on surrounding areas, while the resource-dependent economic model of the western region has constrained its coordinated development with the eastern region.

4.5.2. Absolute β-Convergence and Conditional β-Convergence

As shown in Table 10, the absolute β coefficients for the overall sample and for the central, western, and northeastern regions are significantly negative, with values of −0.306, −0.132, −0.089, and −0.592, respectively. This indicates that, on average, the disparities in coupling coordination degrees exhibit a converging trend. However, when analyzed by region, the eastern region exhibits significant divergence, with no evidence of β convergence. Furthermore, the ρ coefficients for the overall sample, the central region, and the western region are significantly positive, suggesting that, except for the northeastern region, the evolution of coupling coordination degrees between NQPFs and CTFP does indeed exhibit positive spatial correlation across the country. In terms of convergence speed, the northeastern region converges faster than the overall national average, which in turn converges faster than the central region, which converges faster than the western region. The half-life period is shortest in the northeastern region and longest in the western region. These results are consistent with the convergence theory in neoclassical economics. However, the absolute β convergence process does not account for potential confounding factors, and regional development disparities are not eliminated. Therefore, further verification through conditional β convergence is necessary.
Information technology, industrial development, and environmental regulations influence the degree of coupling coordination between NQPFs and CTFP. Therefore, following the research of Du et al. [58,59], the selected control variables included (1) economic development level, measured by the natural logarithm of per capita GDP of each province; (2) industrial structure, represented by the proportion of employment in the secondary industry in each province; (3) information technology level, indicated by the proportion of mobile phone subscriptions at the end of the year to the total population in each province; (4) education level, the natural logarithm of the average years of education per capita in each province; (5) environmental regulations, measured by the proportion of investment in industrial pollution control projects to GDP in each province; and (6) urban population density, represented by the ratio of urban population to total population in each province. According to Table 11, the β-convergence pattern remains unchanged for the overall sample and individual regions, but the spatial correlation has shifted. After considering regional development factors, the coupling coordination degree between NQPFs and CTFP across the country exhibits a significant positive spatial correlation. The convergence speed has also changed, with the central region converging the fastest, followed by the western and northeastern regions. However, the overall convergence speed does not differ significantly from the convergence speeds of the individual regions. In the eastern region, due to factors such as technology, culture, and economy far superior to those of other provinces, the current internal disparities are relatively severe, and there is still considerable room for achieving β-convergence.

4.6. Future Discussion

This study primarily focuses on the analysis of coupling coordination between NQPFs and CTFP, as well as their potential value in the sustainable development of a low-carbon economy. This research domain is increasingly taking a prominent role in the sustainable development of a low-carbon economy in the new era. NQPFs emphasize technological innovation and green development. The current mainstream research primarily explores ways to promote the green transformation of traditional industries through technological innovation and how to leverage new technologies, processes, and equipment to transform and upgrade traditional industries, thereby enhancing CTFP. The characteristics of China’s regional coordinated development derived from this paper lay a research foundation for exploring how to leverage regional coordinated development strategies to facilitate balanced regional development, particularly in harnessing the technological innovation advantages of eastern China to drive green and low-carbon development in central-western and northeastern regions.
On the other hand, NQPFs have increasingly become a pivotal force in enhancing national development and international competitiveness. It represents a systematic upgrade of traditional productivity. Although the metrics for measuring NQPFs may exhibit different forms as times evolve, this study focuses on the three essential elements of productivity in assessing NQPFs. Regardless of future research advancements or the pace of technological progress, these three elements will always serve as the foundation for measuring NQPFs. The evolutionary trends and dynamic analysis results of NQPFs presented in this paper establish a research foundation for subsequent discussions on topics such as the digital economy, technological innovation, and data elements. In summary, integrating NQPFs with the green development of a low-carbon economy holds vast potential for broad application and improvement. Through efforts in technological innovation, coordinated regional development, policy support, and other aspects, we can effectively promote green and low-carbon economic transformation and sustainable development.

5. Conclusions

5.1. Research Conclusions

This paper analyzes the coupling coordination level between NQPFs and CTFP from the perspective of four major regions, interpreting it through the dual perspectives of “time” and “space”. It employs the Dagum Gini coefficient and a β-convergence analysis to assess the distribution of differences among different regions. Based on this, the following conclusions are drawn:
Firstly, Beijing, Guangdong, Shanghai, Jiangsu, and Qinghai exhibit high levels of CTFP. At the same time, Heilongjiang, Inner Mongolia, and Jilin have relatively low CTFP values, with the highest not exceeding 0.64. This results in a situation where CTFP ranks high to low, such as eastern region > central region > western region > northeast region. From the perspective of NQPFs, all four major regions show a trend of first increasing and then decreasing. After the proposal of the “dual-carbon” target, provinces have successively entered an economic transformation phase, which has slowed down the growth rate of NQPF formation to some extent. The level of NQPFs ranks from high to low, as in eastern region > central region > western region > northeast region, showing a similar trend to CTFP. Therefore, the degree of coupling coordination between NQPFs and CTFP is crucial for promoting the sustainable development of a low-carbon economy.
Secondly, the degree of coupling coordination between NQPFs and CTFP is highest in the eastern region, followed by the central region, western region, and northeast region. The trend in the coupling coordination degree between NQPFs and CTFP is similar to that in NQPFs, further indicating that the accelerated formation of NQPFs is a crucial driver for steadily improving the coupling coordination degree between them. However, based on the kernel density estimation results, the four major regions exhibit distinct characteristics of differential distribution. The central region and northeast region show evident polarization within their respective regions. Although polarization within the eastern region has significantly improved, internal differences are still pronounced and a spatially coordinated development pattern has not yet fully formed. Geographically close to the eastern region, the central region can leverage its locational advantages to enhance the degree of coupling coordination between NQPFs and CTFP. Accelerating the overall green and low-carbon economic transformation within the region is key to eliminating polarization. The northeast and western regions still lag behind advanced regions regarding the environment, economy, technological development, and other factors. Increasing the intensity of advanced production factor inputs should be the primary task for these two regions.
Thirdly, from the distribution perspective, the overall difference is generally intensifying, with interregional differences as the primary cause. Notably, the gap between the central region and both the western and northeastern regions is gradually narrowing, suggesting that in the new stage of development, the central region is functioning as a bridge for economic development between eastern and western China by leveraging its regional advantages. When examined in conjunction with β-convergence results and focusing on internal differences, there exists a spatial positive correlation in the coupling coordination degree between the overall situation and other regions, and the disparities in coupling coordination degree demonstrate a trend of convergence. The central region exhibits the fastest convergence rate, followed by the western and northeastern regions; however, the overall differences in convergence rates are not substantial.

5.2. Suggestions and Future Prospects

This paper aims to translate regional disparity characteristics into concrete action plans, enhancing the practicality and operability of policy recommendations. The eastern region should strengthen its leadership in technological innovation, the central region should leverage its geographical advantages to promote green and low-carbon transformation, the western region should rely on its resource endowments to balance technological innovation with resource development, and the northeastern region should revitalize traditional industries while increasing investments in advanced production factors. Simultaneously, through regional coordinated development mechanisms, nationwide coordinated development should be promoted. On one hand, this will facilitate the deep integration of NQPFs and CTFP; on the other hand, it will address regional imbalances in production efficiency and mitigate polarization, achieving green and low-carbon economic development. To this end, the following recommendations are proposed:
Firstly, as China’s technological frontier, the eastern region should fully leverage its advantages in technological innovation to promote the deep integration of NQPFs and CTFP. Specifically, the eastern region needs to strengthen basic research and applied R&D, relying on urban agglomerations such as the Yangtze River Delta, Pearl River Delta, and Beijing–Tianjin–Hebei to focus on cutting-edge fields such as artificial intelligence, quantum information, and biotechnology, aiming to build internationally influential hubs of technological innovation. Simultaneously, it should drive the transformation of traditional industries toward high-end, intelligent, and green development, supporting the establishment of a group of internationally competitive innovative enterprises and industrial clusters. Additionally, the eastern region should diffuse advanced technologies to the central, western, and northeastern regions through technology transfer and industrial collaboration, fostering a pattern of complementary advantages and coordinated development across regions.
Secondly, as a bridge connecting the eastern and western regions, the central region should fully utilize its geographical advantages to accelerate the green and low-carbon transformation of its economy. Specific measures include actively undertaking labor-intensive industries and technology transfers from the eastern region to promote the optimization of regional industrial structures; leveraging the industrial foundations of provinces such as Hubei, Hunan, and Henan to establish green and low-carbon technology demonstration zones; promoting the application of new energy, energy conservation, and environmental protection technologies; and strengthening technological cooperation with the eastern region to share scientific achievements and innovation resources, thereby enhancing the central region’s technological innovation capabilities and narrowing the gap with the eastern region.
Thirdly, given the significant disparities in resource endowments and technological innovation capabilities in the western region, differentiated development strategies should be formulated based on regional characteristics. For resource-rich areas such as Xinjiang, Gansu, and Inner Mongolia, it is necessary to promote the transformation of traditional resource-based industries toward green and low-carbon directions, reducing reliance on high-carbon industries. At the same time, focusing on advantageous industries such as equipment manufacturing, new energy, and biomedicine, regional innovation platforms with distinctive features should be established to drive industrial upgrading and transformation. Additionally, the western region should intensify efforts in cultivating scientific and technological talent, enhancing innovation capabilities through education promotion and talent recruitment, and thereby narrowing the technological gap with the eastern region.
Fourthly, the northeastern region faces significant gaps in environmental, economic, and technological development compared to advanced regions and should prioritize increasing the intensity of advanced production factor inputs. Specifically, the northeastern region should leverage its industrial foundation to promote the transformation of equipment manufacturing toward intelligent and green development, enhancing industrial competitiveness. Meanwhile, special funds should be established, and tax policies improved to encourage collaboration among universities, research institutions, and enterprises in the field of low-carbon and green production, supporting independent research and development of advanced technologies. Furthermore, through the “New Third Front Construction”, long-term and stable cooperative relationships with the eastern region should be established to accelerate the transfer of advanced technologies to the northeastern region, narrowing regional development disparities.
In summary, to narrow regional development disparities, a multi-point regional collaboration mechanism should be established to promote coordinated regional development. Specific measures include strengthening economic communication between the eastern, central, and western regions, optimizing industrial layouts through technology transfer and industrial collaboration, and forming an industrial structure characterized by complementary advantages and coordinated development. Advanced technology demonstration zones should be established in the central, western, and northeastern regions to facilitate the orderly migration of labor-intensive industries, technologies, and capital. At the same time, it is essential to steadfastly advance the “New Third Front Construction,” enhance interregional technology transfer and resource sharing, and establish a nationwide coordinated development framework.

Author Contributions

X.G.: Conceptualization, Data curation, Methodology, Software, Coding, Writing—original draft, Supervision, Writing—review and editing, Formal Analysis, Supervision. S.L.: Supervision, Writing—review and editing. All authors have read and agreed to the published version of the manuscript.

Funding

The authors gratefully acknowledge the Key Project Fund of humanities and Social Science Research of Hebei Provincial Department of Education (No. ZD202318); the 2024 Hebei Provincial Department of Science and Technology Soft Science Think Tank Project Fund (No. 24457613D); and the General Project Fund of Hebei Federation of Social Sciences in 2024 (No. 20240202215).

Institutional Review Board Statement

Not applicable.

Informed Consent Statement

Not applicable.

Data Availability Statement

These data can be derived from https://data.stats.gov.cn/.

Conflicts of Interest

The authors declare no conflicts of interest.

References

  1. Chakraborty, D.; Mukherjee, S. How do trade and investment flows affect environmental sustainability? Evidence from panel data. Environ. Dev. 2013, 6, 34–47. [Google Scholar] [CrossRef]
  2. Gao, T. New Quality Productive Forces Promote and Facilitate High-quality Development. Highlights Bus. Econ. Manag. 2024, 45, 491–495. [Google Scholar] [CrossRef]
  3. Zheng, M.; Yan, S.; Xu, S. Digital Economy, Industry–Academia–Research Collaborative Innovation, and the Development of New-Quality Productive Forces. Sustainability 2025, 17, 318. [Google Scholar] [CrossRef]
  4. Fagerberg, J. Technological progress, structural change and productivity growth: A comparative study. Struct. Change Econ. Dyn. 2000, 11, 393–411. [Google Scholar] [CrossRef]
  5. Aydin, M.; Erdem, A. Analyzing the impact of resource productivity, energy productivity, and renewable energy consumption on environmental quality in EU countries: The moderating role of productivity. Resour. Policy 2024, 89, 104613. [Google Scholar] [CrossRef]
  6. Yao, L.; Li, A.; Yan, E. Research on digital infrastructure construction empowering new quality productivity. Sci. Rep. 2025, 15, 6645. [Google Scholar] [CrossRef]
  7. Xie, F.; Jiang, N.; Kuang, X. Towards an accurate understanding of ‘new quality productive forces’. Econ. Political Stud. 2024, 1–15. [Google Scholar] [CrossRef]
  8. Aydin, M.; Degirmenci, T.; Gurdal, T.; Yavuz, H. The role of green innovation in achieving environmental sustainability in European Union countries: Testing the environmental Kuznets curve hypothesis. Gondwana Res. 2023, 118, 105–116. [Google Scholar] [CrossRef]
  9. Feng, N.; Yan, M.; Yan, M. Spatiotemporal Evolution and Influencing Factors of New-Quality Productivity. Sustainability 2024, 16, 10852. [Google Scholar] [CrossRef]
  10. Ma, Y. Entrepreneurs’ Spirit and Corporate Green Development: The Mediating Role of New-Quality Productivity. Sustainability 2024, 16, 7648. [Google Scholar] [CrossRef]
  11. Shan, Y.; Wen, Z.; Zhiqing, Y. Carbon Reduction Effect of Digital New Quality Productivity: Theoretical Analysis and Empirical Evidence. J. Environ. Earth Sci. 2025, 7, 47–66. [Google Scholar]
  12. Ahmed, N.; Khan, N.A.; Ober, J. The role of carbon peaking targets in urban green economic transition: Insights from U.S. city-level climate action plans. Glob. Transit. 2025, 7, 69–80. [Google Scholar]
  13. D'Amato, D.; Korhonen, J. Integrating the green economy, circular economy and bioeconomy in a strategic sustainability framework. Ecol. Econ. 2021, 188, 107143. [Google Scholar]
  14. Shobande, O.A.; Ogbeifun, L.; Tiwari, A.K. Extricating the impacts of emissions trading system and energy transition on carbon intensity. Appl. Energy 2024, 357, 122461. [Google Scholar]
  15. Chen, D.; Liao, H.; Tan, H. Can carbon trading policy boost upgrading and optimization of industrial structure? An empirical study based on data from China. Humanit. Soc. Sci. Commun. 2024, 11, 1234. [Google Scholar]
  16. Harris, J.L.; Sunley, P. Multi-system dynamics in regional path upgrading: The intra- and inter-path dynamics of green industrial transitions in the Solent marine and maritime pathway. Prog. Econ. Geogr. 2023, 1, 100005. [Google Scholar]
  17. Zhu, Q.; Liu, C.; Li, X.; Zhou, D. The total factor carbon emission productivity in China’s industrial Sectors: An analysis based on the global Malmquist-Luenberger index. Sustain. Energy Technol. Assess. 2023, 56, 103094. [Google Scholar]
  18. Chang, T.-P.; Hu, J.-L. Total-factor energy productivity growth, technical progress, and efficiency change: An empirical study of China. Appl. Energy 2010, 87, 3262–3270. [Google Scholar]
  19. Kumar, S.; Jain, R.K. Carbon-sensitive meta-productivity growth and technological gap: An empirical analysis of Indian thermal power sector. Energy Econ. 2019, 81, 104–116. [Google Scholar] [CrossRef]
  20. Ladu, M.G.; Meleddu, M. Is there any relationship between energy and TFP (total factor productivity)? A panel cointegration approach for Italian regions. Energy 2014, 75, 560–567. [Google Scholar] [CrossRef]
  21. Duran, H.E. Asymmetries in regional development: Does TFP or capital accumulation matter for spatial inequalities? J. Econ. Asymmetries 2019, 20, e00119. [Google Scholar]
  22. Asafu-Adjaye, J.; Mahadevan, R. Implications of CO2 reduction policies for a high carbon emitting economy. Energy Econ. 2013, 38, 32–41. [Google Scholar]
  23. Hassan, T.; Khan, Y.; He, C.; Chen, J.; Alsagr, N.; Song, H.; Naveed, k. Environmental regulations, political risk and consumption-based carbon emissions: Evidence from OECD economies. J. Environ. Manag. 2022, 320, 115893. [Google Scholar]
  24. Feroz, A.K.; Zo, H.; Chiravuri, A. Digital Transformation and Environmental Sustainability: A Review and Research Agenda. Sustainability 2021, 13, 1530. [Google Scholar] [CrossRef]
  25. Kovacikova, M.; Janoskova, P.; Kovacikova, K. The Impact of Emissions on the Environment within the Digital Economy. Transp. Res. Procedia 2021, 55, 1090–1097. [Google Scholar]
  26. Lai, P.; Du, M.; Wang, B.; Chen, Z. Assessment and Decomposition of Total Factor Energy Efficiency: An Evidence Based on Energy Shadow Price in China. Sustainability 2016, 8, 408. [Google Scholar] [CrossRef]
  27. Yu, X.; Zeng, Z. Impact of heterogeneous environmental regulation on total factor productivity: An empirical study based on China’s provincial data. Environ. Dev. Sustain. 2024, 26, 17813–17835. [Google Scholar]
  28. Mai, Q.; Bai, M.; Li, L. Study on the Dynamic Evolution and Regional Differences of the Level of High-Quality Economic and Social Development in China. Sustainability 2023, 15, 382. [Google Scholar]
  29. Sheng, Z.; Zhu, C.; Chen, M. Exploring the Impact of the Digital Economy on Green Total Factor Productivity—Evidence from Chinese Cities. Sustainability 2024, 16, 2734. [Google Scholar] [CrossRef]
  30. Zeng, P.; Wang, Y.; Tian, Z. Regional differences, source decomposition and formation mechanism of urban digital economy and energy market integration in China. J. Clean. Prod. 2024, 451, 141960. [Google Scholar]
  31. Lin, L.; Gu, T.; Shi, Y. The Influence of New Quality Productive Forces on High-Quality Agricultural Development in China: Mechanisms and Empirical Testing. Agriculture 2024, 14, 1022. [Google Scholar] [CrossRef]
  32. Lee, C.-C.; Wang, F.; Lou, R. Digital financial inclusion and carbon neutrality: Evidence from non-linear analysis. Resour. Policy 2022, 79, 102974. [Google Scholar]
  33. Carraro, C.; Favero, A.; Massetti, E. “Investments and public finance in a green, low carbon, economy”. Energy Econ. 2012, 34, S15–S28. [Google Scholar]
  34. Eren, B.M.; Taspinar, N.; Gokmenoglu, K.K. The impact of financial development and economic growth on renewable energy consumption: Empirical analysis of India. Sci. Total Environ. 2019, 663, 189–197. [Google Scholar]
  35. Campiglio, E. Beyond carbon pricing: The role of banking and monetary policy in financing the transition to a low-carbon economy. Ecol. Econ. 2016, 121, 220–230. [Google Scholar]
  36. Charfeddine, L.; Kahia, M. Impact of renewable energy consumption and financial development on CO2 emissions and economic growth in the MENA region: A panel vector autoregressive (PVAR) analysis. Renew. Energy 2019, 139, 198–213. [Google Scholar]
  37. Yang, T.; Sun, Z.; Du, M.; Du, Q.; Li, L.; Shuwaikh, F. The impact of the degree of coupling coordination between green finance and environmental regulations on firms’ innovation performance: Evidence from China. Ann. Oper. Res. 2023. [Google Scholar] [CrossRef]
  38. Cook, W.D.; Seiford, L.M. Data envelopment analysis (DEA)—Thirty years on. Eur. J. Oper. Res. 2009, 192, 1–17. [Google Scholar]
  39. Ayres, R.U.; Williams, E. The digital economy: Where do we stand? Technol. Forecast. Soc. Change 2004, 71, 315–339. [Google Scholar]
  40. Janowski, T. Implementing Sustainable Development Goals with Digital Government—Aspiration-capacity gap. Gov. Inf. Q. 2016, 33, 603–613. [Google Scholar]
  41. Qian, J.; Zhou, Y.; Hao, Q. The effect and mechanism of digital economy on green total factor productivity—Empirical evidence from China. J. Environ. Manag. 2024, 372, 123237. [Google Scholar]
  42. Karki, T.K.; Tao, L. How accessible and convenient are the public bicycle sharing programs in China? Experiences from Suzhou city. Habitat Int. 2016, 53, 188–194. [Google Scholar]
  43. Anagnostopoulos, A.; Navarro, M.E.; Stefanidou, M.; Seferlis, P.; Gaidajis, G.; Ding, Y. Effect of carbon on the performance of red mud-molten salt composites for thermal management and waste heat recovery applications. J. Energy Storage 2021, 44, 103363. [Google Scholar]
  44. Dhir, A.; Koshta, N.; Goyal, R.K.; Sakashita, M.; Almotairi, M. Behavioral reasoning theory (BRT) perspectives on E-waste recycling and management. J. Clean. Prod. 2021, 280, 124269. [Google Scholar]
  45. Chen, B.; Tan, D. Industrial Robots and the Employment Quality of Migrant Workers in the Manufacturing Industry. Sustainability 2023, 15, 7998. [Google Scholar] [CrossRef]
  46. Albrizio, S.; Kozluk, T.; Zipperer, V. Environmental policies and productivity growth: Evidence across industries and firms. J. Environ. Econ. Manag. 2017, 81, 209–226. [Google Scholar]
  47. Wang, S.; Song, Y.; Min Du, A.; Liang, J. The digital economy and entrepreneurial dynamics: An empirical analysis of urban regions in China. Res. Int. Bus. Financ. 2024, 71, 102459. [Google Scholar]
  48. Levy, F. Computers and populism: Artificial intelligence, jobs, and politics in the near term. Oxf. Rev. Econ. Policy 2018, 34, 393–417. [Google Scholar]
  49. Xiaoping, Z.; Yuanfang, L.; Wenjia, W. Evaluation of urban resource and environmental efficiency in China based on the DEA model. J. Resour. Ecol. 2014, 5, 11–19. [Google Scholar]
  50. Wang, S.; Wang, A.; Liu, S.; Zhang, C.; Qiao, L.; Li, X. Research on the coupling coordination relationship between the digital economy and high-quality energy development: Evidence from China. Heliyon 2024, 10, e24637. [Google Scholar]
  51. Guo, J.; Zhao, X.; Fu, Y. Green finance, technological innovation, and low-carbon development in logistics industry: Mechanisms and threshold effects. Environ. Dev. Sustain. 2025. [Google Scholar] [CrossRef]
  52. Lin, B.; Sun, A.; Xie, Y. Digital transformation and green total factor productivity of heavy pollution enterprises: Impact, mechanism and spillover effect. J. Environ. Manag. 2025, 373, 123619. [Google Scholar]
  53. Zhao, C. Is low-carbon energy technology a catalyst for driving green total factor productivity development? The case of China. J. Clean. Prod. 2023, 428, 139507. [Google Scholar]
  54. Chen, H.; Yi, J.; Chen, A.; Peng, D.; Yang, J. Green technology innovation and CO2 emission in China: Evidence from a spatial-temporal analysis and a nonlinear spatial durbin model. Energy Policy 2023, 172, 113338. [Google Scholar] [CrossRef]
  55. Wang, L.; Wang, H.; Cao, Z.; He, Y.; Dong, Z.; Wang, S. Can industrial intellectualization reduce carbon emissions?—Empirical evidence from the perspective of carbon total factor productivity in China. Technol. Forecast. Soc. Change 2022, 184, 121969. [Google Scholar]
  56. Xu, Q.; Dong, Y. How digital technology contributes to the low-carbon transformation of industries—A segmentation perspective based on three major industries. Environ. Dev. Sustain. 2024. [Google Scholar] [CrossRef]
  57. Li, J.; Noorliza, K.; Zhang, X. Enhancing Environmental, Social, and Governance Performance through New Quality Productivity and Green Innovation. Sustainability 2024, 16, 4843. [Google Scholar] [CrossRef]
  58. Du, M.; Zhang, J.; Hou, X. Decarbonization like China: How does green finance reform and innovation enhance carbon emission efficiency? J. Environ. Manag. 2025, 376, 124331. [Google Scholar]
  59. Chintrakarn, P. Environmental regulation and U.S. states' technical inefficiency. Econ. Lett. 2008, 100, 363–365. [Google Scholar] [CrossRef]
Figure 1. CTFP results from 2012 to 2022. (a) Thermal chart of CTFP measurement results of 30 provinces and cities; (b) the line chart of carbon TFP measurement results of four regions.
Sustainability 17 03137 g001
Figure 2. Trends of NQPFs in four regions of China. (a) Description of the eastern region; (b) description of the central region; (c) description of the western region; (d) description of the northeastern region.
Sustainability 17 03137 g002
Figure 3. Changes in the level of industrial optimization.
Sustainability 17 03137 g003
Figure 4. Results of changes in coupling and coordination degrees of the four regions. (a) Description of the overall perspective; (b) description of the eastern region; (c) description of the central region; (d) description of the western region; € description of the northeastern region.
Sustainability 17 03137 g004
Figure 5. Estimation results of the kernel density of the coupling coordination degree of the four regions. (a) Description of the eastern region; (b) description of the central region; (c) description of the western region; (d) description of the northeastern region.
Sustainability 17 03137 g005
Figure 6. Moran’s I index results. (a) Description of the results for the year 2012; (b) description of the results for the year 2022.
Sustainability 17 03137 g006
Table 1. NQPF index system.
CategoriesPrimary IndicatorSecondary IndicatorDetailed DescriptionAttribute
LaborersInvestment in New Quality Human CapitalInvestment in Science and TechnologyAnnual Fiscal Expenditure for Scientific and Technological InnovationPositive
Education InvestmentAnnual Fiscal Expenditure on EducationPositive
Investment in Scientific and Technological PersonnelFull-Time Equivalent of R&D Personnel in Industrial Enterprises above Designated SizePositive
Advanced Production LevelLabor Productivity of Industrial Enterprises above Designated SizePositive
Higher Education LevelTotal Number of Students Enrolled in Colleges and AbovePositive
Means of LaborEnergy Consumption LevelEnergy Consumption Intensity Total Energy Consumption/GDPNegative
Degree of Digital Infrastructure DevelopmentInternet Penetration RateInternet Broadband Access SubscribersPositive
Mobile Phone Penetration RateNumber of Mobile Phones per 100 PeoplePositive
Telecom Business Penetration RateTotal Telecom Business per CapitaPositive
Software Business Penetration RateSoftware Business RevenuePositive
Digital InfrastructureLength of Optical Cable Lines/Regional AreaPositive
Level of Robot ApplicationPopularization Rate of Industrial RobotsInstalled Capacity of Robots× Employment RatePositive
Level of Digital InnovationDigital Innovation CapabilityInnovation Funding of Industrial Enterprises above Designated SizePositive
Digital Economy IndexPositive
Number of Patent Authorizations/Total PopulationPositive
Objects of LaborEnvironmental ProtectionPollution ReductionIndustrial SO2 Emissions/GDPNegative
Fiscal Expenditure on Environmental Protection/Government Fiscal ExpenditurePositive
Green ResourcesForest Coverage RateForest Coverage RatePositive
Green InnovationGreen Invention AchievementsNumber of Green Patent Applications/Number of Patent ApplicationsPositive
Table 2. Classification of coupling coordination degree.
Stage of Coupling CoordinationLevel of Coupling Coordination
High Coordination0.8 < D ≤ 1.0
Moderate Coordination0.6 < D ≤ 0.8
Basic Coordination0.4 < D ≤ 0.6
Moderate Imbalance0.2 < D ≤ 0.4
Extreme Imbalance0.0 ≤ D ≤ 0.2
Table 3. Descriptive statistics of factors affecting Carbon Total Factor Productivity.
VariableObsMeanStd. Dev.MinMax
IE3309.1180.6267.32510.486
IV3308.8290.9796.17810.791
CO23301.7131.1370.1855.837
ER3300.1050.1210.0011.103
GTI3306.0225.1870.00120.910
Table 4. Regression results affecting Carbon Total Factor Productivity.
Variable(1)(2)(3)
ER−0.296 **−0.257 **−0.227 *
(−2.185)(−2.097)(−1.838)
IE0.0680.0110.001 *
(0.896)(1.632)(1.852)
CO2−0.265 ***−0.244 ***−0.267 ***
(−6.671)(−6.815)(−7.279)
CO20.005 ***0.005 ***0.004 ***
(10.36)(10.92)(7.006)
GTI0.079 ***0.078 ***0.081 ***
(7.398)(8.113)(8.305)
Constant0.604 ***0.471 ***0.615 ***
(4.728)(3.797)(4.687)
Individual effect
Time effect
Observations330286253
R-squared0.5480.6140.563
Note: *, **, and *** indicate significance at the levels of 10%, 5%, and 1%, respectively. The symbol “√” indicates that the effect has been controlled in the result.
Table 5. Descriptive statistics of factors affecting New Quality Productive Forces.
VariableObsMeanStd. dev.MinMax
Structure3301.3881690.75038310.61121025.24401
PGDP33010.90780.44460389.84939312.15472
IL3300.06122950.05478150.01514350.2900732
HT3302.2331710.09204082.0167352.540115
GF3300.32931670.1253550.09039520.6317453
Table 6. Regression results affecting New Quality Productive Forces.
Variable(1)(2)(3)
Structure0.0237 ***0.0168 **0.0285 *
(2.608)(2.051)(1.714)
PGDP0.124 ***0.142 ***0.154 ***
(8.357)(9.281)(3.864)
IL0.746 ***0.720 ***0.902 ***
(16.81)(15.62)(19.50)
HT−0.0873−0.1230.141
(−0.929)(−1.560)(0.661)
GF0.232 ***0.166 ***0.207 **
(4.052)(3.423)(2.108)
Constant−1.141 ***−1.216 ***−1.995 ***
(−7.698)(−7.673)(−4.856)
Individual effect
Time effect
Observations33024090
R-squared0.7670.8400.930
Note: *, **, and *** indicate significance at the levels of 10%, 5%, and 1%, respectively. The symbol “√” indicates that the effect has been controlled in the result.
Table 7. Decomposition results of Gini coefficient (overall Gini coefficient and intra-regional differences).
YearOverall Gini CoefficientDifferences Within the Region
East (E)Central (C)West (W)Northeast (N)
20120.0590.0490.0420.0390.005
20130.0630.0530.0400.0440.009
20140.0640.0560.0330.0440.011
20150.0660.0580.0320.0430.014
20160.0700.0590.0300.0510.010
20170.0660.0620.0170.0420.012
20180.0620.0600.0120.0380.011
20190.0560.0570.0110.0280.014
20200.0540.0570.0080.0250.016
20210.0920.0810.0240.0530.023
20220.0970.0860.0310.0570.015
Table 8. Decomposition results of Gini coefficient (inter-regional differences and contribution rates).
YearDifferences Between RegionsRate of Contribution (%)
E—CE—WE—NC—WC—NW—N G w G n b G t
20120.0790.0840.0710.0420.0330.03121.5859.2819.14
20130.0820.0910.0760.0440.0320.03521.8860.7917.33
20140.0830.0960.0810.0410.0260.03421.5065.1013.41
20150.0870.0970.0920.0390.0290.03521.2764.8513.88
20160.0880.1010.1040.0440.0340.04321.4765.4413.09
20170.0850.1000.1090.0340.0280.03820.8370.338.84
20180.0890.0850.1130.0290.0300.04220.6869.539.79
20190.0820.0720.1090.0250.0310.04620.1072.867.04
20200.0800.0680.1090.0230.0320.05019.7173.946.34
20210.1090.1410.1500.0530.0520.04419.8272.737.45
20220.1120.1510.1530.0610.0530.04319.9472.737.33
Table 9. Moran’s I index results of coupling coordination degree between NQPFs and CTFP.
YearMoran’s IZPYearMoran’s IZP
20120.1903.1580.00220180.2824.5400.000
20130.1953.2490.00120190.2614.2520.000
20140.2463.9820.00020200.2454.0170.000
20150.2884.5980.00020210.3585.6200.000
20160.2904.6150.00020220.3595.6310.000
20170.2914.6770.000
Table 10. Absolute β-convergence result of coupling coordination degree.
VariableOverallEastCentralWestNortheast
β−0.306 ***
(−6.16)
−0.052
(−0.88)
−0.132 **
(−1.76)
−0.089 *
(−1.83)
−0.592 ***
(−3.09)
ρ0.533 ***
(5.70)
−0.134
(−0.68)
0.768 ***
(12.58)
0.842 ***
(22.68)
−0.752 ***
(−4.07)
Convergence rate s (%)3.67 1.410.939.00
Half-life (Year)18.88 49.1574.537.70
ResultConvergeDivergeConvergeConvergeConverge
Note: *, **, and *** indicate significance at the levels of 10%, 5%, and 1%, respectively.
Table 11. Conditional β convergence results of coupling coordination degree.
VariableOverallEastCentralWestNortheast
β−0.376 ***
(−7.21)
−0.117
(−1.43)
−0.405 ***
(−3.51)
−0.378 ***
(−4.41)
−0.344 **
(−2.09)
ρ0.488 ***
(4.94)
−0.129
(−0.64)
0.523 ***
(4.46)
0.817 ***
(17.92)
0.603 ***
(6.31)
Convergence rate s (%)4.74 5.184.774.22
Half-life (Year)14.62 13.3814.5216.42
ResultConvergeDivergeConvergeConvergeConverge
Note: ** and *** indicate significance at the levels of 5% and 1%, respectively.
Disclaimer/Publisher’s Note: The statements, opinions and data contained in all publications are solely those of the individual author(s) and contributor(s) and not of MDPI and/or the editor(s). MDPI and/or the editor(s) disclaim responsibility for any injury to people or property resulting from any ideas, methods, instructions or products referred to in the content.

