
Evaluating the Interactive and Transformative Role of Innovation, Education, Human Capital and Natural Resources Policies in Protecting and Sustaining Environmental Sustainability


Abstract
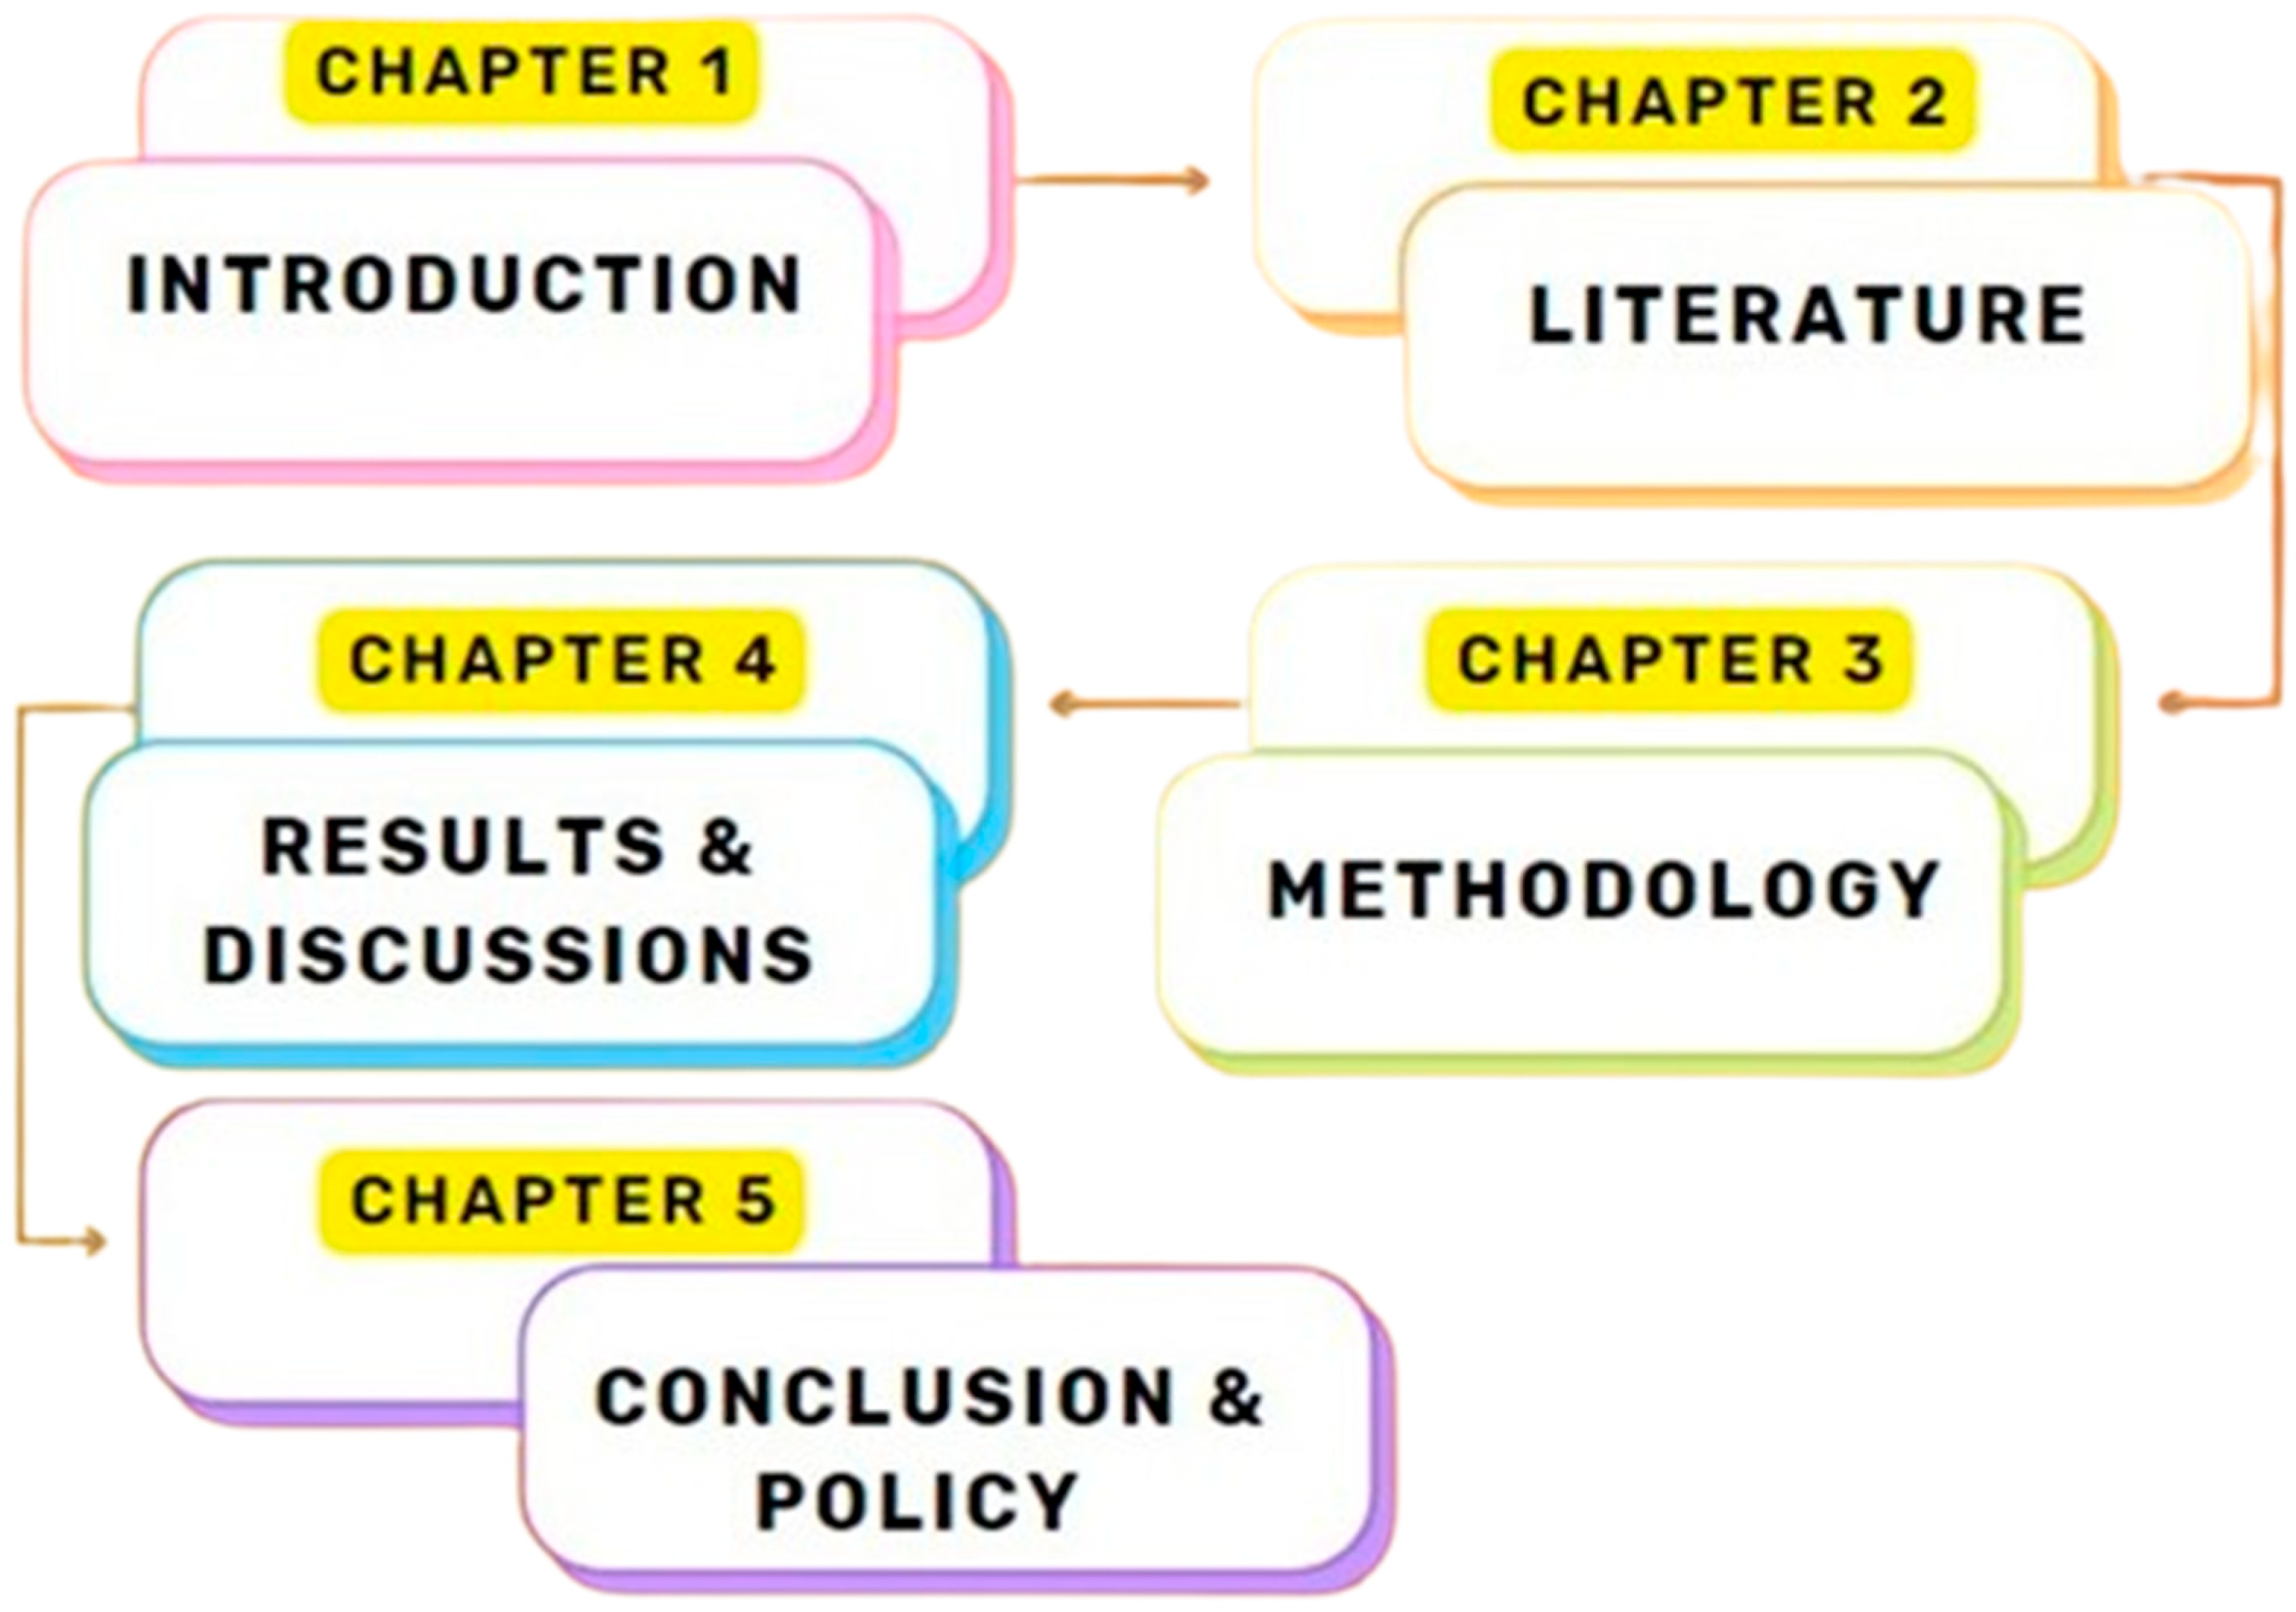
1. Introduction
- How does TLI impact the environmental quality of G20 nations?
- Do human capital and education contribute to improving the environmental quality of G20 nations?
- What roles do globalization and urbanization play in influencing the environmental quality of G20 countries?
- Do natural resource extraction and usage contribute to environmental deterioration in G20 countries?
- How far are G20 countries from achieving the SDGs set by the UN?
2. Literature Review
2.1. Human Capital and Environmental Quality Nexus
2.2. Technological Innovation and Environmental Quality Nexus
2.3. Education and Environmental Quality Nexus
2.4. Globalization and Environmental Quality Nexus
2.5. Natural Resources and Environmental Quality Nexus
2.6. Urbanization and Environmental Quality Nexus
2.7. Research Gap
3. Methodology
3.1. Data Collection & Study Setting
3.2. Econometric Model
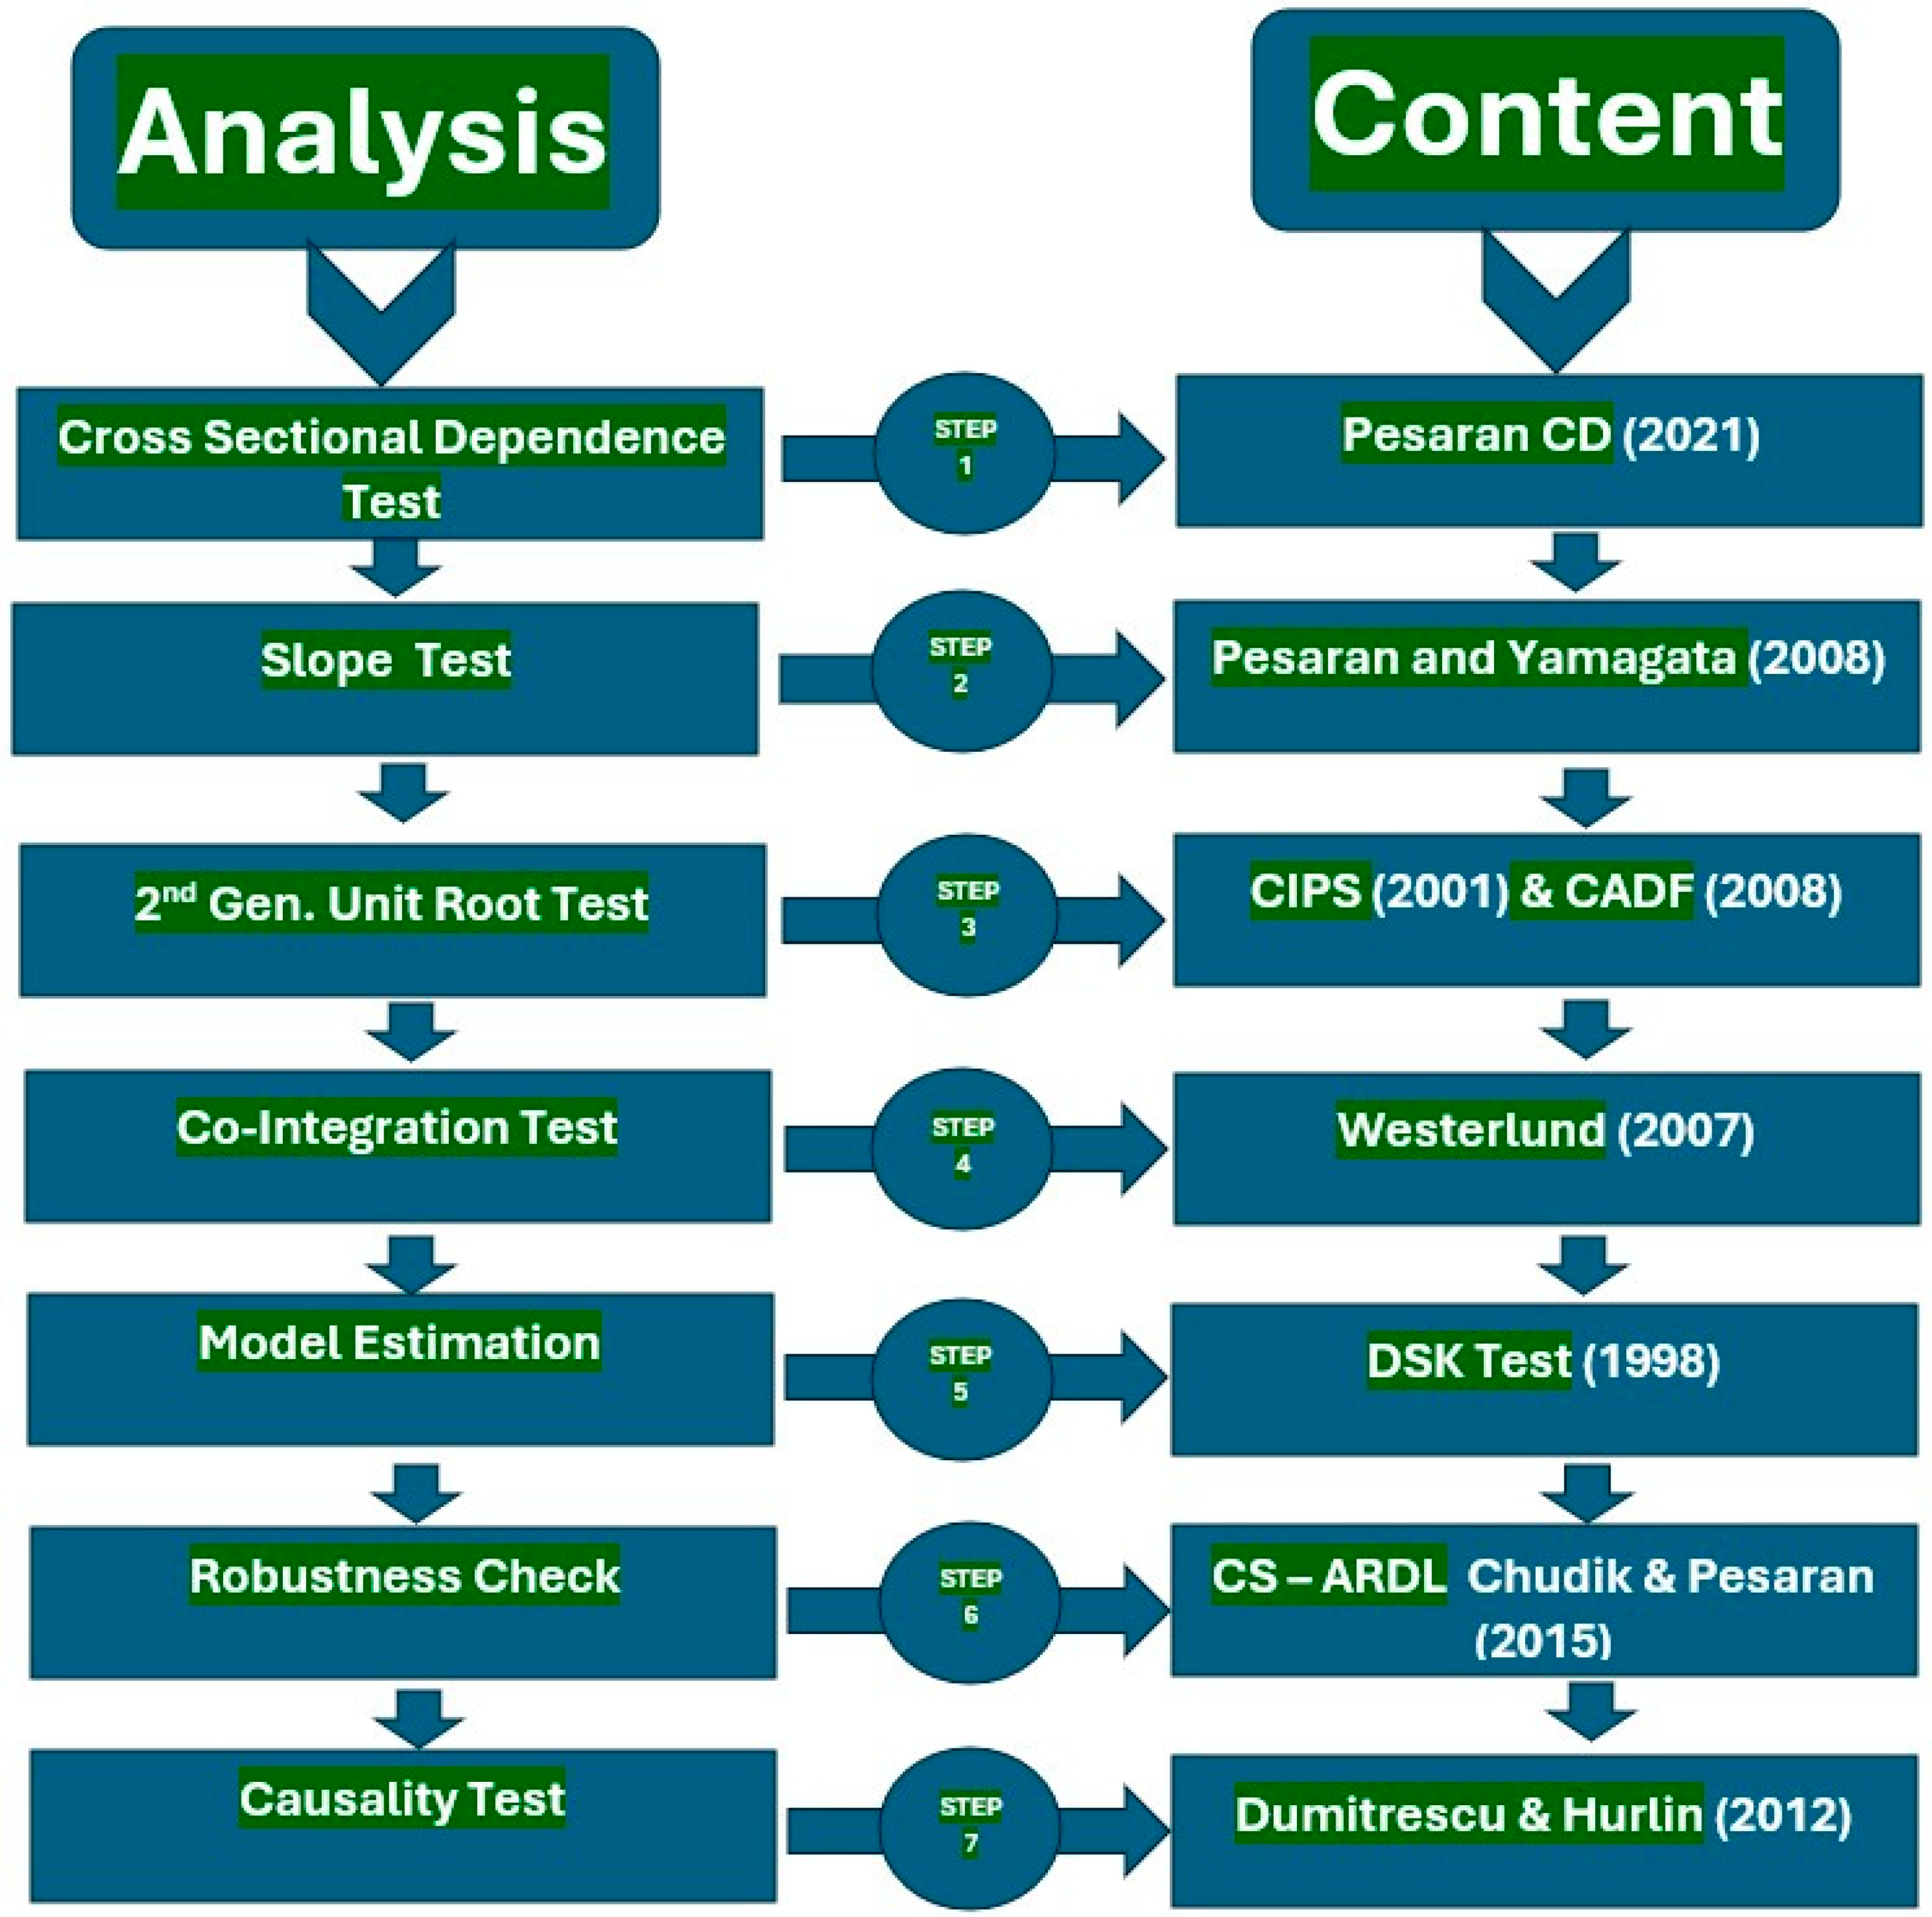
3.3. Econometric Approaches
3.3.1. Pesaran Cross-Sectional Dependence (PCD)
3.3.2. Slope Homogeneity Test
3.3.3. Unit Root Tests
3.3.4. Co-Integration Test
3.3.5. Regression Estimation Through DKSE
3.3.6. Robustness Test
3.3.7. Panel Causality Test
4. Results
4.1. Descriptive Assessment of Study Variables
4.2. Outcomes of Cross-Sectional and Slope Test
4.3. Outcomes of CIPS and CADF
4.4. Outcome of Westerlund Co-Integration (WLCT)
4.5. Results of DKSE
4.6. Discussions
4.7. Robustness Results of CS-ARDL
4.8. Outcomes of Dumitrescu Hurlin Causality Test (DHCT)
5. Conclusions and Policy Implications
5.1. Policy Recommendations
- As technological innovation (TLI) negatively impacts the ecological footprint (EFT), policymakers should promote eco-friendly technological advancements by investing in green research and innovation while encouraging industries to adopt cleaner production methods.
- Since globalization (GLN) contributes to rising EFT through increased trade and transportation, regulatory authorities must implement stricter environmental policies, such as carbon taxes and emission regulations, to reduce its adverse effects.
- As urbanization (URZ) intensifies environmental degradation, governments should integrate sustainable urban planning by enhancing public transportation, expanding green spaces, and promoting energy-efficient infrastructure.
- Given that natural resource exploitation (NTS) significantly increases EFT, policymakers should enforce responsible extraction policies, invest in renewable alternatives, and encourage circular economy practices to minimize environmental harm.
- Since education (EDU) and human capital (HMC) are associated with reduced EFT, authorities should integrate environmental awareness into educational curricula, provide incentives for green skill development, and promote sustainability-driven workforce training.
- To address the environmental impact of trade and transport, international organizations should mandate the adoption of cleaner technologies in shipping, aviation, and logistics while supporting carbon-neutral supply chains.
- As environmental challenges require global collaboration, G20 nations should strengthen international partnerships, share best practices, and implement unified sustainability policies to achieve long-term ecological balance.
5.2. Study Limitations & Recommendations
Author Contributions
Funding
Institutional Review Board Statement
Informed Consent Statement
Data Availability Statement
Conflicts of Interest
Abbreviations
| Abbreviation | Full form | Abbreviation | Full form |
| AIC | The Akaike Information Criterion | GLN | Globalization |
| BIC | Bayesian Information Criterion | HMC | Human Capital |
| CDT | Cross Sectional Dependence Test | NTS | Natural Resources |
| DHCT | Dumitrescu Hurlin Causality Test | PCD | Pesaran Cross Sectional Dependence |
| DKSE | Driscoll and Kraay Standard Error | PWT | Penn World Tables |
| EDU | Education | SLT | Slope Homogeneity |
| EFT | Ecological Footprints | TLI | Technological Innovation |
| EKC | Environmental Kuznets Curve | URZ | Urbanization |
| ENQ | Environmental Quality | WIPO | World Intellectual Property Organization |
| SSD | Sustainable Development | WLCT | Westerlund Co-integration |
References
- Wackernagel, M.; Schulz, N.B.; Deumling, D.; Linares, A.C.; Jenkins, M.; Kapos, V.; Monfreda, C.; Loh, J.; Myers, N.; Norgaard, R.; et al. Tracking the Ecological Overshoot of the Human Economy. Proc. Natl. Acad. Sci. USA 2002, 99, 9266–9271. [Google Scholar] [CrossRef] [PubMed]
- Ahmed, Z.; Wang, Z. Investigating the Impact of Human Capital on the Ecological Footprint in India: An Empirical Analysis. Environ. Sci. Pollut. Res. 2019, 26, 26782–26796. [Google Scholar] [CrossRef]
- Rashid, A.; Irum, A.; Malik, I.A.; Ashraf, A.; Rongqiong, L.; Liu, G.; Ullah, H.; Ali, M.U.; Yousaf, B. Ecological Footprint of Rawalpindi; Pakistan’s First Footprint Analysis from Urbanization Perspective. J. Clean. Prod. 2018, 170, 362–368. [Google Scholar] [CrossRef]
- Poumanyvong, P.; Kaneko, S. Does Urbanization Lead to Less Energy Use and Lower CO2 Emissions? A Cross-Country Analysis. Ecol. Econ. 2010, 70, 434–444. [Google Scholar] [CrossRef]
- United Nations World Urbanization Prospects—Population Division; United Nations: New York, NY, USA, 2019.
- Ahmed, Z.; Wang, Z.; Mahmood, F.; Hafeez, M.; Ali, N. Does Globalization Increase the Ecological Footprint? Empirical Evidence from Malaysia. Environ. Sci. Pollut. Res. 2019, 26, 18565–18582. [Google Scholar] [CrossRef]
- Zhang, S.; Zhang, C.; Su, Z.; Zhu, M.; Ren, H. New Structural Economic Growth Model and Labor Income Share. J. Bus. Res. 2023, 160, 113644. [Google Scholar] [CrossRef]
- Ali, R.; Bakhsh, K.; Yasin, M.A. Impact of Urbanization on CO2 Emissions in Emerging Economy: Evidence from Pakistan. Sustain. Cities Soc. 2019, 48, 101553. [Google Scholar] [CrossRef]
- Nuta, F.; Shahbaz, M.; Khan, I.; Cutcu, I.; Khan, H.; Eren, M.V. Dynamic Impact of Demographic Features, FDI, and Technological Innovations on Ecological Footprint: Evidence from European Emerging Economies. Environ. Sci. Pollut. Res. 2024, 31, 18683–18700. [Google Scholar] [CrossRef]
- Chankrajang, T.; Muttarak, R. Green Returns to Education: Does Schooling Contribute to Pro-Environmental Behaviours? Evidence from Thailand. Ecol. Econ. 2017, 131, 434–448. [Google Scholar] [CrossRef]
- Keengwe, J.; Nyatuka, B.O. Climate Change Education for Sustainable Development; IGI Global: Hershey, PA, USA, 2023; ISBN 9781668491003. [Google Scholar]
- Zen, I.S.; Noor, Z.Z.; Yusuf, R.O. The Profiles of Household Solid Waste Recyclers and Non-Recyclers in Kuala Lumpur, Malaysia. Habitat Int. 2014, 42, 83–89. [Google Scholar] [CrossRef]
- Desha, C.; Robinson, D.; Sproul, A. Working in Partnership to Develop Engineering Capability in Energy Efficiency. J. Clean. Prod. 2015, 106, 283–291. [Google Scholar] [CrossRef]
- Haque, S.; Salman, M.; Rahman, M.S.; Rahim, A.T.M.A.; Hoque, M.N. Mothers’ Dietary Diversity and Associated Factors in Megacity Dhaka, Bangladesh. Heliyon 2023, 9, e19117. [Google Scholar] [CrossRef] [PubMed]
- Zhang, S.; Li, X.; Zhang, C.; Luo, J.; Cheng, C.; Ge, W. Measurement of Factor Mismatch in Industrial Enterprises with Labor Skills Heterogeneity. J. Bus. Res. 2023, 158, 113643. [Google Scholar] [CrossRef]
- Xing, W.; Imran, A. Financial and Technological Drivers of Sustainable Development: The Role of Communication Technology, Financial Efficiency and Education in BRICS. Sustainability 2025, 17, 2326. [Google Scholar] [CrossRef]
- Charfeddine, L. The Impact of Energy Consumption and Economic Development on Ecological Footprint and CO2 Emissions: Evidence from a Markov Switching Equilibrium Correction Model. Energy Econ. 2017, 65, 355–374. [Google Scholar] [CrossRef]
- Qin, F.; Imran, A. Greening the Gulf: A Deep-Dive into the Synergy Between Natural Resources, Institutional Quality, Foreign Direct Investment, and Pathways to Environmental Sustainability. Sustainability 2024, 16, 11250. [Google Scholar] [CrossRef]
- Al-Mulali, U.; Ozturk, I. The Effect of Energy Consumption, Urbanization, Trade Openness, Industrial Output, and the Political Stability on the Environmental Degradation in the MENA (Middle East and North African) Region. Energy 2015, 84, 382–389. [Google Scholar] [CrossRef]
- Bano, S.; Zhao, Y.; Ahmad, A.; Wang, S.; Liu, Y. Identifying the Impacts of Human Capital on Carbon Emissions in Pakistan. J. Clean. Prod. 2018, 183, 1082–1092. [Google Scholar] [CrossRef]
- Ahmed, Z.; Zafar, M.W.; Ali, S. Danish Linking Urbanization, Human Capital, and the Ecological Footprint in G7 Countries: An Empirical Analysis. Sustain. Cities Soc. 2020, 55, 102064. [Google Scholar] [CrossRef]
- Sinha, A.; Sengupta, T.; Alvarado, R. Interplay between Technological Innovation and Environmental Quality: Formulating the SDG Policies for next 11 Economies. J. Clean. Prod. 2020, 242, 118549. [Google Scholar] [CrossRef]
- Adebayo, T.S.; Kartal, M.T.; Ağa, M.; Al-Faryan, M.A.S. Role of Country Risks and Renewable Energy Consumption on Environmental Quality: Evidence from MINT Countries. J. Environ. Manag. 2023, 327, 116884. [Google Scholar] [CrossRef] [PubMed]
- Mujtaba, A.; Jena, P.K.; Bekun, F.V.; Sahu, P.K. Symmetric and Asymmetric Impact of Economic Growth, Capital Formation, Renewable and Non-Renewable Energy Consumption on Environment in OECD Countries. Renew. Sustain. Energy Rev. 2022, 160, 112300. [Google Scholar] [CrossRef]
- Afshan, S.; Yaqoob, T. The Potency of Eco-Innovation, Natural Resource and Financial Development on Ecological Footprint: A Quantile-ARDL-Based Evidence from China. Environ. Sci. Pollut. Res. 2022, 29, 50675–50685. [Google Scholar] [CrossRef] [PubMed]
- Anwar, A.; Chaudhary, A.R.; Malik, S. Modeling the Macroeconomic Determinants of Environmental Degradation in E-7 Countries: The Role of Technological Innovation and Institutional Quality. J. Public Aff. 2023, 23, e2834. [Google Scholar] [CrossRef]
- Celik, A.; Alola, A.A. Capital Stock, Energy, and Innovation-Related Aspects as Drivers of Environmental Quality in High-Tech Investing Economies. Environ. Sci. Pollut. Res. 2023, 30, 37004–37016. [Google Scholar] [CrossRef]
- Ozturk, I.; Razzaq, A.; Sharif, A.; Yu, Z. Investigating the Impact of Environmental Governance, Green Innovation, and Renewable Energy on Trade-Adjusted Material Footprint in G20 Countries. Resour. Policy 2023, 86, 104212. [Google Scholar] [CrossRef]
- Akram, R.; Ibrahim, R.L.; Wang, Z.; Adebayo, T.S.; Irfan, M. Neutralizing the Surging Emissions amidst Natural Resource Dependence, Eco-Innovation, and Green Energy in G7 Countries: Insights for Global Environmental Sustainability. J. Environ. Manag. 2023, 344, 118560. [Google Scholar] [CrossRef]
- Liu, T.; Imran, A. Green Economy Advancement: Evaluating the Role of Digitalization, Technological Innovation, and Natural Resources in Shaping Environmental Quality Amid Globalizations. Sustainability 2024, 16, 10673. [Google Scholar] [CrossRef]
- Zhao, X.; Adebayo, T.S.; Kong, X.; Al-Faryan, M.A.S. Relating Energy Innovations and Natural Resources as Determinants of Environmental Sustainability: The Role of Globalization in G7 Countries. Resour. Policy 2022, 79, 103073. [Google Scholar] [CrossRef]
- Khan, I.; Hou, F.; Irfan, M.; Zakari, A.; Le, H.P. Does Energy Trilemma a Driver of Economic Growth? The Roles of Energy Use, Population Growth, and Financial Development. Renew. Sustain. Energy Rev. 2021, 146, 111157. [Google Scholar] [CrossRef]
- Balsalobre-Lorente, D.; Abbas, J.; He, C.; Pilař, L.; Shah, S.A.R. Tourism, Urbanization and Natural Resources Rents Matter for Environmental Sustainability: The Leading Role of AI and ICT on Sustainable Development Goals in the Digital Era. Resour. Policy 2023, 82, 103445. [Google Scholar] [CrossRef]
- Dong, K.; Sun, R.; Hochman, G. Do Natural Gas and Renewable Energy Consumption Lead to Less CO2 Emission? Empirical Evidence from a Panel of BRICS Countries. Energy 2017, 141, 1466–1478. [Google Scholar] [CrossRef]
- Aladejare, S.A. Natural Resource Rents, Globalisation and Environmental Degradation: New Insight from 5 Richest African Economies. Resour. Policy 2022, 78, 102909. [Google Scholar] [CrossRef]
- Barak, D.; Kocoglu, M.; Jahanger, A.; Tan, M. Testing the EKC Hypothesis for Ecological and Carbon Intensity of Well-Being: The Role of Forest Extent. Sci. Total Environ. 2024, 945, 173794. [Google Scholar] [CrossRef]
- Nansai, K.; Tohno, S.; Chatani, S.; Kanemoto, K.; Kagawa, S.; Kondo, Y.; Takayanagi, W.; Lenzen, M. Consumption in the G20 Nations Causes Particulate Air Pollution Resulting in Two Million Premature Deaths Annually. Nat. Commun. 2021, 12, 6286. [Google Scholar] [CrossRef]
- Jia, Z.; Alharthi, M.; Haijun, T.; Mehmood, S.; Hanif, I. Relationship between Natural Resources, Economic Growth, and Carbon Emissions: The Role of Fintech, Information Technology and Corruption to Achieve the Targets of COP-27. Resour. Policy 2024, 90, 104751. [Google Scholar] [CrossRef]
- Charfeddine, L.; Mrabet, Z. The Impact of Economic Development and Social-Political Factors on Ecological Footprint: A Panel Data Analysis for 15 MENA Countries. Renew. Sustain. Energy Rev. 2017, 76, 138–154. [Google Scholar] [CrossRef]
- Ahmed, Z.; Wang, Z.; Ali, S. Investigating the Non-Linear Relationship between Urbanization and CO2 Emissions: An Empirical Analysis. Air Qual. Atmos. Health 2019, 12, 945–953. [Google Scholar] [CrossRef]
- Irfan, M.; Ullah, S.; Razzaq, A.; Cai, J.; Adebayo, T.S. Unleashing the Dynamic Impact of Tourism Industry on Energy Consumption, Economic Output, and Environmental Quality in China: A Way Forward towards Environmental Sustainability. J. Clean. Prod. 2023, 387, 135778. [Google Scholar] [CrossRef]
- Chishti, M.Z.; Sinha, A. Do the Shocks in Technological and Financial Innovation Influence the Environmental Quality? Evidence from BRICS Economies. Technol. Soc. 2022, 68, 101828. [Google Scholar] [CrossRef]
- Danish; Hassan, S.T.; Baloch, M.A.; Mahmood, N.; Zhang, J.W. Linking Economic Growth and Ecological Footprint through Human Capital and Biocapacity. Sustain. Cities Soc. 2019, 47, 101516. [Google Scholar] [CrossRef]
- Shahbaz, M.; Gozgor, G.; Hammoudeh, S. Human Capital and Export Diversification as New Determinants of Energy Demand in the United States. Energy Econ. 2019, 78, 335–349. [Google Scholar] [CrossRef]
- Zafar, M.W.; Zaidi, S.A.H.; Khan, N.R.; Mirza, F.M.; Hou, F.; Kirmani, S.A.A. The Impact of Natural Resources, Human Capital, and Foreign Direct Investment on the Ecological Footprint: The Case of the United States. Resour. Policy 2019, 63, 101428. [Google Scholar] [CrossRef]
- Dai, Y.; Tong, X.; Jia, X. Executives’ Legal Expertise and Corporate Innovation. Corp. Gov. Int. Rev. 2024, 32, 954–983. [Google Scholar] [CrossRef]
- Mehrara, M.; Rezaei, S.; Razi, D.H. Determinants of Renewable Energy Consumption among ECO Countries; Based on Bayesian Model Averaging and Weighted-Average Least Square. Int. Lett. Soc. Humanist. Sci. 2015, 54, 96–109. [Google Scholar] [CrossRef]
- Hadj, T.B. Effects of Corporate Social Responsibility towards Stakeholders and Environmental Management on Responsible Innovation and Competitiveness. J. Clean. Prod. 2020, 250, 119490. [Google Scholar] [CrossRef]
- Nathaniel, S.P. Biocapacity, Human Capital, and Ecological Footprint in G7 Countries: The Moderating Role of Urbanization and Necessary Lessons for Emerging Economies. Energy Ecol. Environ. 2021, 6, 435–450. [Google Scholar] [CrossRef]
- Lin, X.; Zhao, Y.; Ahmad, M.; Ahmed, Z.; Rjoub, H.; Adebayo, T.S. Linking Innovative Human Capital, Economic Growth, and CO2 Emissions: An Empirical Study Based on Chinese Provincial Panel Data. Int. J. Environ. Res. Public Health 2021, 18, 8503. [Google Scholar] [CrossRef]
- Li, P.; Ouyang, Y. The Dynamic Impacts of Financial Development and Human Capital on CO2 Emission Intensity in China: An Ardl Approach. J. Bus. Econ. Manag. 2019, 20, 939–957. [Google Scholar] [CrossRef]
- Tiwari, A.K.; Kocoglu, M.; Banday, U.J.; Awan, A. Hydropower, Human Capital, Urbanization and Ecological Footprints Nexus in China and Brazil: Evidence from Quantile ARDL. Environ. Sci. Pollut. Res. 2022, 29, 68923–68940. [Google Scholar] [CrossRef]
- Wang, J.; Xu, Y. Internet Usage, Human Capital and CO2 Emissions: A Global Perspective. Sustainability 2021, 13, 8268. [Google Scholar] [CrossRef]
- Amer, E.A.A.A.; Meyad, E.M.A.; Gao, Y.; Niu, X.; Chen, N.; Xu, H.; Zhang, D. Exploring the Link between Natural Resources, Urbanization, Human Capital, and Ecological Footprint: A Case of GCC Countries. Ecol. Indic. 2022, 144, 109556. [Google Scholar] [CrossRef]
- Zhao, S.; Guan, Y.; Zhou, H.; Hu, F. Making Digital Technology Innovation Happen: The Role of the CEO’s Information Technology Backgrounds. Econ. Model. 2024, 140, 106866. [Google Scholar] [CrossRef]
- Ma, Q.; Murshed, M.; Khan, Z. The Nexuses between Energy Investments, Technological Innovations, Emission Taxes, and Carbon Emissions in China. Energy Policy 2021, 155, 112345. [Google Scholar] [CrossRef]
- Luo, R.; Ullah, S.; Ali, K. Pathway towards Sustainability in Selected Asian Countries: Influence of Green Investment, Technology Innovations, and Economic Growth on CO2 Emission. Sustainability 2021, 13, 12873. [Google Scholar] [CrossRef]
- Jianguo, D.; Ali, K.; Alnori, F.; Ullah, S. The Nexus of Financial Development, Technological Innovation, Institutional Quality, and Environmental Quality: Evidence from OECD Economies. Environ. Sci. Pollut. Res. 2022, 29, 58179–58200. [Google Scholar] [CrossRef]
- Zhen, Z.; Ullah, S.; Shaowen, Z.; Irfan, M. How Do Renewable Energy Consumption, Financial Development, and Technical Efficiency Change Cause Ecological Sustainability in European Union Countries? Energy Environ. 2023, 34, 2478–2496. [Google Scholar] [CrossRef]
- Li, G.; Gao, D.; Li, Y. Dynamic Environmental Regulation Threshold Effect of Technical Progress on Green Total Factor Energy Efficiency: Evidence from China. Environ. Sci. Pollut. Res. 2022, 29, 8804–8815. [Google Scholar] [CrossRef]
- Wang, J.; Xu, H.; Wang, M. Technology Diffusion Considering Technological Progress and Multiple Policy Combinations Based on Evolutionary Game Theory. Technol. Soc. 2025, 81, 102799. [Google Scholar] [CrossRef]
- Rahman, M.M.; Alam, K.; Velayutham, E. Reduction of CO2 Emissions: The Role of Renewable Energy, Technological Innovation and Export Quality. Energy Rep. 2022, 8, 2793–2805. [Google Scholar] [CrossRef]
- Zhuang, Y.; Yang, S.; Chupradit, S.; Nawaz, M.A.; Xiong, R.; Koksal, C. A Nexus between Macroeconomic Dynamics and Trade Openness: Moderating Role of Institutional Quality. Bus. Process Manag. J. 2021, 27, 1703–1719. [Google Scholar] [CrossRef]
- Raza, A.; Habib, Y.; Hashmi, S.H. Impact of Technological Innovation and Renewable Energy on Ecological Footprint in G20 Countries: The Moderating Role of Institutional Quality. Environ. Sci. Pollut. Res. 2023, 30, 95376–95393. [Google Scholar] [CrossRef]
- Uddin, M.; Rashid, M.H.U.; Ahamad, S.; Ehigiamusoe, K.U. Impact of Militarization, Energy Consumption, and ICT on CO2 Emissions in G20 Countries. Environ. Dev. Sustain. 2024, 26, 11771–11793. [Google Scholar] [CrossRef]
- Chien, F.; Ajaz, T.; Andlib, Z.; Chau, K.Y.; Ahmad, P.; Sharif, A. The Role of Technology Innovation, Renewable Energy and Globalization in Reducing Environmental Degradation in Pakistan: A Step towards Sustainable Environment. Renew. Energy 2021, 177, 308–317. [Google Scholar] [CrossRef]
- Razzaq, A.; Ajaz, T.; Li, J.C.; Irfan, M.; Suksatan, W. Investigating the Asymmetric Linkages between Infrastructure Development, Green Innovation, and Consumption-Based Material Footprint: Novel Empirical Estimations from Highly Resource-Consuming Economies. Resour. Policy 2021, 74, 102302. [Google Scholar] [CrossRef]
- Zhang, R.; Chen, Y. What Can Multi-Factors Contribute to Chinese EFL Learners’ Implicit L2 Knowledge? Int. Rev. Appl. Linguist. Lang. Teach. 2024, 36, 215–259. [Google Scholar] [CrossRef]
- Hu, F.; Qiu, L.; Xiang, Y.; Wei, S.; Sun, H.; Hu, H.; Weng, X.; Mao, L.; Zeng, M. Spatial Network and Driving Factors of Low-Carbon Patent Applications in China from a Public Health Perspective. Front. Public Health 2023, 11, 1121860. [Google Scholar] [CrossRef]
- Yao, Y.; Ivanovski, K.; Inekwe, J.; Smyth, R. Human Capital and Energy Consumption: Evidence from OECD Countries. Energy Econ. 2019, 84, 104534. [Google Scholar] [CrossRef]
- Managi, S.; Jena, P.R. Environmental Productivity and Kuznets Curve in India. Ecol. Econ. 2008, 65, 432–440. [Google Scholar] [CrossRef]
- Williamson, C. Emission, Education, and Politics: An Empirical Study of The Carbon Dioxide and Methane Environmental Kuznets Curve. Park Place Econ. 2017, 25, 9. [Google Scholar]
- Sapkota, P.; Bastola, U. Foreign Direct Investment, Income, and Environmental Pollution in Developing Countries: Panel Data Analysis of Latin America. Energy Econ. 2017, 64, 206–212. [Google Scholar] [CrossRef]
- Balaguer, J.; Cantavella, M. The Role of Education in the Environmental Kuznets Curve. Evidence from Australian Data. Energy Econ 2018, 70, 289–296. [Google Scholar] [CrossRef]
- Zafar, M.W.; Shahbaz, M.; Sinha, A.; Sengupta, T.; Qin, Q. How Renewable Energy Consumption Contribute to Environmental Quality? The Role of Education in OECD Countries. J. Clean. Prod. 2020, 268, 122149. [Google Scholar] [CrossRef]
- Zafar, M.W.; Qin, Q.; Malik, M.N.; Zaidi, S.A.H. Foreign Direct Investment and Education as Determinants of Environmental Quality: The Importance of Post Paris Agreement (COP21). J. Environ. Manag. 2020, 270, 110827. [Google Scholar] [CrossRef]
- Işık, C.; Ongan, S.; Özdemir, D. Testing the EKC Hypothesis for Ten US States: An Application of Heterogeneous Panel Estimation Method. Environ. Sci. Pollut. Res. 2019, 26, 10846–10853. [Google Scholar] [CrossRef]
- Sabir, S.; Gorus, M.S. The Impact of Globalization on Ecological Footprint: Empirical Evidence from the South Asian Countries. Environ. Sci. Pollut. Res. 2019, 26, 33387–33398. [Google Scholar] [CrossRef]
- Dreher, A. Does Globalization Affect Growth? Evidence from a New Index of Globalization. Appl. Econ. 2006, 38, 1091–1110. [Google Scholar] [CrossRef]
- Mehmood, U.; Tariq, S. Globalization and CO2 Emissions Nexus: Evidence from the EKC Hypothesis in South Asian Countries. Environ. Sci. Pollut. Res. 2020, 27, 37044–37056. [Google Scholar] [CrossRef]
- Ahmed, Z.; Asghar, M.M.; Malik, M.N.; Nawaz, K. Moving towards a Sustainable Environment: The Dynamic Linkage between Natural Resources, Human Capital, Urbanization, Economic Growth, and Ecological Footprint in China. Resour. Policy 2020, 67, 101677. [Google Scholar] [CrossRef]
- Stern, D.I. The Rise and Fall of the Environmental Kuznets Curve. World Dev. 2004, 32, 1419–1439. [Google Scholar] [CrossRef]
- Ahmed, Z.; Zhang, B.; Cary, M. Linking Economic Globalization, Economic Growth, Financial Development, and Ecological Footprint: Evidence from Symmetric and Asymmetric ARDL. Ecol. Indic. 2021, 121, 107060. [Google Scholar] [CrossRef]
- Mahmood, H.; Alkhateeb, T.T.Y.; Furqan, M. Exports, Imports, Foreign Direct Investment and CO2 Emissions in North Africa: Spatial Analysis. Energy Rep. 2020, 6, 2403–2409. [Google Scholar] [CrossRef]
- Grossman, G.M.; Krueger, A.B. Environmental Impacts of a North American Free Trade Agreement; National Bureau of Economic Research: Cambridge, MA, USA, 1991. [Google Scholar]
- Ashraf, J. Do Political Risk and Globalization Undermine Environmental Quality? Empirical Evidence from Belt and Road Initiative (BRI) Countries. Manag. Decis. Econ. 2022, 43, 3647–3664. [Google Scholar] [CrossRef]
- Lv, Z.; Xu, T. Is Economic Globalization Good or Bad for the Environmental Quality? New Evidence from Dynamic Heterogeneous Panel Models. Technol. Forecast. Soc. Chang. 2018, 137, 340–343. [Google Scholar] [CrossRef]
- Rudolph, A.; Figge, L. Determinants of Ecological Footprints: What Is the Role of Globalization? Ecol. Indic. 2017, 81, 348–361. [Google Scholar] [CrossRef]
- Zaidi, S.A.H.; Zafar, M.W.; Shahbaz, M.; Hou, F. Dynamic Linkages between Globalization, Financial Development and Carbon Emissions: Evidence from Asia Pacific Economic Cooperation Countries. J. Clean. Prod. 2019, 228, 533–543. [Google Scholar] [CrossRef]
- Majeed, A.; Wang, L.; Zhang, X.; Muniba; Kirikkaleli, D. Modeling the Dynamic Links among Natural Resources, Economic Globalization, Disaggregated Energy Consumption, and Environmental Quality: Fresh Evidence from GCC Economies. Resour. Policy 2021, 73, 102204. [Google Scholar] [CrossRef]
- Hassan, S.T.; Xia, E.; Huang, J.; Khan, N.H.; Iqbal, K. Natural Resources, Globalization, and Economic Growth: Evidence from Pakistan. Environ. Sci. Pollut. Res. 2019, 26, 15527–15534. [Google Scholar] [CrossRef]
- Bekun, F.V.; Alola, A.A.; Sarkodie, S.A. Toward a Sustainable Environment: Nexus between CO2 Emissions, Resource Rent, Renewable and Nonrenewable Energy in 16-EU Countries. Sci. Total Environ. 2019, 657, 1023–1029. [Google Scholar] [CrossRef]
- Yang, Y.; Khan, A. Exploring the Role of Finance, Natural Resources, and Governance on the Environment and Economic Growth in South Asian Countries. Environ. Sci. Pollut. Res. 2021, 28, 50447–50461. [Google Scholar] [CrossRef]
- Usman, M.; Balsalobre-Lorente, D.; Jahanger, A.; Ahmad, P. Pollution Concern during Globalization Mode in Financially Resource-Rich Countries: Do Financial Development, Natural Resources, and Renewable Energy Consumption Matter? Renew. Energy 2022, 183, 90–102. [Google Scholar] [CrossRef]
- Shah, M.I.; AbdulKareem, H.K.K.; Ishola, B.D.; Abbas, S. The Roles of Energy, Natural Resources, Agriculture and Regional Integration on CO2 Emissions in Selected Countries of ASEAN: Does Political Constraint Matter? Environ. Sci. Pollut. Res. 2022, 30, 26063–26077. [Google Scholar] [CrossRef]
- Adebayo, T.S.; Ullah, S.; Kartal, M.T.; Ali, K.; Pata, U.K.; Ağa, M. Endorsing Sustainable Development in BRICS: The Role of Technological Innovation, Renewable Energy Consumption, and Natural Resources in Limiting Carbon Emission. Sci. Total Environ. 2023, 859, 160181. [Google Scholar] [CrossRef] [PubMed]
- Luo, J.; Wang, Y.; Li, G. The Innovation Effect of Administrative Hierarchy on Intercity Connection: The Machine Learning of Twin Cities. J. Innov. Knowl. 2023, 8, 100293. [Google Scholar] [CrossRef]
- Azam, W.; Khan, I.; Ali, S.A. Alternative Energy and Natural Resources in Determining Environmental Sustainability: A Look at the Role of Government Final Consumption Expenditures in France. Environ. Sci. Pollut. Res. 2023, 30, 1949–1965. [Google Scholar] [CrossRef]
- Hussain, M.; Abbas, A.; Manzoor, S.; Bilal; Chengang, Y. Linkage of Natural Resources, Economic Policies, Urbanization, and the Environmental Kuznets Curve. Environ. Sci. Pollut. Res. 2023, 30, 1451–1459. [Google Scholar] [CrossRef]
- Nwani, C.; Adams, S. Environmental Cost of Natural Resource Rents Based on Production and Consumption Inventories of Carbon Emissions: Assessing the Role of Institutional Quality. Resour. Policy 2021, 74, 102282. [Google Scholar] [CrossRef]
- Onifade, S.T.; Haouas, I.; Alola, A.A. Do Natural Resources and Economic Components Exhibit Differential Quantile Environmental Effects? Nat. Resour. Forum 2023, 47, 355–374. [Google Scholar] [CrossRef]
- Wang, Q.; Wu, S.D.; Zeng, Y.E.; Wu, B.W. Exploring the Relationship between Urbanization, Energy Consumption, and CO2 Emissions in Different Provinces of China. Renew. Sustain. Energy Rev. 2016, 54, 1563–1579. [Google Scholar] [CrossRef]
- Liddle, B.; Lung, S. Age-Structure, Urbanization, and Climate Change in Developed Countries: Revisiting STIRPAT for Disaggregated Population and Consumption-Related Environmental Impacts. Popul. Environ. 2010, 31, 317–343. [Google Scholar] [CrossRef]
- Cheng, P.; Wu, S.; Xiao, J. Exploring the Impact of Entrepreneurial Orientation and Market Orientation on Entrepreneurial Performance in the Context of Environmental Uncertainty. Sci. Rep. 2025, 15, 1913. [Google Scholar] [CrossRef]
- Behera, S.R.; Dash, D.P. The Effect of Urbanization, Energy Consumption, and Foreign Direct Investment on the Carbon Dioxide Emission in the SSEA (South and Southeast Asian) Region. Renew. Sustain. Energy Rev. 2017, 70, 96–106. [Google Scholar] [CrossRef]
- Danish; Zhang, B.; Wang, Z.; Wang, B. Energy Production, Economic Growth and CO2 Emission: Evidence from Pakistan. Nat. Hazards 2018, 90, 27–50. [Google Scholar] [CrossRef]
- Sadorsky, P. The Effect of Urbanization on CO2 Emissions in Emerging Economies. Energy Econ. 2014, 41, 147–153. [Google Scholar] [CrossRef]
- Jabeen, R.; Mehmood, S.; Ahmed, M.; Ghani, T.; Javaid, Z.K.; Popp, J. The Role of Green HRM on Environmental Performance: Mediating Role of Green Ambidexterity and Green Behavior and Moderating Role of Responsible Leadership. J. Chin. Hum. Resour. Manag. 2024, 15, 70–90. [Google Scholar] [CrossRef]
- Luo, J.; Zhuo, W.; Xu, B. The Bigger, the Better? Optimal NGO Size of Human Resources and Governance Quality of Entrepreneurship in Circular Economy. Manag. Decis. 2023, 62, 2472–2509. [Google Scholar] [CrossRef]
- Li, K.; Lin, B. Impacts of Urbanization and Industrialization on Energy Consumption/CO2 Emissions: Does the Level of Development Matter? Renew. Sustain. Energy Rev. 2015, 52, 1107–1122. [Google Scholar] [CrossRef]
- Al-Mulali, U.; Ozturk, I.; Lean, H.H. The Influence of Economic Growth, Urbanization, Trade Openness, Financial Development, and Renewable Energy on Pollution in Europe. Nat. Hazards 2015, 79, 621–644. [Google Scholar] [CrossRef]
- Martínez-Zarzoso, I.; Maruotti, A. The Impact of Urbanization on CO2 Emissions: Evidence from Developing Countries. Ecol. Econ. 2011, 70, 1344–1353. [Google Scholar] [CrossRef]
- Bekhet, H.A.; Othman, N.S. Impact of Urbanization Growth on Malaysia CO2 Emissions: Evidence from the Dynamic Relationship. J. Clean. Prod. 2017, 154, 374–388. [Google Scholar] [CrossRef]
- Zhang, N.; Yu, K.; Chen, Z. How Does Urbanization Affect Carbon Dioxide Emissions? A Cross-Country Panel Data Analysis. Energy Policy 2017, 107, 678–687. [Google Scholar] [CrossRef]
- Huang, F.; Ren, Y. Harnessing the Green Frontier: The Impact of Green Finance Reform and Digitalization on Corporate Green Innovation. Financ. Res. Lett. 2024, 66, 105554. [Google Scholar] [CrossRef]
- Xie, J.; Tian, J.; Hu, Y.; Wang, Q.; Dai, Z. Imported Intermediate Goods, Intellectual Property Protection, and Innovation in Chinese Manufacturing Firms. Econ. Model. 2025, 144, 106960. [Google Scholar] [CrossRef]
- Wang, S.; Fang, C.; Guan, X.; Pang, B.; Ma, H. Urbanisation, Energy Consumption, and Carbon Dioxide Emissions in China: A Panel Data Analysis of China’s Provinces. Appl. Energy 2014, 136, 738–749. [Google Scholar] [CrossRef]
- Xu, A.; Siddik, A.B.; Sobhani, F.A.; Rahman, M.M. Driving Economic Success: Fintech, Tourism, FDI, and Digitalization in the Top 10 Tourist Destinations. Humanit. Soc. Sci. Commun. 2024, 11, 1549. [Google Scholar] [CrossRef]
- Wang, S.; Li, G.; Fang, C. Urbanization, Economic Growth, Energy Consumption, and CO2 Emissions: Empirical Evidence from Countries with Different Income Levels. Renew. Sustain. Energy Rev. 2018, 81, 2144–2159. [Google Scholar] [CrossRef]
- Yao, X.; Yasmeen, R.; Hussain, J.; Hassan Shah, W.U. The Repercussions of Financial Development and Corruption on Energy Efficiency and Ecological Footprint: Evidence from BRICS and next 11 Countries. Energy 2021, 223, 120063. [Google Scholar] [CrossRef]
- Greening, L.A.; Greene, D.L.; Difiglio, C. Energy Efficiency and Consumption—The Rebound Effect—A Survey. Energy Policy 2000, 28, 389–401. [Google Scholar] [CrossRef]
- Eufrasio Espinosa, R.M.; Lenny Koh, S.C. Forecasting the Ecological Footprint of G20 Countries in the next 30 Years. Sci. Rep. 2024, 14, 8298. [Google Scholar] [CrossRef]
- Wei, M.; Xiong, Y.; Sun, B. Spatial Effects of Urban Economic Activities on Airports’ Passenger Throughputs: A Case Study of Thirteen Cities and Nine Airports in the Beijing-Tianjin-Hebei Region, China. J. Air Transp. Manag. 2025, 125, 102765. [Google Scholar] [CrossRef]
- Li, Y.; Wang, X.; Imran, A.; Aslam, M.U.; Mehmood, U. Analyzing the Contribution of Renewable Energy and Natural Resources for Sustainability in G-20 Countries: How Gross Capital Formation Impacts Ecological Footprints. Heliyon 2023, 9, e18882. [Google Scholar] [CrossRef] [PubMed]
- Rahman, M.M.; Alam, K. Life Expectancy in the ANZUS-BENELUX Countries: The Role of Renewable Energy, Environmental Pollution, Economic Growth and Good Governance. Renew. Energy 2022, 190, 251–260. [Google Scholar] [CrossRef]
- Polcyn, J.; Voumik, L.C.; Ridwan, M.; Ray, S.; Vovk, V. Evaluating the Influences of Health Expenditure, Energy Consumption, and Environmental Pollution on Life Expectancy in Asia. Int. J. Environ. Res. Public Health 2023, 5, 4000. [Google Scholar] [CrossRef]
- Sampene, A.K.; Li, C.; Oteng-Agyeman, F.; Brenya, R. Dissipating Environmental Pollution in the BRICS Economies: Do Urbanization, Globalization, Energy Innovation, and Financial Development Matter? Environ. Sci. Pollut. Res. 2022, 29, 82917–82937. [Google Scholar] [CrossRef]
- Pesaran, M.H. General Diagnostic Tests for Cross Section Dependence in Panels. SSRN Electron. J. 2021, 79, 103–147. [Google Scholar] [CrossRef]
- Pesaran, M.H.; Yamagata, T. Testing Slope Homogeneity in Large Panels. J. Econom. 2008, 142, 50–93. [Google Scholar] [CrossRef]
- Westerlund, J.; Edgerton, D.L. A Panel Bootstrap Cointegration Test. Econ. Lett. 2007, 97, 185–190. [Google Scholar] [CrossRef]
- Dumitrescu, E.I.; Hurlin, C. Testing for Granger Non-Causality in Heterogeneous Panels. Econ. Model. 2012, 29, 1450–1460. [Google Scholar] [CrossRef]
- Ozturk, I.; Farooq, S.; Majeed, M.T.; Skare, M. An Empirical Investigation of Financial Development and Ecological Footprint in South Asia: Bridging the EKC and Pollution Haven Hypotheses. Geosci. Front. 2024, 15, 101588. [Google Scholar] [CrossRef]
- Sharif, A.; Kocak, S.; Khan, H.H.A.; Uzuner, G.; Tiwari, S. Demystifying the Links between Green Technology Innovation, Economic Growth, and Environmental Tax in ASEAN-6 Countries: The Dynamic Role of Green Energy and Green Investment. Gondwana Res. 2023, 115, 98–106. [Google Scholar] [CrossRef]
- Kapetanios, G.; Pesaran, M.H.; Yamagata, T. Panels with Non-Stationary Multifactor Error Structures. J. Econom. 2011, 160, 326–348. [Google Scholar] [CrossRef]
- Eberhardt, M. Estimating Panel Time-Series Models with Heterogeneous Slopes. Stata J. 2012, 12, 61–71. [Google Scholar] [CrossRef]
- Abbasi, K.R.; Adedoyin, F.F.; Radulescu, M.; Hussain, K.; Salem, S. The Role of Forest and Agriculture towards Environmental Fortification: Designing a Sustainable Policy Framework for Top Forested Countries. Env. Dev. Sustain. 2022, 24, 8639–8666. [Google Scholar] [CrossRef]
- He, K.; Ramzan, M.; Awosusi, A.A.; Ahmed, Z.; Ahmad, M.; Altuntaş, M. Does Globalization Moderate the Effect of Economic Complexity on CO2 Emissions? Evidence From the Top 10 Energy Transition Economies. Front. Environ. Sci. 2021, 9, 778088. [Google Scholar] [CrossRef]
- Yunzhao, L. Modelling the Role of Eco Innovation, Renewable Energy, and Environmental Taxes in Carbon Emissions Reduction in E−7 Economies: Evidence from Advance Panel Estimations. Renew. Energy 2022, 190, 309–318. [Google Scholar] [CrossRef]
- Nathaniel, S.P.; Nwulu, N.; Bekun, F. Natural Resource, Globalization, Urbanization, Human Capital, and Environmental Degradation in Latin American and Caribbean Countries. Environ. Sci. Pollut. Res. 2021, 28, 6207–6221. [Google Scholar] [CrossRef]
- Driscoll, J.C.; Kraay, A.C. Consistent Covariance Matrix Estimation with Spatially Dependent Panel Data. Rev. Econ. Stat. 1998, 80, 549–559. [Google Scholar] [CrossRef]
- Danish; Baloch, M.A.; Wang, B. Analyzing the Role of Governance in CO2 Emissions Mitigation: The BRICS Experience. Struct. Chang. Econ. Dyn. 2019, 51, 119–125. [Google Scholar] [CrossRef]
- Haldar, A.; Sethi, N. Environmental Effects of Information and Communication Technology—Exploring the Roles of Renewable Energy, Innovation, Trade and Financial Development. Renew. Sustain. Energy Rev. 2022, 153, 111754. [Google Scholar] [CrossRef]
- Musah, M.; Kong, Y.; Mensah, I.A.; Antwi, S.K.; Donkor, M. The Connection between Urbanization and Carbon Emissions: A Panel Evidence from West Africa. Environ. Dev. Sustain. 2021, 23, 11525–11552. [Google Scholar] [CrossRef]
- Joshi, J.M.; Dalei, N.N.; Mehta, P. Estimation of Gross Refining Margin of Indian Petroleum Refineries Using Driscoll-Kraay Standard Error Estimator. Energy Policy 2021, 150, 112148. [Google Scholar] [CrossRef]
- Safi, N.; Rashid, M.; Shakoor, U.; Khurshid, N.; Safi, A.; Munir, F. Understanding the Role of Energy Productivity, Eco-Innovation and International Trade in Shaping Consumption-Based Carbon Emissions: A Study of BRICS Nations. Environ. Sci. Pollut. Res. 2023, 30, 98338–98350. [Google Scholar] [CrossRef]
- Sharif, A.; Kartal, M.T.; Bekun, F.V.; Pata, U.K.; Foon, C.L.; Kılıç Depren, S. Role of Green Technology, Environmental Taxes, and Green Energy towards Sustainable Environment: Insights from Sovereign Nordic Countries by CS-ARDL Approach. Gondwana Res. 2023, 117, 194–206. [Google Scholar] [CrossRef]
- Hatemi-J, A.; Shamsuddin, M. The Causal Interaction between Financial Development and Human Development in Bangladesh. Appl. Econ. Lett. 2016, 23, 995–998. [Google Scholar] [CrossRef]
- Liu, K.; Luo, J.; Faridi, M.Z.; Nazar, R.; Ali, S. Green Shoots in Uncertain Times: Decoding the Asymmetric Nexus between Monetary Policy Uncertainty and Renewable Energy. Energy Environ. 2025, 58, 107–131. [Google Scholar] [CrossRef]
- Ulucak, R.; Bilgili, F. A Reinvestigation of EKC Model by Ecological Footprint Measurement for High, Middle and Low Income Countries. J. Clean. Prod. 2018, 188, 144–157. [Google Scholar] [CrossRef]
- Zafar, M.W.; Sinha, A.; Ahmed, Z.; Qin, Q.; Zaidi, S.A.H. Effects of Biomass Energy Consumption on Environmental Quality: The Role of Education and Technology in Asia-Pacific Economic Cooperation Countries. Renew. Sustain. Energy Rev. 2021, 142, 110868. [Google Scholar] [CrossRef]
- Alfalih, A.A.; Hadj, T.B. Ecological Impact Assessment of Green Technological Innovation under Different Thresholds of Human Capital in G20 Countries. Technol. Forecast. Soc. Chang. 2024, 201, 123276. [Google Scholar] [CrossRef]
- Van Tran, H.; Tran, A.V.; Hoang, N.B.; Mai, T.N.H. Asymmetric Effects of Foreign Direct Investment and Globalization on Ecological Footprint in Indonesia. PLoS ONE 2024, 19, e0297046. [Google Scholar] [CrossRef]
- Karimli, T.; Mirzaliyev, N.; Guliyev, H. The Globalization and Ecological Footprint in European Countries: Correlation or Causation? Res. Glob. 2024, 8, 100208. [Google Scholar] [CrossRef]
- Dam, M.M.; Kaya, F.; Bekun, F.V. How Does Technological Innovation Affect the Ecological Footprint? Evidence from E-7 Countries in the Background of the SDGs. J. Clean. Prod. 2024, 443, 141020. [Google Scholar] [CrossRef]
- Zeraibi, A.; Balsalobre-Lorente, D.; Murshed, M. The Influences of Renewable Electricity Generation, Technological Innovation, Financial Development, and Economic Growth on Ecological Footprints in ASEAN-5 Countries. Environ. Sci. Pollut. Res. 2021, 28, 51003–51021. [Google Scholar] [CrossRef] [PubMed]
- Javed, A.; Rapposelli, A.; Khan, F.; Javed, A. The Impact of Green Technology Innovation, Environmental Taxes, and Renewable Energy Consumption on Ecological Footprint in Italy: Fresh Evidence from Novel Dynamic ARDL Simulations. Technol. Forecast. Soc. Chang. 2023, 191, 122534. [Google Scholar] [CrossRef]
- Ponce, P.; Álvarez-García, J.; Álvarez, V.; Irfan, M. Analysing the Influence of Foreign Direct Investment and Urbanization on the Development of Private Financial System and Its Ecological Footprint. Environ. Sci. Pollut. Res. 2023, 30, 9624–9641. [Google Scholar] [CrossRef]
- Zhu, P.; Ahmed, Z.; Pata, U.K.; Khan, S.; Abbas, S. Analyzing Economic Growth, Eco-Innovation, and Ecological Quality Nexus in E-7 Countries: Accounting for Non-Linear Impacts of Urbanization by Using a New Measure of Ecological Quality. Environ. Sci. Pollut. Res. 2023, 30, 94242–94254. [Google Scholar] [CrossRef]
- Maddala, G.S.; Wu, S. A Comparative Study of Unit Root Tests with Panel Data and a New Simple Test. Oxf. Bull. Econ. Stat. 1999, 61, 631–652. [Google Scholar] [CrossRef]


| EFT | EDU | HMC | GLN | NTS | TLI | URZ | |
|---|---|---|---|---|---|---|---|
| Mean | 4.281711 | 4.450140 | 2.967308 | 72.04082 | 4.729452 | 10.83145 | 72.94735 |
| Median | 4.220042 | 4.525985 | 2.974337 | 70.18541 | 1.920028 | 10.67926 | 78.38700 |
| Maximum | 10.92681 | 7.718870 | 3.842989 | 90.04584 | 55.47506 | 25.23000 | 92.34700 |
| Minimum | 0.087267 | 1.264700 | 1.782071 | 46.40732 | 0.010688 | 1.450000 | 27.66700 |
| Standard Deviation | 2.325017 | 1.044316 | 0.568146 | 10.02458 | 9.150381 | 3.675972 | 15.24809 |
| Skewness | 0.3247 | −0.1331 | −0.1328 | 0.1391 | 3.4589 | 0.8877 | −1.3839 |
| Kurtosis | 2.936457 | 2.900538 | 1.735647 | 1.952404 | 15.68916 | 4.990979 | 4.262370 |
| Test | Statistic | Prob. |
|---|---|---|
| Pagan LM | 1554.096 *** | 0.0000 |
| Scaled LM | 79.06635 *** | 0.0000 |
| Pesaran CD | 21.26611 *** | 0.0000 |
| Test | Value | Prob. |
|---|---|---|
| Delta | 21.439 *** | 0.000 |
| Adj. Delta | 23.973 *** | 0.000 |
| Variables | CIPS Test | CADF Test | ||
|---|---|---|---|---|
| I(0) | I(1) | I(0) | I(1) | |
| EFT | −0.808 | −10.297 *** | 0.432 | −8.145 *** |
| TLI | −1.589 | −5.467 *** | −1.254 | −11.247 *** |
| HMC | 4.533 | −6.073 *** | 4.324 | −7.514 *** |
| NTS | −0.466 | −4.759 *** | −1.019 | −6.017 *** |
| EDU | −1.342 | −12.489 *** | −1.428 | −7.661 *** |
| URZ | −1.264 | −7.125 *** | −1.324 | −13.547 *** |
| GLN | −2.317 | −11.365 *** | −2.007 | −15.257 *** |
| Statistics | Value | Z-Value | p-Value |
|---|---|---|---|
| Gt | −4.464 *** | −7.187 | 0.000 |
| Ga | −8.913 | 3.890 | 1.000 |
| Pt | −15.830 *** | −4.551 | 0.000 |
| Pa | −9.442 | 1.827 | 0.966 |
| Variables | Coefficient | Std. Error | p-Value |
|---|---|---|---|
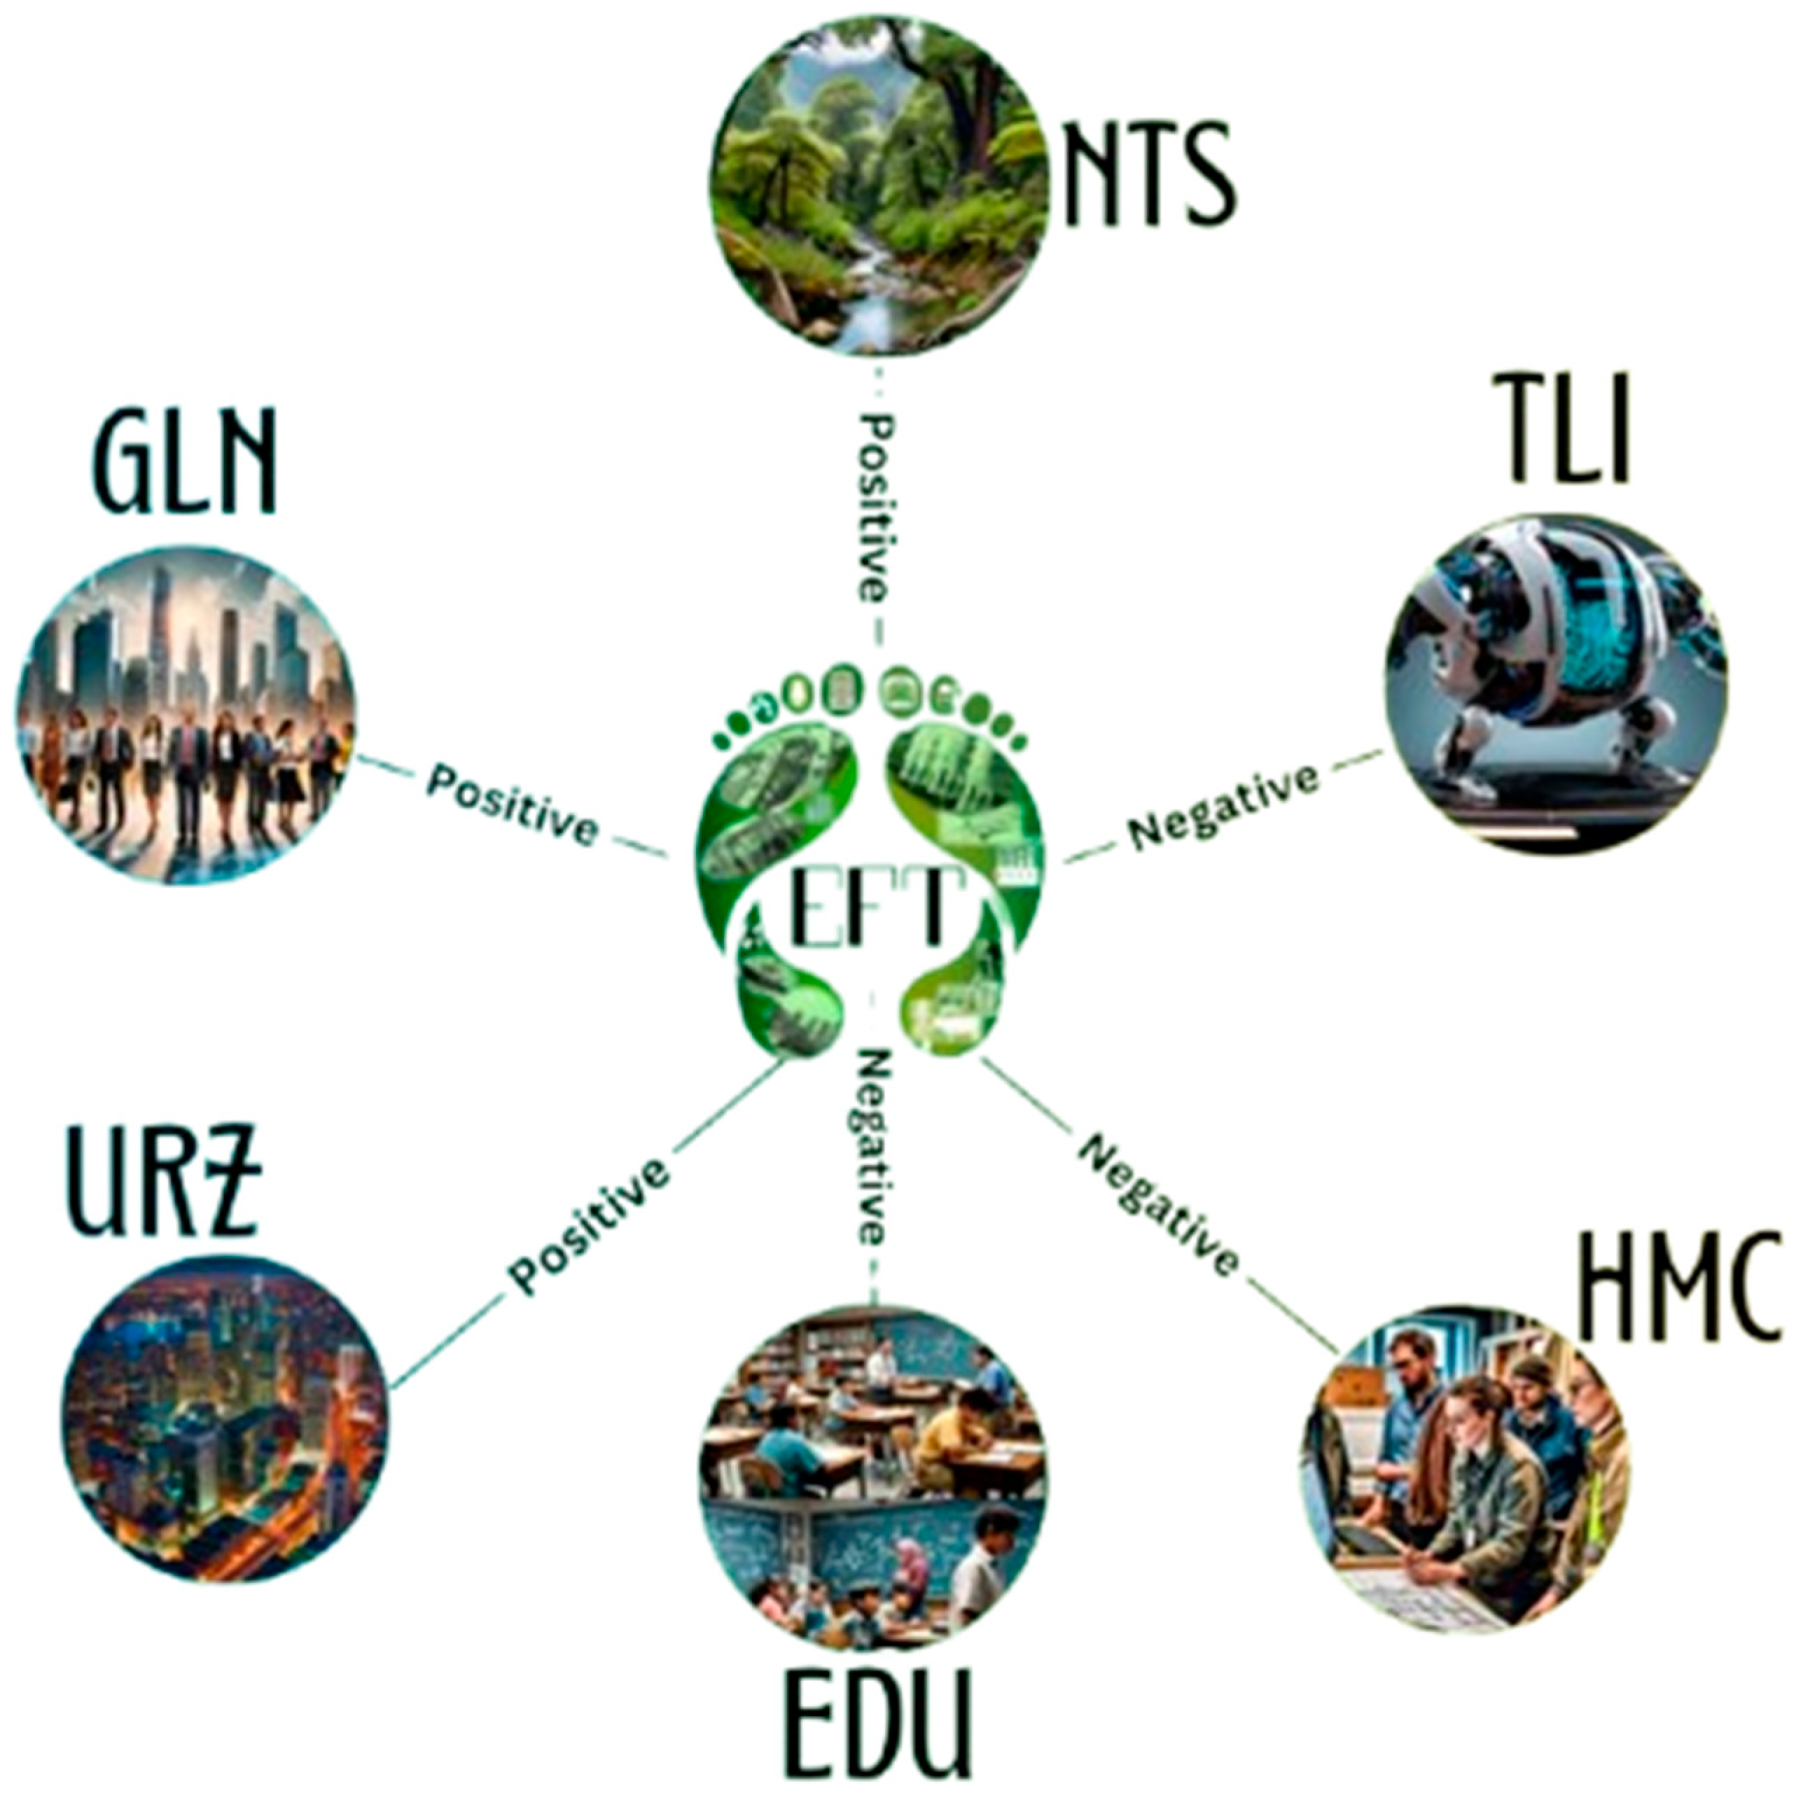
| EDU | −0.231013 *** | 0.040128 | 0.000 |
| HMC | −4.012112 *** | 0.712312 | 0.001 |
| GLN | 0.112321 *** | 0.003772 | 0.004 |
| NTS | 0.123010 *** | 0.013143 | 0.000 |
| TLI | −0.040123 *** | 0.032417 | 0.000 |
| URZ | 0.201323 *** | 0.032123 | 0.002 |
| Constant | 12.837 *** | 0.0497 | 0.000 |
| Diagnostic test (p-value = 0.000) | |||
| R2 | 0.954 | Jarque Bera | 5.238 (0.362) |
| Adj. R2 | 0.962 | Wald | 513.327 (0.000) |
| F-Statistics | 37.26 *** | Wooldridge | 267.108 (0.869) |
| Variable | Coefficient | Std. Error | t-Statistic | Prob. |
|---|---|---|---|---|
| Long Run Equation | ||||
| EDU | −0.174225 *** | 0.052388 | −3.325627 | 0.0010 |
| HMC | −3.953044 *** | 0.600465 | −6.583308 | 0.0000 |
| GLN | 0.035838 *** | 0.001043 | 3.540919 | 0.0016 |
| NTS | 0.078196 *** | 0.017612 | 4.439852 | 0.0000 |
| TLI | −0.021745 *** | 0.010151 | −1.692896 | 0.0024 |
| URZ | 0.190878 *** | 0.018345 | 10.40479 | 0.0000 |
| Short Run Equation | ||||
| ECT | −0.305007 *** | 0.071706 | −4.253550 | 0.0000 |
| EDU | −0.100889 ** | 0.052445 | −1.645656 | 0.0174 |
| HMC | −10.24520 ** | 8.199757 | −1.235352 | 0.0291 |
| GLN | 0.022253 *** | 0.011909 | 1.598768 | 0.0031 |
| NTS | 0.197765 ** | 0.236167 | 0.783008 | 0.0441 |
| TLI | −0.035075 * | 0.019515 | −1.797339 | 0.0734 |
| URZ | 5.501025 * | 3.045688 | 1.806168 | 0.0720 |
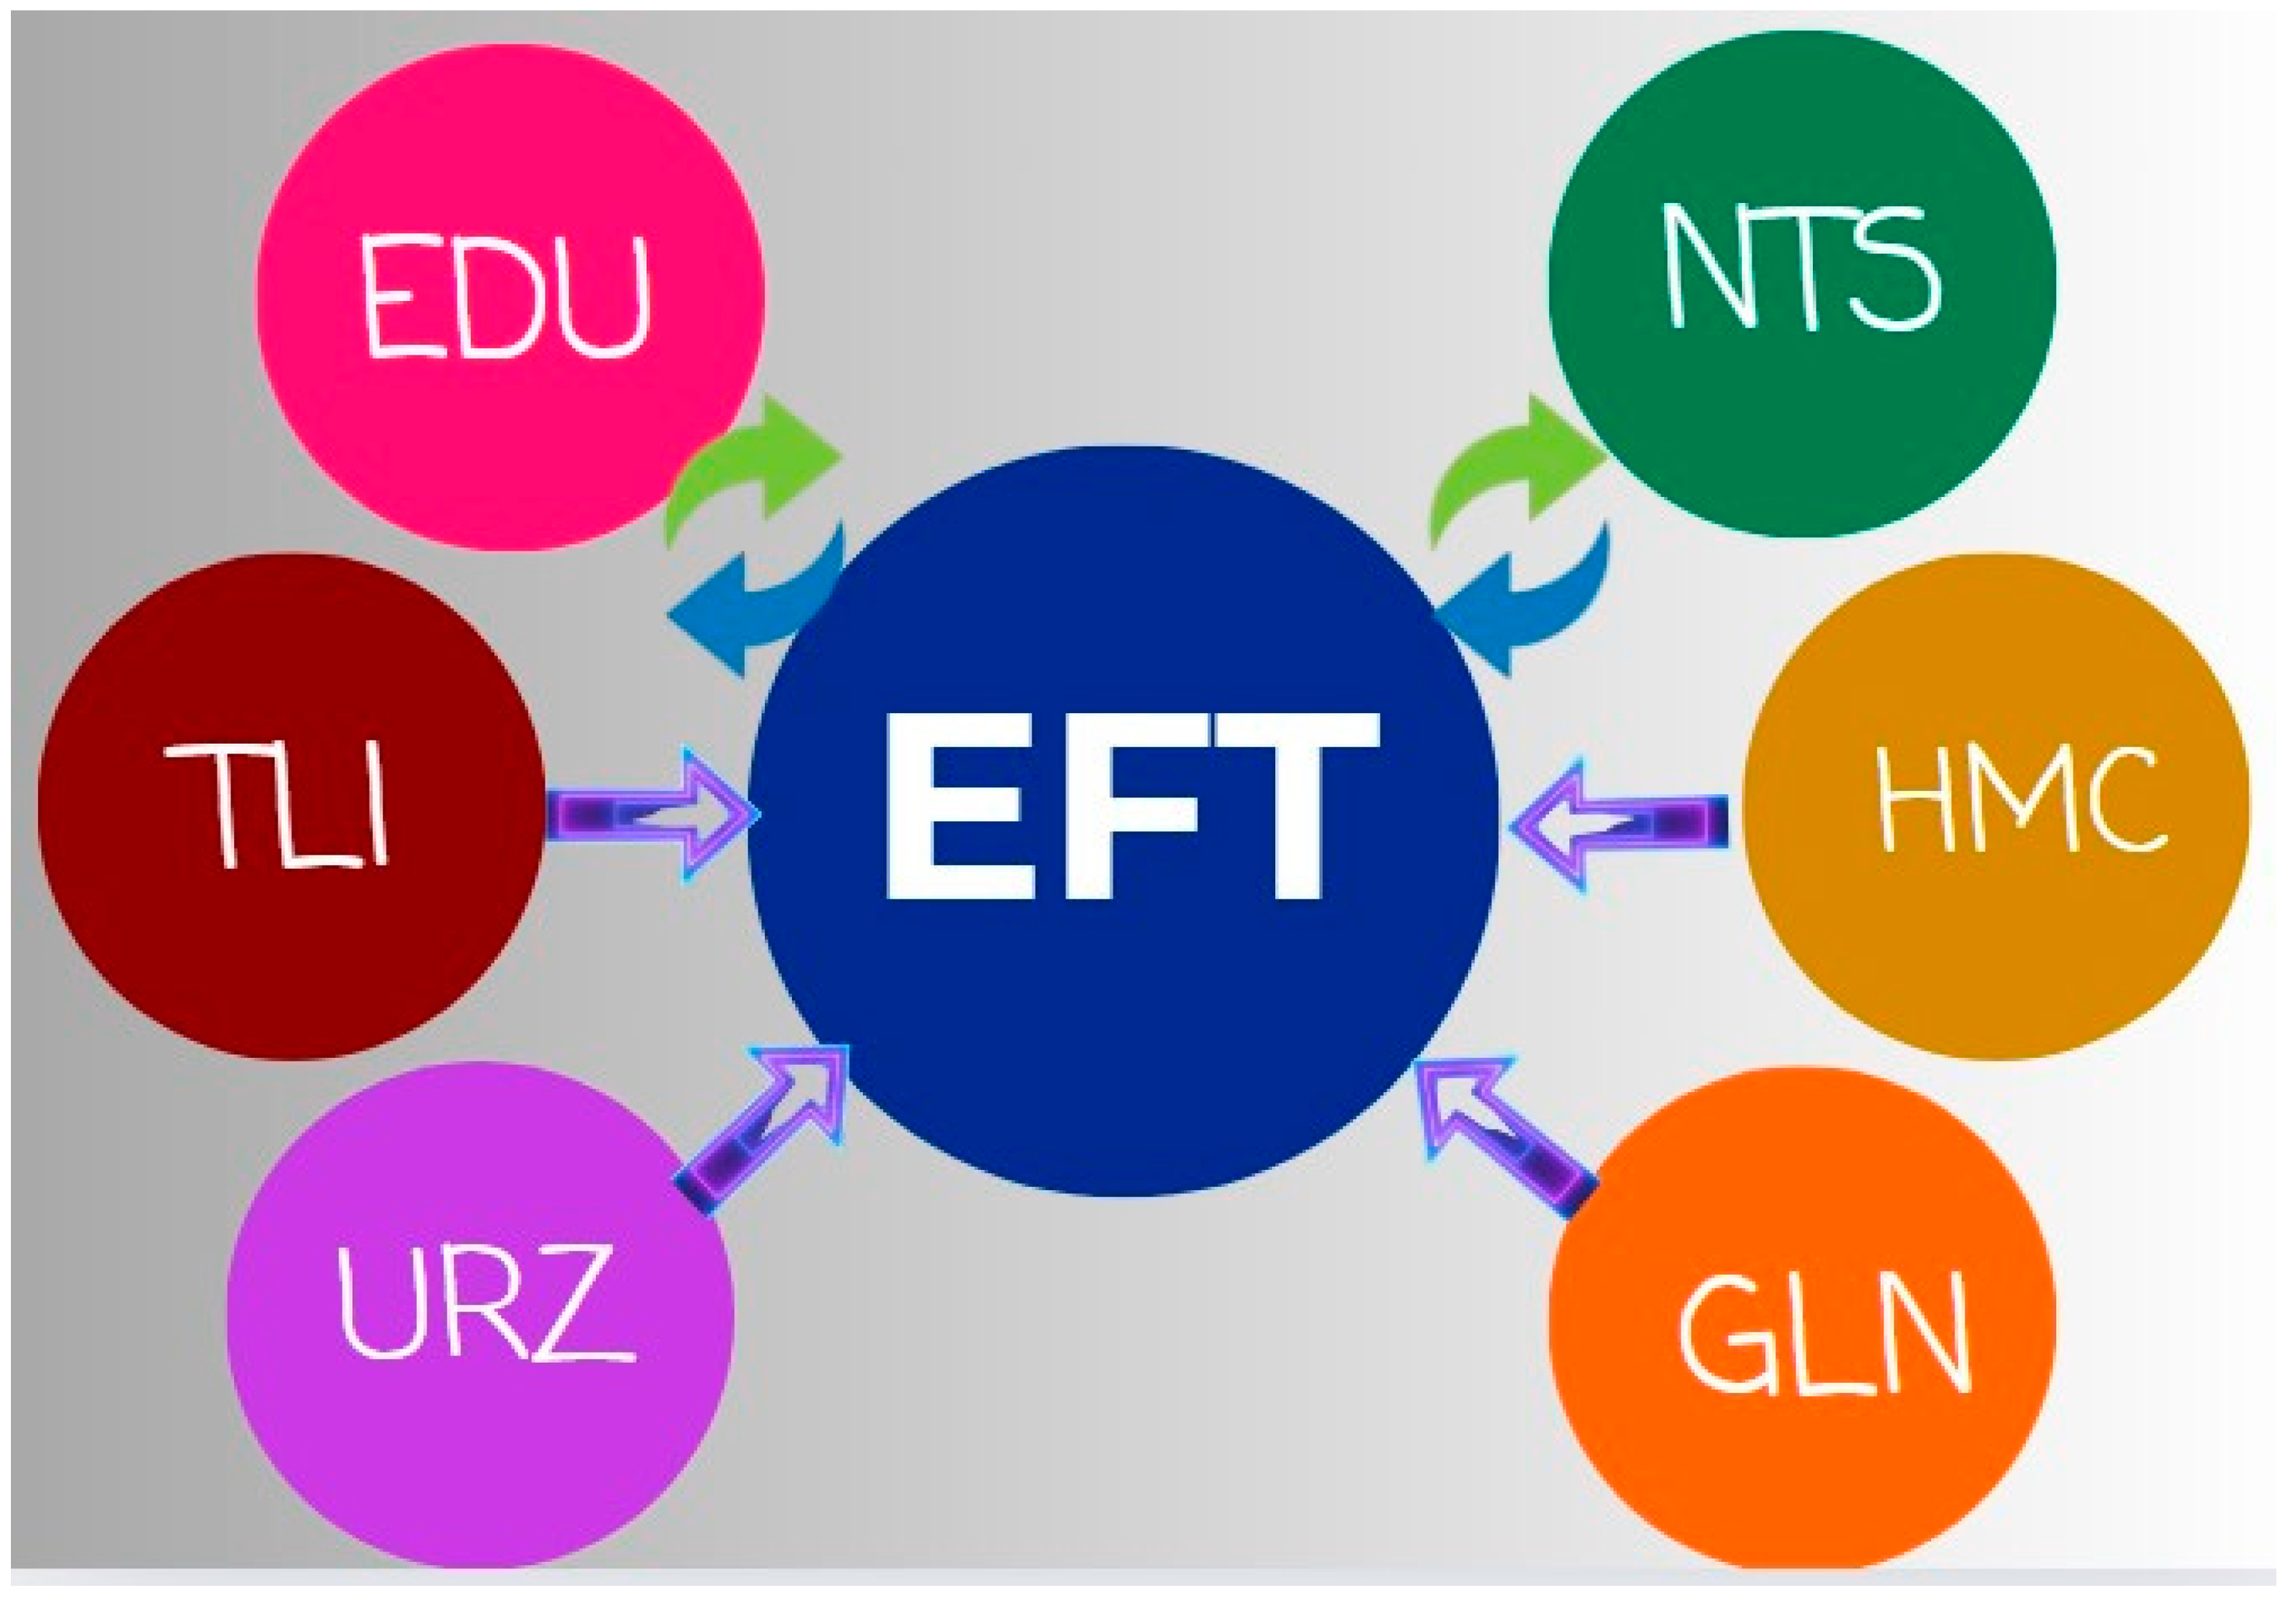
| Null Hypothesis | Z.Bar-Stat | p-Value | Decision |
|---|---|---|---|
| NTS⇸EFT | 3.351 *** | 0.0000 ✔ | Bi-directional |
| EFT⇸NTS | 5.042 *** | 0.0000 ✔ | |
| EDU⇸EFT | −7.21333 *** | 0.0000 ✔ | Bi-directional |
| EFT⇸EDU | 6.10774 *** | 0.0013 ✔ | |
| TLI⇸EFT | −4.48925 *** | 7 × 10⁻⁶ ✔ | Uni-directional |
| EFT⇸TLI | 1.13135 | 0.2579 ✘ | |
| URZ⇸EFT | 7.21333 *** | 0.0000 ✔ | Uni-directional |
| EFT⇸URZ | 0.49419 | 0.6212 ✘ | |
| HMC⇸EFT | −3.00574 *** | 0.0026 ✔ | Uni-directional |
| EFT⇸HMC | 0.91883 | 0.3582 ✘ | |
| GLN⇸EFT | 8.09049 *** | 7 × 10⁻¹⁶ ✔ | Uni-directional |
| EFT⇸GLN | 0.99758 | 0.3185 ✘ |
Disclaimer/Publisher’s Note: The statements, opinions and data contained in all publications are solely those of the individual author(s) and contributor(s) and not of MDPI and/or the editor(s). MDPI and/or the editor(s) disclaim responsibility for any injury to people or property resulting from any ideas, methods, instructions or products referred to in the content. |
© 2025 by the authors. Licensee MDPI, Basel, Switzerland. This article is an open access article distributed under the terms and conditions of the Creative Commons Attribution (CC BY) license (https://creativecommons.org/licenses/by/4.0/).
Share and Cite
Zeng, J.; Punjwani, A. Evaluating the Interactive and Transformative Role of Innovation, Education, Human Capital and Natural Resources Policies in Protecting and Sustaining Environmental Sustainability. Sustainability 2025, 17, 3130. https://doi.org/10.3390/su17073130
Zeng J, Punjwani A. Evaluating the Interactive and Transformative Role of Innovation, Education, Human Capital and Natural Resources Policies in Protecting and Sustaining Environmental Sustainability. Sustainability. 2025; 17(7):3130. https://doi.org/10.3390/su17073130
Chicago/Turabian StyleZeng, Jing, and Ali Punjwani. 2025. "Evaluating the Interactive and Transformative Role of Innovation, Education, Human Capital and Natural Resources Policies in Protecting and Sustaining Environmental Sustainability" Sustainability 17, no. 7: 3130. https://doi.org/10.3390/su17073130
APA StyleZeng, J., & Punjwani, A. (2025). Evaluating the Interactive and Transformative Role of Innovation, Education, Human Capital and Natural Resources Policies in Protecting and Sustaining Environmental Sustainability. Sustainability, 17(7), 3130. https://doi.org/10.3390/su17073130