Article

Accessibility and Inclusiveness of Public Open Spaces in Fragile Contexts: A Case Study of Kaya, Burkina Faso

1
Regional Center of Excellence on Sustainable Cities in Africa (CERViDA-DOUNEDON), University of Lomé, Lomé 01BP1515, Togo
2
Dynamic of Spaces and Societies Laboratory, Joseph Ki-Zerbo University, Ouagadougou 09BP1635, Burkina Faso
*
Author to whom correspondence should be addressed.
Sustainability 2025, 17(7), 3115; https://doi.org/10.3390/su17073115
Submission received: 30 January 2025 / Revised: 2 March 2025 / Accepted: 13 March 2025 / Published: 1 April 2025

Abstract

:
Public open spaces enhance urban sustainability by promoting social inclusion and supporting the right to the city. Somehow, in fragile contexts, knowledge of the accessibility and inclusiveness of these places, especially in the African context, is scarce. In alignment with the SDGs advocating for equal access to public open spaces, this study investigates how the fragile context impacts the accessibility and inclusiveness of public open spaces in Kaya, Burkina Faso. Employing a mixed-methods approach grounded in urban fragility and spatial justice theories, data were collected through GIS tools, group discussions involving 73 participants, and a questionnaire survey with a quota sample of 515 residents. Thematic and contextual analysis and Key Influencer tools were used to interpret the data in depth. The findings reveal that the fragile condition of Kaya impacts social groups in different ways. People living in informal housing, internally displaced people, women, aged people, people living with disabilities, and young people are more likely to experience spatial injustice and social exclusion from public open spaces. This study concludes that innovative measures to enhance governance, planning, and investments promote spatial justice, thereby reducing fragility.

1. Introduction

In the urban fragility context, which is defined as the inability of public authorities to cope with the risks of dislocation or collapse of cities induced by rapid urbanization, poverty, violence, inequalities, and deficits in service provision [1,2,3,4,5,6,7], public open spaces play a central role in addressing various challenges. The diversity of spatial forms in the city considered as public open spaces include parks, green spaces, public squares, playgrounds, and leisure facilities, among others [8,9,10,11]. UN-HABITAT maintains that public spaces are common goods, key vectors of human rights such as the rights to free movement, well-being, and leisure enshrined in the 1948 Universal Declaration of Human and Peoples’ Rights [11]. Since adopting the Sustainable Development Goals (SDGs) in 2015, target 11.7 draws attention to the vital role of public spaces in sustainable development, with a commitment to ensuring universal access to safe public spaces by 2030. In African cities and elsewhere, public open spaces offer social, environmental, and economic benefits that directly and indirectly improve people’s quality of life [8,12,13]. In economic terms, for example, public spaces have a recognized function in African cities dominated by the informal sector. Streets, public squares and green spaces serve as places for commerce and various income-generating activities [8,14].
In an international context marked by an ever-increasing influx of internally displaced people (IDPs) into cities [15], public spaces play a key role in social inclusion. Studies have highlighted the fact that public spaces are places where foreigners and migrants are welcomed, sheltered, and provided with a livelihood [16,17,18]. In a context of urban fragility, urban planning approaches are encouraged to give an essential place to public open spaces, in particular green spaces, streets, and urban parks, because of their recognized function of social inclusiveness [7].
From the perspective of sustainable city planning and management, a good understanding of the accessibility and inclusiveness of public spaces is essential. It is also recognized that urban planning can provide resilience solutions in fragile contexts when it integrates adaptive approaches based on a good knowledge of the actors and their practices [19,20]. The existing literature shows that studies on urban fragility in developing countries have mainly focused on its dimensions, its causes, and the mechanisms of resilience [2,21,22,23]. Most studies on the accessibility of public open spaces in African contexts have focused on spatial equity, social dynamics, and design [8,14,24,25,26]. However, research on the accessibility and inclusiveness of public open spaces in fragile contexts remains scarce. Moreover, the challenges of vulnerable groups’ inclusivity in African urban public spaces have not been considered in depth. This paper intends to fill this gap by examining the case of Kaya in Burkina Faso, whose fragile conditions have been highlighted [7]. The study seeks to answer the following question: How does Kaya’s fragile context impact the accessibility and inclusiveness of its public open spaces? The paper aims to explore how urban fragility affects spatial justice and social inclusion in public open spaces, providing insights for policymakers and urban planners to improve conditions for marginalized dwellers. Positioned in the right-to-the-city paradigm and grounded in urban fragility and spatial justice theories, the study employs mixed methods of investigation. It is based on the hypothesis that the fragile urban context of Kaya significantly hinders the accessibility and inclusiveness of public open spaces, leading to spatial injustice and social exclusion of vulnerable groups. The study is organized into six parts. The introduction is followed by a literature review section, the methodology, the results, a discussion of findings, and a conclusion.

2. Literature Review

2.1. Urban Fragility in the African Context

A fragile city is exposed to risks but lacks the adaptive capacity or resilience to manage, absorb, or mitigate these risks and can be analyzed along five dimensions: political, security, social, environmental and economic [1]. The fragility of territories, more pronounced in urban areas, is marked by inequalities, injustice, and poverty [22]. As a result of rapid urbanization [27] and deeply rooted colonial legacies [28,29,30]. African cities face critical challenges, including widespread poverty, social and spatial disparities, informal housing, limited water access, and environmental degradation [15,31]. According to Amounou [24], the complexity of urban land tenure systems, lack of financial resources, and weak collaboration between urban actors lead to poor implementation of urban planning documents, resulting in the failure of urban services and worsening inequalities in African cities. All these challenges facing African cities have led to the emergence of urban fragility in the continent. In cities facing fragile contexts, instability and lack of resources can impact the availability, quality, and equal access to public open spaces [7], compromising the right for all to the city.

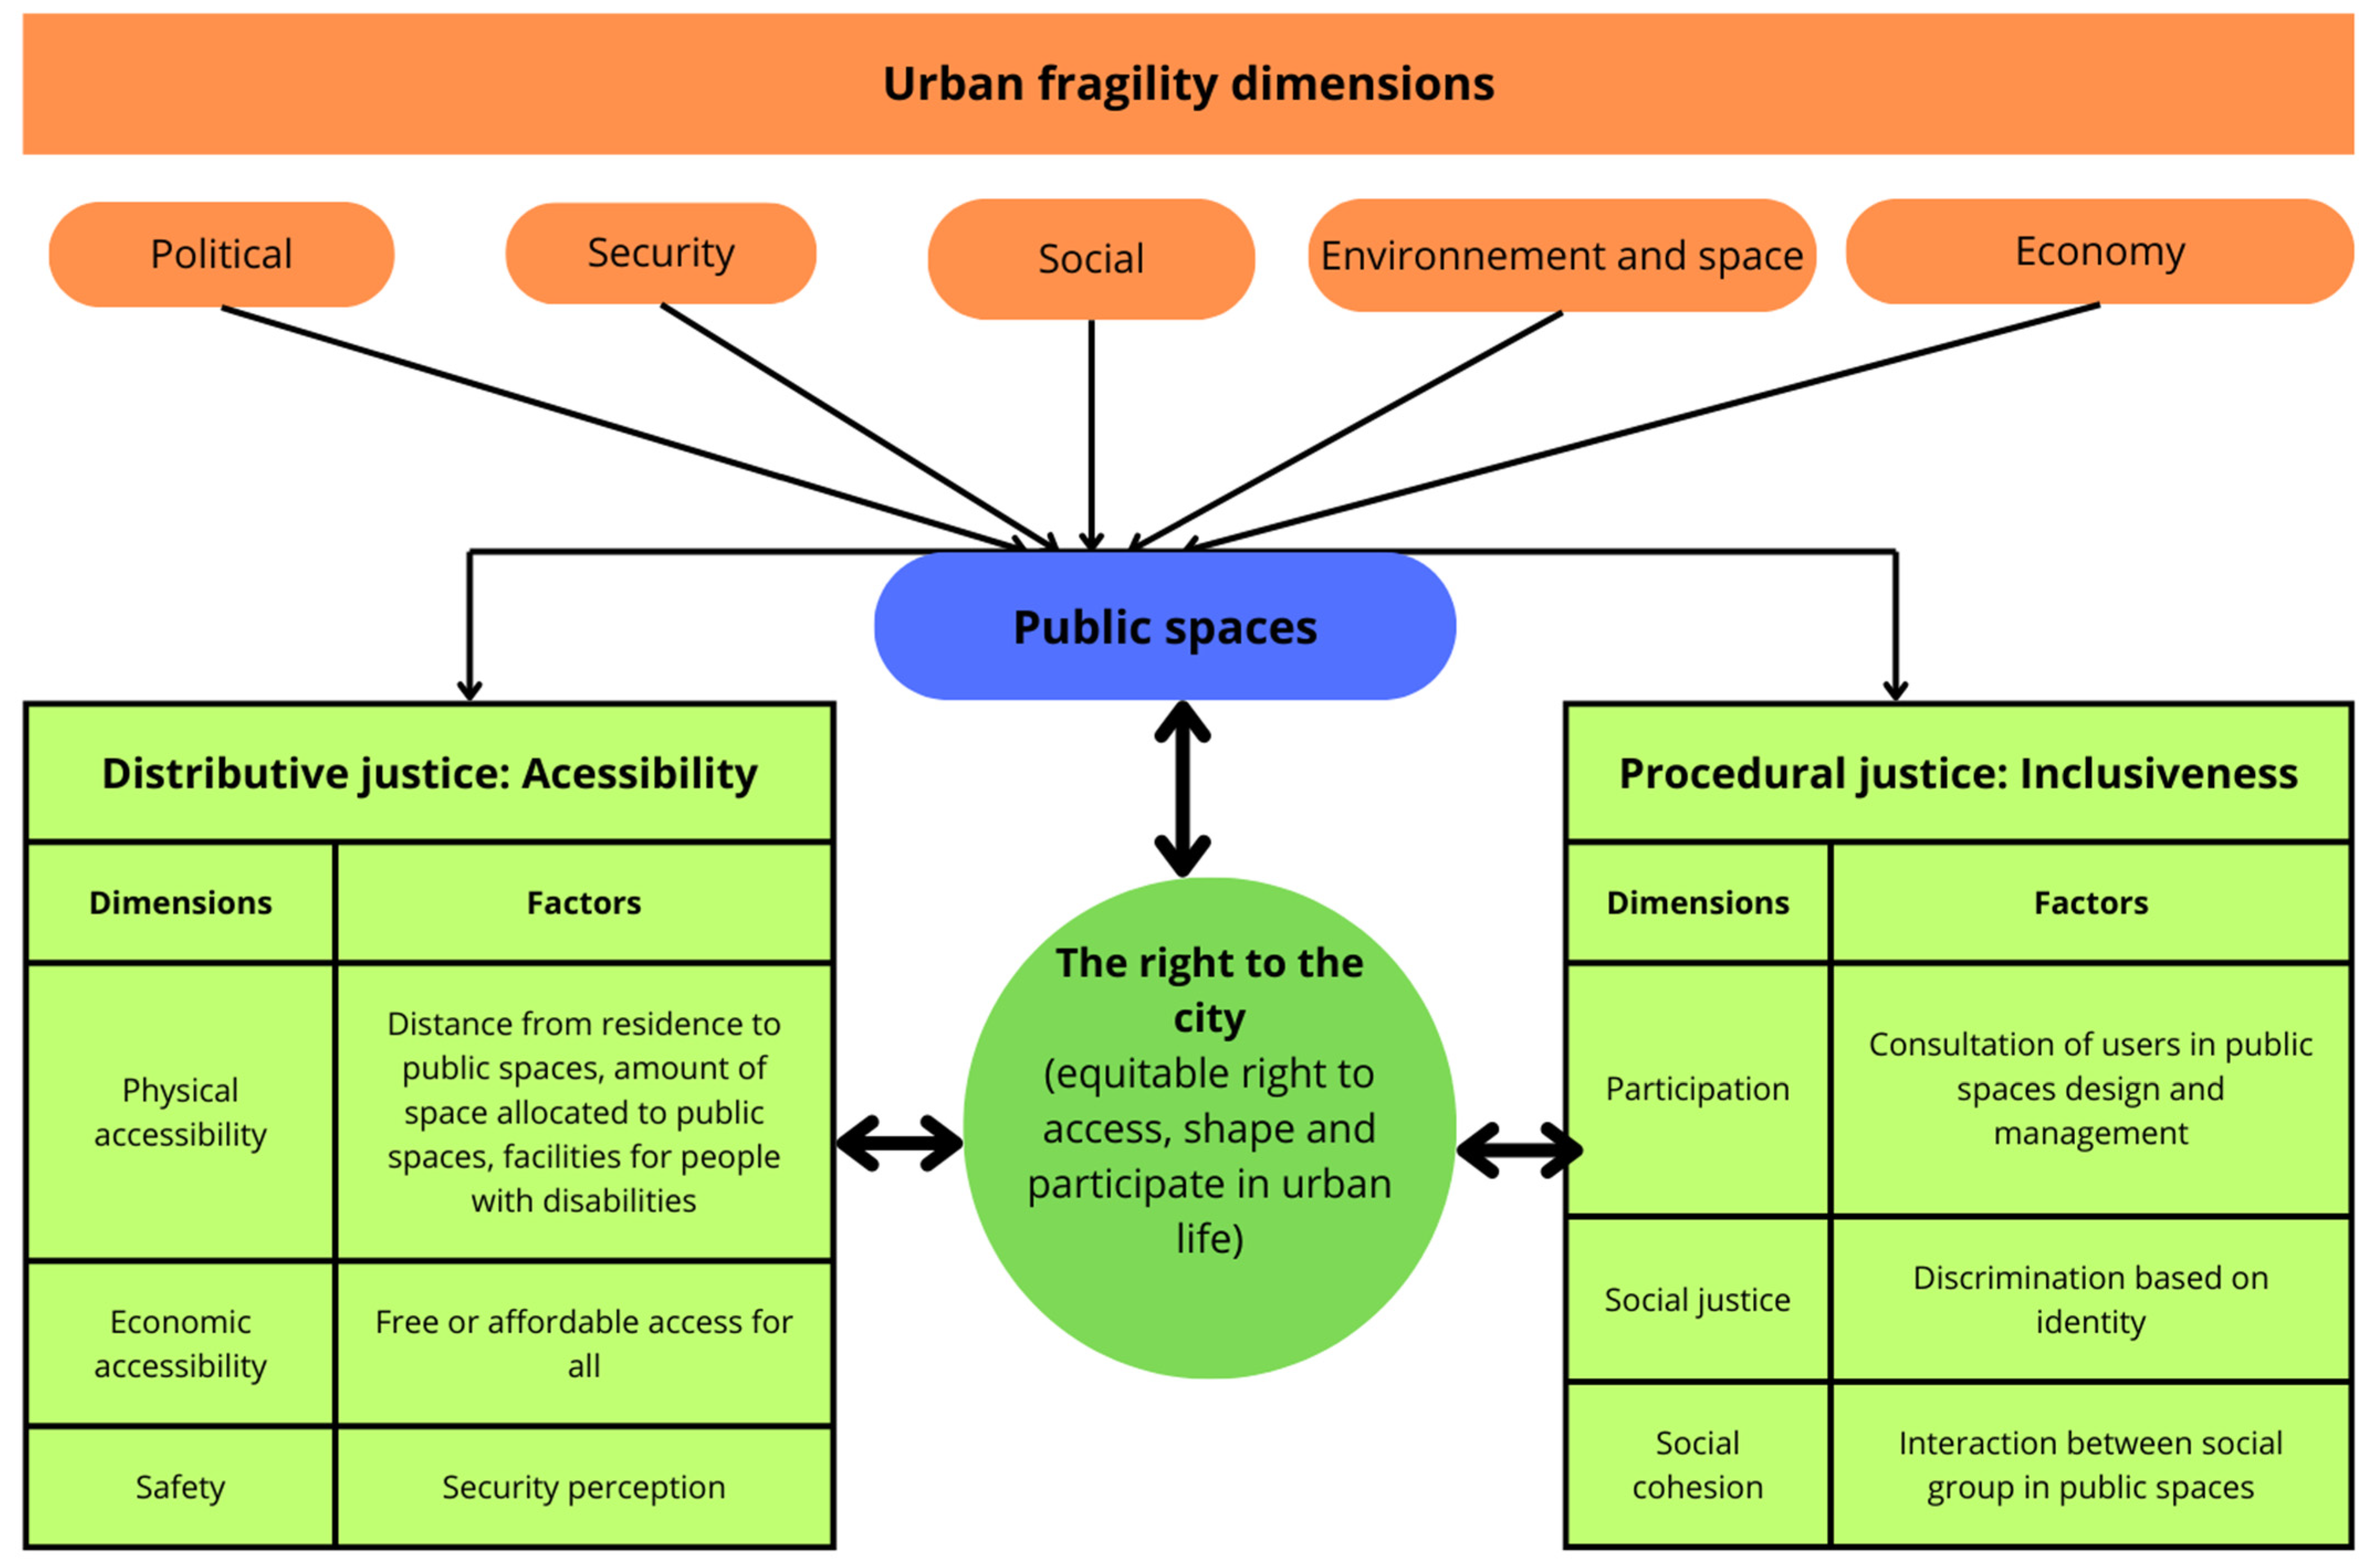
2.2. The Right to the City and Spatial Justice

The right to city advocates urban humanism, which translates into equitable access to urban resources, the right of all to security, and participation in the development of urban space [32]. The right to the city, therefore, calls for an approach to urban planning, development, and management based on spatial justice [33]. Spatial justice emerged in the 1970s among geographers to study the spatial dimension of justice, based primarily on the work of John Rawls and Iris Marion Young [34]. As (social) justice aims above all to reduce or abolish socio-economic inequalities [34], Soja [35] explains that the value of a spatial perspective on justice lies in that all reflection is inseparable from spatial analysis and that a spatial perspective on justice enables in-depth analysis and more effective solutions for justice and democracy in society. According to Gervais-Lambony and Dufaux [34], there are two main approaches to spatial justice. The first, known as distributive justice, questions the fair spatial distribution of goods, services, and people, while the second, known as procedural justice, questions representations of space, identities, and decision-making processes concerning space. The right to the city perspective and spatial justice contribute to achieving a just city. Sezer and Niksic [36] characterize a just city as a place of diversity, equity, and democracy. In addition, these authors have highlighted that public spaces can promote these values if planned and developed in a participatory manner and regulated, considering the values of the just city.

2.3. Accessibility and Inclusiveness of Public Open Spaces

Public spaces include all publicly owned places accessible to and usable by everyone without restriction [11]. Streets, markets, parks, and playgrounds are examples of public spaces that are known to bring together diverse groups of people for social interaction [36]. Public open spaces are a specific type of public space that include vacant lots, lots without buildings, or lots with very few buildings accessible to the public and used for leisure purposes, contributing to the quality and beauty of the environment [11]. As public open spaces are integral to citizens’ daily lives, accessibility and inclusiveness are key factors in a sustainable city [37]. In academic discourse, the accessibility and inclusiveness of public spaces are examined from multiple viewpoints. Some authors have approached the accessibility of public spaces from variants of spatial equity or spatial justice based on the study of the spatial distribution of public spaces with the spatial distribution of inhabitants [11,37,38,39]. Based on city dwellers’ perceptions, Das and Honiball [25] show that the accessibility of public spaces is most frequently expressed in terms of proximity, allowing access on foot, the feeling of safety and the possibility of access in the morning and evening. The same source shows that the quality of urban planning, notably through aspects such as the quality of the road network and lighting, plays a role in the frequentation of public spaces. According to Amounou [23], from a city dweller’s point of view, accessibility brings together conditions such as spatial proximity, financial means of access, and satisfaction with the service. Citing Akkar (2005), Ding et al. [40] explain that inclusive public space can be examined through the following dimensions of accessibility: physical access, which refers to the ability of citizens to enter and use the environment physically; social access, which refers to the right to participate in the design and management of the physical environment; and access to activities, discussions, and information. By approaching the accessibility of public spaces from the angle of management mode, Chitrakar et al. [41] have shown that the level of access control (free or regulated) and users’ perception of the space’s ownership status (public or private) play a role in the accessibility and inclusiveness of these public spaces.
Considering the various perspectives highlighted by the literature, accessibility in this study examines physical, social, and economic access to public spaces. Factors such as the distance between residences and public spaces, amenities for access by the elderly or people with disabilities, the proportion of urban land allocated to public spaces, the quality of public space design, cost conditions, and security concerns influence accessibility. At the same time, inclusiveness analyzes people’s participation in the design and management of public spaces, social justice through the absence of discrimination against social groups because of their identity, and cohesion between different social groups in public spaces.
Drawing on existing literature, this study elaborated a conceptual framework based on the right to the city perspective and framed with urban fragility and spatial justice theories (see Figure 1).

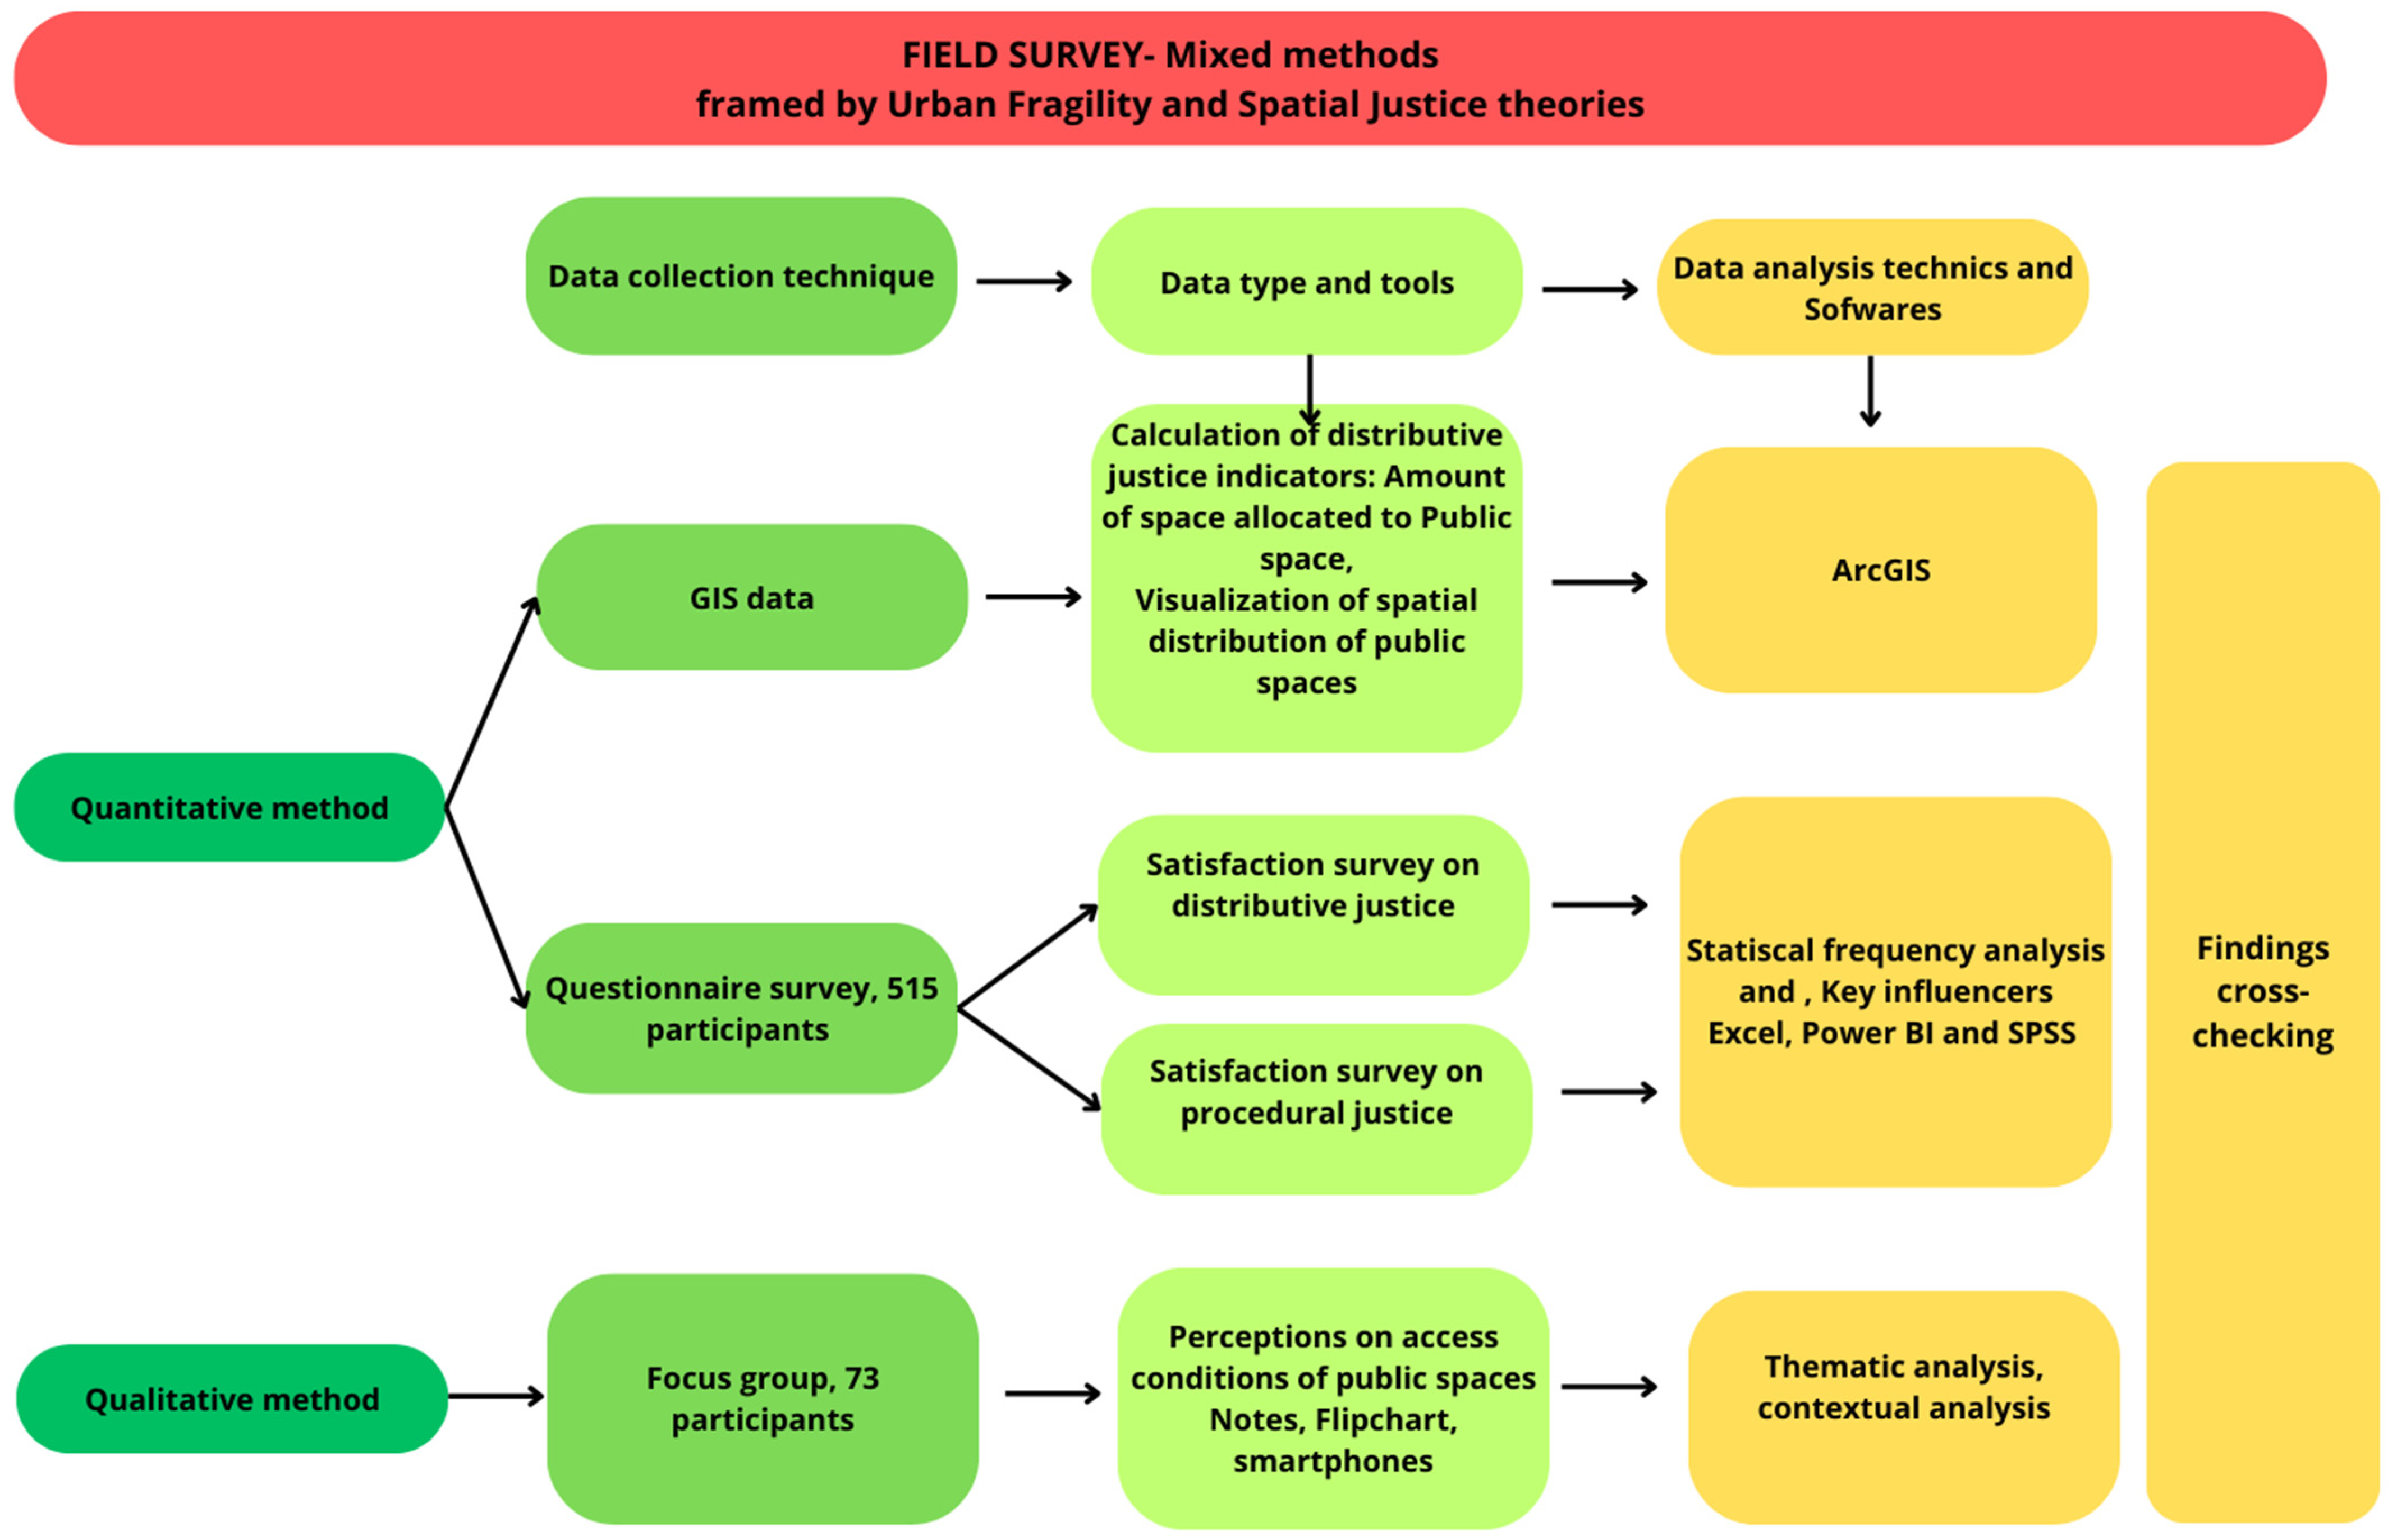
3. Materials and Methods

3.1. Study Design

A field survey combining qualitative and quantitative methods was used to conduct the study. According to Flick (2009) [42], the combination of qualitative and quantitative methods has the advantage of compensating in a complementary way for the weaknesses of each method. Furthermore, correlating and comparing findings from the methods used helps cross-validate the results. The study conceptualizes urban fragility and accessibility and the inclusiveness of public open spaces as social and spatial constructions, implying that their understanding is inseparable from the representations and actions of the actors interacting in the environment [43,44]. The study was positioned in the “right to the city” paradigm and framed with urban fragility and spatial justice theories (see Section 2.1 and Section 2.2).

3.2. Methodology Steps

Figure 2 illustrates the methodology steps. Section 3.2.2 and Section 3.2.3 describe the material and methods in detail.

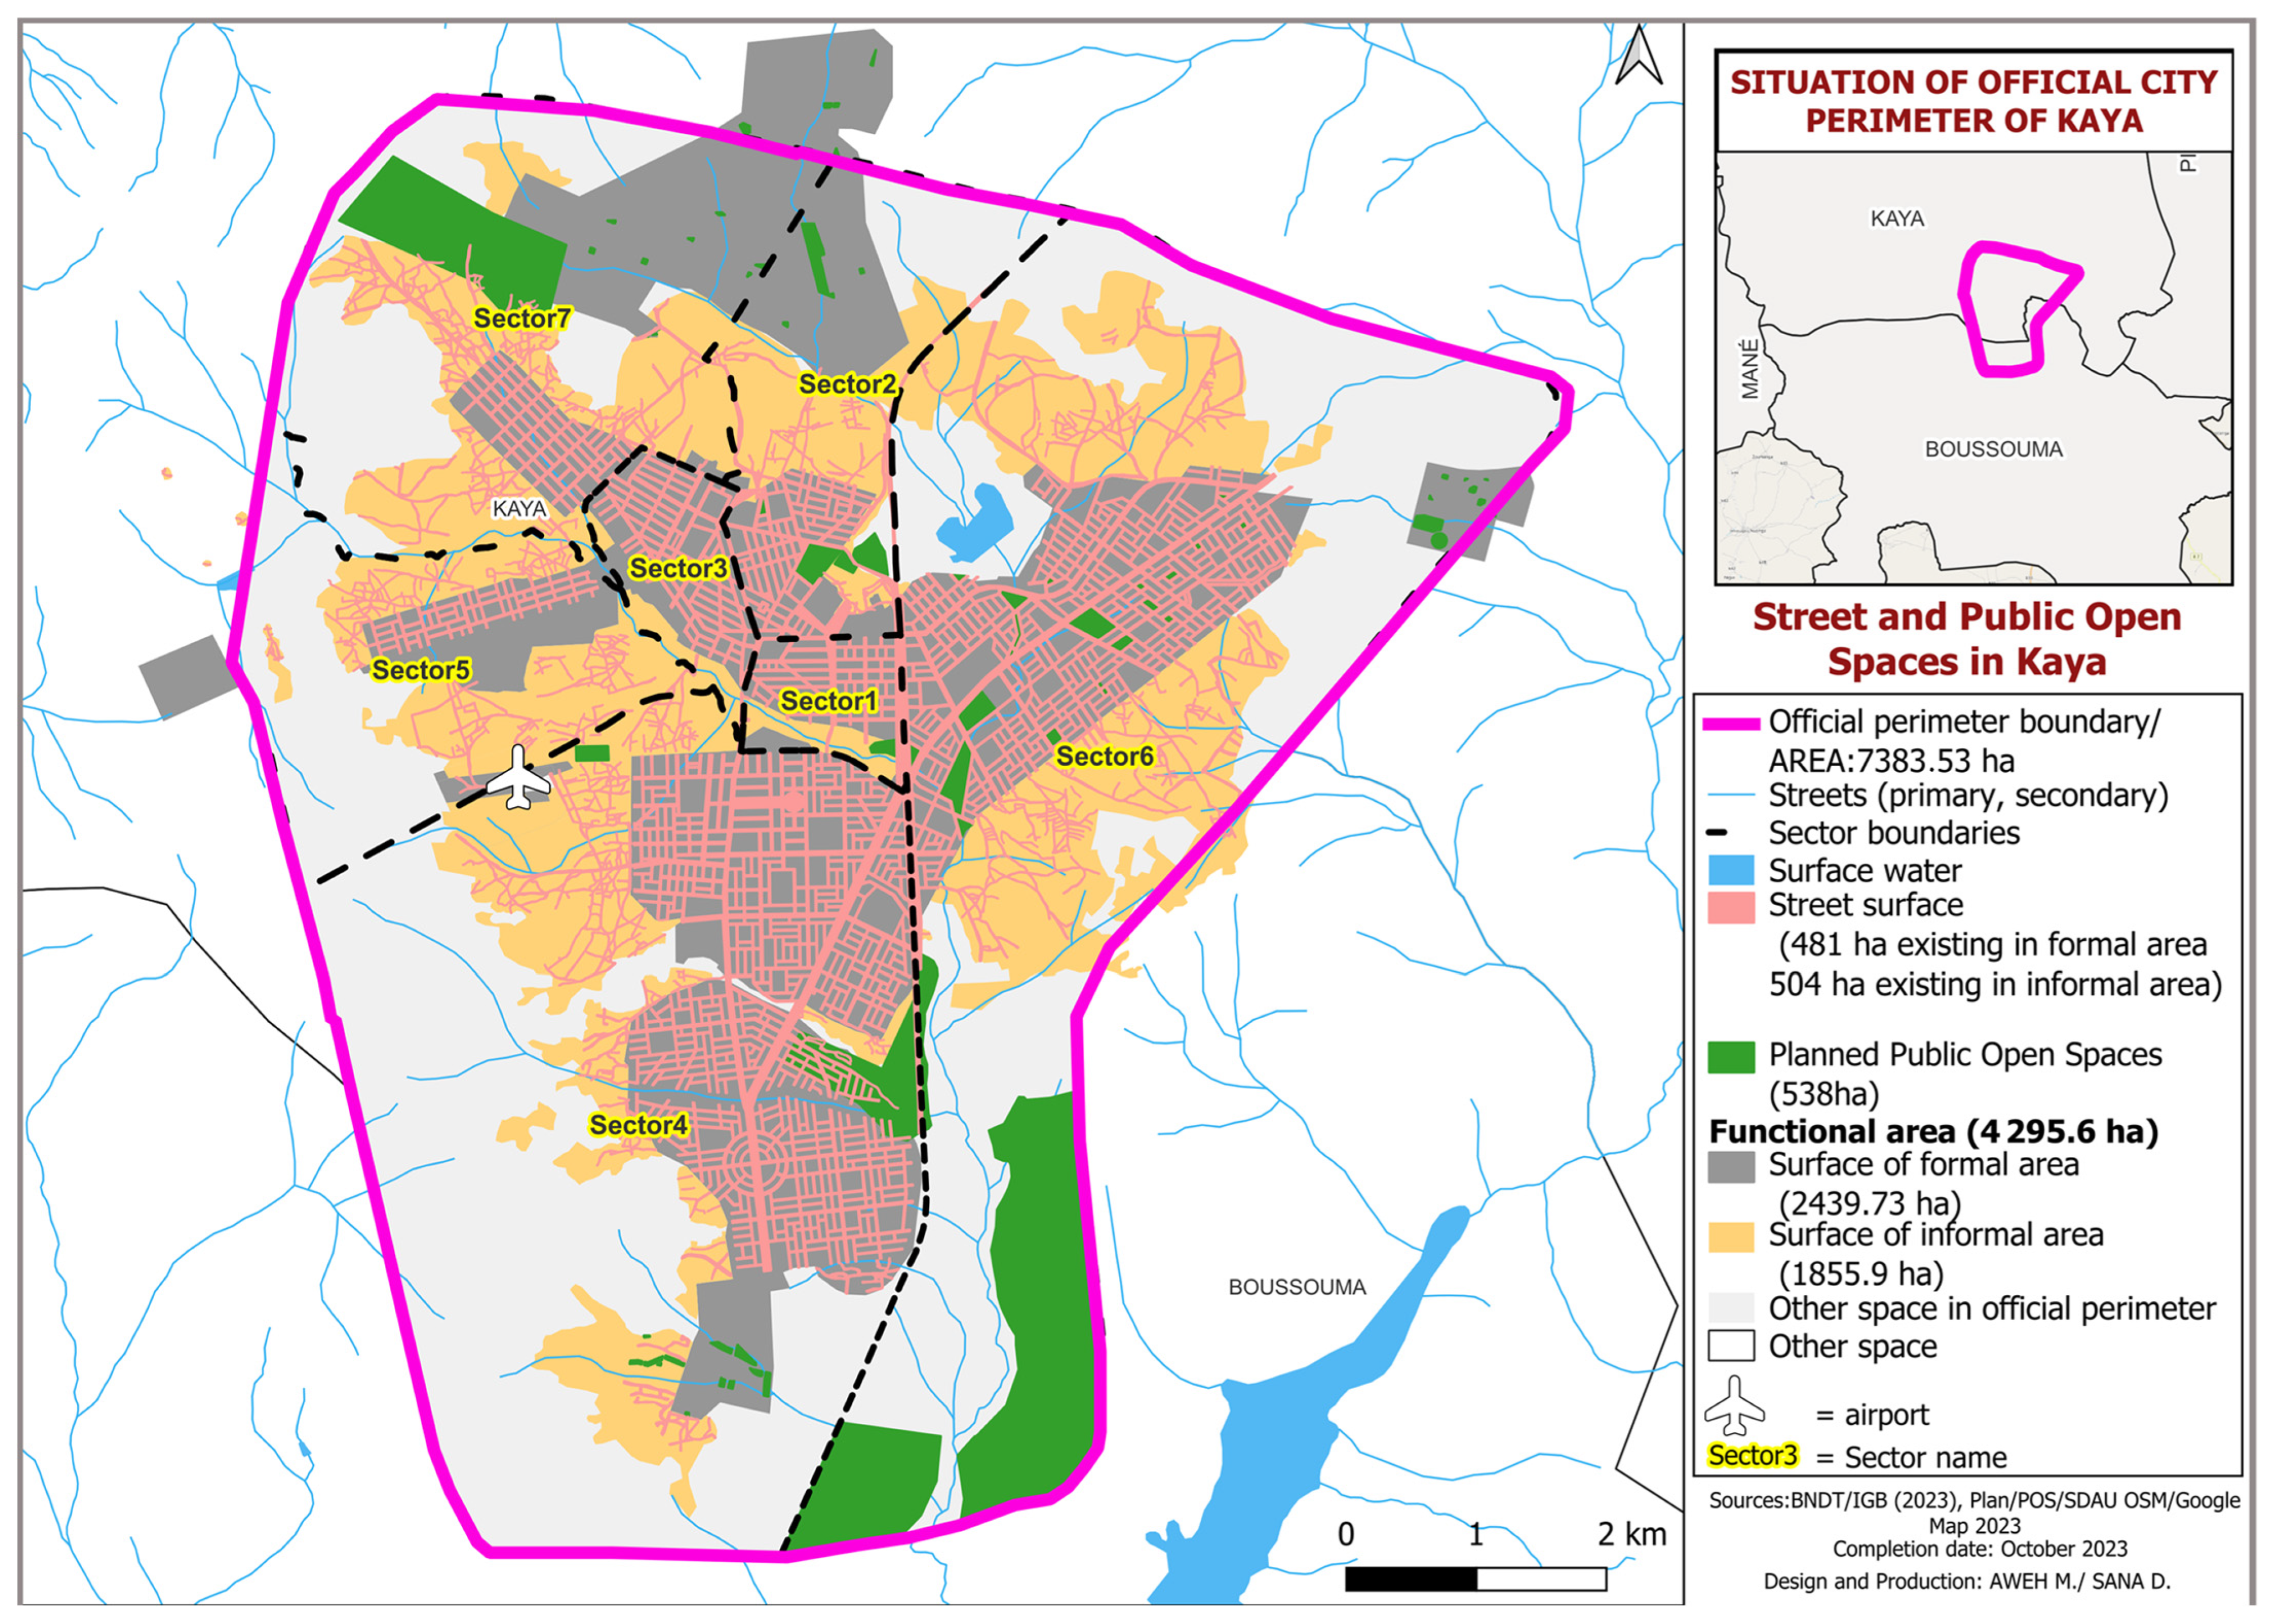
3.2.1. The Case Study: The Fragile Context of Kaya

The case study is Kaya, a city within the Kaya district of Burkina Faso. The city covers 27.048 km2, or just under 3% of the district territory. The city is organized spatially according to an administrative division into seven (7) sectors with defined boundaries (see Figure 3). Since 1955, the year of the first urban planning operation, twelve others have produced public open spaces in the city, with only five green spaces insufficiently developed.
According to Aweh and Atchrimi [7], political, security, socio-economic, and environmental issues have led Kaya to this fragile state. Politically, the 2022 coup d’état and subsequent transition have replaced democratic authorities with appointed bodies, resulting in an administration perceived as lacking authority and capacity, and a general sense of disorder and anarchy among the population. After 2014, when a new land law recognized the land property of autochthons, public authorities lost control over a significant proportion of urban land. This legislation severely hampered the ability of public authorities to initiate new urban development projects or effectively restructure informal settlements. Moreover, since the recognition of private property, urban development projects have encountered a significant obstacle: the inability of public authorities to finance the mobilization of land necessary to implement public infrastructures. Socially, rapid urbanization, driven by an influx of internally displaced people, has strained public services and exacerbated existing poverty. Young people and women dominate the demographic structure of Kaya, while social cohesion has been undermined by suspicion and tension between hosts and displaced people. Economically, inhabitants’ main activities are vulnerable due to informality. Some areas of the city are susceptible to flooding and the impacts of climate change. Finally, the prevailing sense of fragile security in Kaya is a direct consequence of armed attacks and acts of violence occurring throughout the country. This complex interconnection of factors has contributed to Kaya’s precarious situation [7].

3.2.2. Map Data Used to Analyze the Amount of Urban Land Allocated to Public Space and Spatial Distribution of Public Open Spaces

The method is based on the UN-Habitat guide for calculating the values of SDG indicator 11.7.1. Three of the four sub-indicators followed by UN-Habitat are calculated in this study. The three sub-indicators are (1) the proportion of land allocated to streets, (2) the proportion of land allocated to public open spaces, and (3) the proportion of land allocated to public spaces. To calculate the values of the sub-indicators, the following data were used: the built-up urban area, also known as the functional urban area; the area of land allocated to streets; and the amount of urban land allocated to public open spaces. The Kaya city development plans and the OpenStreetMap (OSM) databases were used to obtain data.

3.2.3. Qualitative Data Collection and Analysis Process

Six focus group sessions were organized at the Kaya municipal hall with the city’s social groups from July to November 2023, including the period for obtaining administrative authorizations and informing stakeholders.
  • Participants
The focus groups involved 73 participants aged 20 to 63. Table 1 shows the participants’ socio-demographic characteristics and the groups’ sizes. Except for authorities and public officials, most group members were illiterate.
  • Participant recruitment
To ensure the representativeness of the Kaya population, socio-demographic and spatial criteria such as gender, age, place of residence (considering all 7 administrative sectors of the city of Kaya), participant status (public/private), residence status (host resident/internally displaced person), and housing formality (formal or informal area) were considered primary criteria for participant recruitment. Participants were identified by the proposal of the Kaya authorities or leaders of local organizations. Invitation letters explaining the context and purpose of the research and specifying the voluntary and confidential nature of participation were sent to the targeted individuals. Focus groups were limited to 15 members to facilitate interaction.
  • Data collection
Data were collected through non-directive interviews in the local language (Mooré) to ensure inclusivity. Participants were guided by the central discussion question: What is your assessment of justice in access to public spaces in Kaya? Care was taken to minimize external influences on the exchanges with each group. The interview with each group lasted about an hour. Data were recorded using smartphones, and notes were taken on kraft paper and validated by the participants. These data were then transcribed onto Microsoft Word.
  • Data analysis
Data collected were analyzed using a thematic analysis technique that follows a structured approach to identify patterns and meanings within participants’ responses. The coding categories were based on the conceptual framework linking urban fragility, the right to the city, and spatial justice. The entire transcripts were analyzed at the text level with insight at the sentence and paragraph levels where relevant. Contextual analysis was applied to interpret narratives within the lived experiences of urban actors [45].

3.2.4. Quantitative Method for Collecting and Analyzing Actors’ Perceptions of the Accessibility and Inclusiveness of the City’s Public Open Spaces

  • Inclusion and exclusion criteria
Only individuals residing in Kaya, either host residents or internally displaced people, were selected. Diversity was also considered a criterion for ensuring the participation of different social groups. Participants were also included based on voluntary and informed consent. Individuals outside the study area were excluded for geographical relevance.
  • Participants characteristics
The survey participants were people of all sexes and all age categories (see Table 2) selected among residents. Kaya residents are predominantly Mossi in ethnicity and include a significant category of people with no schooling. The inhabitants of the city of Kaya are mainly engaged in informal economic activities in trade, agriculture, livestock, and crafts. The main religions practiced in Kaya are animism, Islam, and Christianity.
  • Sampling method, sample size, and representativeness
Based on a sampling frame of 231,000 inhabitants [46,47] from Kaya, a sample was drawn up using the quota method. The quotas considered the representativeness of the different social sensitivities in the sampling frame. The representativeness criteria considered gender, age, area of residence (formal or informal), residence status (resident host/internally displaced person), and geographical area of residence.
To determine the appropriate sample size, the Yamane formula cited by Ahmed [48], considered one of the most common survey methods used to estimate an appropriate sample size for a given population, was used. This formula estimates the sample size as a function of the total size of a population and the desired margin of error. The formula for calculating Yamane’s sample size is as follows:
n = N 1 + N ( e 2 )
  • n = sample size.
  • N = population size.
  • e = margin of error expressed in decimals, generally equal to 0.05 for a margin of error of 5% corresponding to an accuracy of 95%.
Applying the formula to the population of 231,000, assuming a margin of error of 0.05, the sample size is obtained in Equation (2).
n = 231,000 1 + 231,000 ( 0.05 2 ) = 399
Based on the calculated sample of 399 people to be surveyed, an adjustment was made by considering a larger sample of 515 people to ensure adequate representation of the main sub-groups of the population, thus enabling meaningful comparisons and sub-group analyses (see Table 2).
  • Data collection
Data were collected using questionnaire surveys from July to November 2023, including the period for obtaining administrative authorizations and informing stakeholders. The questionnaire focused exclusively on public open spaces and measured distributive justice (accessibility) and procedural justice (inclusiveness) using carefully designed variables. Variable selection (see Table 3) was guided by the conceptual framework as described in Figure 1.
To make it easier to understand the questions posed to respondents, most of whom were illiterate or had low literacy levels, a visual method was used, illustrating concepts with images and using smileys to illustrate mood scales. The questionnaire was administered using the kobo collect application via smartphones.
  • Data analysis
Data extracted from the kobotoolbox platform were processed using Microsoft Excel and IBM SPSS Statistics 20. Statistical frequency analysis was used to examine the distribution of key variables related to spatial justice. Pie charts were used to visualize the spread of data across different categories. Power BI software’s (Version: 2.140.1476.0 64-bit) Key Influencers tool was used to identify which spatial and socio-demographic variables were the most significant factors affecting spatial injustice and then highlight fragile conditions.

4. Results

The results are presented in four sections: Section 4.1 presents the core findings, Section 4.2 presents the share of urban land allocated to public spaces, Section 4.3 presents the participants’ perceptions from focus group interviews, and Section 4.4 presents the questionnaire survey results.

4.1. Key Findings

The results show that while the open public spaces in Kaya support citizens’ social and economic activities, particularly the most vulnerable, their accessibility remains uneven due to constraints induced by urban fragility, such as insecurity, economic barriers, and lack of inclusive governance. Key findings are insufficient land allocated to public open spaces, unequal spatial distribution, and political, social, and economic constraints influencing the accessibility and inclusivity of public open spaces.

4.2. Amount of Urban Space Allocated to Public Spaces and Spatial Distribution of POSs

Figure 3 shows the urban land allocated to streets and public open spaces in Kaya and the unequal spatial distribution of public spaces, especially in informal areas. Based on the UN-Habitat method, the share of urban space allocated to public spaces is detailed in Table 4.

4.3. Focus Group Participants’ Perceptions of Justice in Access to Public Spaces

The perceptions of the focus group participants (see Table 5) corroborate the GIS analyses by highlighting the unequal distribution of open public spaces to the detriment of informal areas. Depending on the specific characteristics of the groups consulted, several challenges relating to fair access to public spaces were highlighted. Some groups, such as women’s associations and public officials, feel that urban design plans do not provide enough public green spaces and places of worship. The strong need for places of worship combined with the lack of spaces planned for this purpose has led to the detour of certain public spaces from their original use. According to seniors and people living with disabilities, changes in the use of public spaces are made without prior consultation with citizens. Informal settlements lack public spaces, as revealed by the perceptions of participants living in those areas. Administrative burdens, corruption, lack of transparency in procedures on public spaces, and the monopolization of some public spaces felt by women’s associations reveal a lack of inclusive local governance. Economic accessibility challenges are raised by women’s associations, and physical accessibility challenges are raised by the elderly and people with disabilities. Internally displaced people perceive rejection from public spaces.

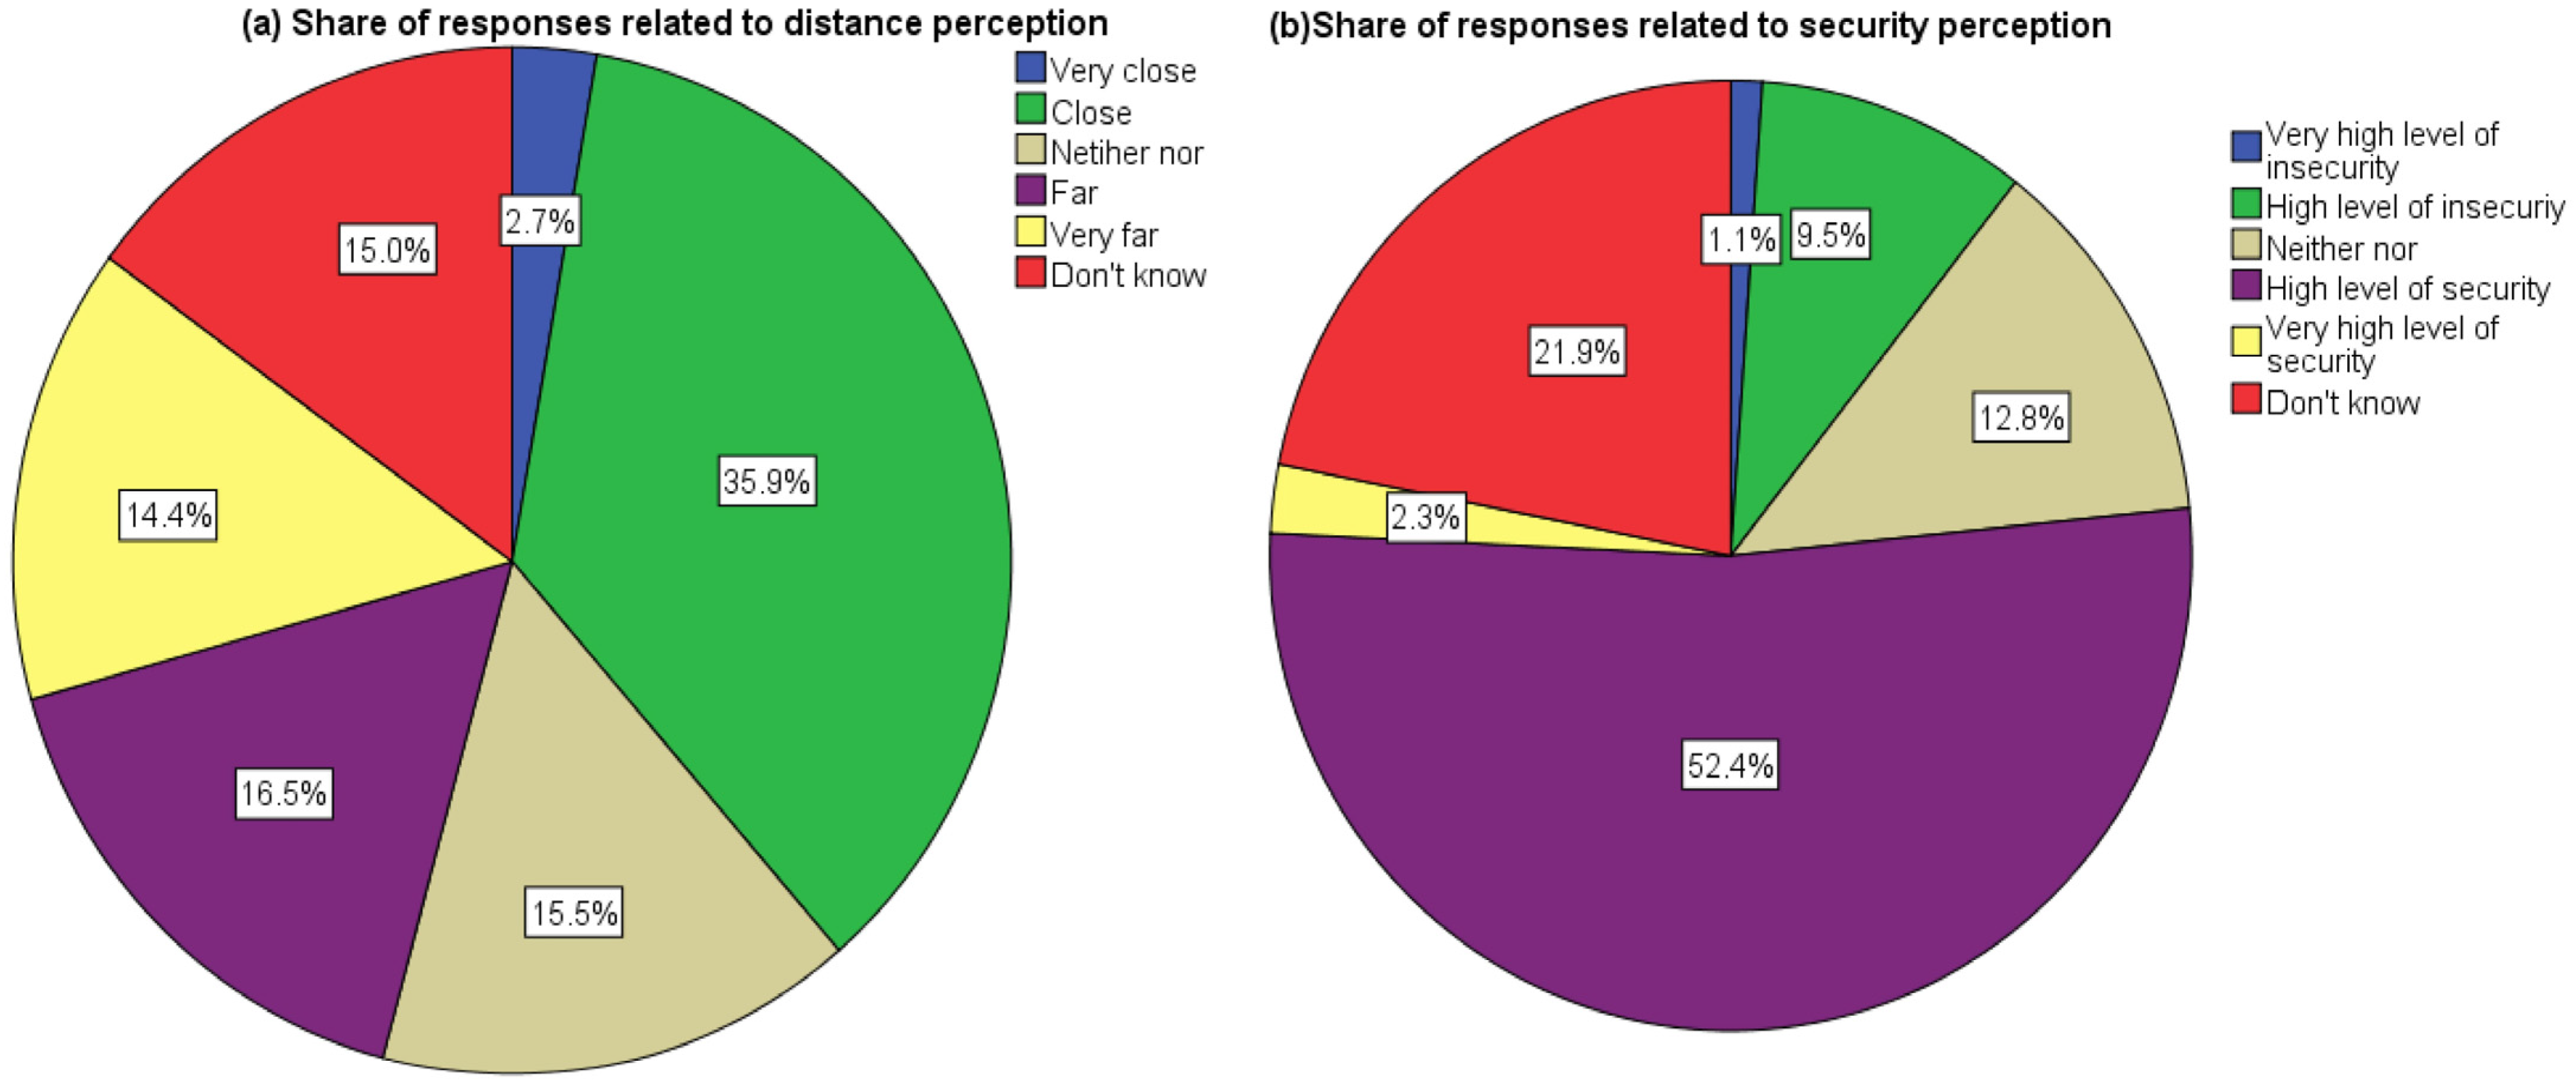
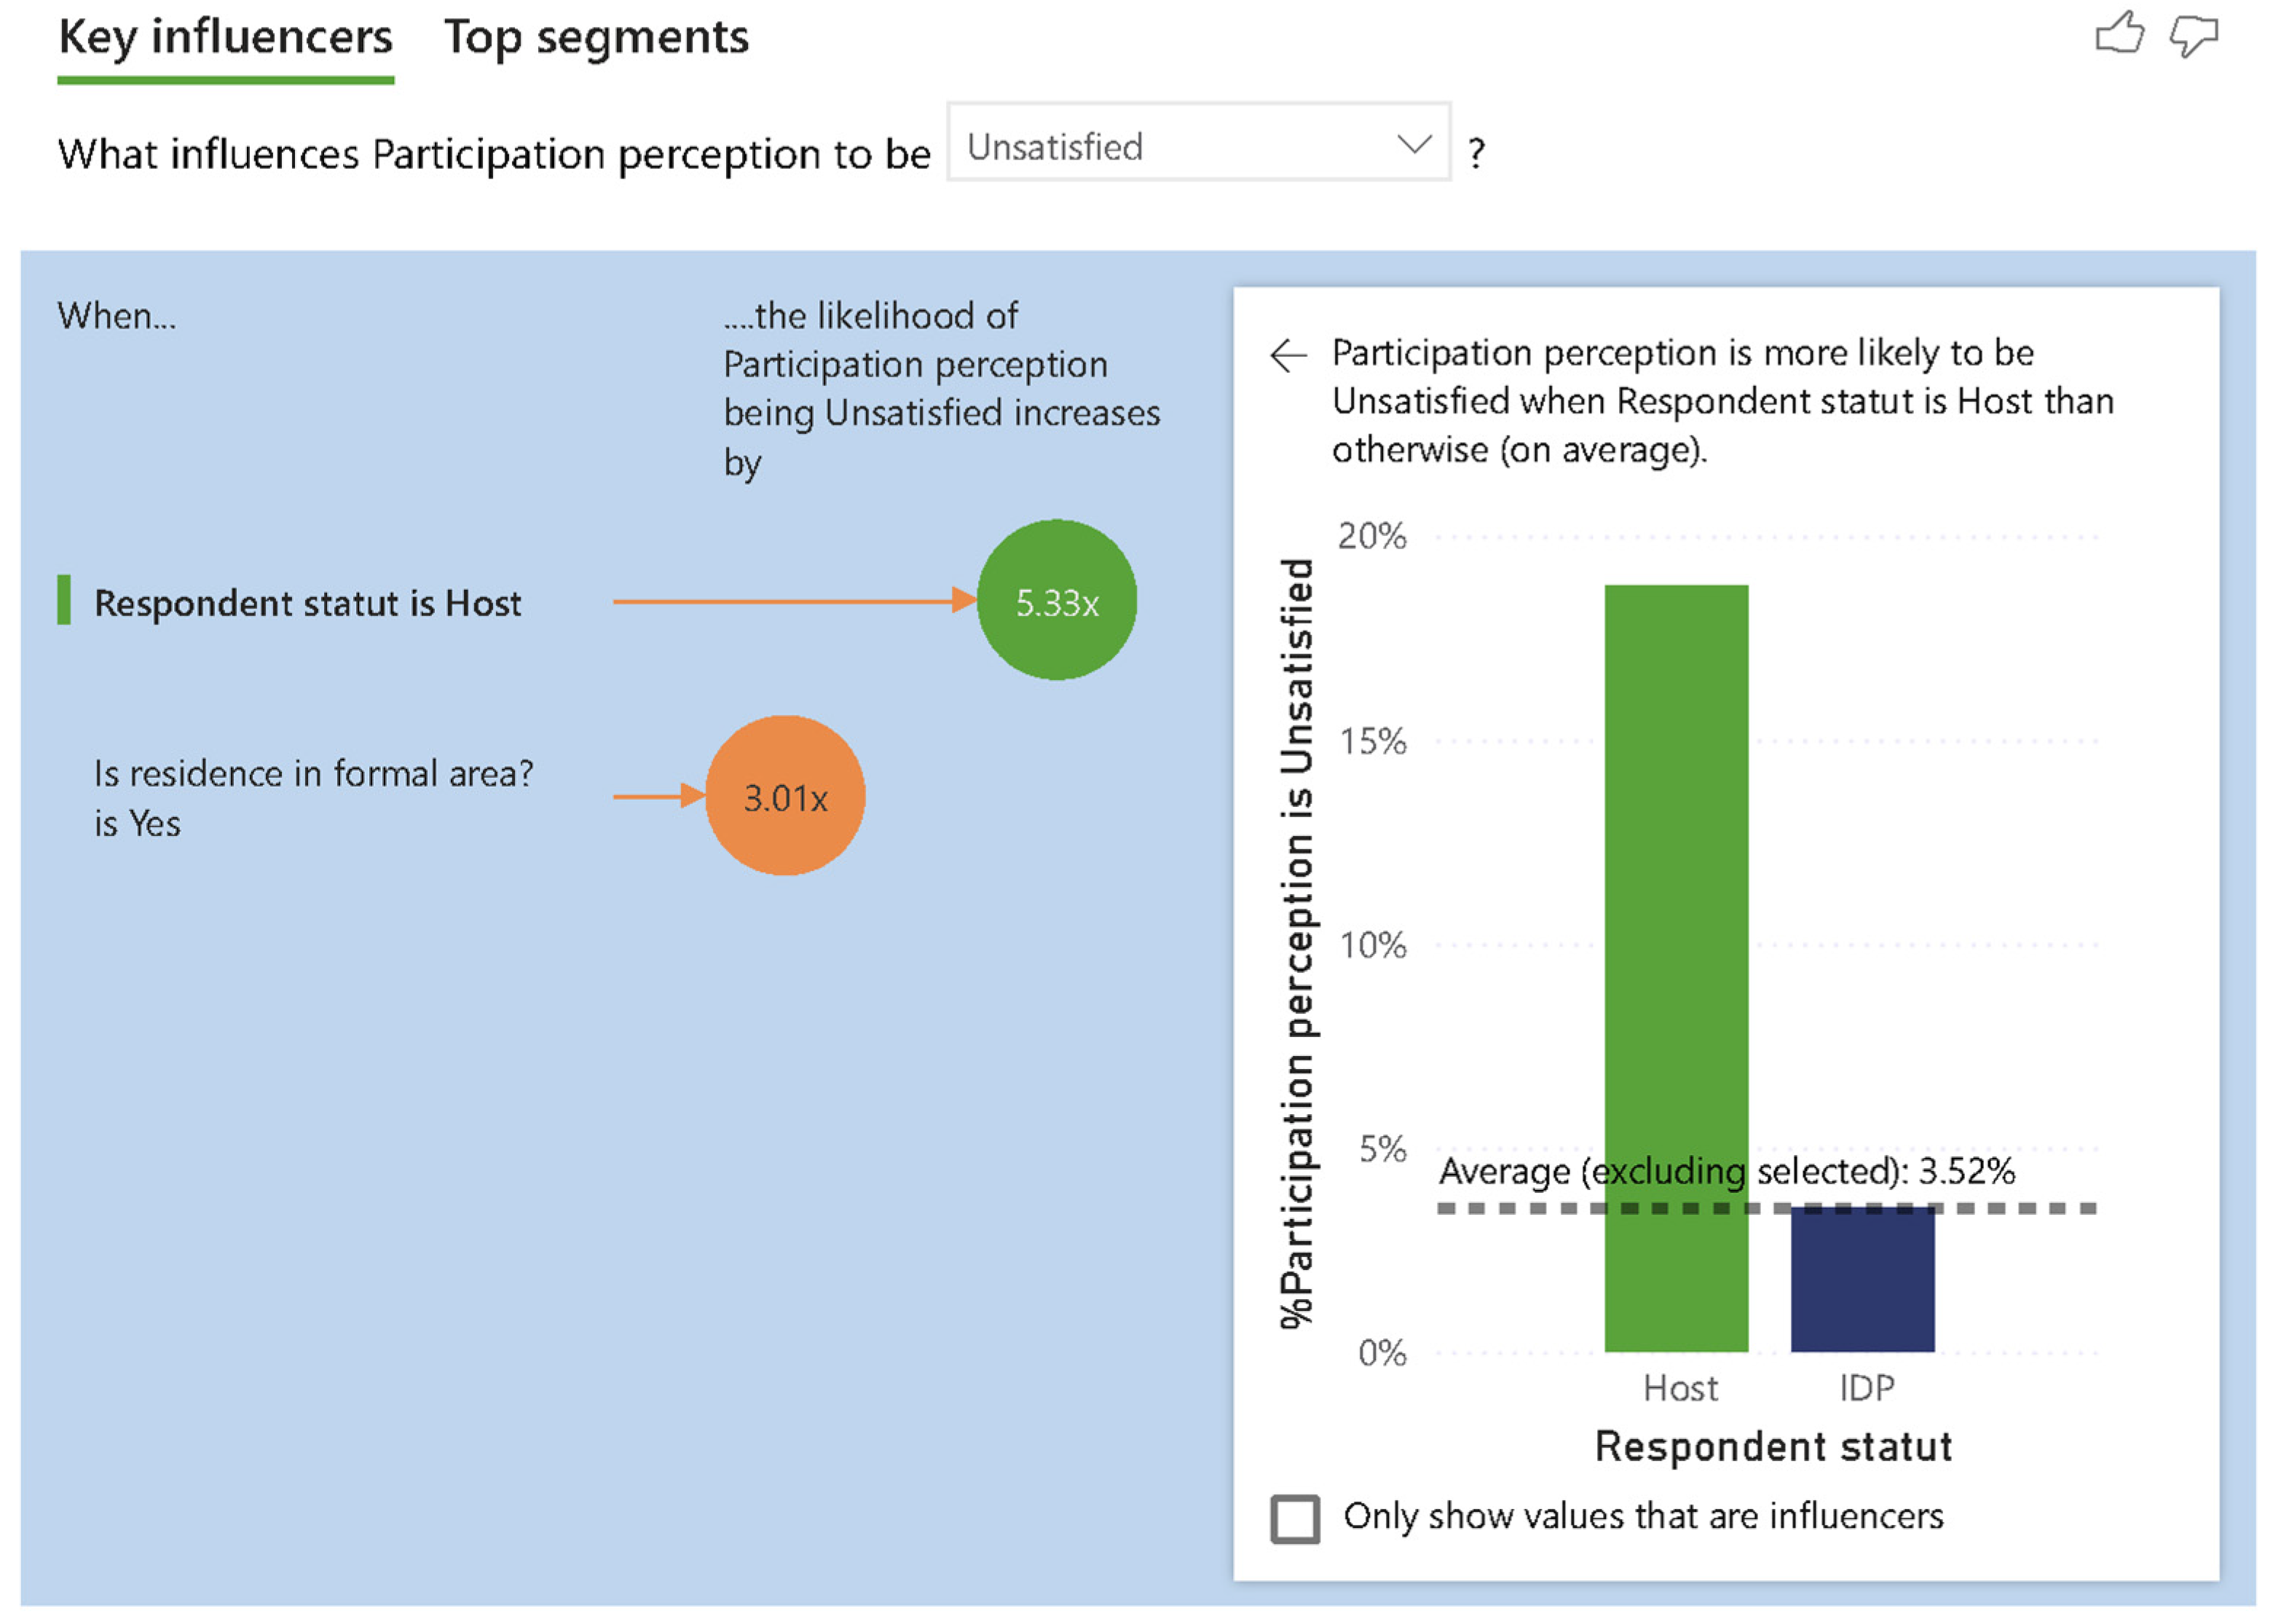
4.4. Results of Questionnaire Survey on Accessibility and Inclusiveness of Public Open Spaces (POSs)

Questionnaire results are illustrated in Figure 4, Figure 5, Figure 6, Figure 7 and Figure 8. They show respondents’ perceptions regarding distributive and procedural justice in relation to public open spaces (POSs) in Kaya. Figure 4 presents respondents’ views on the proximity of POSs to their residences and their perceived safety levels. Figure 5 highlights perceptions of participation in POS planning and management. Figure 6, Figure 7 and Figure 8 use Key Influencer visualizations to analyze further the key factors influencing these perceptions, revealing demographic and spatial patterns that shape access to and engagement with POS.
Figure 6 shows key factors influencing participants’ perception of distance as “very far” when asked to describe their perceived distance from the residence to the POS.
Figure 7 shows the key factors influencing security perception as a “high level of insecurity” when participants were asked how they perceive the level of security in POSs.
Figure 8 and Figure 9 show the key factors influencing the variable of participation in processes relating to the development and management of POSs. The factors highlighted are those that influence the following categories of answers: “Don’t know” and “unsatisfied”.

5. Discussion

The discussion aims to highlight the main results on the accessibility and inclusiveness of public spaces in the fragile context of the city of Kaya while relating them to the existing literature and our hypothesis.

5.1. Spatial Data and Users’ Perceptions Show Disparities and a Supply of Public Open Spaces Under Sustainable Development Standards

A look at the spatial distribution of public open spaces (see Figure 3) reveals an uneven distribution of these public assets to the detriment of peripheral areas and informal settlements. Table 6 highlights the low level of provision of public open spaces compared to the SDG standards, both in terms of the proportion of land allocated to streets and the proportion of land allocated to public open spaces. This fact is corroborated by group discussions and questionnaire results pointing out that people living in informal areas are more likely to find public space far away than other users. The results thus highlight the limited ability of local and state authorities to supply sufficient public spaces for users.
Compared with other secondary African cities, the situation in Kaya seems better. The proportion of land allocated to public spaces is 16% for the city of Djougou in Benin and 20% for the city of Awassa in Ethiopia, according to figures published by UN-Habitat [49]. The relatively high score achieved by the city of Kaya could mask a less satisfactory reality on the ground, given that certain public spaces are subject to changes in use, as shown by the results of the group interviews.

5.2. Fragility Factors Foster Challenges in Terms of Accessibility and Inclusiveness of Public Spaces and Spatial Disparities

5.2.1. Political Challenges Lead to Spatial Injustice in Open Public Spaces, Thus Hindering the Right to the City for All

The results show that the political challenges encompass weaknesses in local governance, illustrated by corruption, lack of transparency and red tape, complex procedures, weak public authority over land in informal settlements, local elites’ control of public assets, and lack of public capacity in developing public open spaces. These challenges directly contravene the right to the city’s emphasis on participatory urban planning and democratic control of urban space. Regarding distributive justice, physical accessibility is limited by an insufficient supply of green places in urban design plans, lack of facilities for physical access for people with disabilities and the elderly, diversion of uses of public spaces without prior consultation with users, and limited physical access due to remoteness of public open spaces both in formal and informal settlements. As for procedural justice, inclusiveness is impacted by a high dissatisfaction with user participation in the design and management of public open spaces. The results show that host residents and those living in formal housing areas are more likely to be dissatisfied with participation than IDPs and residents of informal areas. This suggests that people living in regular conditions are more likely to express the need to participate in public decision-making than others. Exclusion is highlighted by a high level of people who are unaware of their right to participate, particularly among people living in peripheral areas, young people, women and people living in informal areas, and IDPs.

5.2.2. Social and Economic Conditions Worsen Disparities in Public Open Spaces

The social condition of Kaya is marked by rapid urbanization, an influx of IDPs, poverty, social tension between hosts and IDPs, vulnerability of economic activities due to informality and climate change risks, high taxes, and costs of access to public spaces. Regarding distributive justice, this context leads to limited economic access to public spaces for low-income groups such as women. Due to the high social demand for public spaces, vulnerable users suffer from limited economic access. The procedural justice lens highlights social injustice and discrimination against low-income social groups such as women, discrimination against vulnerable groups due to the high social demand for public spaces and monopolization of public spaces by minority elites, and feelings of rejection experienced by IDPs in public spaces.

5.2.3. Environmental and Security Conditions Make Public Spaces Risky for Users

Kaya is exposed to flooding events, especially in areas without water-draining infrastructures. Consequently, public open spaces in those areas have limited accessibility during rainy seasons and induce social injustice to communities living in informal settlements and areas without water drainage infrastructure. Although most participants in the survey consider public spaces safe, young people generally perceive a high level of insecurity in these spaces, which reduces their physical accessibility. The results show that some areas used by young people are unsafe.

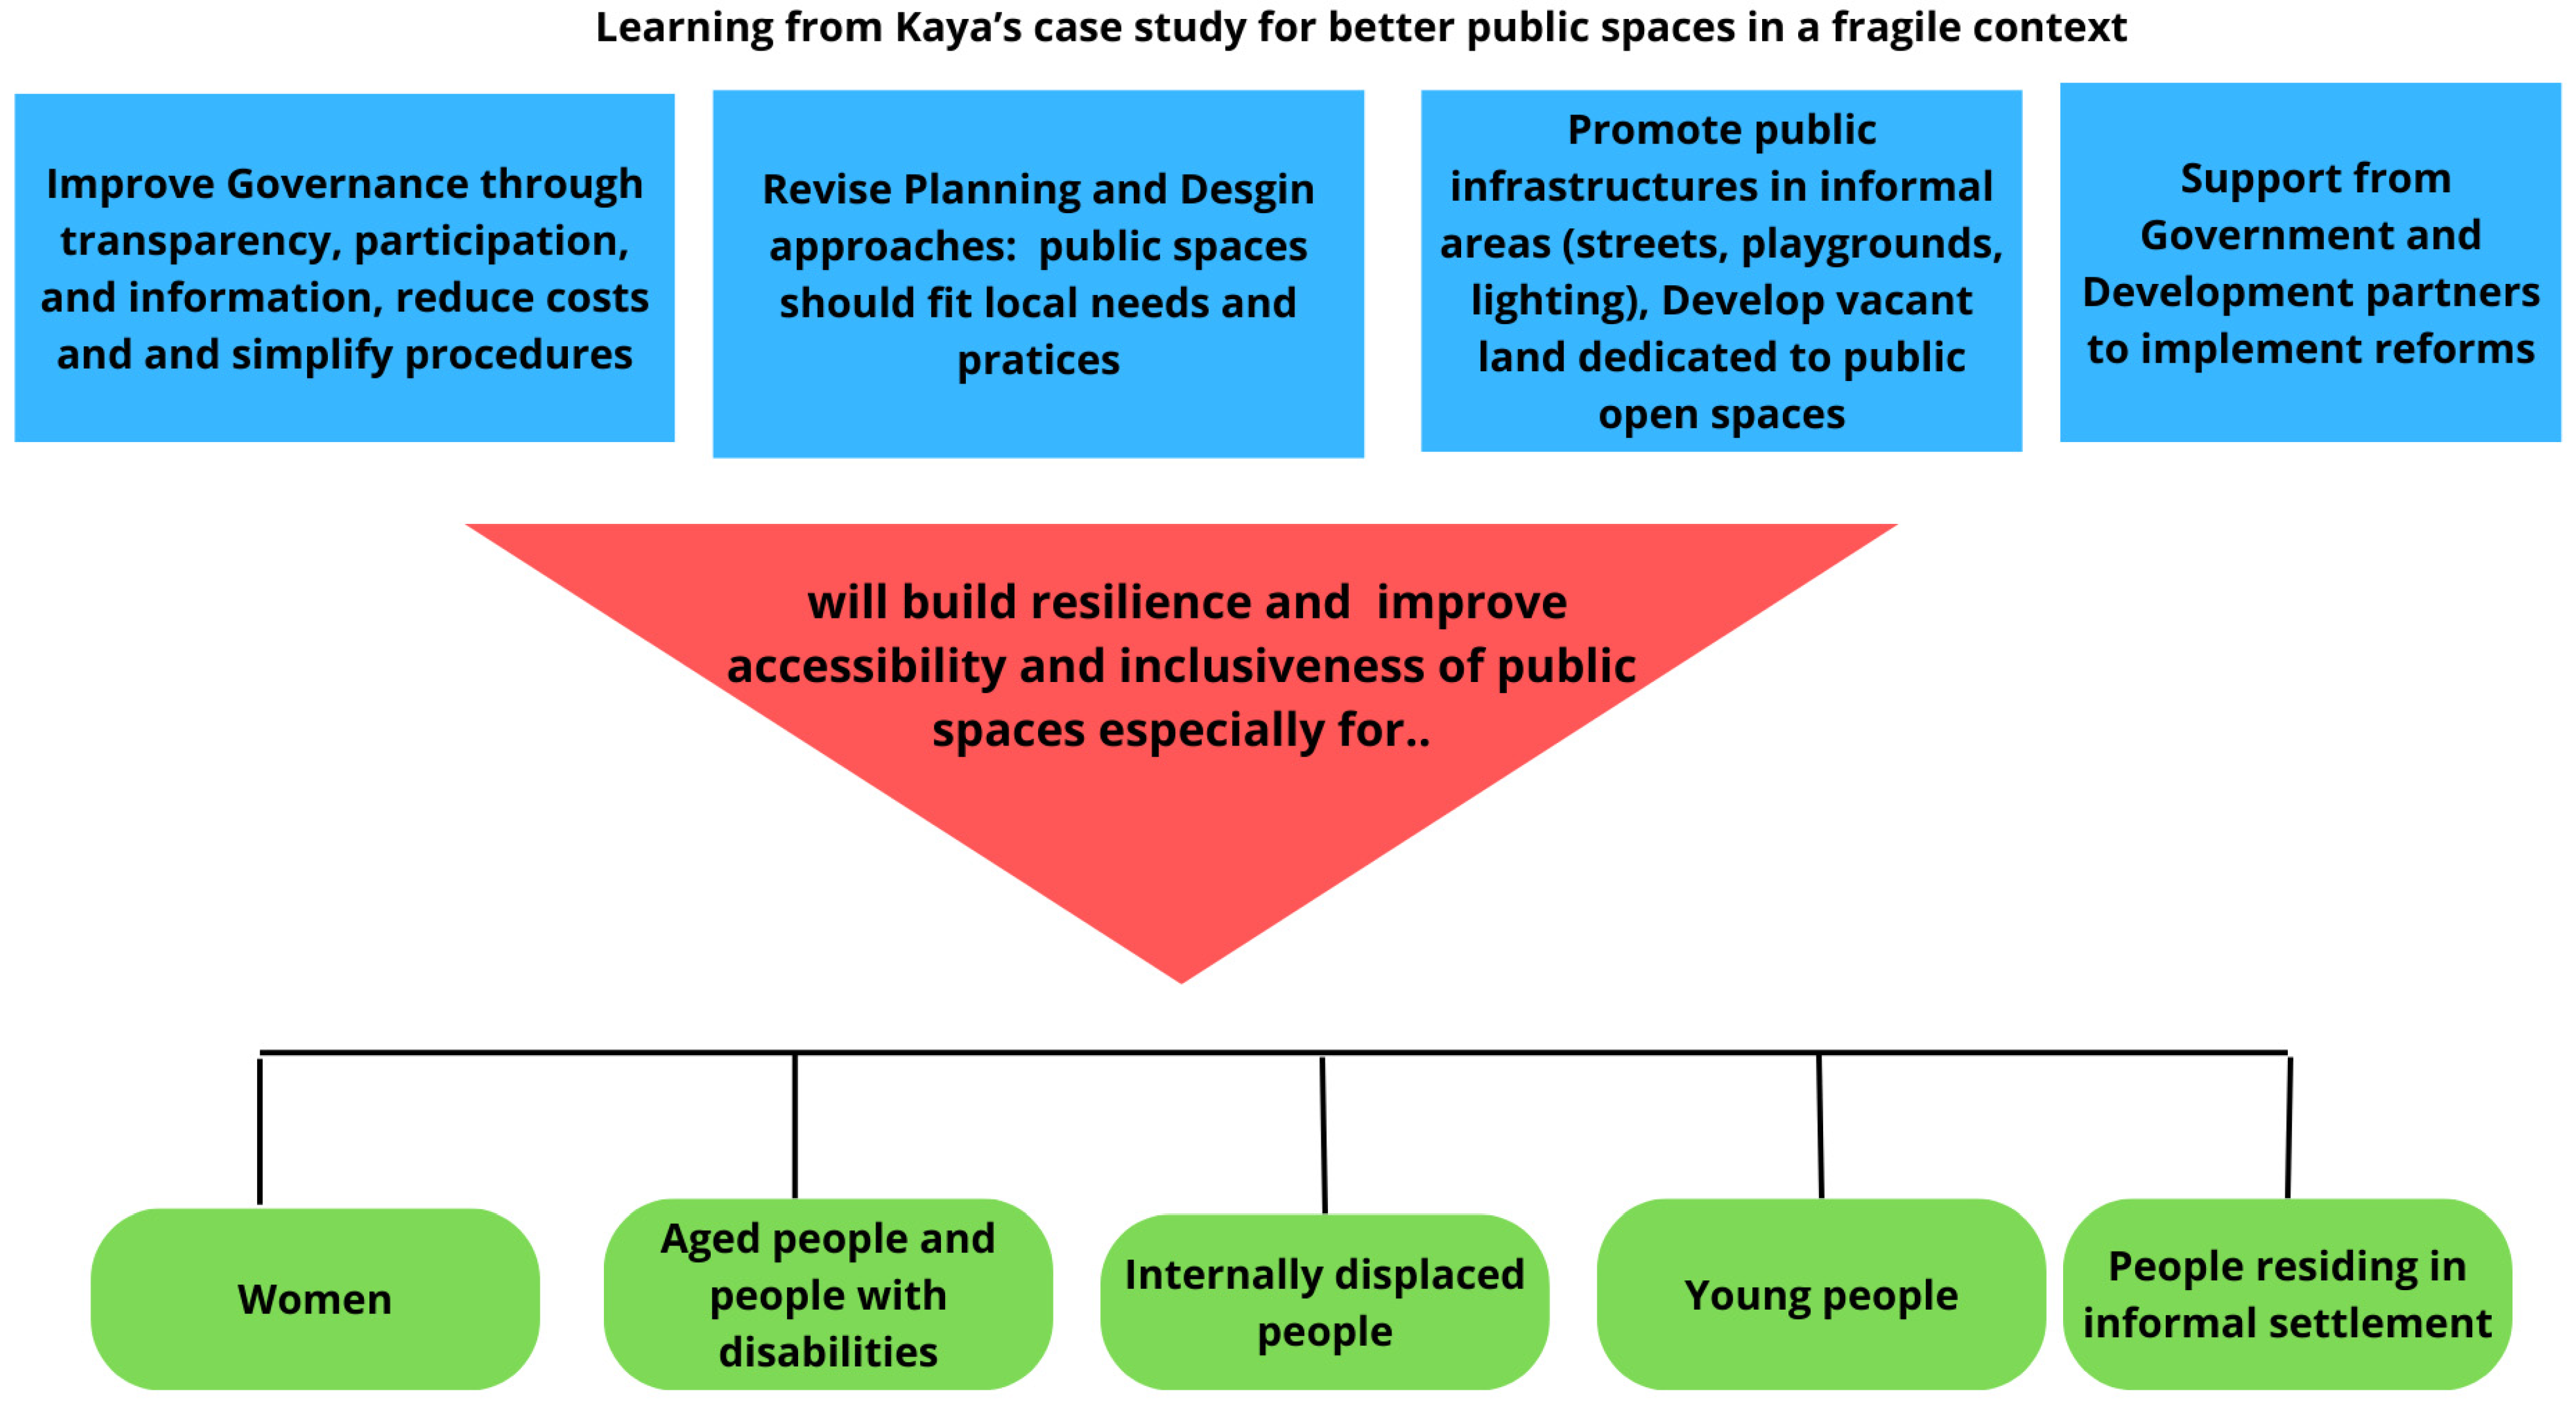
5.3. Key Lessons from the Study and Previous Research

Results from GIS data, focus groups, and questionnaires all demonstrate that fragile conditions exacerbate spatial injustice and hinder the right to the city. Findings from GIS data reveal an insufficient share of urban land allocated to public open spaces and an unequal distribution of these spaces, particularly in informal settlements. Participants in focus groups confirmed this observation by pointing out governance failures, land control issues, and social inequalities affecting accessibility. The questionnaire survey results further validate these insights, showing that vulnerable groups perceive public spaces as distant, unsafe, and lacking inclusivity. As noted in Chenal’s [8] interpellations, the study demonstrates that public actors with authority and the capacity for action influence the improvement of inhabitants’ living conditions. Conversely, urban planning is a source of exclusion and social tension when it is drawn up and implemented in a context of institutional failure, as Amounou points out [24]. The importance of social group participation in decision-making processes that affect everyday life corroborates the World Bank’s argument [50] that social inclusion translates into improved stakeholder participation in society. The results also show that the inclusive function of public spaces is not systematically self-evident. The observed models of accessibility and inclusion reinforce the idea that open public spaces are not only vectors of urban justice, as some authors show [11,36], but also the product of it. Transparent governance and measures aimed at specific groups such as the elderly, women, young people, and people living with disabilities need to be translated into reality, as suggested by authors such as Jacobs [17]. Considering the findings, measures to address fragility and enhance spatial justice in public spaces (see Figure 10) should be driven by fostering inclusive decision-making and local resilient practices and recognizing the inherent capacities of public and private actors, as suggested by various authors [22,51]. In addition, public authorities should plan to allocate a generous share of urban space to public open spaces, particularly in informal settlements, as recommended by Shlomo et al. [52] in alignment with the making room paradigm.
While this study highlights the need to take action to improve governance and to invest in public open places in informal areas, our investigation may not have captured the full range of spatial justice challenges. Furthermore, recommendations do not mean that for example residents in formal housing areas do not face challenges related to the planning and design of public open spaces.

5.4. Methodological Contributions and Limitations

By conceptualizing urban fragility, accessibility, and inclusiveness as social and spatial constructs, this study prolifically combined qualitative and quantitative approaches to highlight the relationships between these different concepts. The findings revealed how considering residents’ perceptions can help public authorities and planners understand accessibility and inclusion issues in public spaces, as highlighted by Zobec et al. [53], Das and Honiball [25], and Chitrakar et al. [41]. This study’s operating framework has enabled us to gain deep insights into the impact of fragile conditions on the accessibility and inclusiveness of public open spaces, thus reinforcing Soja’s [35] perspective on the utility of spatial justice.
One limitation of the methodology is that the focus group discussion focused on participants’ perceptions of access issues in public spaces without exploring how familiarity and sharing of specific public spaces influence perceptions and experiences. Furthermore, even though different social sensitivities are considered, the use of focus groups entails risks of bias. The involvement of the municipal authorities in helping to recruit focus group participants may have restricted freedom of expression, thus biasing the results. In addition, opinions emanating from each group may be influenced by dominant participants, thereby overshadowing the opinions of discreet participants. The questionnaire survey is also based on voluntary participation, so responses may not represent the city’s entire resident population.

6. Conclusions

In Africa, knowledge about the accessibility and inclusiveness of public open spaces remains limited, particularly in cities facing fragile conditions. This study’s objectives were to investigate Kaya’s fragile context impact on the accessibility and inclusiveness of its public open spaces. The study, designed as a field survey, used mixed methods to achieve the research objective. Urban fragility and spatial justice theories were used to frame the study. In addition to map data, six focus groups involving 73 participants were organized, and questionnaire surveys were sent out to a representative sample of 515 inhabitants of the town of Kaya. Thematic and contextual analysis were used to interpret qualitative data. GIS tools, pie charts, and Key Influencer tools helped visualize and analyze quantitative data. The study results reveal spatial disparities and undersupply of public open space in Kaya. Users perceive that the fragility of the city, illustrated by the weak capacity for action of the public authorities and the shortcomings in governance, particularly in the planning and management of public spaces, led to forms of spatial injustice and social exclusion in Kaya. According to urban actors, social injustice and exclusion in Kaya are driven by significant challenges related to participation, inclusive governance, the spatial distribution of public spaces, and security.
This study contributes to a better understanding of African cities’ challenges in an international context that calls for the right to the city for all. Following on from existing work on spatial justice and the right to the city, the study highlights how urban fragility can be reinforced or mitigated through a good knowledge of the dimensions of accessibility and inclusiveness of public spaces. These results support previous research by demonstrating how political, social, economic, and security factors shape urban exclusion while providing new empirical perspectives from the Kaya context. Based on a theoretical foundation combining the approaches of distributive justice and procedural justice and a mixed-methodological approach combining quantitative and qualitative methods, the study proposes a pathway for exploring how urban fragility impacts the accessibility and inclusiveness of public open spaces in the context of African cities. Cities facing deficits in authority, capacity for action, inclusive planning and governance cannot achieve urban Sustainable Development Goals. By aligning with the principles of the right to the city, which emphasize equitable access to urban resources, this study presents opportunities to rethink public open spaces, governance, and planning to combat fragility. By positioning open public spaces as a framework for studying the influence of urban fragility on spatial justice, the study highlights the need for policies that reinforce the right to the city in fragile contexts.
Addressing deficits in the accessibility and inclusivity of open public spaces requires an approach that transcends physical infrastructure and spatial equity to consider governance and social participation as fundamental pillars of equitable urban development. For future development policies, it is crucial to encourage prior consultation with different social groups when drawing up development plans to ensure that public open spaces meet the diverse needs of populations. Innovative approaches, such as the co-design of public open spaces, need to be explored. More effective and active participation of uninformed or socially disempowered social groups in the planning and designing of public open spaces must be promoted. It is also necessary to build transparent and simplified mechanisms to facilitate the rules governing the use of public open spaces by citizens, especially those who are vulnerable and marginalized. For spatial justice, the equitable use of public spaces must be implemented, encouraging community and informal activities involving various groups.
Given the results, this study recommends support from government and development partners for cities living in fragile contexts through actions to strengthen their governance capacities and investments in developing and maintaining public open spaces. In practical terms, establishing local public space committees that involve various community representatives, such as women, youth, the elderly, and internally displaced people, will help improve public space management. Additionally, given the high mobile phone and social media usage despite widespread illiteracy, digital platforms based on social media can be developed to help residents report issues and suggest improvements in administrative procedures. Investment in main streets and within informal settlements will reduce spatial injustice and ensure inclusive access to public spaces. Affordable infrastructure solutions can enhance resilience by upgrading informal spaces to serve as temporary public spaces or investing in basic amenities for vacant public places.
This study’s results remain limited to the case of a secondary city in Burkina Faso. A deeper understanding and generalization of the accessibility and inclusiveness of public spaces and solutions to combat fragility in African cities require similar studies of cities of varying sizes, both in Burkina Faso and other African cities. Long-term follow-up studies are recommended to understand the real impact of policy suggestions in improving resilience. For example, if community participation initiatives or infrastructure investments are introduced, tracking their effects over time would help assess whether they lead to meaningful improvements in accessibility and inclusiveness. Furthermore, future research should investigate informal practices of access to public spaces in urban fragility and explore broader issues by examining how familiarity and sharing of spaces influence the perceptions and experiences of inhabitants of fragile cities.

Author Contributions

Conceptualization, M.A.A.; methodology, M.A.A.; validation, M.A.A.; formal analysis, M.A.A.; investigation, M.A.A.; writing—original draft preparation, M.A.A.; writing—review and editing, M.A.A.; visualization, D.S.; supervision, T.A. All authors have read and agreed to the published version of the manuscript.

Funding

This research was funded by the World Bank, the Association of African Universities and CERViDA-DOUNEDON.

Institutional Review Board Statement

The study was conducted in accordance with the Declaration of Helsinki and approved by the institutional review board of the University of Lomé through the Center for Regional Excellence on Sustainable Cities in Africa (No. 88/AT/D/CERViDA_UL/23), dated 12 September 2023.

Informed Consent Statement

Informed consent for participation was obtained from all subjects involved in the study.

Data Availability Statement

The original contributions presented in the study are included in the article; further inquiries can be directed to the corresponding author.

Acknowledgments

We would like to thank the administrative authorities and staff of the Kaya town hall for their support in organizing the data collection.

Conflicts of Interest

The authors declare no conflicts of interest. The funders had no role in the design of the study; in the collection, analyses, or interpretation of data; in the writing of the manuscript; or in the decision to publish the results.

Abbreviations

The following abbreviations are used in this manuscript:
IDPsInternally displaced people
GISGeographical Information System
POSPublic open space
SDGSustainable Development Goals

References

  1. Abel, A.; Hammond, D.; Hyslop, D.; Lahidji, R.; Mandrella, D. Le Cadre de l’OCDE sur la Fragilité. In Etats de Fragilité 2016. Comprendre la Violence; OCDE: Paris, France, 2017; pp. 77–94. [Google Scholar]
  2. Bryceson, D.F. Fragile Cities: Fundamentals of Urban Life in East and Southern Africa; Palgrave Macmillan: London, UK, 2005; ISBN 9780230523012. [Google Scholar]
  3. Hunter, M. Resilience, Fragility, and Robustness: Cities and COVID-19. Urban Gov. 2021, 1, 115–125. [Google Scholar] [CrossRef]
  4. De Boer, J.; Muggah, R.; Patel, R. Conceptualizing City Fragility and Resilience; United Nations University Centre for Policy Research: New York, NY, USA, 2016. [Google Scholar]
  5. Eskandari, N.; Habib, F. A Systematic Review of the Fragile City Concept. Int. J. Archit. Urban Dev. 2021, 11, 29–40. [Google Scholar]
  6. Selby, J.D.; Desouza, K.C. Fragile Cities in the Developed World: A Conceptual Framework. Cities 2019, 91, 180–192. [Google Scholar] [CrossRef]
  7. Aweh, M.A.; Atchrimi, T. Understanding Urban Fragility and Resilience in Kaya, Burkina Faso, Based on the Perceptions of Urban Actors. Int. J. Sustain. Dev. Plan. 2024, 19, 3759–3769. [Google Scholar] [CrossRef]
  8. Chenal, J. Modèles de Planification de L’espace Urbain. La Ville Ouest-Africaine; MétisPresses, Ed.; MétisPresses: Vérone, Italy, 2013. [Google Scholar]
  9. Lévy, J.; Lussault, M. Dictionnaire de la Géographie et de L’espace des Sociétés; Editions Belin: Saint-Just-La-Pendue, France, 2003. [Google Scholar]
  10. Panerai, P.; Depaulle, J.C.; Demorgeon, M. Analyse Urbaine; Parenthèses: Paris, France, 2018. [Google Scholar]
  11. ONU-HABITAT. Module 6: Accès Aux Espaces Publics Pour Tous; United Nations Human Settlements Programme: Nairobi, Kenya, 2018. [Google Scholar]
  12. Mensah, C.A.; Andres, L.; Perera, U.; Roji, A. Enhancing Quality of Life through the Lens of Green Spaces: A Systematic Review Approach. Int. J. Wellbeing 2016, 6, 142–163. [Google Scholar] [CrossRef]
  13. Trojanowska, M. The Evolving Theme of Health-Promoting Urban Form: Applying the Macrolot Concept for Easy Access to Open Public Green Spaces. Urban Sci. 2024, 8, 115. [Google Scholar] [CrossRef]
  14. Steck, J.-F. La Rue Africaine, Territoire de l’informel? Métropolis/Flux 2006, 66–67, 73–86. [Google Scholar] [CrossRef]
  15. UN-Habitat. World Cities Report 2020. The Value of Sustainable Urbanization; United Nations Human Settlements Programme: Nairobi, Kenya, 2020. [Google Scholar]
  16. Carlier, L. Experience of Urban Hospitality: An Ecological Approach to the Migrants’ World. Urban Plan 2020, 5, 241–251. [Google Scholar] [CrossRef]
  17. Jacobs, J. The Death and Life of Great American Cities; Vintage Book: NewYork, NY, USA, 1992. [Google Scholar]
  18. Liu, Z.; Tan, Y.; Chai, Y. Neighbourhood-Scale Public Spaces, Inter-Group Attitudes and Migrant Integration in Beijing, China. Urban Stud. 2020, 57, 2491–2509. [Google Scholar] [CrossRef]
  19. Enab, D.; Zawawi, Z.; Monna, S. Sustainable Urban Design Model for Residential Neighborhoods Utilizing Sustainability Assessment-Based Approach. Urban Sci. 2024, 8, 33. [Google Scholar] [CrossRef]
  20. Allarané, N.; Azagoun, V.V.A.; Atchadé, A.J.; Hetcheli, F.; Atela, J. Urban Vulnerability and Adaptation Strategies against Recurrent Climate Risks in Central Africa: Evidence from N’Djaména City (Chad). Urban Sci. 2023, 7, 97. [Google Scholar] [CrossRef]
  21. Okeke, F.O.; Eziyi, I.O.; Udeh, C.A.; Ezema, E.C. City as Habitat; Assembling the Fragile City. Civ. Eng. J. 2020, 6, 1143–1154. [Google Scholar] [CrossRef]
  22. OCDE. États de Fragilité 2020; OCDE: Paris, France, 2021. [Google Scholar]
  23. Beall, J.; Goodfellow, T.; Rodgers, D. Cities and Conflict in Fragile States in the Developing World. Urban Stud. 2013, 50, 3065–3083. [Google Scholar] [CrossRef]
  24. Amounou, R. Justice Spatiale et Accès à l’Electricité: Regard Croisé Entre Greater Accra et Grand Lomé. Ph.D. Thesis, University of Lome, Lome, Togo, 2021. [Google Scholar]
  25. Das, D.K.; Honiball, J.E. Appraisal of Public Park Accessibility in South African Cities. Proc. Inst. Civ. Eng. Munic. Eng. 2019, 172, 114–121. [Google Scholar] [CrossRef]
  26. Ubani, O.J.; Alabi, M.O.; Chiemelu, E.N.; Okosun, A.; Sam-Amobi, C. Influence of Spatial Accessibility and Environmental Quality on Youths’ Visit to Green Open Spaces (GOS) in Akure, Nigeria. Sustainability 2023, 15, 13223. [Google Scholar] [CrossRef]
  27. ONU-HABITAT. L’état Des Villes Africaines 2010. Gouvervance, Inégalités et Marchés Fonciers Urbains; United Nations Human Settlements Programme: Nairobi, Kenya, 2010. [Google Scholar]
  28. Odentaal, N.; Duminy, J.; Inkoom, D.K.B. The Developmentalist Origins and Evolution of Planning Education in Sub-Saharan Africa, c. 1940 to 2010. In Urban Planning in Sub-Saharan Africa; Routledge: London, UK, 2015; pp. 307–322. [Google Scholar]
  29. Njoh, A.J. French Colonial Urbanism in Africa. In Urban Planning in Sub-Saharan Africa: Colonial and Post-Colonial Planning Cultures; Routledge: New York, NY, USA, 2015; pp. 95–108. [Google Scholar]
  30. Silva, C.N. Urban Planning in Sub Saharan African. An Overview. In Urban Plannig in Sub-Saharan Africa. Colonial and Post-Colonial Planning Cultures; Routledge: New York, NY, USA, 2015; pp. 7–40. [Google Scholar]
  31. Kamana, A.A.; Radoine, H.; Nyasulu, C. Urban Challenges and Strategies in African Cities—A Systematic Literature Review. City Environ. Interact. 2024, 21, 100132. [Google Scholar] [CrossRef]
  32. The New Urban Agenda-Habitat III. Available online: https://habitat3.org/the-new-urban-agenda (accessed on 31 October 2024).
  33. Bret, B. Approches Théoriques: Introduction. In Justice et Injustices Spatiales; Bret, B., Gervais-Lambony, P., Hancock, C., Landy, F., Eds.; Presses Universitaires de Paris Nanterre: Paris, France, 2010; pp. 21–27. [Google Scholar]
  34. Gervais-Lambony, P.; Dufaux, F. Espace et Justice: Ouverture et Ouvertures. In Justice et Injustices Spatiales; Bret, B., Gervais-Lambony, P., Hancock, C., Landy, F., Eds.; Presses Universitaire de Paris Nanterre: Paris, France, 2010; pp. 9–17. [Google Scholar]
  35. Soja, W.E. The City and Spatial Justice. In Justice et Injustices Spatiales; Bret, B., Ed.; Presses Universitaires de Paris Nanterre: Paris, France, 2010; pp. 55–73. [Google Scholar]
  36. Nikšič, M.; Sezer, C. Public Space and Urban Justice. Built Environ. 2017, 43, 165–172. [Google Scholar] [CrossRef]
  37. Xu, N.; Wang, P. Evolutionary Characteristics of Urban Public Space Accessibility for Vulnerable Groups from a Perspective of Temporal–Spatial Change: Evidence from Nanjing Old City, China. Land 2024, 13, 998. [Google Scholar] [CrossRef]
  38. Chao, R.; Xue, D.; Wang, B. Evaluating Human Needs: A Study on the Spatial Justice of Medical Facility Services in Social Housing Communities in Guangzhou. Land 2024, 13, 1109. [Google Scholar] [CrossRef]
  39. Dong, J.; Wang, Y.; Yang, Y.; Luo, X.; Wang, L. A Multi-Level Framework for Assessing the Spatial Equity of Urban Public Space towards SDG 11.7.1—A Case Study in Beijing. Appl. Geogr. 2023, 161, 103142. [Google Scholar] [CrossRef]
  40. Ding, P.; Carstensen, T.A.; Jørgensen, G. Exploring the Inclusion of Children from a Spatial Perspective: An Analytical Framework of the Correlation between Physical Environment and Children’s Inclusion in Urban Public Spaces. Cities 2024, 153, 105293. [Google Scholar] [CrossRef]
  41. Chitrakar, R.M.; Baker, D.C.; Guaralda, M. How Accessible Are Neighbourhood Open Spaces? Control of Public Space and Its Management in Contemporary Cities. Cities 2022, 131, 103948. [Google Scholar] [CrossRef]
  42. Flick, U. An Introduction to Qualitative Research, 4th ed.; SAGE Publications: London, UK, 2009. [Google Scholar]
  43. De Sardan, J.P.O. La Rigueur du Qualitatif. Les Contraintes Empiriques de L’interprétation Socio-Anthropologique; Academia Bruylant: Louvain-La-Neuve, Belgium, 2008. [Google Scholar]
  44. Di Meo, G.; Buleon, P. L’espace Social, Une Lecture Géographique des Sociétés; Armand Colin, Ed.; Armand Colin: Paris, France, 2007. [Google Scholar]
  45. Paillé, P.; Muchielli, A. L’analyse Qualitative en Sciences Humaines et Sociales, 4th ed.; Armand Colin: Malakoff, France, 2016. [Google Scholar]
  46. INSD. 5è Recensement Général de la Population et de la Démographie; INSD: Ouagadougou, Burkina Faso, 2022. [Google Scholar]
  47. SP/CONASUR. Situation des PDI au Burkina Faso à la Date Du 31 Décembre 2022 SP/CONASUR: Ouagadougou, Burkina Faso. 2022. Available online: https://data.humdata.org/dataset/situation-des-personnes-deplacees-internes (accessed on 12 March 2025).
  48. Ahmed, S.K. How to Choose a Sampling Technique and Determine Sample Size for Research: A Simplified Guide for Researchers. Oral Oncol. Rep. 2024, 12, 100662. [Google Scholar] [CrossRef]
  49. Open Spaces and Green Areas|Urban Indicators Database. Available online: https://data.unhabitat.org/pages/open-spaces-and-green-areas (accessed on 21 February 2025).
  50. Banque Mondiale. Inclusion Matters: The Foundation for Shared Prosperity-Overview; World Bank: Washington, DC, USA, 2013. [Google Scholar]
  51. Atchrimi, T. Community Development and Participation in Togo: The Case of AGAIB Plateaux. Field Actions Sci. Rep. Spec. Issue 2014, 1–6. [Google Scholar]
  52. Angel, S.; Parent, J.; Civco, D.; Blei, A. Making Room for a Planet of Cities; Lincoln Institute of Land Policy: Cambridge, MA, USA, 2011. [Google Scholar]
  53. Zobec, M.; Betz, O.; Unterweger, P.A. Perception of Urban Green Areas Associated with Sociodemographic Affiliation, Structural Elements, and Acceptance Stripes. Urban Sci. 2020, 4, 9. [Google Scholar] [CrossRef]
Figure 1. Study conceptual framework.
Sustainability 17 03115 g001
Figure 2. Study methodology. Note: the focus groups and the questionnaire survey were conducted concurrently without seeking to target the same participants.
Sustainability 17 03115 g002
Figure 3. Public open spaces in Kaya. Note: the map provides an overview of the official city perimeter of Kaya, highlighting the distribution of streets, sector boundaries, and public open spaces.
Sustainability 17 03115 g003
Figure 4. Respondents’ perceptions of distributive justice related to POSs. Note: (a) shows the frequency distribution of respondents’ answers on the distance between their residence and POSs. The highest frequency is observed among respondents who perceived POSs to be close or very close to their place of residence (38.6%). However, a significant proportion of respondents (almost 30%) found POSs far or very far from their residence. (b) shows respondents’ perceptions of safety in POSs. Most respondents (nearly 55%) considered POSs to be safe. However, a significant proportion of respondents (21.9%) said they had no knowledge on the subject. Those who perceived POSs as unsafe represent 10.6% of respondents.
Sustainability 17 03115 g004
Figure 5. Respondents’ perceptions of procedural justice in POSs. Note: This presents perceptions on the theme of participation in decisions on the development of public spaces. Respondents with no knowledge of participation top the list with 33.6%, followed by satisfied and very satisfied respondents (27.2%) and undecided respondents (22.3%). Dissatisfied respondents represent almost 17% of all respondents.
Sustainability 17 03115 g005
Figure 6. Key factors influencing distance perception to be very far. Note: The left panel shows which factors increase the likelihood of distance perception being very far. The key influencers are represented by colored circles with numerical values. These values indicate how much each factor increases the chance of distance perception being very far. The green circle shows the highest factor, and the orange circle indicates the other factors. Information in the left panel shows: When the answer to the question “Is residence in formal area?” is “Yes”, the likelihood of Distance perception being Very far is increased by 1.76 times. When the “sex of the respondent” is “male”, the likelihood of Distance perception being Very far is increased by 1.64 times. When “the age of respondent” is “under 19 years old,” the likelihood of distance perception being very far increases by 1.62 times. The right panel shows a bar chart representing the highest key factor. The dotted line represents the overall average distance perception level. The share of residents in formal areas perceiving distance as very far is higher than the one of residents in informal areas.
Sustainability 17 03115 g006
Figure 7. Key factors influencing security perception to be at a high level of security. Note: Information in the left panel shows when “Age of respondent” is “From 18 years to 24 years old”, the likelihood of Security perception being “High level of insecurity “is increased by 2.21 times. The bar chart on the right shows the proportion of respondents in each age category who report feeling a high level of insecurity. The green bar represents the 18-24 age group, showing the highest insecurity perception, well above the average insecurity perception of 7.60%. Other age groups, represented in blue bars, have lower levels of insecurity perception.
Sustainability 17 03115 g007
Figure 8. Key factors influencing ignorance in participation in POS processes. Note. Figure shows. When sector of residence of respondent is “Secteur 2” the likelihood of participation perception being “Don’t know” is increased by 2.59 times. When the answer to the question “Is residence in formal area?” is “No”, the likelihood of participation perception being “Don’t know” is increased by 1.61 times. When the age of respondent is “Under 18 years old”, the likelihood of participation perception being “Don’t know” is increased by 1.58 times. When respondent status is “IDP”, the likelihood of participation perception being “Don’t know” is increased by 1.36 times. When sex of respondent is “female”, the likelihood of participation perception being “Don’t know” is increased by 1.29 times. The bar chart on the right compares the percentage of “Don’t know” responses across different sectors of residence. The green bar represents Sector 2, where uncertainty is significantly higher than in all other areas, far exceeding the average (29.18%).
Sustainability 17 03115 g008
Figure 9. Key factors influencing dissatisfaction in participation in POS processes. Note. Figure shows: When respondent status is “Host” the likelihood of participation perception being “Unsatisfied” is increased by 3.33 times. When the answer to the question “Is residential in formal area?” is “Yes”, the likelihood of participation perception being “Unsatisfied” is increased by 3.01 times. The bar chart on the right shows that dissatisfaction among Hosts (green bar) is significantly higher than the average dissatisfaction rate (3.52%).
Sustainability 17 03115 g009
Figure 10. Measures to improve resilience and improve public spaces.
Sustainability 17 03115 g010
Table 1. Composition and size of focus group participants.
GroupMenWomenTotal Workforce
Seniors and people living with disabilities6511
Authorities and public officials11213
Residents of informal areas10515
Residents of formal areas8715
Internally displaced people5510
Women’s organizations099
Total403373
Source: the authors.
Table 2. Participant profiles.
Categories65 and OverFrom Age 25 to 64From 18 to 24Under 18 sGrand Total
Woman131335549250
Informal housing438191576
Formal housing9953634174
Men241425247265
Informal housing442101874
Formal housing201004229191
Grand Total3727510796515
Note: IDP: internally displaced person.
Table 3. Dimensions and variables of accessibility and inclusiveness of public open spaces (POSs) selected in the questionnaire.
The Dimension of Spatial JusticeVariable Response Categories
Distributive justice (accessibility)
  • Level of satisfaction with proximity to POSs
1—Very Far; 2—Far; 3—Neither; 4—Close; 5—Very close; 6—Don’t know
  • Perception of safety in POSs
1—Very high insecurity; 2—High insecurity; 3—Neither; 4—High insecurity; 5—Very high insecurity; 6—Don’t know
Procedural justice (inclusiveness)
  • Level of satisfaction with participation in decisions concerning POS design
1—Totally unsatisfied; 2—Unsatisfied; 3—Neither; 4—Satisfied; 5—Totally satisfied; 6—Don’t know
Note: POS means public open space.
Table 4. Urban land allocated to public spaces.
IndicatorValue %
Share of urban land allocated to streets11.19%
Share of urban land allocated to public open spaces12.52%
Share of land allocated to public spaces (streets + public open spaces)23.71%
Source: the authors.
Table 5. Perceptions on justice in access to public spaces, according to focus group participants.
PerceptionsStakeholder Groups
Detour of green spaces to other usesAuthorities and officials
Women’s associations
Public spaces (markets, green spaces) provided in urban design plans are not developedState and local authorities
Changing the use of public spaces without prior consultation with residentsSeniors and people living with disabilities
Low provision (underestimation) for places of worship in urban design plansState and local authorities
Little provision for green spaces in housing estatesWomen’s associations
Public authorities have little control over urban land, particularly in informal settlementsState and local authorities
Cumbersome administrative procedures for using public spacesCommunities living in informal settlements
Women’s associations
Political control of public spacesCommunities living in formal housing zones
Social and ethnic marginalization in access to public spacesCommunities living in formal housing zones
Monopolization of green spaces by one or a few individualsCommunities living in formal housing zones
Seniors and people living with disabilities
Obstruction of public spaces by anarchic occupationSeniors and people living with disabilities
The elderly and people living with disabilities are not considered in the design of public buildings.Seniors and people living with disabilities
Cost of renting public spaces out of reachWomen’s associations
High taxes on public spacesWomen’s associations
Lack of transparency and corruption in procedures for obtaining permits to use public spacesWomen’s associations
Feeling like unwanted occupants of public spacesInternally displaced persons
Lack of information on public spacesInternally displaced persons
Difficult access to certain public spaces with no amenitiesSeniors and people living with disabilities
Lack of playgrounds and sports facilities for children and young peopleCommunities living in informal settlements
Street deficiencies Communities living in formal housing zones
Source: the authors, based on the results of focus groups conducted in September 2023. Note: Understanding the participants’ perceptions requires considering the context of the city of Kaya and the practices of its inhabitants. In practice, citizens can occupy the public open space along the streets and the areas around leisure facilities and green spaces with the authorization of the municipal administration and by paying a tax for this purpose. This tax is the public domain occupancy tax and is paid proportionately to the surface area occupied. Participants point out that public spaces are insufficient, especially green spaces, playgrounds, and sports facilities. Some participants point out that the procedure for the use of public spaces is often hijacked by the local political elites who influence the decisions of the municipal administration. Renting public spaces occurs between a citizen officially holding a permit to occupy a public space and another citizen. The lack of information mentioned by participants means they are unaware of available public open spaces and the procedures a citizen must follow to obtain authorization to use them. People living in formal areas perceived streets as deficient, meaning streets in their neighborhoods were not laid out and lacked water drainage and lighting networks.
Table 6. Urban land share for public spaces compared to SDG standards.
IndicatorValue in %SDG Standards in %
Share of urban land allocated to streets11.1930–35
Share of urban land allocated to public open spaces12.5215–20
Share of land allocated to public spaces (streets + public open spaces)23.7145–50
Note. SDG standards are available in UN-Habitat’s guide [11].
Disclaimer/Publisher’s Note: The statements, opinions and data contained in all publications are solely those of the individual author(s) and contributor(s) and not of MDPI and/or the editor(s). MDPI and/or the editor(s) disclaim responsibility for any injury to people or property resulting from any ideas, methods, instructions or products referred to in the content.

