Article

Strategies for Enhancing the Thermal Environment of Street Spaces in Ancient Canal Towns Based on the Design of Water-Friendly Spatial Diversity

1
Faculty of Environmental and Engineering, The University of Kitakyushu, Kitakyushu 802-8577, Japan
2
Dongfang College, Zhejiang University of Finance & Economics, Haining 314408, China
*
Author to whom correspondence should be addressed.
Sustainability 2025, 17(7), 3112; https://doi.org/10.3390/su17073112
Submission received: 24 February 2025 / Revised: 24 March 2025 / Accepted: 28 March 2025 / Published: 1 April 2025

Abstract

:
Many ancient canal towns are distributed in southern China, serving as popular tourist destinations. However, these towns experience intense summer heat, with poor thermal comfort in their street spaces. Studying the thermal comfort of historical districts is therefore crucial for promoting tourism development. This research focuses on the Xiaohe Street Historical District, employing ENVI-met software v5.7 for the simulation analysis. Targeting waterfront spaces in ancient town historical districts, nine simulation scenarios were established to systematically compare the thermal environmental impacts of different widths, locations, and configurations of waterfront spaces. The key findings include the following. The waterfront space width shows a positive correlation with thermal environment improvement—wider spaces yield a more significant enhancement. However, when the width exceeds 5 m, a further expansion to 7 m shows a limited impact on the temperature, humidity, and wind speed, with diminishing returns. Distributed versus concentrated layouts of waterfront spaces show negligible differences in temperature and humidity regulation, but concentrated arrangements significantly enhance the street-level wind speed. Thus, under equivalent total width conditions, concentrated large-scale waterfront spaces are recommended. Installing shading facilities in waterfront spaces can effectively reduce the site temperature by over 2 °C. Aligning waterfront spaces with ventilation corridors substantially improves the wind speed, thereby enhancing thermal comfort. Through quantitative analysis, this study provides a scientific basis for optimizing thermal environmental design in canal-side historical districts. The findings offer practical guidance for similar renovation projects in canal historical districts.

1. Introduction

With the development of the economy, cultural tourism has become a significant consumer expenditure for the public. The tourism industry has become a major source of fiscal revenue for many countries and regions. In 2023, the number of domestic tourists in China reached approximately 4.55 billion [1]. China’s long history has preserved numerous traditional villages and towns. The historical districts of ancient towns are not only important carriers of historical culture but also living spaces for a large population, as well as popular tourist destinations. In particular, the historical districts of water towns in Jiangnan (south of the Yangtze River) have attracted a large number of tourists [2]. Wuzhen, Xitang, and Nanxun are typical examples [3], garnering widespread attention in the tourism market [4].
Due to the greenhouse effect and urban heat island effect, urban spaces have become increasingly hotter during the summer, significantly impacting people’s travel experiences. Research has found a noticeably increasing trend in both indoor and outdoor overheating durations in cities [5]. Research indicates that extreme weather conditions in summer and winter can adversely affect human health [6]. Studies on thermal environments have primarily focused on public spaces, such as urban parks, [7,8] as well as the analyses of rural thermal environments [9]. Micro-scale outdoor thermal environment research has mainly concentrated on people’s perceptions of thermal comfort in courtyards [10,11]. Lin investigated the thermal comfort of a lake in Taiwan [12]. Wang et al. studied high-altitude glacier tourism in southwestern China [13]. Hamilton and Tol assessed thermal comfort in Germany, England, and Ireland [14]. Scott et al. examined the Canadian Rocky Mountains [15]. Previous thermal comfort studies have predominantly focused on natural landscape scenic areas, with limited research on improving thermal comfort in human-made architectural scenic areas dominated by buildings and hardscapes [16]. There is also a lack of research on the thermal environment of Jiangnan water towns, and the mechanisms of thermal environments and heat island effects in urban cultural scenic areas require further attention [17].
Research has found that climatic conditions are a major factor influencing tourist flow [18,19], with tourists being more sensitive to climate than locals [20], as the climate directly affects their travel arrangements. Consequently, the thermal comfort of tourist attractions has become a key focus for researchers. Nazanin Nasrollahi et al. developed a model for the outdoor thermal comfort of tourists in historical areas [16]. Similar studies have revealed that the thermal environment is influenced by [21] urban underlying surface characteristics [22], urban geometry [23], and vegetation distribution [24], all of which affect thermal comfort [25]. Early scholars primarily relied on field measurements of parameters such as temperature and humidity to analyze the thermal environment of spaces [26]. With the advancement of computer simulation technology, researchers began to combine computer simulations with field measurements [27], with ENVI-met being one of the most widely used urban microclimate simulation software programs [28]. ENVI-met was developed by Bruse et al. [29] from the Institute of Geography through the study of thermal stress relationships between building exteriors, vegetation, and air. It is software designed for urban microclimate simulations. Due to its ability to effectively simulate the relationships between landscape greening, outdoor thermal environments, and buildings, ENVI-met has been widely adopted by various institutions and individuals in recent years to study the characteristics of urban microclimates [30]. Numerous scholars have used ENVI-met to conduct microclimate research, including studies on the relationships between microclimates and regional spatial forms [31], green space layouts [32], landscape elements, building layouts [33], plant species [34], and human comfort (Table 1).
Historical districts in ancient towns are often located in the core areas of cities, where space is crowded and environmental conditions are poor. These districts contain many valuable ancient buildings, making it difficult to alter the overall layout of the area. The challenge of this study lies in proposing effective design strategies to improve the living environment under various constraints. This is particularly relevant for ancient towns in regions with hot summers and cold winters, where summer thermal comfort is often poor. However, summer is also the peak tourist season, and tourists’ perception of thermal comfort directly impacts their travel experience [35], thereby influencing their willingness to visit. The relationship between the unique street layout of ancient towns and their thermal environment needs to be explored. This study employs both field measurements and simulations to investigate the waterside spaces in the historical districts of ancient towns. By simulating the thermal environment under different scenarios based on scale changes in public spaces where people gather, this study aims to explain the thermal comfort of ancient town street spaces under various design strategies. The findings provide a design basis for the renovation of historical districts in ancient towns.

2. Research Methodology

This paper focuses on Xiaohe Street, a typical historical district in an ancient town, as the research object. The study began with on-site microclimate measurements to explore the basic microclimate characteristics and the patterns of thermal environmental parameters during the summer (July). These measurements provided foundational data for the calibration and quantitative simulation of the microclimate simulation software. Next, the selection and validation of the microclimate simulation software were conducted to verify the reliability and sensitivity of the numerical simulation software and simulation settings used in this study. Subsequently, based on this validated model, various forms of street space designs commonly found in historical districts of ancient towns were simulated. Different scenarios were created based on varying scales and types of waterside space designs to simulate the thermal environment of the district under different conditions. Finally, based on the simulation results, effective design strategies were proposed to improve the thermal comfort of historical districts in ancient towns (see Figure 1 for details).

2.1. Data Collection

Xiaohe Street Historical District is located along the Beijing-Hangzhou Grand Canal in Hangzhou, Zhejiang Province, and serves as one of the significant cultural nodes along the canal. As a typical representation of canal culture, Xiaohe Street not only carries profound historical significance but also embodies unique urban memories. The district is home to a large number of well-preserved traditional residential buildings from the Ming and Qing dynasties, which not only retain the authenticity of their historical appearance but also form a rich and diverse street space layout. Due to the district’s diverse commercial activities, it attracts a large number of local residents and tourists year-round, often resulting in crowded street spaces. Therefore, an in-depth study of the thermal environmental characteristics and comfort of these street spaces holds significant theoretical and practical value for enhancing the spatial quality of historical districts and improving the experience of visitors.
The street space on both sides of Xiaohe Historic District is orderly and convenient for testing and simulation. Therefore, this paper takes Xiaohe Street, a typical ancient town historic district, as the research object. This experiment was conducted on 2 July 2024, at the site of Xiaohe Street for field testing, and the instrument parameters are shown in Table 2. The experimental test time was 9:00~20:00, and the data were recorded once per hour. The measured points are located at points A and B (see Figure 2 for details), with a height of 1.5 m above the ground, no shading within 3 m of the perimeter, and the ground is paved with granite strips. Point A is a small square node, and point B is located in a pavilion, with roof shading on the upper part, so the temperature is lower.

2.2. Simulation Software Selection
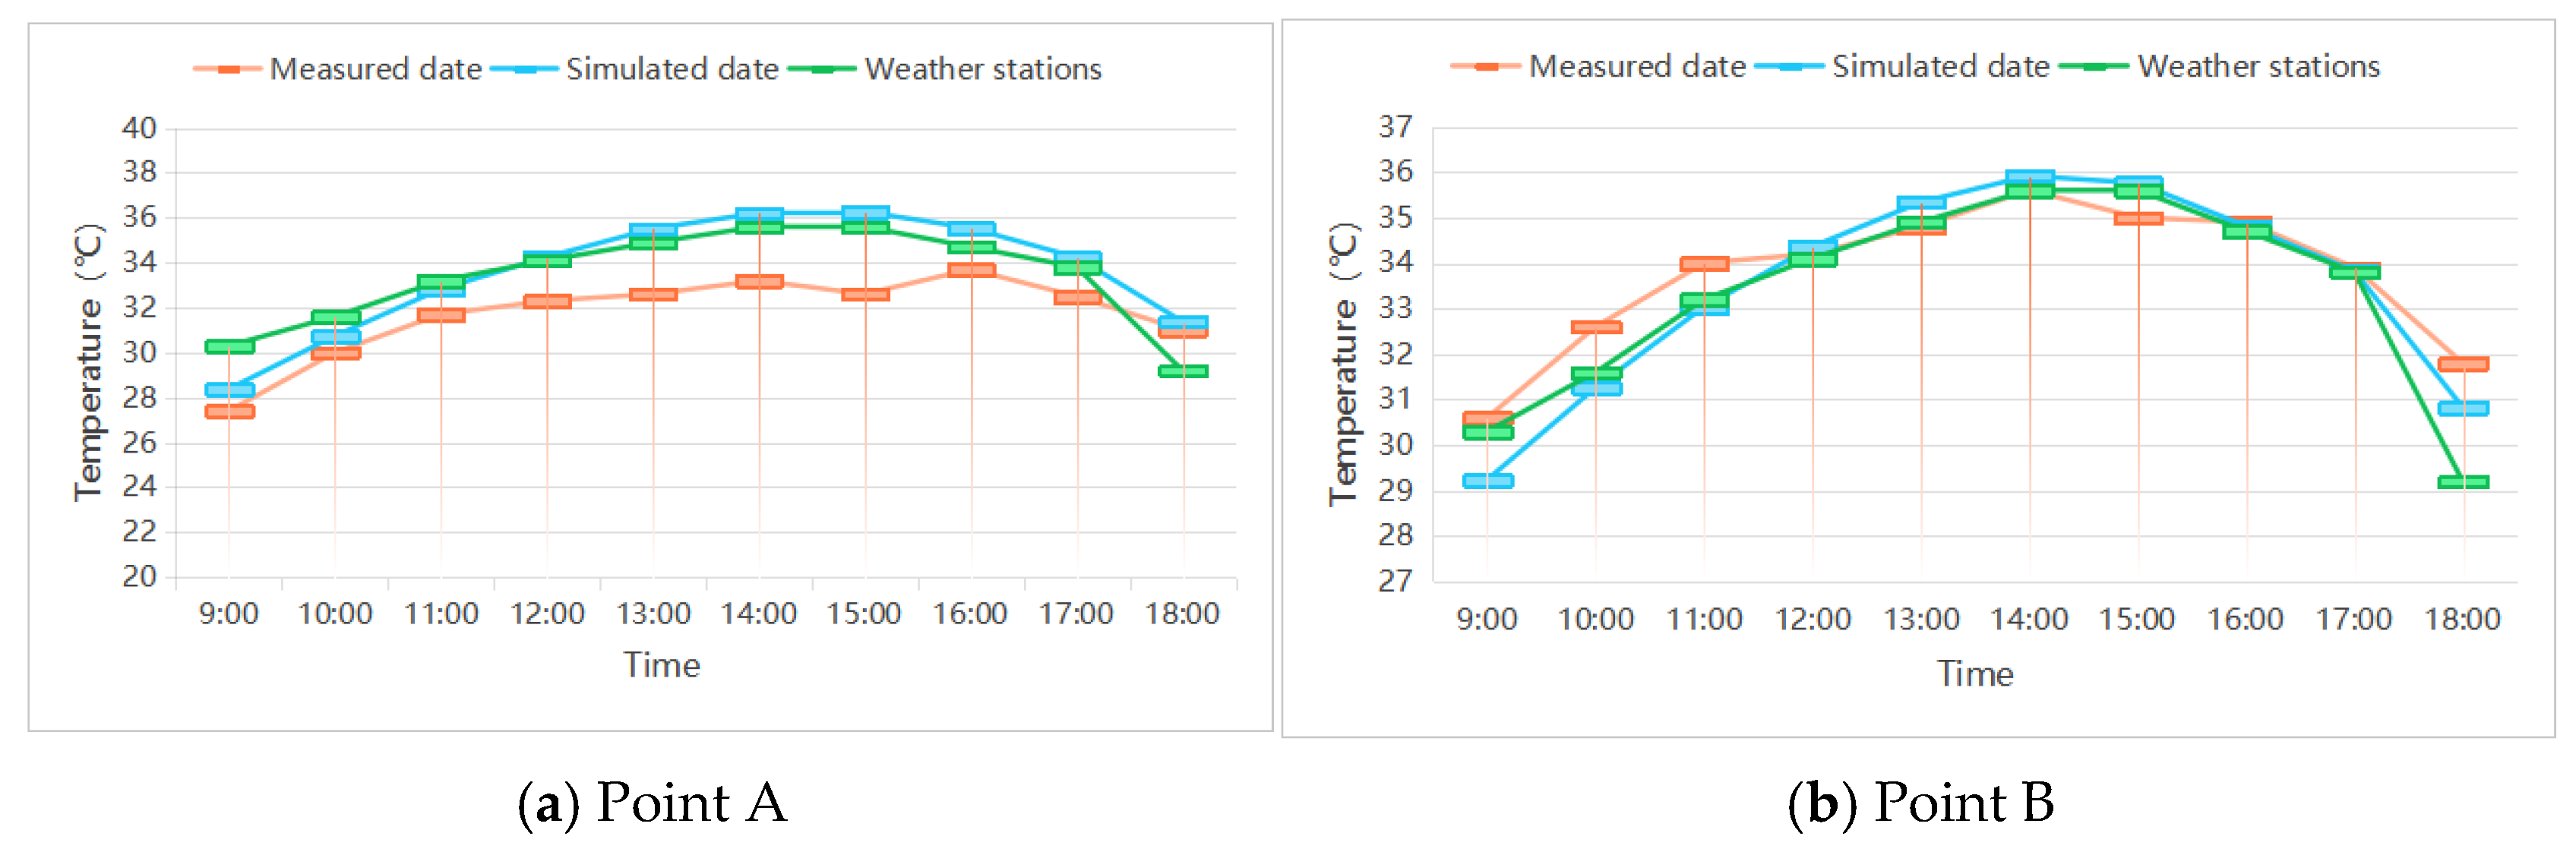
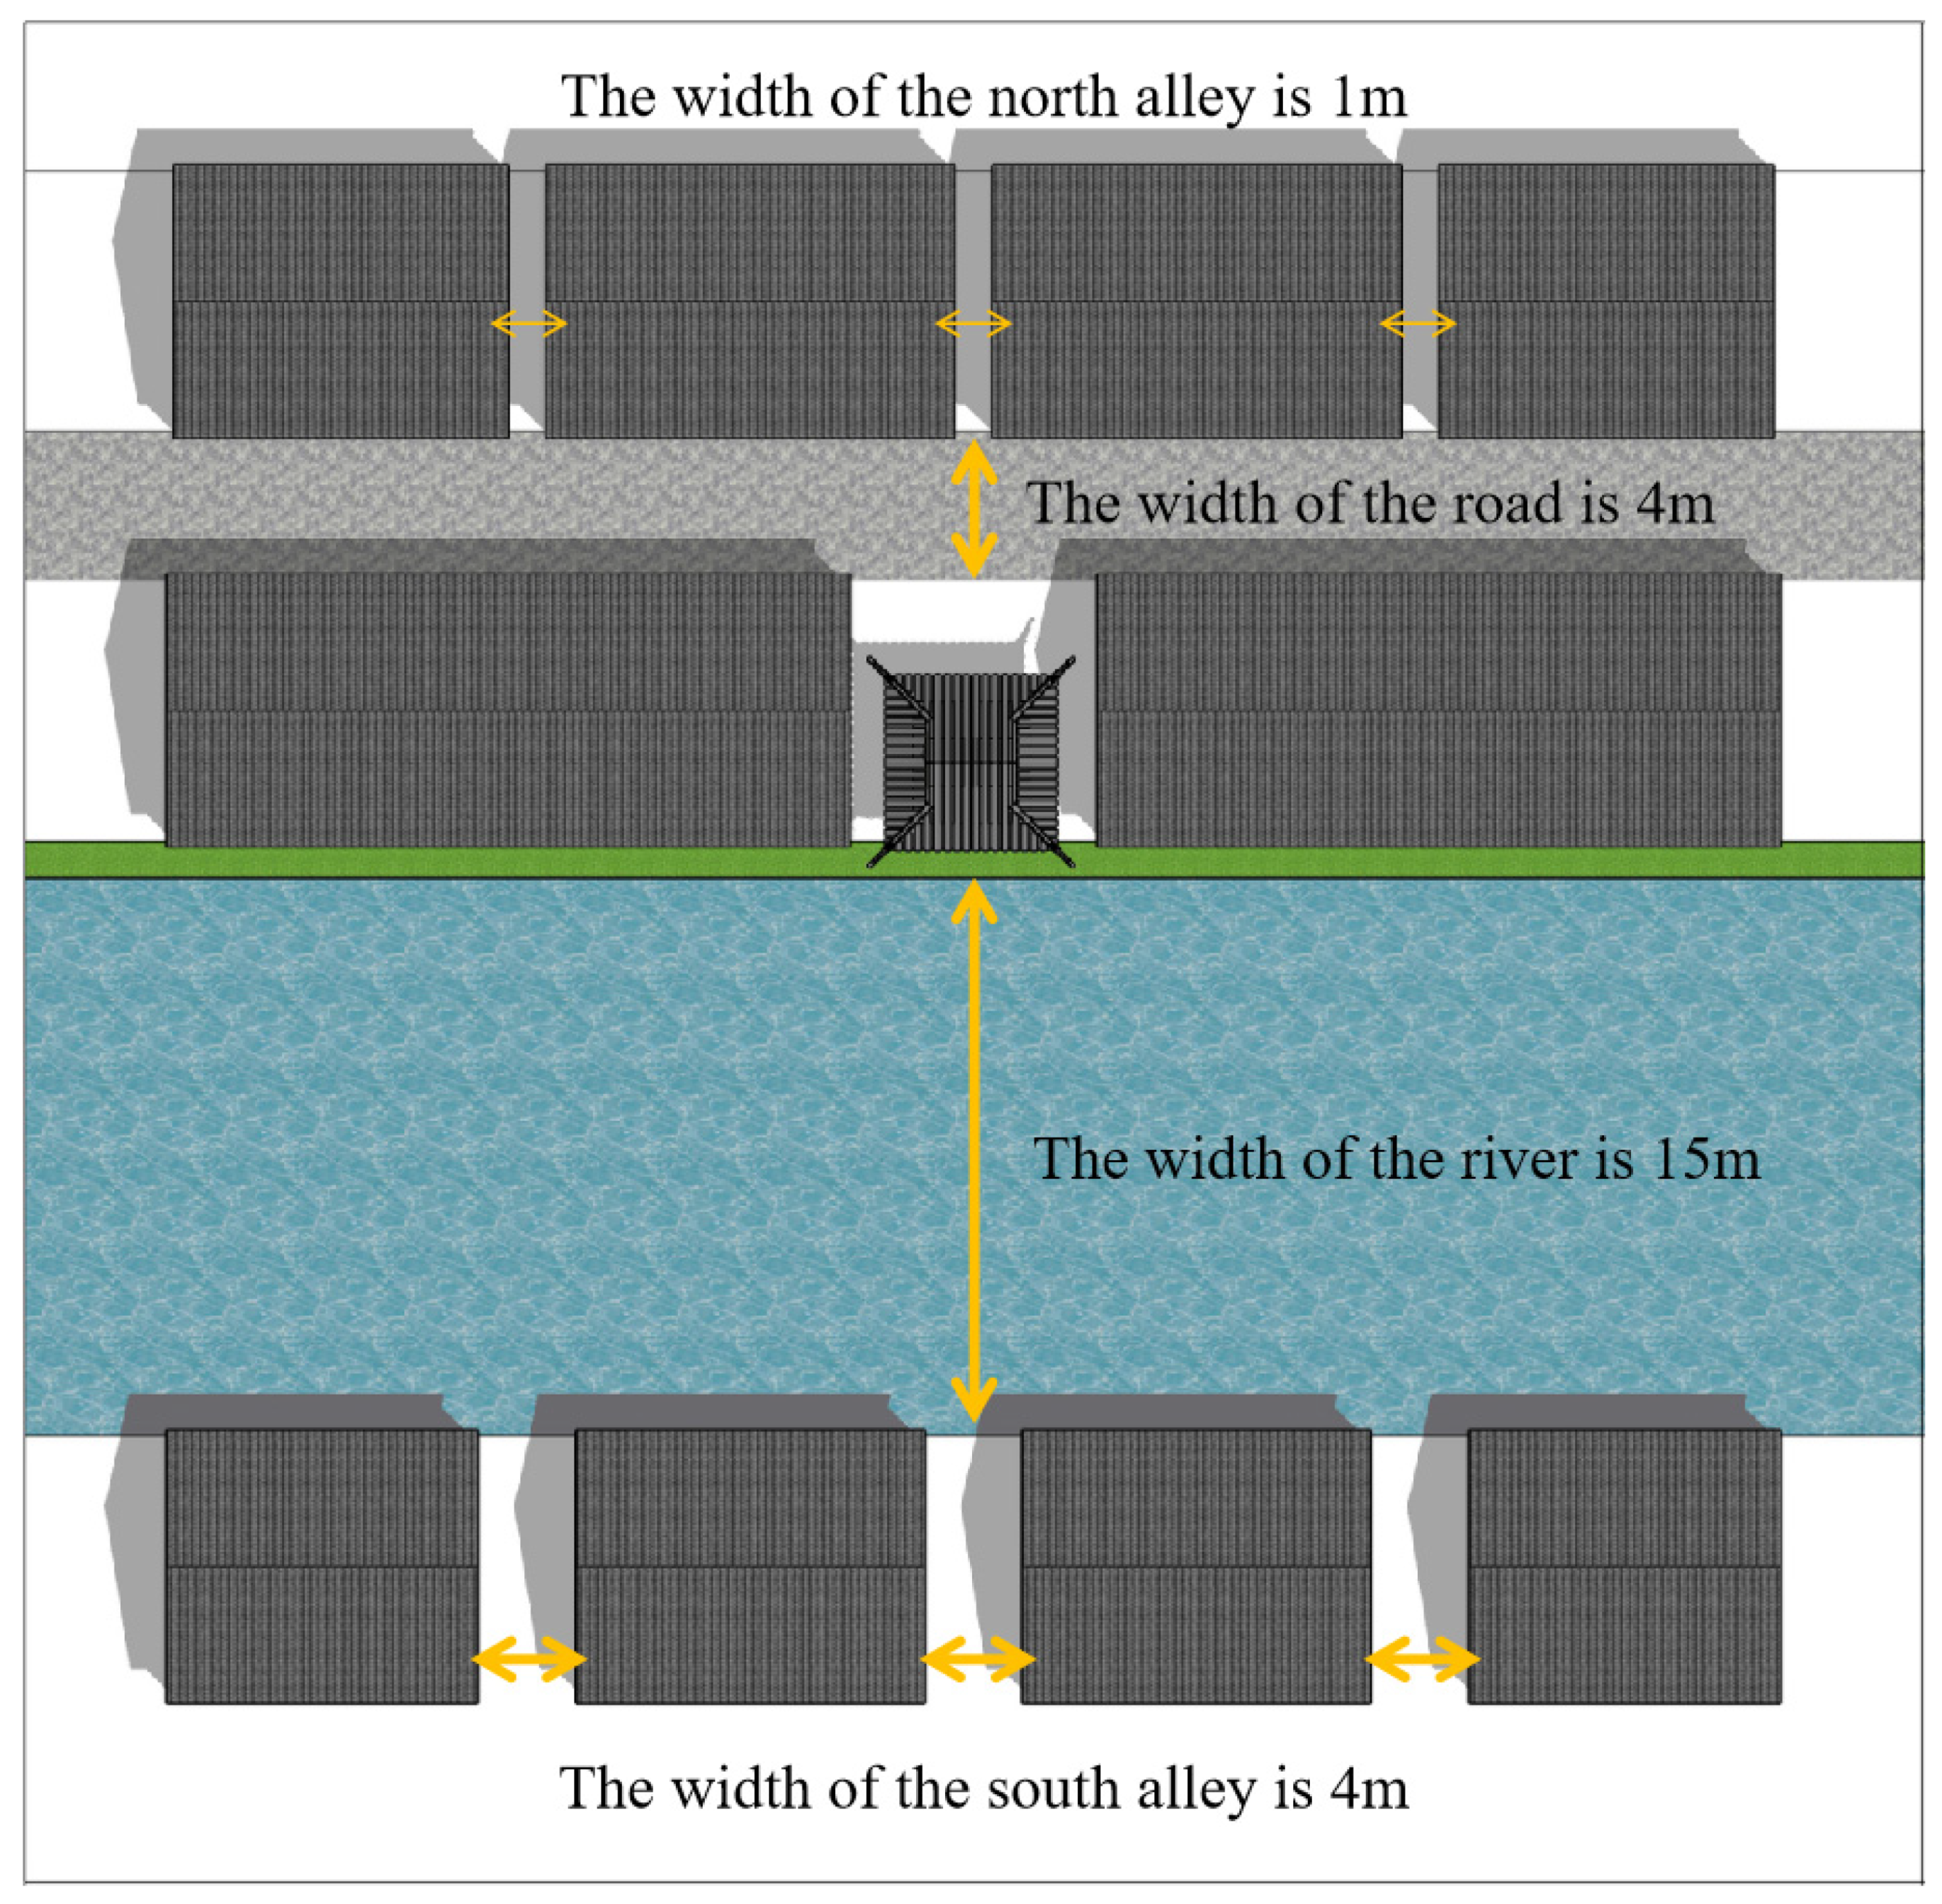
In this study, ENVI-met Launcher 5.7.1 was used as a research tool, which was developed by Bruse et al. from the Institute of Geography, University of Bochum, Germany [36], developed by studying the thermal stress relationship between the exterior surfaces of buildings, vegetation, and air for the purpose of creating urban microclimate simulation software. In the horizontal direction, ENVI-met added Nesting Grids (Nesting Grids) around the simulation area as a buffer zone, which was used to reduce the influence of side boundary effects on the simulation results. In the vertical direction, ENVI-met requires the vertical height of the 3D model to be more than twice the height of the highest building in the region, i.e., Z ≥ 2Hmax, in order to eliminate the influence of the top boundary effect on the simulation results [37,38].

2.3. Field Test

Subsequently, the simulation parameters, which are shown in Table 3, and the meteorological data were obtained from meteorological stations near Hangzhou. A comparison of weather station data, test data, and simulation data results are shown in Figure 3 and Figure 4.
In this simulation, temperature and humidity were used for the validation calculations, and the data are detailed in Figure 3 and Figure 4. The root mean square error (RMSE) and mean absolute percentage error (MAPE) were used as the evaluation criteria for the accuracy verification.
The RMSE can be used to measure the error between the simulated and measured values, and, according to scholars’ research on the accuracy of the Envir simulation in recent years, it is considered that the RMSE of the measured and simulated Ta is not greater than 1.31 and the MAPE is not greater than 5.00 [39]. After the calculation, the RMSE value was 0.81 °C and the MAPE value was 2.0% in this model. Also, the applicability and accuracy of the ENVI-met model was tested using linear regression between the measured and simulated data, and the linear regression results showed a strong correlation (R2 > 0.8) (Figure 5) [40].
R M S E = 1 r i = 1 r y i y i 2
M A P E = 1 r i = 1 r y i y i y i × 100 %

3. Result

Currently, there are more studies on the thermal environmental texture of hydrophilic spaces but there are fewer studies on the hydrophilic spaces of ancient towns and historic districts. Jiangnan water towns have a unique subsurface, and the study of their thermal environment is of great significance. This study simulates the thermal environments of nine distinct street space types under identical climatic parameters. First, the impacts of varying widths of spatial corridors on the street air temperature, humidity, and wind speed were compared. Second, the effects of different numbers of spatial corridors on these parameters (temperature, humidity, and wind speed) were analyzed. Finally, variations in the temperature, humidity, and wind speed between two monitoring points on the street were examined under different ventilation configurations.

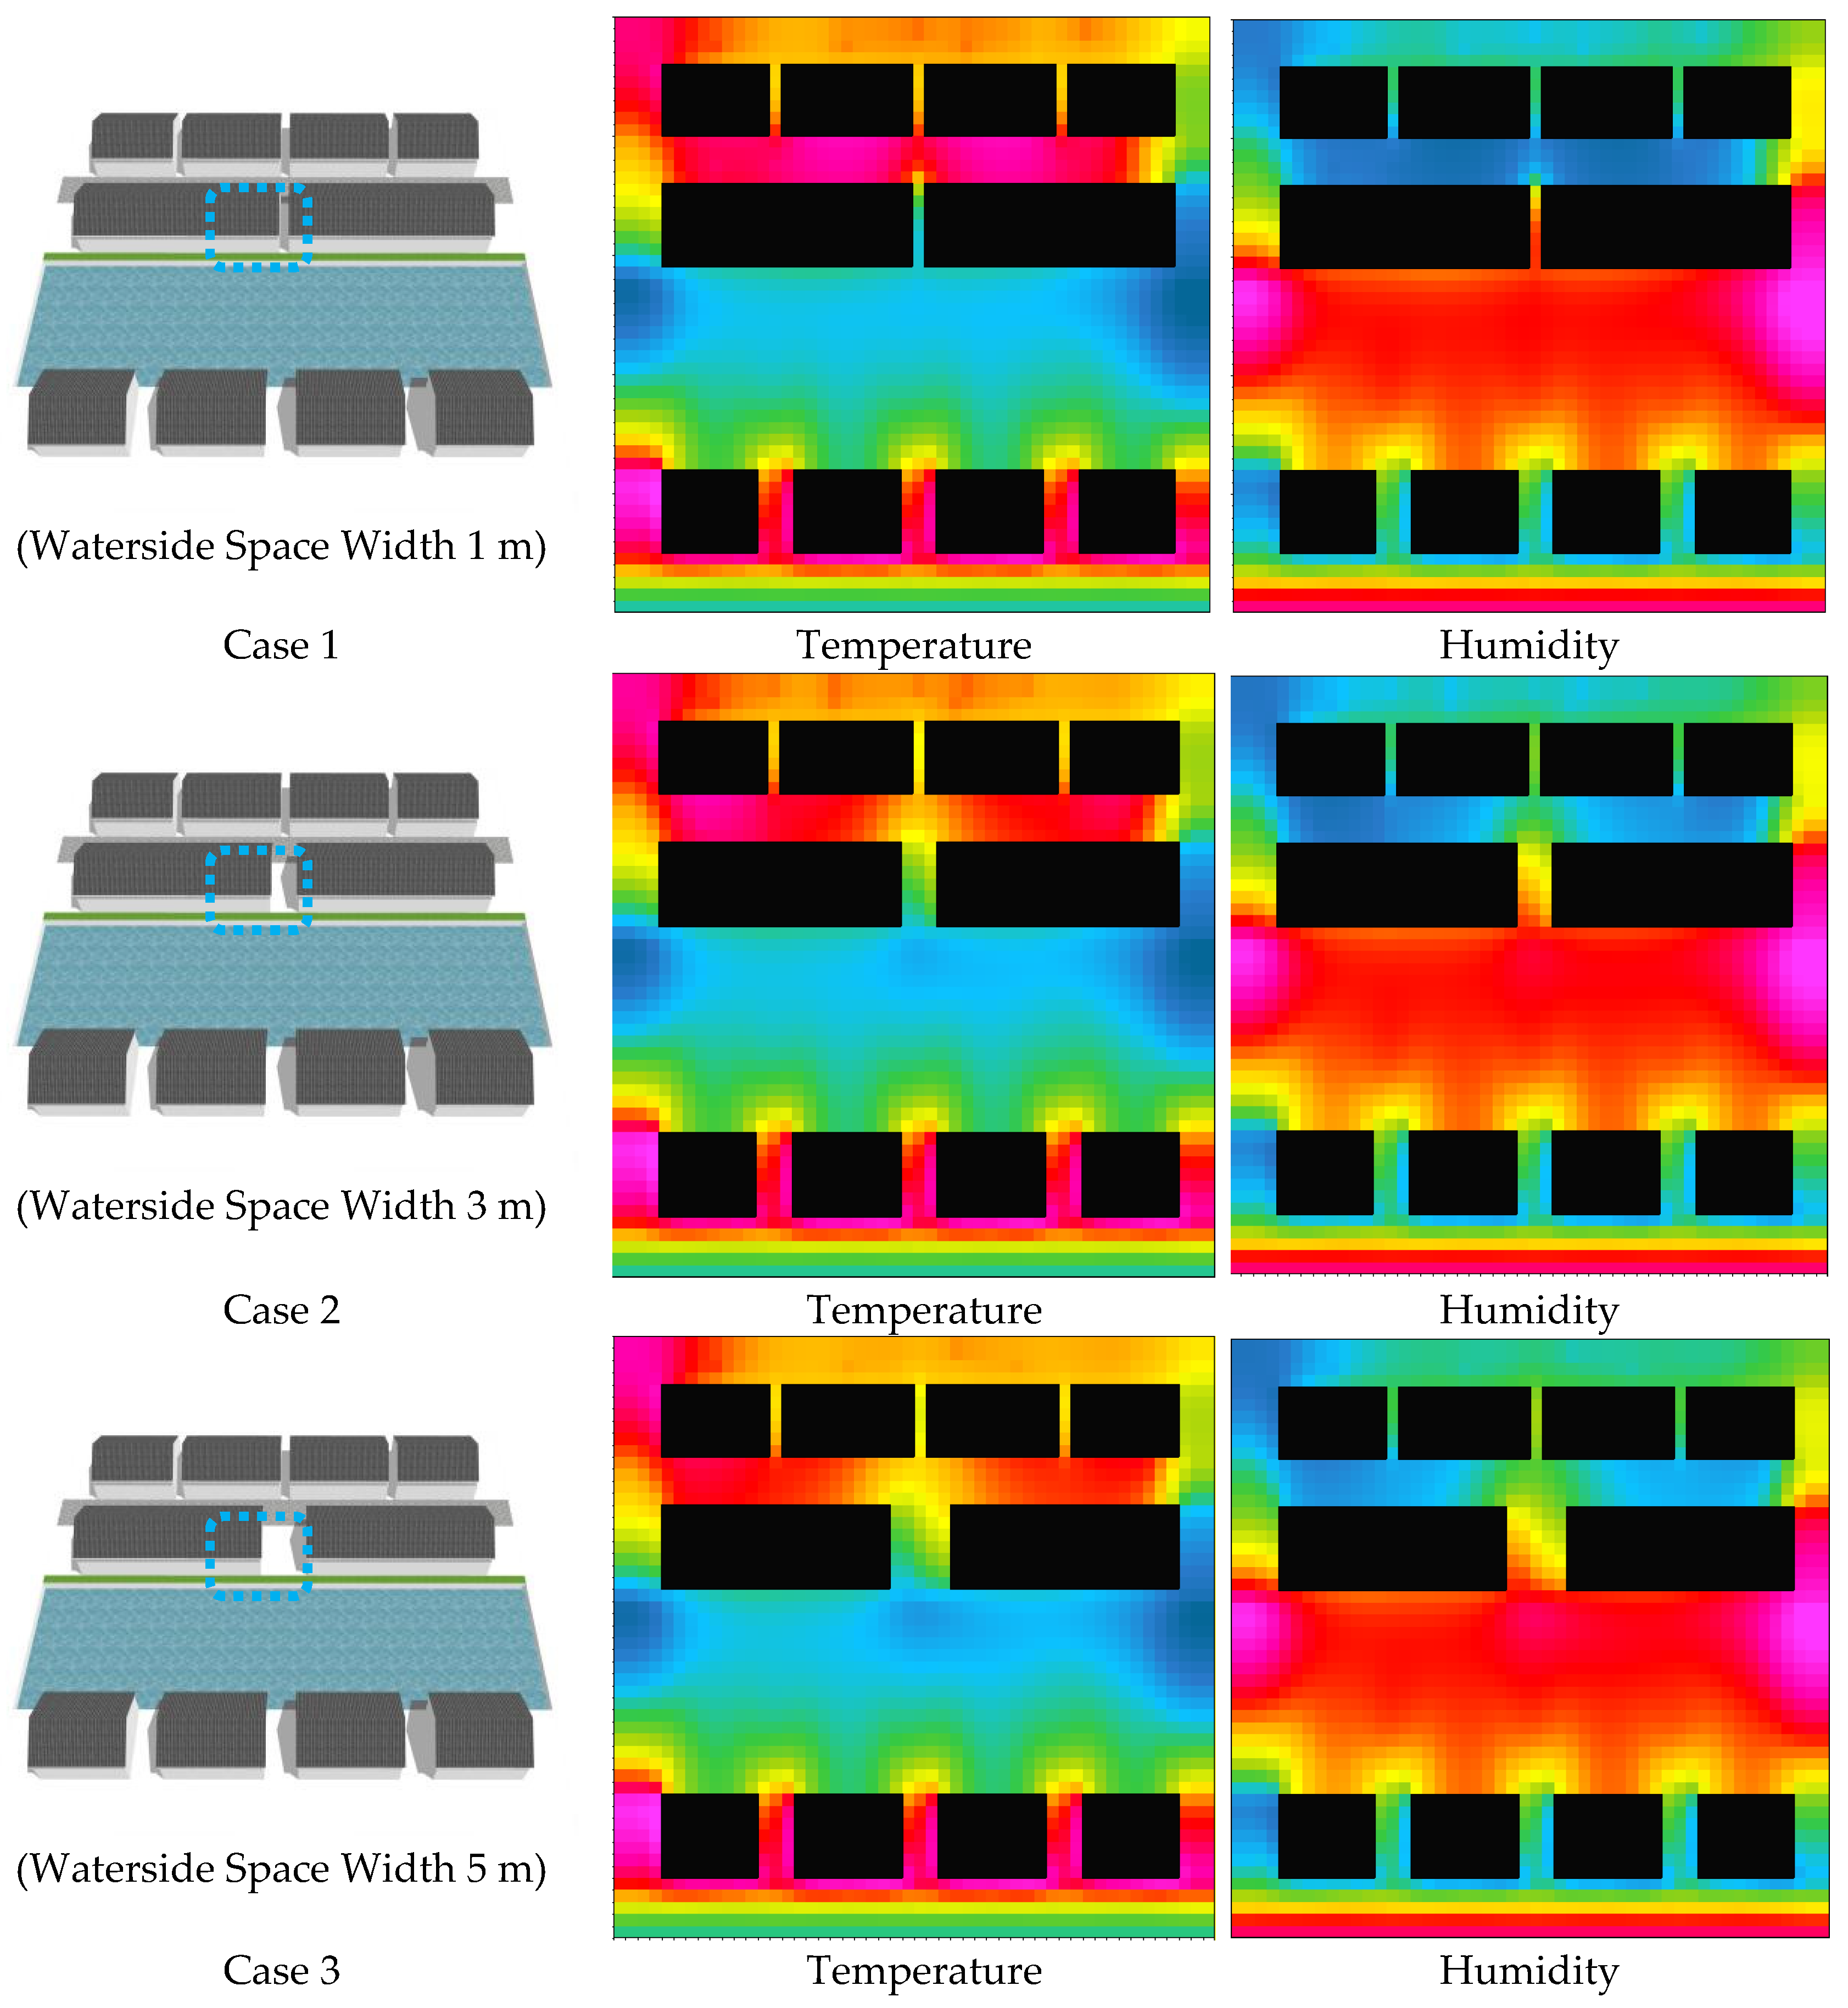
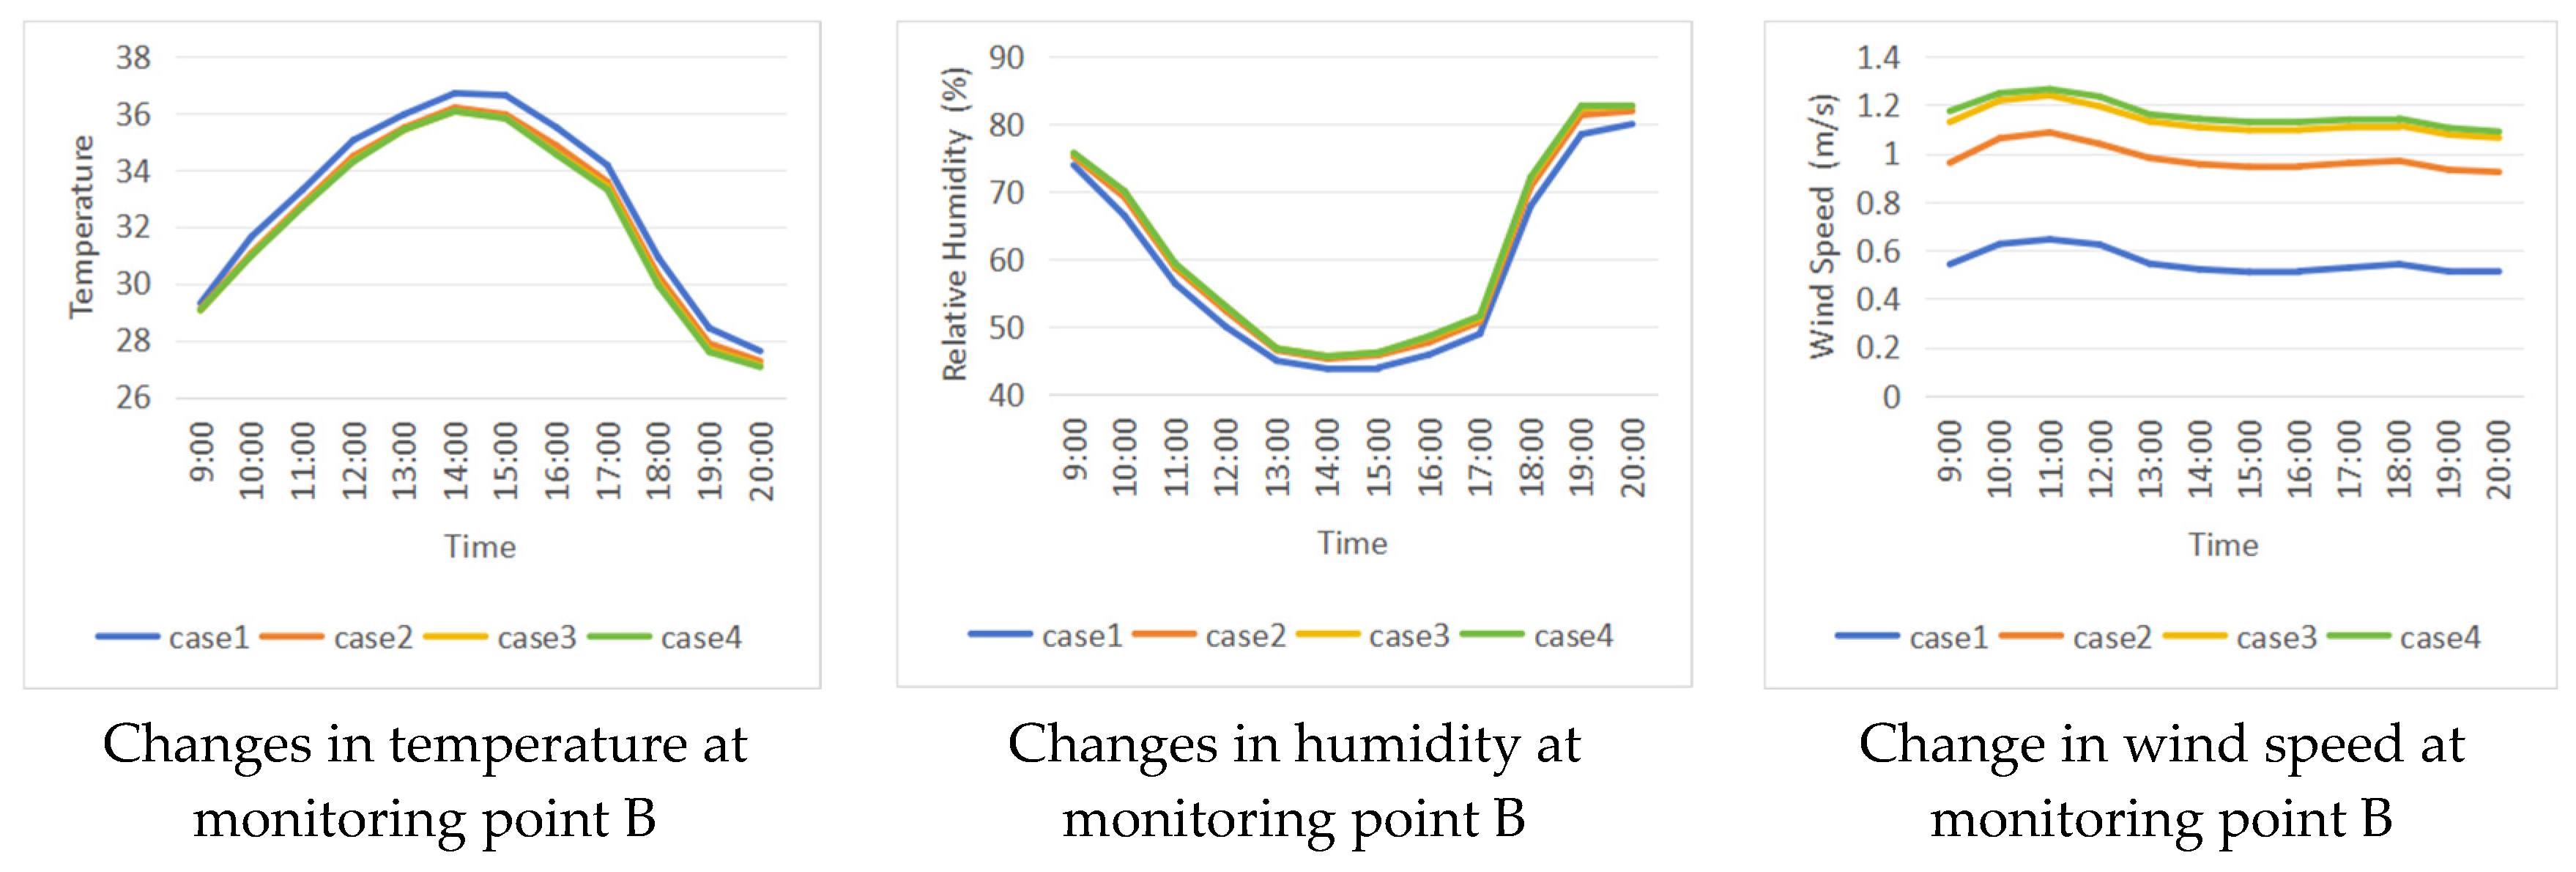
3.1. Changes in the Size of Waterside Space

After the on-site research and analysis, the street scale in the Little River Historic District, the common waterside space scale, was about 1 m, 3 m, and 6 m. The width of the streets visited by tourists was between 1 and 4 m (Figure 6).
According to the common spatial dimensions of the Canal Historic District, combined with the principles of spatial design, the simulation model is constructed as follows (Figure 7 and Figure 8):
Based on the dimensions of the waterside space, the following four scenarios were designed:
  • Case 1: Waterside space width 1 m;
  • Case 2: Waterside space width 2 m;
  • Case 3: Waterside space width 3 m;
  • Case 4: Waterside space width 4 m.
According to Figure 3, the highest local temperature occurs at 2:00 p.m., so this study focuses on evaluating the thermal environment at 2:00 p.m.
The simulation displays the air temperature and humidity at 2:00 PM, as shown in Figure 9 below.

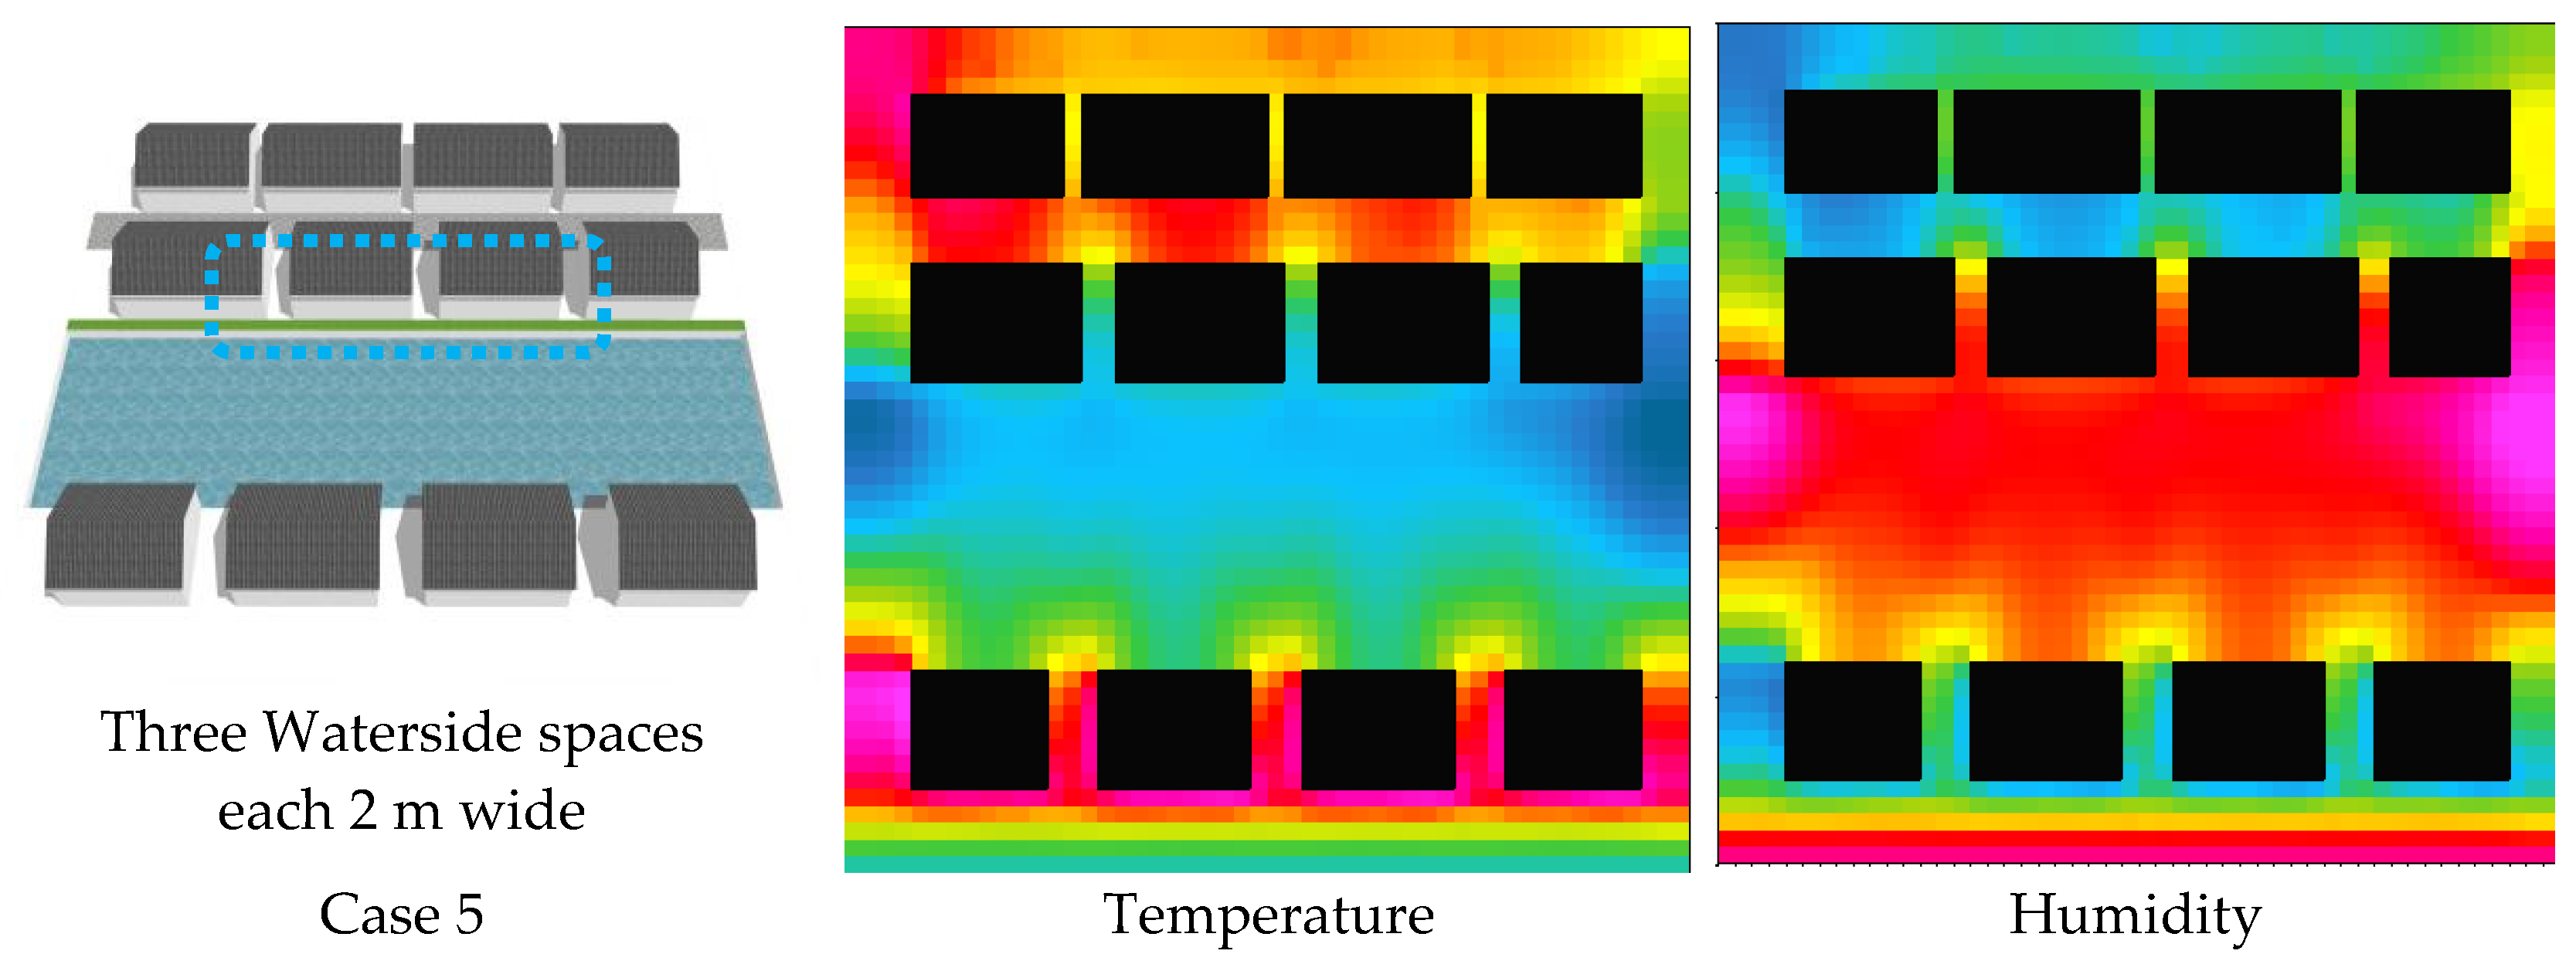
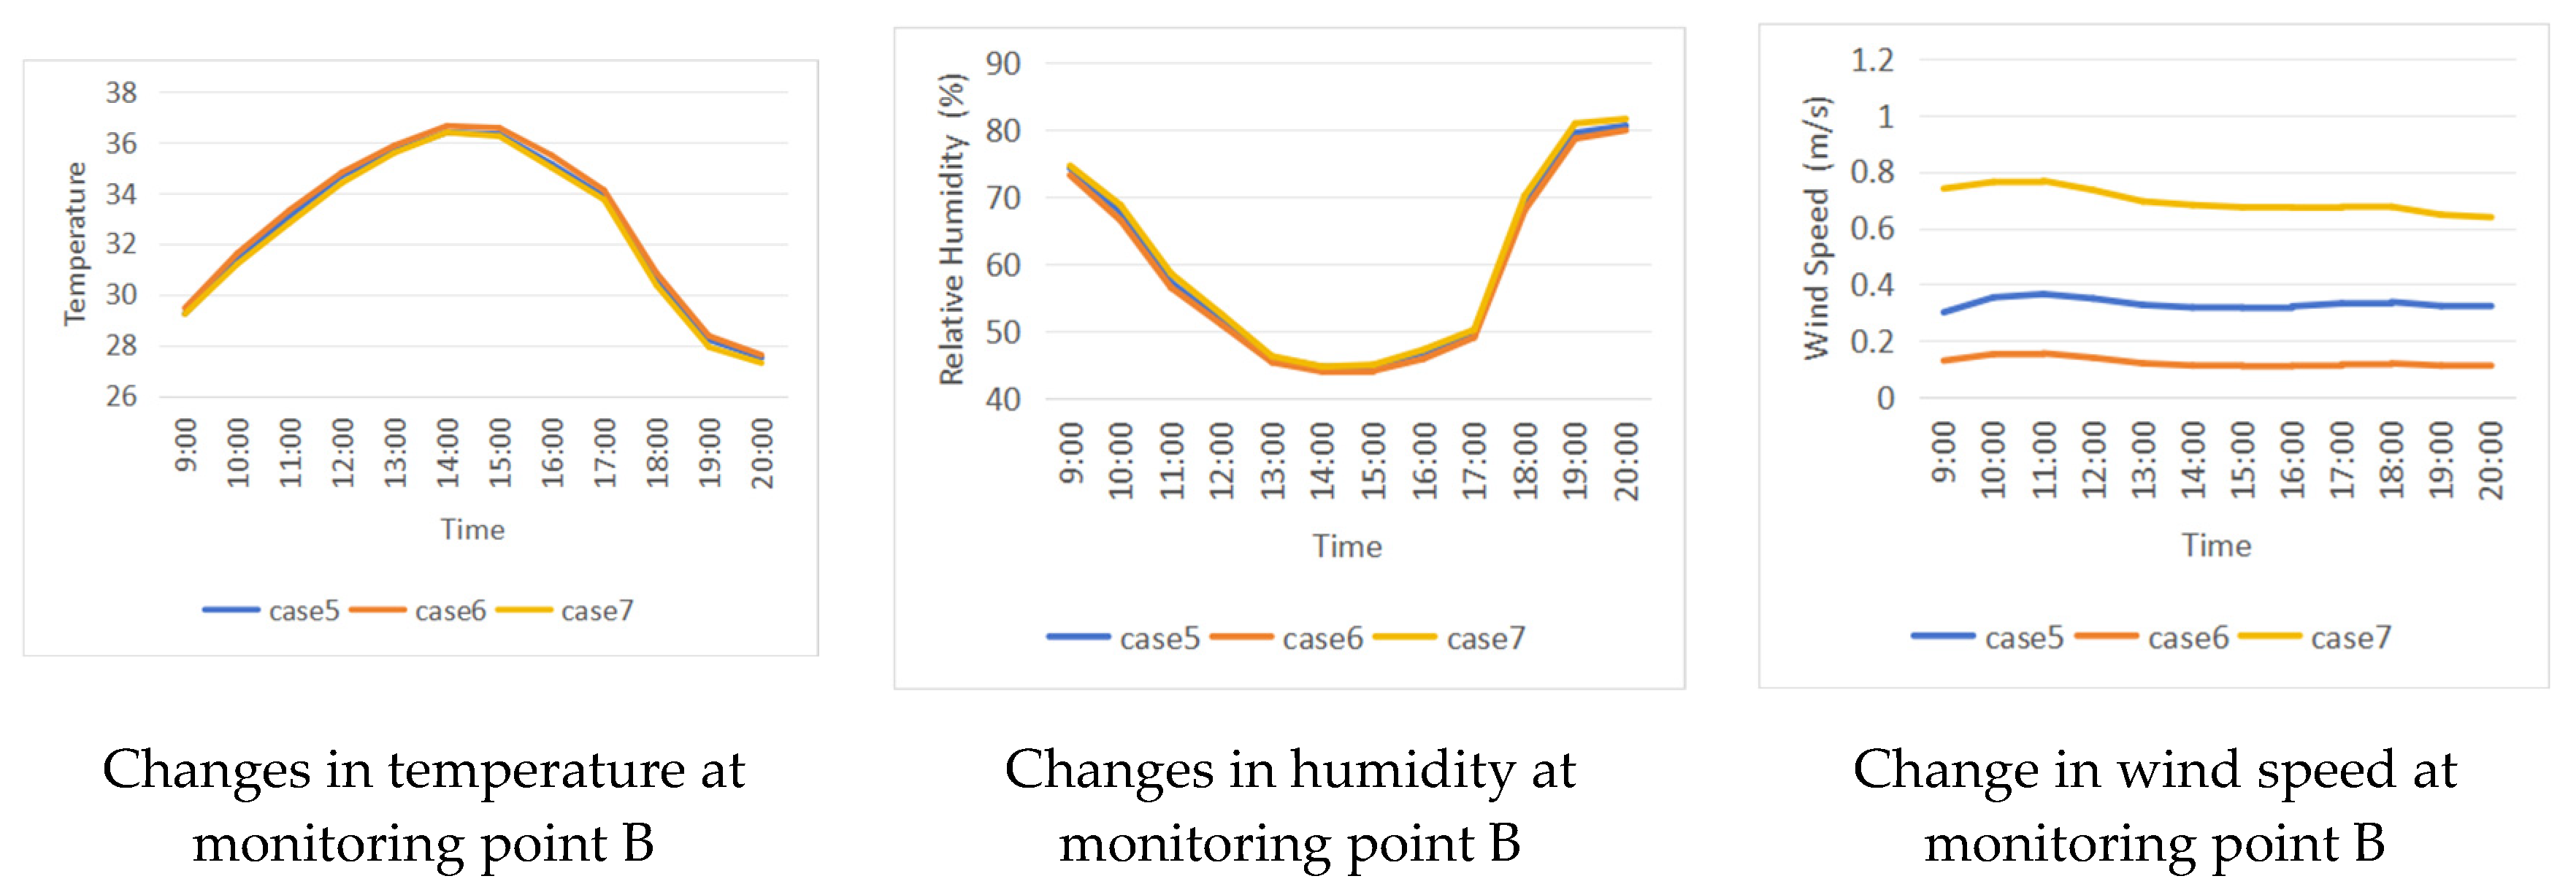
3.2. Impact of Waterside Space Distribution Design

Maximizing the use of street-facing areas can bring more commercial benefits to historic districts, so, in practical planning, there is often a tendency to increase the amount of street-facing space available for sale or rent as much as possible. However, moderate waterside space design not only enriches the spatial layers but also breaks the enclosed interface, enhancing the openness and experiential quality of the space. Therefore, in the design of waterside spaces, a balance needs to be struck between economic viability and spatial experience. Based on this, this study designed three different scenarios, with a total waterside opening width of 6 m, but differing in their distribution forms, as follows:
  • Case 5: Three waterside passages, each 2 m wide;
  • Case 6: Two waterside passages, each 3 m wide;
  • Case 7: One waterside plaza, 6 m wide.
The simulation displays the air temperature and humidity at 2:00 PM, as shown in Figure 10 below.

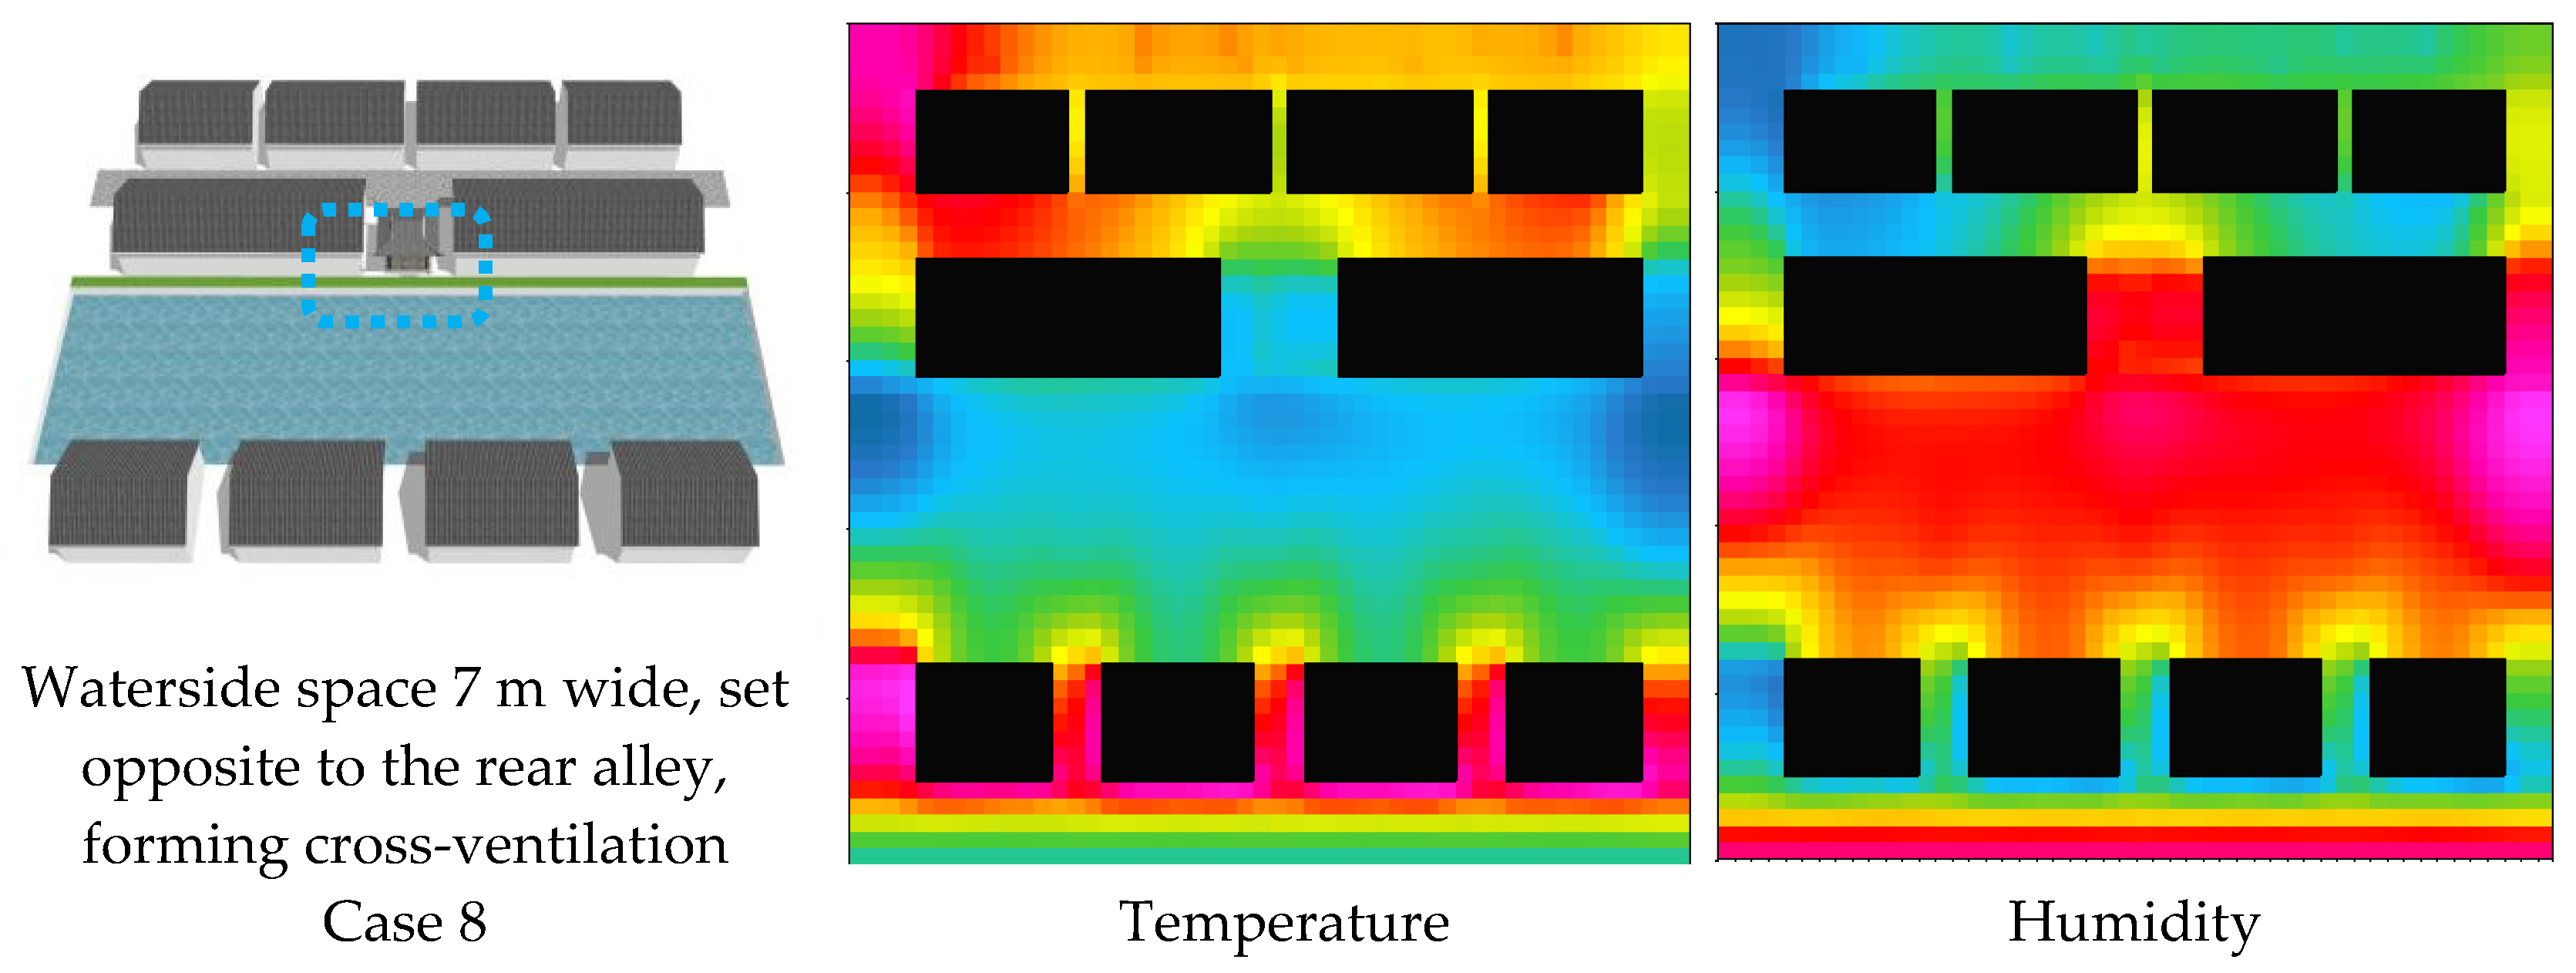
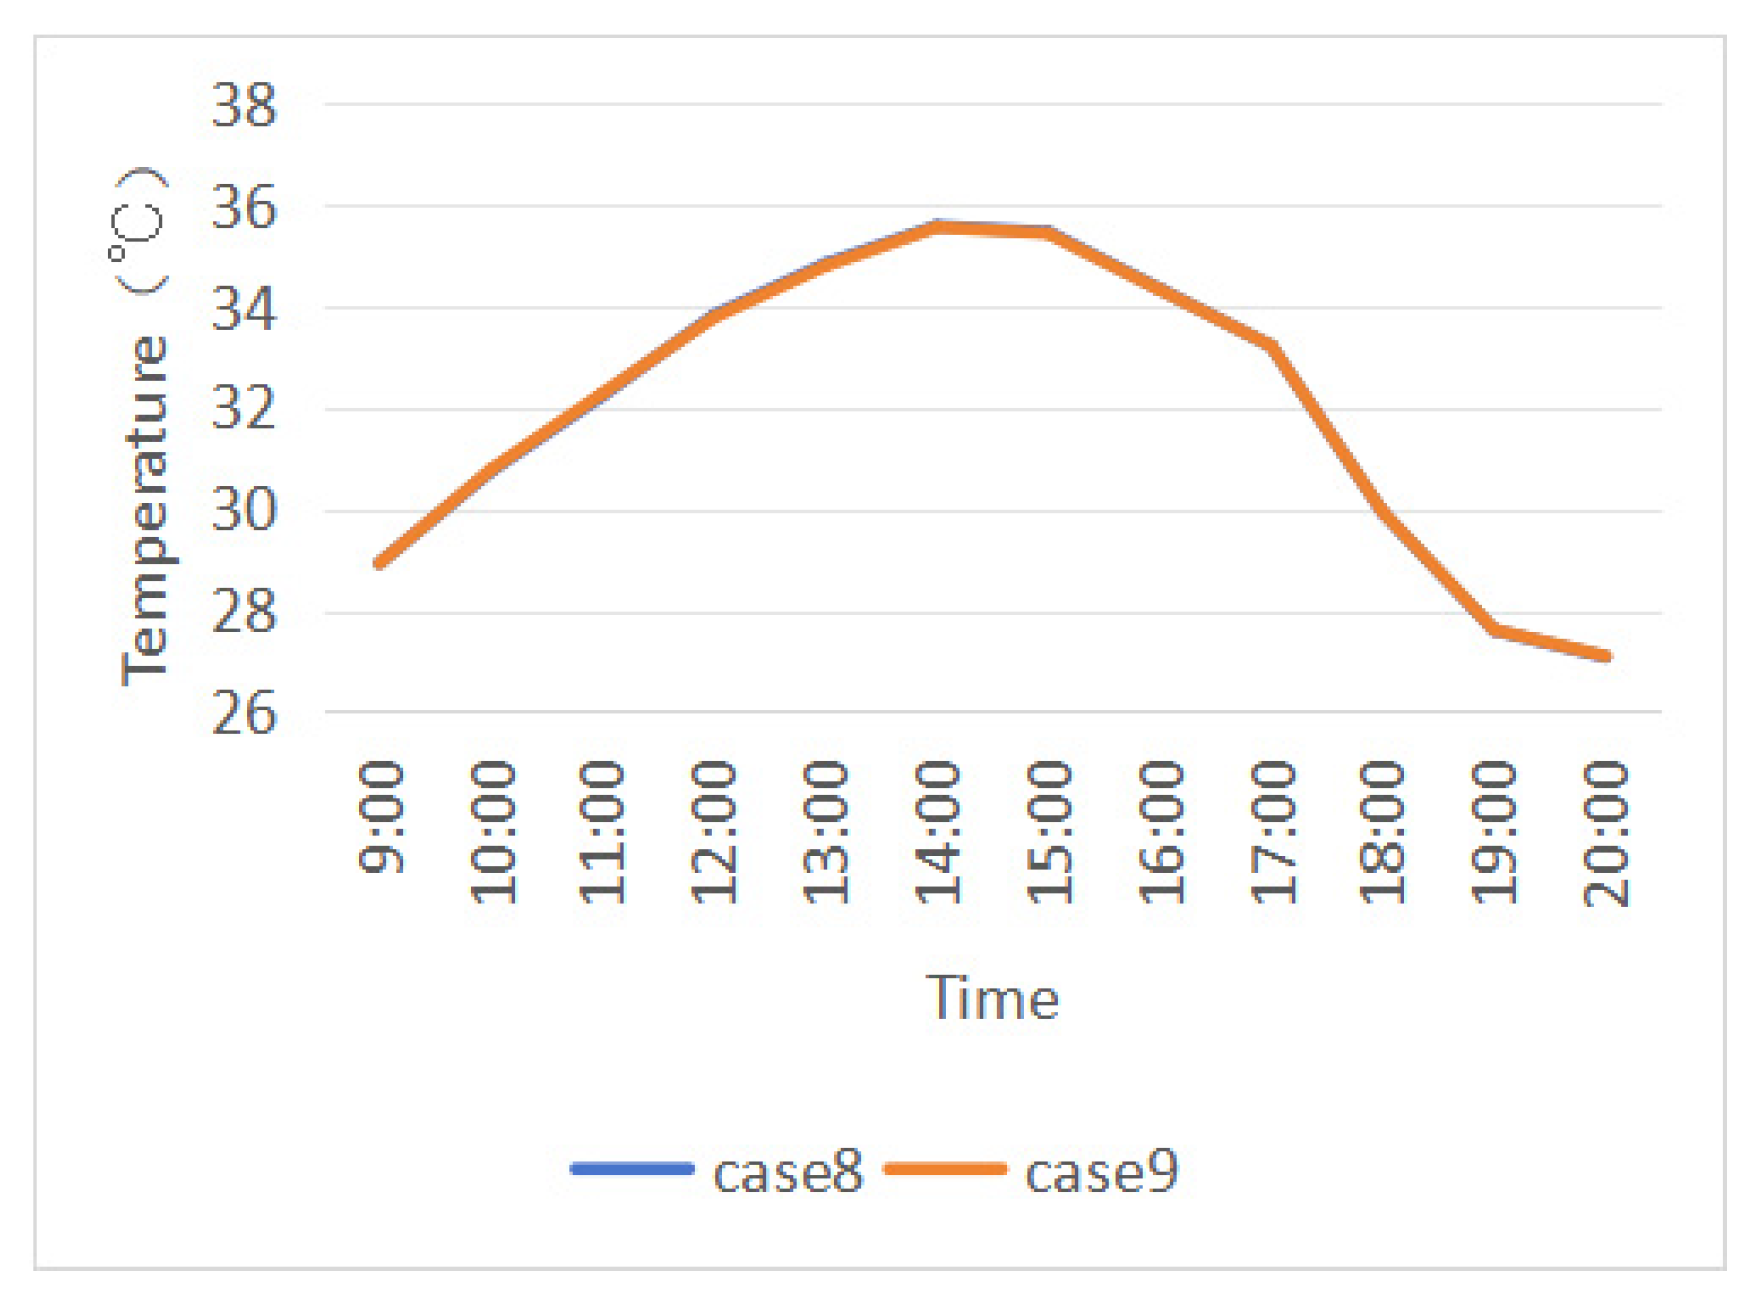
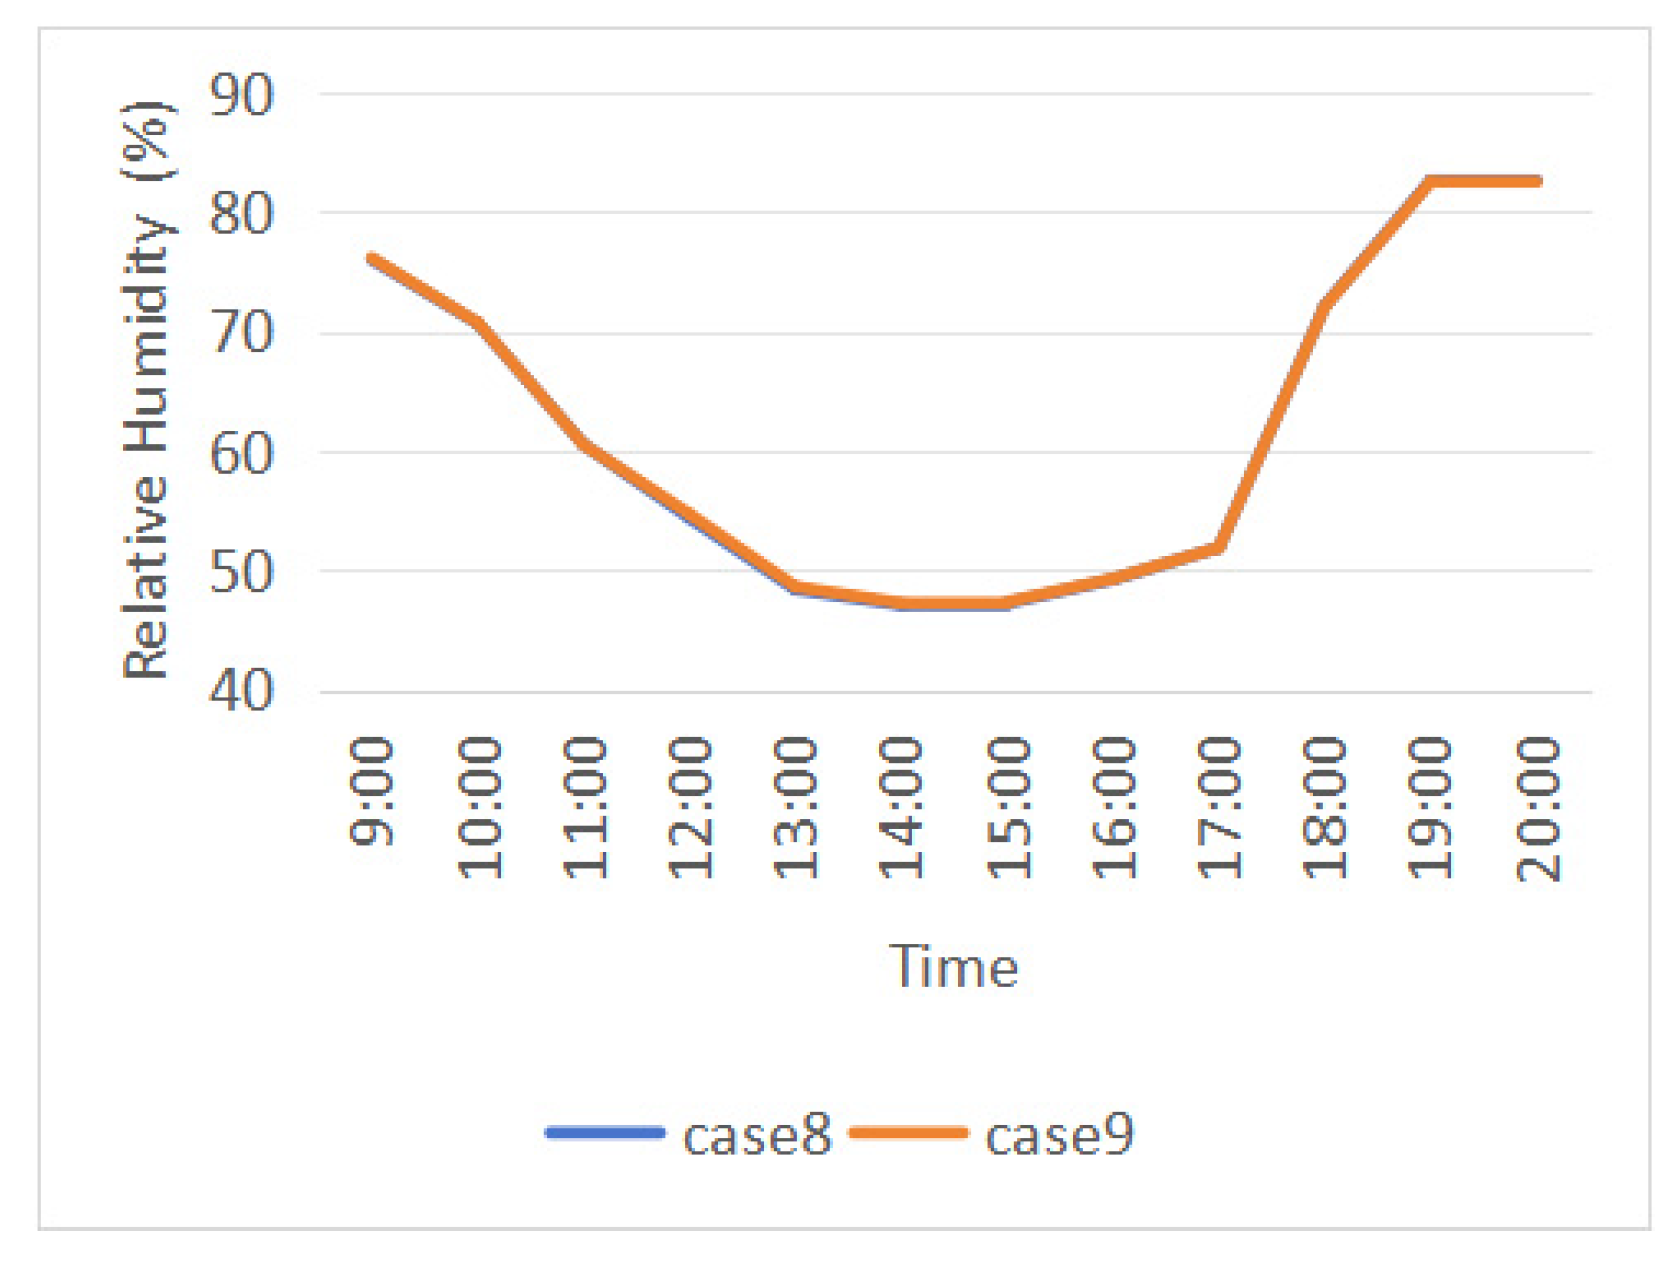
3.3. Design of Ventilation and Shading for Waterside Spaces

The shading and ventilation of waterside spaces also need to be considered. To study the impact of ventilation corridors and shading on the thermal environment, the following two scenarios were designed:
  • Case 8: Waterside platform facing the ventilation corridor;
  • Case 9: Waterside platform not facing the ventilation corridor.
The simulation displays the air temperature and humidity at 2:00 PM, as shown in Figure 11 below.

4. Discussion

4.1. Effects of Changes in Waterside Space Dimensions

According to the simulation results (Figure 12), there is a significant positive correlation between the width of the waterside space and the improvement effect on the thermal environment of the streets. Specifically, when the width reaches 7 m, the maximum temperature of the street can be reduced by 1 °C. As the width of the waterside space increases, the temperature at monitoring point B shows a gradual downward trend, while the changes in humidity are relatively minor. As the face width increases, the effect on the overall temperature and humidity of the street becomes progressively greater and can reduce the temperature of the street.
In terms of the wind speed, the variation is more pronounced when the width increases from 1 m to 3 m; however, as the width further increases to 5 m and 7 m (Figure 13), the changes in temperature, humidity, and wind speed tend to stabilize. The possible reason is that the face width of the alleys is too small for air circulation. From the trend change, too small of a width for the water-friendly space (1 m) has little effect on the thermal environment of the alleys. A width of 3 m or more can improve the thermal environment of the alleys.

4.2. Impact of Changes in Waterside Space Location

According to the simulation results (Figure 14), under the condition of the same total width, the impact of the changes in the location of the waterside spaces on the thermal environment of the streets indicates that, when the width reaches 2 m or more, it can significantly improve the thermal environment of the streets. Therefore, during the organic renewal process of historical districts in ancient towns, it is recommended to design the width of waterside spaces to be 2 m or more to enhance the thermal comfort of the district.
Additionally, as seen in Figure 10, the dispersed arrangement of waterside spaces (such as Case 5 and Case 6) and the centralized arrangement (such as Case 7) have a minor difference in their impact on the temperature and humidity of the district. However, the centralized arrangement (Case 7) can significantly increase the wind speed of the streets, thereby further enhancing the thermal comfort of the space. Therefore, under the condition of the same total width, it is recommended to prioritize the centralized layout of larger waterside spaces in the design to optimize the wind environment of the district and improve the overall spatial quality.

4.3. Impact of Ventilation and Shading Design in Waterside Spaces

Setting up monitoring points C and D in Case 8 and Case 9 (Figure 15 and Figure 16).
According to the simulation results, whether the waterside space is aligned with the ventilation corridor has a minor impact on the temperature and humidity at monitoring points C and D (Figure 17 and Figure 18), but the difference in wind speed is significant (Figure 19). When the waterside space is aligned with the ventilation corridor, the wind speed on the site increases noticeably, thereby improving the thermal comfort of the space. Additionally, the study also simulated the shading design of the waterside spaces. The results show that adding shading facilities (such as pavilions, pergolas, etc.) can effectively reduce the site temperature by more than 2 °C, significantly enhancing the comfort of the area. Therefore, the following optimization strategies are recommended for the design of waterside spaces.
Alignment with Ventilation Corridors: Design the waterside space to align with ventilation corridors to fully utilize natural wind resources, significantly increasing the wind speed in the site and thereby improving the thermal environment of the space.
Addition of Shading Facilities: Install shading facilities (such as pavilions, pergolas, or green shading) within the waterside space to effectively reduce local temperatures, enhance the thermal comfort of the area, and provide a more pleasant resting environment for visitors.

5. Conclusions

This study takes the Xiaohe Street Historic District as the research object and conducts on-site measurements during the high-temperature season in July. It also employs the ENVI-met software for modeling and simulation. By comparing the correlation between the measured data and the simulated data, the accuracy of the model is verified. The study focuses on the waterside spaces in the historic district and sets up nine simulation scenarios to systematically compare the impact of waterside spaces with different widths, locations, and forms on the thermal environment. The following conclusions are drawn:
(1) There is a positive correlation between the width of waterside spaces and the improvement of the thermal environment in the street space. The wider the waterside space, the more significant the improvement in the thermal environment. However, when the width reaches more than 5 m, further increasing it to 7 m has a minimal impact on the temperature, humidity, and wind speed within the waterside space, and the improvement effect tends to level off.
(2) The difference in the impact on the district’s temperature and humidity between dispersed and concentrated arrangements of waterside spaces is not significant. However, the concentrated arrangement can significantly enhance the wind speed in the street. Therefore, under the condition of the same total width, it is recommended to adopt a design strategy of concentrating large waterside spaces.
(3) Installing shading facilities (such as pavilions) in waterside spaces can effectively reduce the site temperature by more than 2 °C. Moreover, aligning waterside spaces with ventilation corridors can significantly increase the site wind speed, thereby improving the thermal comfort of the site.
This study provides a scientific basis for optimizing the thermal environment design of waterfront spaces in historical districts through quantitative analysis. For the sustainable renovation of ancient towns, the findings offer effective design strategies. Beyond waterfront space design, the selection of building and pavement materials should be prioritized in the renovation of historical districts. Traditional black-tiled roofs and bluestone-paved roads are common in ancient architecture, but replacing them with light-colored materials is recommended to reflect solar radiation. Additionally, the tourist density significantly impacts the thermal radiation and air circulation. Waterfront spaces should be strategically integrated with key gathering nodes to accommodate visitor flows. The planning of water systems and tourist routes should be correlated to enhance the thermal comfort for visitors. These aspects—the material selection, crowd management, and integrated spatial planning—constitute critical focus areas for future research on the thermal environments of ancient town historical districts.

Author Contributions

W.J. designed and supervised this study. W.J. performed the experiments. W.J. analyzed the data analysis. W.J. prepared the manuscript. W.J. and H.F. revised the manuscript. All authors read and approved its content. All authors have read and agreed to the published version of the manuscript.

Funding

This research was supported by Zhejiang Province Philosophy and Social Sciences Planning “Provincial and Municipal Cooperation” Project (24SSHZ119YB) and Zhejiang Provincial Philosophy and Social Sciences Planning Project (25NDJC058YBM).

Institutional Review Board Statement

Not applicable.

Informed Consent Statement

Not applicable.

Data Availability Statement

The data presented in this study are available on request from the corresponding author.

Conflicts of Interest

The authors declare no conflict of interest.

References

  1. Botao, Q.; Iskandar, Y.H.P. Tourism Augmented Reality in China. In Proceedings of the Proceeding National & International Conference, Dalian, China, 28–29 February 2024; Volume 16, pp. 247–255. [Google Scholar]
  2. Jin, W.; Fukuda, H. Changes of the Northern Zhejiang Canal: Renaissance and Cultural Tourism Development of Ancient Towns. Sustainability 2024, 16, 5464. [Google Scholar] [CrossRef]
  3. Li, Z.; Ma, Y.; Weng, S. The Post-Modern Authentic Tourist Experience and Its Generation Mechanism in Thematic Historic Town: A Case Study of Wuzhen West Scenic Zone. Tour. Trib. 2023, 38, 42–52. [Google Scholar]
  4. Zhang, Q.; Lu, L.; Huang, J.; Zhang, X. Uneven Development and Tourism Gentrification in the Metropolitan Fringe: A Case Study of Wuzhen Xizha in Zhejiang Province, China. Cities 2022, 121, 103476. [Google Scholar] [CrossRef]
  5. Zou, J.; Gaur, A.; Wang, L.L.; Laouadi, A.; Lacasse, M. Assessment of Future Overheating Conditions in Canadian Cities Using a Reference Year Selection Method. Build. Environ. 2022, 218, 109102. [Google Scholar] [CrossRef]
  6. Macintyre, H.L.; Heaviside, C.; Cai, X.; Phalkey, R. The Winter Urban Heat Island: Impacts on Cold-Related Mortality in a Highly Urbanized European Region for Present and Future Climate. Environ. Int. 2021, 154, 106530. [Google Scholar] [CrossRef]
  7. Teshnehdel, S.; Gatto, E.; Li, D.; Brown, R.D. Improving Outdoor Thermal Comfort in a Steppe Climate: Effect of Water and Trees in an Urban Park. Land 2022, 11, 431. [Google Scholar] [CrossRef]
  8. Yu, H.; Zhang, T.; Fukuda, H.; Ma, X. The Effect of Landscape Configuration on Outdoor Thermal Environment: A Case of Urban Plaza in Xi’an, China. Build. Environ. 2023, 231, 110027. [Google Scholar] [CrossRef]
  9. Cheng, Y.; Bao, Y.; Liu, S.; Liu, X.; Li, B.; Zhang, Y.; Pei, Y.; Zeng, Z.; Wang, Z. Thermal Comfort Analysis and Optimization Strategies of Green Spaces in Chinese Traditional Settlements. Forests 2023, 14, 1501. [Google Scholar] [CrossRef]
  10. Soflaei, F.; Shokouhian, M.; Shemirani, S.M.M. Traditional Iranian Courtyards as Microclimate Modifiers by Considering Orientation, Dimensions, and Proportions. Front. Archit. Res. 2016, 5, 225–238. [Google Scholar] [CrossRef]
  11. Chiu, Y.-h.; Wang, K.-f.; Lin, S.-W. Thermal Comfort, Visibility, and the Spatial Layout in Classical Gardens of Suzhou, China. Appl. Ecol. Environ. Res. 2023, 21, 1991. [Google Scholar] [CrossRef]
  12. Lin, T.-P.; Matzarakis, A. Tourism Climate and Thermal Comfort in Sun Moon Lake, Taiwan. Int. J. Biometeorol. 2008, 52, 281–290. [Google Scholar] [CrossRef] [PubMed]
  13. Wang, S.; He, Y.; Song, X. Impacts of Climate Warming on Alpine Glacier Tourism and Adaptive Measures: A Case Study of Baishui Glacier No. 1 in Yulong Snow Mountain, Southwestern China. J. Earth Sci. 2010, 21, 166–178. [Google Scholar] [CrossRef]
  14. Hamilton, J.M.; Tol, R.S.J. The Impact of Climate Change on Tourism in Germany, the UK and Ireland: A Simulation Study. Reg. Environ Change 2007, 7, 161–172. [Google Scholar] [CrossRef]
  15. Scott, D.; Jones, B.; Konopek, J. Implications of Climate and Environmental Change for Nature-Based Tourism in the Canadian Rocky Mountains: A Case Study of Waterton Lakes National Park. Tour. Manag. 2007, 28, 570–579. [Google Scholar]
  16. Nasrollahi, N.; Hatami, Z.; Taleghani, M. Development of Outdoor Thermal Comfort Model for Tourists in Urban Historical Areas; A Case Study in Isfahan. Build. Environ. 2017, 125, 356–372. [Google Scholar]
  17. Rizwan, A.M.; Dennis, L.Y.; Chunho, L.I.U. A Review on the Generation, Determination and Mitigation of Urban Heat Island. J. Environ. Sci. 2008, 20, 120–128. [Google Scholar]
  18. Ridderstaat, J.; Oduber, M.; Croes, R.; Nijkamp, P.; Martens, P. Impacts of Seasonal Patterns of Climate on Recurrent Fluctuations in Tourism Demand: Evidence from Aruba. Tour. Manag. 2014, 41, 245–256. [Google Scholar]
  19. Eugenio-Martin, J.L.; Campos-Soria, J.A. Climate in the Region of Origin and Destination Choice in Outbound Tourism Demand. Tour. Manag. 2010, 31, 744–753. [Google Scholar]
  20. Lu, S.; Xia, H.; Wei, S.; Fang, K.; Qi, Y. Analysis of the Differences in Thermal Comfort between Locals and Tourists and Genders in Semi-Open Spaces under Natural Ventilation on a Tropical Island. Energy Build. 2016, 129, 264–273. [Google Scholar]
  21. Ma, K.; Tang, X.; Ren, Y.; Wang, Y. Research on the Spatial Pattern Characteristics of the Taihu Lake “Dock Village” Based on Microclimate: A Case Study of Tangli Village. Sustainability 2019, 11, 368. [Google Scholar] [CrossRef]
  22. Jamei, E.; Rajagopalan, P.; Seyedmahmoudian, M.; Jamei, Y. Review on the Impact of Urban Geometry and Pedestrian Level Greening on Outdoor Thermal Comfort. Renew. Sustain. Energy Rev. 2016, 54, 1002–1017. [Google Scholar] [CrossRef]
  23. Yan, H.; Fan, S.; Guo, C.; Wu, F.; Zhang, N.; Dong, L. Assessing the Effects of Landscape Design Parameters on Intra-Urban Air Temperature Variability: The Case of Beijing, China. Build. Environ. 2014, 76, 44–53. [Google Scholar] [CrossRef]
  24. Morakinyo, T.E.; Dahanayake, K.K.C.; Adegun, O.B.; Balogun, A.A. Modelling the Effect of Tree-Shading on Summer Indoor and Outdoor Thermal Condition of Two Similar Buildings in a Nigerian University. Energy Build. 2016, 130, 721–732. [Google Scholar] [CrossRef]
  25. Phelan, P.E.; Kaloush, K.; Miner, M.; Golden, J.; Phelan, B.; Silva, H.; Taylor, R.A. Urban Heat Island: Mechanisms, Implications, and Possible Remedies. Annu. Rev. Environ. Resour. 2015, 40, 285–307. [Google Scholar] [CrossRef]
  26. Espín-Sánchez, D.; Olcina-Cantos, J.; Conesa-García, C. Temporal Changes in Tourists’ Climate-Based Comfort in the Southeastern Coastal Region of Spain. Climate 2023, 11, 230. [Google Scholar] [CrossRef]
  27. Lai, D.; Liu, W.; Gan, T.; Liu, K.; Chen, Q. A Review of Mitigating Strategies to Improve the Thermal Environment and Thermal Comfort in Urban Outdoor Spaces. Sci. Total Environ. 2019, 661, 337–353. [Google Scholar] [CrossRef]
  28. Salata, F.; Golasi, I.; de Lieto Vollaro, R.; de Lieto Vollaro, A. Urban Microclimate and Outdoor Thermal Comfort. A Proper Procedure to Fit ENVI-Met Simulation Outputs to Experimental Data. Sustain. Cities Soc. 2016, 26, 318–343. [Google Scholar] [CrossRef]
  29. Leng, H.; Yuan, Q. International Experience and Enlightenment on Urban Microclimate Environment Control and Optimization. Urban Plan. Int 2014, 29, 114–119. [Google Scholar]
  30. Bruse, M.; Fleer, H. Simulating Surface–Plant–Air Interactions inside Urban Environments with a Three Dimensional Numerical Model. Environ. Model. Softw. 1998, 13, 373–384. [Google Scholar] [CrossRef]
  31. Krüger, E.L.; Minella, F.O.; Rasia, F. Impact of Urban Geometry on Outdoor Thermal Comfort and Air Quality from Field Measurements in Curitiba, Brazil. Build. Environ. 2011, 46, 621–634. [Google Scholar] [CrossRef]
  32. Li, J.; Wang, J. Simulation Analysis on Relationship between Spatial Form and Microclimate of Pedestrian Street in Nanjing. J. Southeast Univ. (Nat. Sci. Ed.) 2016, 46, 1103–1109. [Google Scholar]
  33. Yue, X.; Yin, H.; Kong, F.; Chen, J.; Liu, M. The Influence of Green Space Layout on Microclimate Based on ENVI-Met—A Case Study of the Residential District in Nanjing. Jiangsu Urban Plan. 2018, 23, 34–40. [Google Scholar]
  34. Li, H.; Wu, J.; Zhao, Y.; Huang, J.; Li, Z.; Ruan, Y. Influence Analysis of Building Layouts on Micro-Environment of Residence Community. Energy Sav. Build. 2016, 3, 57–63. [Google Scholar]
  35. Zhixin, L.; Senlin, Z.; Xiaoshan, F.; Xiaohui, L.; Lihua, Z. Simulating Validation of ENVI-Met Vegetation Model to Ficus Microcarpa in Hot-Humid Region of Subtropical Zone. J. Beijing For. Univ. 2018, 40, 1–12. [Google Scholar]
  36. Zhang, Q.; Zhou, D.; Xu, D.; Cheng, J.; Rogora, A. Influencing Factors of the Thermal Environment of Urban Green Space. Heliyon 2022, 8, e11559. [Google Scholar] [PubMed]
  37. Fröhlich, D.; Matzarakis, A. Modeling of Changes in Thermal Bioclimate: Examples Based on Urban Spaces in Freiburg, Germany. Theor. Appl. Clim. 2013, 111, 547–558. [Google Scholar] [CrossRef]
  38. Zakhour, S. The Impact of Urban Geometry on Outdoor Thermal Comfort Conditions in Hot-Arid Region. J. Civ. Eng. Archit. Res. 2015, 2, 862–875. [Google Scholar]
  39. Chow, W.T.L.; Pope, R.L.; Martin, C.A.; Brazel, A.J. Observing and Modeling the Nocturnal Park Cool Island of an Arid City: Horizontal and Vertical Impacts. Theor. Appl. Clim. 2011, 103, 197–211. [Google Scholar] [CrossRef]
  40. Tsoka, S.; Tsikaloudaki, A.; Theodosiou, T. Analyzing the ENVI-Met Microclimate Model’s Performance and Assessing Cool Materials and Urban Vegetation Applications—A Review. Sustain. Cities Soc. 2018, 43, 55–76. [Google Scholar]
Figure 1. Research methodology (self-restraint).
Sustainability 17 03112 g001
Figure 2. Location map and measurement point distribution (self-restraint).
Sustainability 17 03112 g002
Figure 3. Temperature comparison chart—points A and B (self-restraint).
Sustainability 17 03112 g003
Figure 4. Humidity comparison chart (self-restraint).
Sustainability 17 03112 g004
Figure 5. Correlation analysis (self-restraint).
Sustainability 17 03112 g005
Figure 6. Xiaohe Street scene street space and water-friendly space.
Sustainability 17 03112 g006
Figure 7. Axonometric view of the waterside space design scope (self-restraint).
Sustainability 17 03112 g007
Figure 8. Waterside space design dimensions (self-restraint).
Sustainability 17 03112 g008
Figure 9. Simulation of the thermal environment for waterside spaces of different widths (self-restraint).
Sustainability 17 03112 g009aSustainability 17 03112 g009b
Figure 10. Simulation of the thermal environment for waterside spaces of different configurations (self-restraint).
Sustainability 17 03112 g010aSustainability 17 03112 g010b
Figure 11. Simulation of the thermal environment in waterside spaces at different locations (self-restraint).
Sustainability 17 03112 g011aSustainability 17 03112 g011b
Figure 12. Temperature, humidity, and wind speed at the monitoring points for cases 1–4 (self-restraint).
Sustainability 17 03112 g012
Figure 13. Wind speed at the monitoring points for Cases 1–4 (self-restraint).
Sustainability 17 03112 g013
Figure 14. Temperature, humidity, and wind speed at the monitoring points for Cases 5–7 (self-restraint).
Sustainability 17 03112 g014
Figure 15. Case 8 model map and monitoring point C (self-restraint).
Sustainability 17 03112 g015
Figure 16. Case 9 model map and monitoring point D (self-restraint).
Sustainability 17 03112 g016
Figure 17. Comparison of temperature at monitoring points C and D (self-restraint).
Sustainability 17 03112 g017
Figure 18. Comparison of humidity at monitoring points C and D (self-restraint).
Sustainability 17 03112 g018
Figure 19. Comparison of wind speeds at monitoring points B and C (self-restraint).
Sustainability 17 03112 g019
Table 1. Research overview.
Content of the StudyRelevant ScholarsShortcomings
Urban thermal environment researchSoflaei, F. (2016) [10]; Macintyre (2021) [6]; Teshnehdel, S. (2022) [7]; Yu, H. (2023) [8]; Cheng, Y. (2023) [9]; Chiu, Y. (2023) [11]A large number of studies have focused on urban public spaces, with fewer studies on landscape thermal environments.
Thermal environment research in tourist attractionsHamilton and Tol (2007) [14]; Lin and Matzarakis (2008) [12]; Wang et al. (2010) [13]; Scott et al. (2007) [15];Nasrollahi, N. (2017) [16]With the development of culture and the tourism industry, the research on the thermal environment of scenic spots needs to be strengthened. Currently, there are fewer studies on the thermal environments of ancient towns in Jiangnan water towns.
Thermal environment study of hydrophilic space in historical neighborhoods of ancient townsYan, H. (2014) [23]; Morakinyo, T.E. (2016) [24]; Jamei, E. (2016) [22];Salata, F. (2016) [28]; Nasrollahi, N. (2017) [16]; Ma, K. (2019) [21];Lai, D. (2019) [27]; Espín-Sánchez, D. (2023) [26];Currently, there are more studies on the thermal environmental texture of hydrophilic spaces, but there are fewer studies on the hydrophilic spaces of ancient towns and historic districts. Jiangnan water towns have a unique subsurface, and the study of their thermal environment is of great significance.
Table 2. Equipment parameters (self-restraint).
KAN-WS01 Handheld Meteorological Monitoring Instrument Meteorological Parameters
Measurement ElementsMeasuring RangeAccuracyResolution RatioUnit
Wind speed0~40±0.30.1m/s
Atmospheric temperature−20~50±0.30.1°C
Relative humidity0~100%±3%0.1%RH
Atmospheric pressure300~1100±0.30.1hPa
Table 3. Model input in ENVI-met (self-restraint).
CategorySimulation ParametersValues Used
Simulation ParametersDate24 July 2023
Time9:00–18:00
Total Time10 h
Boundary ConditionSimple Forcing
Wind Speed at 10 m2.7 m/s (summer)
Wind Direction202.5 (summer)
Material SettingRoughness Length0.01
Initial Air TemperatureWeather Station Data
Initial Relative HumidityWeather Station Data
BuildingsThe Albedo of Walls for Buildings: 0.3
Absorption of Roof Tiles: 0.5
PavementsThe Albedo of Gray Granite Pavement: 0.6
Disclaimer/Publisher’s Note: The statements, opinions and data contained in all publications are solely those of the individual author(s) and contributor(s) and not of MDPI and/or the editor(s). MDPI and/or the editor(s) disclaim responsibility for any injury to people or property resulting from any ideas, methods, instructions or products referred to in the content.

