
Recyclable Consumption and Its Implications for Sustainable Development in the EU

 , , , , , and
Abstract
1. Introduction
2. Literature Review
2.1. Investments in the Circular Economy
2.2. Trade in Recyclable Materials
2.3. Renewable Energy
2.4. Greenhouse Gas Emissions
2.5. Population
2.6. GDP per Capita
2.7. The Material Footprint
2.8. The Circular Material Use Rate
2.9. Econometric Model
2.10. Hypothesis
3. Research Methodology
3.1. Data and Proposed Model
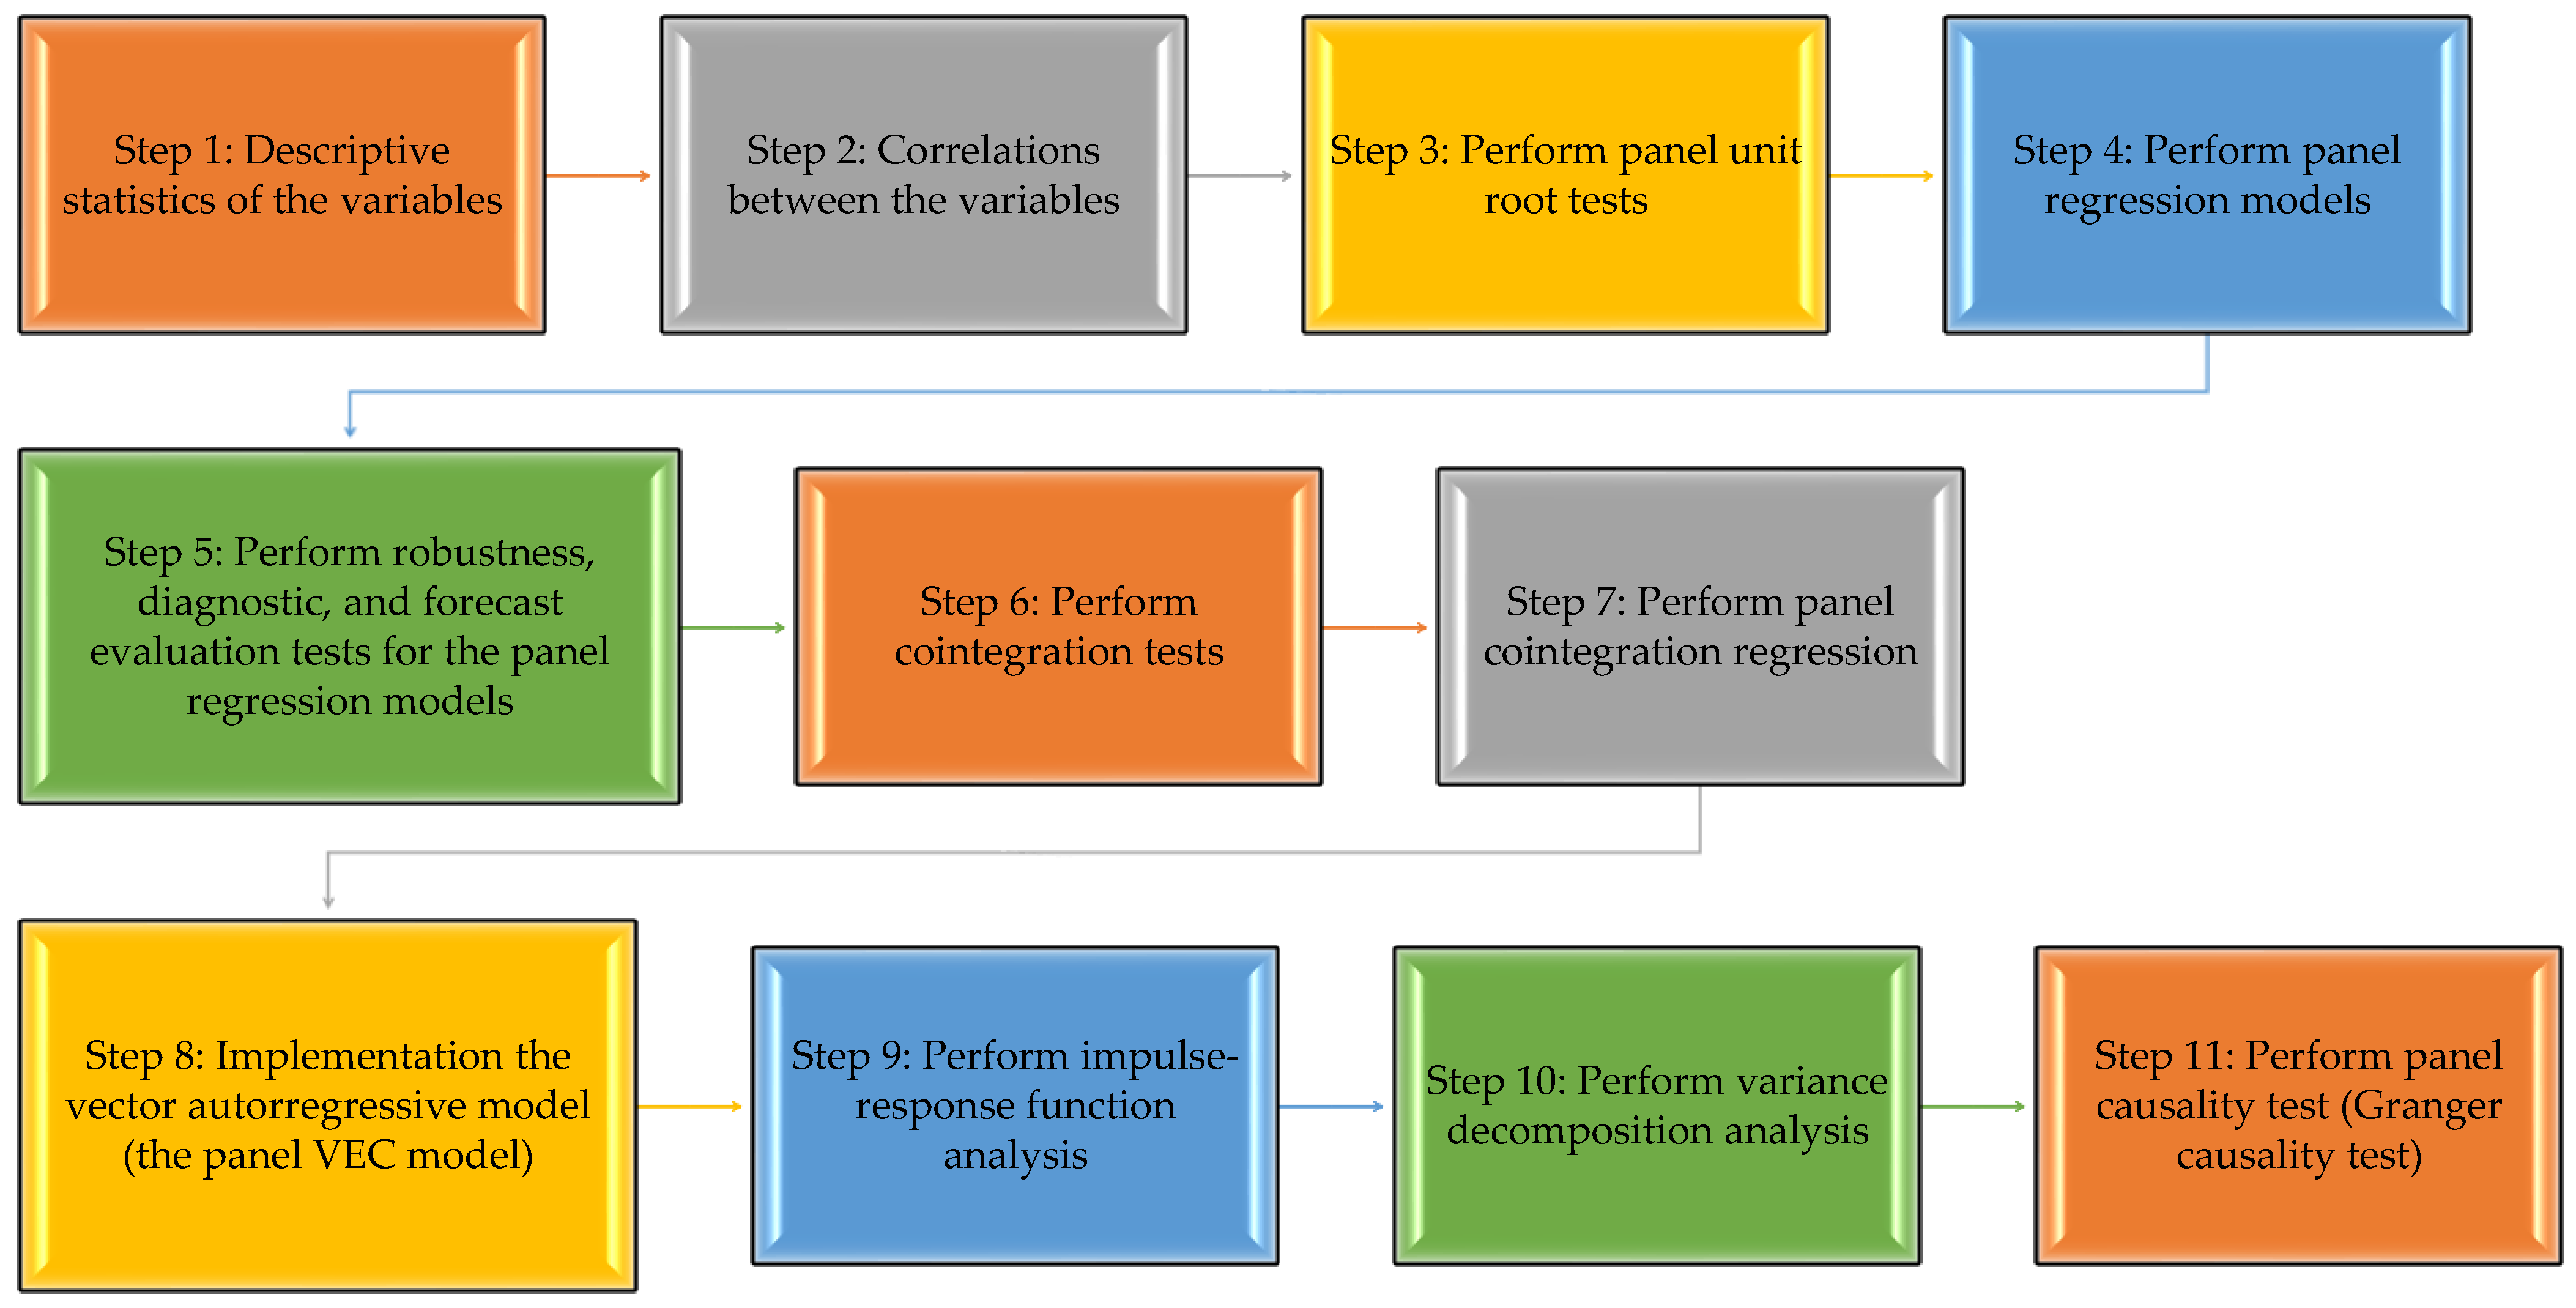
3.2. Methodological Design
4. Results
5. Discussion
6. Conclusions
- -
- The introduction and extension of the carbon tax: a progressive tax on carbon emissions can act as a disincentive to the use of non-renewable resources and encourage investment in recyclable materials and renewable energy sources;
- -
- Economic mechanisms to support investments in green technologies: the creation of special funds and tax incentives for companies that invest in recycling, emission reduction technologies, and renewable energy sources;
- -
- The establishment of legally binding targets for the circular material utilisation rate (CMUR) at the national and sectoral level to ensure that businesses prioritise recycled materials over virgin resources;
- -
- The imposition of a levy on industries heavily dependent on virgin raw materials to incentivise the transition to recyclable materials;
- -
- The increased use of renewable energy should be facilitated through the development of EU policies for the accelerated integration of renewables into energy grids, including subsidies for green energy producers and investment in sustainable energy infrastructure;
- -
- Education and social programs to increase recycling rates should be launched, including awareness campaigns and environmental education programs for the general public, along with initiatives such as efficient separate waste collection systems and incentives for recycling;
- -
- The regulation of the trade in recyclable materials is also recommended, with a view to standardising and facilitating the market for recyclable materials in the EU, with a view to encouraging a steady and efficient flow of reusable resources.
Author Contributions
Funding
Data Availability Statement
Conflicts of Interest
Abbreviations
| ADF | Augmented Dickey–Fuller |
| CEE | Central and Eastern Europe |
| CO2 | Carbon Dioxide |
| ECT | Error Correction Term |
| EU | European Union |
| FE | Fixed Effects |
| FMOLS | Fully Modified Ordinary Least Squares |
| GDP | Gross Domestic Product |
| GDP_CAP | Gross Domestic Product per capita |
| GHG | Greenhouse Gas Emissions |
| IRF | Impulse Response Function |
| OLS | Ordinary Least Squares |
| PP | Phillips–Perron |
| RE | Random Effects |
| VAR | Vector Autoregression Model |
| VECM | Vector Error Correction Model |
| VD | Variance Decomposition |
Appendix A

| Independent Variable | R2 | VIF |
|---|---|---|
| RMF | 0.60 | 2.5 |
| TRADE | 0.74 | 3.85 |
| GHGE | 0.45 | 1.82 |
| INV | 0.70 | 3.33 |
| GDP_CAP | 0.70 | 3.33 |
| RENEW | 0.57 | 2.33 |
| CMR | 0.40 | 1.67 |
| PPL | 0.66 | 2.94 |
Appendix B
| Residual Independent Variable | Coeff. | Prob. | Presence of Endogeneity |
|---|---|---|---|
| Residual RMF | −0.32 | 0.51 | No |
| Residual TRADE | −0.24 | 0.054 | No |
| Residual GHGE | −0.70 | 0.1175 | No |
| Residual INV | 0.60 | 0.102 | No |
| Residual GDP_CAP | −0.70 | 0.052 | No |
| Residual RENEW | 0.87 | 0.068 | No |
| Residual CMR | 0.36 | 0.078 | No |
| Residual PPL | 0.87 | 0.056 | No |
| Cross-Section Random | First-Stage Model | Two-Stage Model |
|---|---|---|
| Chi-Sq. Statistic | 7.46 | 26.46 |
| Prob. | 0.4876 | 0.0664 |
Appendix C
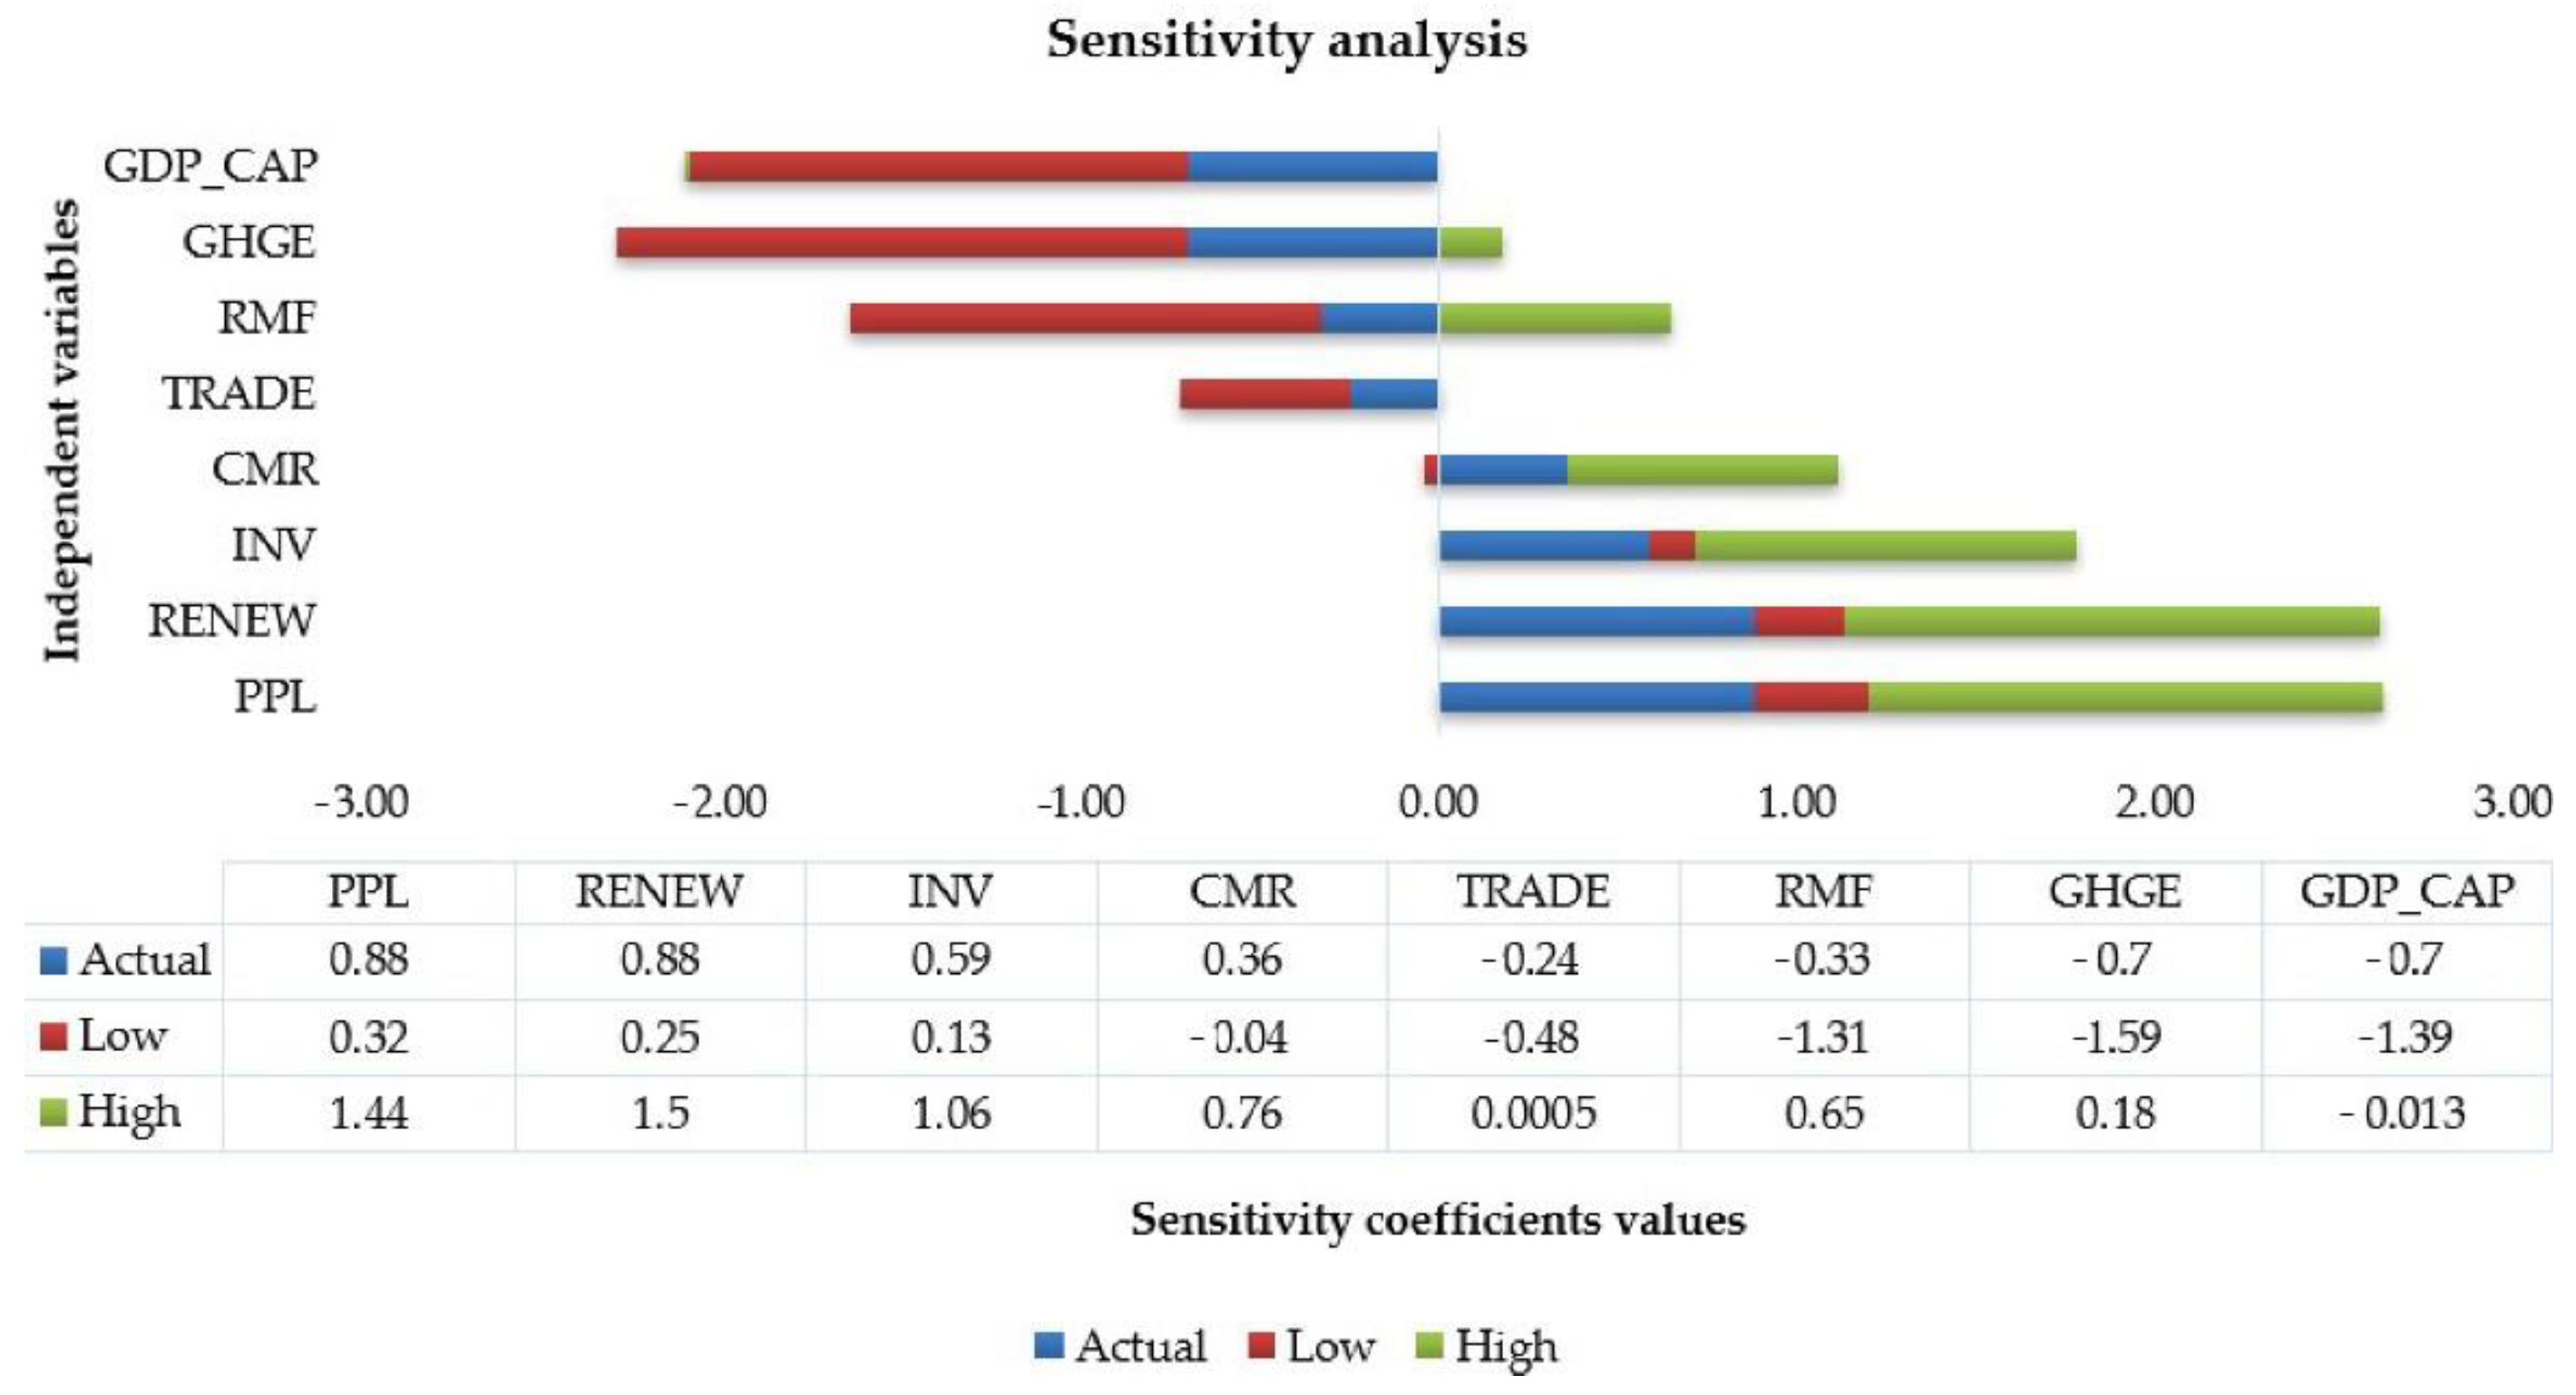
| Factor/Independent Variable | Actual | Low | High |
|---|---|---|---|
| RENEW | 0.88 | 0.25 | 1.5 |
| PPL | 0.88 | 0.32 | 1.44 |
| INV | 0.59 | 0.13 | 1.06 |
| CMR | 0.36 | −0.041 | 0.76 |
| TRADE | −0.24 | −0.48 | 0.000458 |
| RMF | −0.33 | −1.31 | 0.65 |
| GHGE | −0.70 | −1.59 | 0.18 |
| GDP_CAP | −0.70 | −1.39 | −0.012 |
Appendix D. Background on Econometric Techniques
References
- Vojnovic, I. Urban Sustainability: Research, politics, policy and practice. Cities 2014, 41, S30–S44. [Google Scholar] [CrossRef]
- Fanea-Ivanovici, M.; Pană, M.-C. From Culture to Smart Culture. How Digital Transformations Enhance Citizens’ Well-Being through Better Cultural Accessibility and Inclusion. IEEE Access 2020, 8, 37988–38000. [Google Scholar] [CrossRef]
- European Commission. Circular Economy Action Plan. 2020. Available online: https://environment.ec.europa.eu/strategy/circular-economy-action-plan_en (accessed on 2 February 2025).
- Hysa, E.; Kruja, A.; Rehman, N.U.; Laurenti, R. Circular Economy Innovation and Environmental Sustainability Impact on Economic Growth: An Integrated Model for Sustainable Development. Sustainability 2020, 12, 4831. [Google Scholar] [CrossRef]
- Yong, R. The circular economy in China. J. Mater. Cycles Waste Manag. 2007, 9, 121–129. [Google Scholar] [CrossRef]
- Bleischwitz, R.; Yang, M.; Huang, B.; Xu, X.; Zhou, J.; McDowall, W.; Andrews-Speed, P.; Liu, Z.; Yong, G. The circular economy in China: Achievements, challenges and potential implications for decarbonisation. Resour. Conserv. Recycl. 2022, 183, 106350. [Google Scholar] [CrossRef]
- Julius, A.; Roy, K.; Catriona, M.; Lecciones, A.M.; Yu, J. Creative approaches in engaging the community toward ecological waste management and wetland conservation. In Circular Economy and Sustainability; Stefanakis, A., Nikolaou, I., Eds.; Elsevier: Amsterdam, The Netherlands, 2022; Volume 2, pp. 297–317. [Google Scholar] [CrossRef]
- Dumée, L.F. Circular materials-An essay on challenges with current manufacturing and recycling strategies as well as on the potential of life cycle integrated designs. In Circular Economy and Sustainability; Stefanakis, A., Nikolaou, I., Eds.; Elsevier: Amsterdam, The Netherlands, 2022; Volume 2, pp. 359–372. [Google Scholar] [CrossRef]
- Marques, A.C.; Fuinhas, J.A. Drivers promoting renewable energy: A dynamic panel approach. Renew. Sustain. Energy Rev. 2011, 15, 1601–1608. [Google Scholar] [CrossRef]
- Busu, M. Adopting Circular Economy at the European Union Level and Its Impact on Economic Growth. Soc. Sci. 2019, 8, 159. [Google Scholar] [CrossRef]
- Apostu, S.A.; Panait, M.; Vasile, V. The energy transition in Europe-a solution for net zero carbon? Environ. Sci. Pollut. Res. 2022, 29, 71358–71379. [Google Scholar] [CrossRef]
- European Court of Auditors. Circular Economy—Slow Transition by Member States Despite EU Action (Special Report). 2023. Available online: https://www.eca.europa.eu/ECAPublications/SR-2023-17/SR-2023-17_EN.pdf (accessed on 2 February 2025).
- European Investment Bank. Circular Economy Overview 2023. 2023. pp. 1–8. Available online: https://www.eib.org/attachments/lucalli/20230157_circular_economy_overview_2023_en.pdf (accessed on 2 February 2025).
- Mazur-Wierzbicka, E. Circular economy: Advancement of European Union countries. Environ. Sci. Eur. 2021, 33, 111. [Google Scholar] [CrossRef]
- Kirchherr, J.; Reike, D.; Hekkert, M. Conceptualizing the circular economy: An analysis of 114 definitions. Resour. Conserv. Recycl. 2017, 127, 221–232. [Google Scholar] [CrossRef]
- Appiah-Kubi, E.; Richard Nana Boateng; Kofi, S. Seyram Pearl Kumah Organisational Sustainability and SMEs Performance: The Role of Control Environment. J. Clean. Prod. 2024, 452, 142026. [Google Scholar] [CrossRef]
- Lourenço, I.C.; Branco, M.C. Determinants of corporate sustainability performance in emerging markets: The Brazilian case. J. Clean. Prod. 2013, 57, 134–141. [Google Scholar] [CrossRef]
- Artiach, T.; Lee, D.; Nelson, D.; Walker, J. The Determinants of Corporate Sustainability Performance. Account. Financ. 2010, 50, 31–51. [Google Scholar] [CrossRef]
- Bartolacci, F.; Caputo, A.; Soverchia, M. Sustainability and Financial Performance of Small and Medium Sized Enterprises: A Bibliometric and Systematic Literature Review. Bus. Startegy Environ. 2020, 29, 1297–1309. [Google Scholar] [CrossRef]
- Becchetti, L.; Di Giacomo, S.; Pinnacchio, D. Corporate social responsibility and corporate performance: Evidence from a panel of US listed companies. Appl. Econ. 2008, 40, 541–567. [Google Scholar] [CrossRef]
- Song, M.; Zhou, Y. Quantitative Analysis of Foreign Trade and Environmental Efficiency in China. Emerg. Mark. Financ. Trade 2016, 52, 1647–1660. [Google Scholar] [CrossRef]
- Kindo Dawuda, M.; Adams Abdulai, A.; Mohammed, J. The impact of trade on environmental quality and sustainable development in Ghana. World Dev. Sustain. 2024, 4, 100134. [Google Scholar] [CrossRef]
- Mirza, Z.T.; Anderson, T.; Seadon, J.; Brent, A. A thematic analysis of the factors that influence the development of a renewable energy policy. Renew. Energy Focus 2024, 49, 100562. [Google Scholar] [CrossRef]
- Wang, J. Renewable energy, inequality and environmental degradation. J. Environ. Manag. 2024, 356, 120563. [Google Scholar] [CrossRef]
- Busu, M. Measuring the Renewable Energy Efficiency at the European Union Level and Its Impact on CO2 Emissions. Processes 2019, 7, 923. [Google Scholar] [CrossRef]
- Escorcia Hernández, J.R.; Torabi Moghadam, S.; Sharifi, A.; Lombardi, P. Cities in the times of COVID-19: Trends, impacts, and challenges for urban sustainability and resilience. J. Clean. Prod. 2023, 432, 139735. [Google Scholar] [CrossRef]
- Sharma, S.S. Determinants of carbon dioxide emissions: Empirical evidence from 69 countries. Appl. Energy 2011, 88, 376–382. [Google Scholar] [CrossRef]
- Ellen Macarthur Foundation. The Circular Economy in Detail. Available online: https://www.ellenmacarthurfoundation.org/the-circular-economy-in-detail-deep-dive (accessed on 2 February 2025).
- United Nations. The Sustainable Development Goals Report. 2023. pp. 1–80. Available online: https://unstats.un.org/sdgs/report/2023/The-Sustainable-Development-Goals-Report-2023.pdf (accessed on 2 February 2025).
- Neves Almeida, S.; Marques Cardoso, A.; Silva, I.P. Promoting the circular economy in the EU: How can the recycling of e-waste be increased? Struct. Change Econ. Dyn. 2024, 70, 192–201. [Google Scholar] [CrossRef]
- Knäble, D.; de Quevedo Puente, E.; Pérez-Cornejo, C.; Baumgärtler, T. The impact of the circular economy on sustainable development: A European panel data approach. Sustain. Prod. Consum. 2022, 34, 233–243. [Google Scholar] [CrossRef]
- Chen, C.C.; Pao, H.T. The causal link between circular economy and economic growth in EU-25. Environ. Sci. Pollut. Res. 2022, 29, 76352–76364. [Google Scholar] [CrossRef]
- Chen, C.C.; Pao, H.T. Circular economy and ecological footprint: A disaggregated analysis for the EU. Ecol. Indic. 2024, 160, 111809. [Google Scholar] [CrossRef]
- Arion, F.H.; Aleksanyan, V.; Markosyan, D.; Arion, I.D. Circular Pathways to Sustainable Development: Understanding the Links between Circular Economy Indicators, Economic Growth, Social Well-Being, and Environmental Performance in EU-27. Sustainability 2023, 15, 16883. [Google Scholar] [CrossRef]
- Trica, C.L.; Banacu, C.S.; Busu, M. Environmental Factors and Sustainability of the Circular Economy Model at the European Union Level. Sustainability 2019, 11, 1114. [Google Scholar] [CrossRef]
- Busu, M.; Trica, C.L. Sustainability of Circular Economy Indicators and Their Impact on Economic Growth of the European Union. Sustainability 2019, 11, 5481. [Google Scholar] [CrossRef]
- Nazarko, J.; Chodakowska, E.; Nazarko, Ł. Evaluating the Transition of the European Union Member States towards a Circular Economy. Energies 2022, 15, 3924. [Google Scholar] [CrossRef]
- Geng, Y.; Fu, J.; Sarkis, J.; Xue, B. Towards a national circular economy indicator system in China: An evaluation and critical analysis. J. Clean. Prod. 2012, 23, 216–224. [Google Scholar] [CrossRef]
- SverkoGrdic, Z.; KrstinicNizic, M.; Rudan, E. Circular Economy Concept in the Context of Economic Development in EU Countries. Sustainability 2020, 12, 3060. [Google Scholar] [CrossRef]
- Jin, Y.; Wang, H.; Wang, Y.; Fry, J.; Lenzen, M. Material Footprints of Chinese megacities. Resor. Conserv. Recycl. 2021, 174, 105758. [Google Scholar] [CrossRef]
- Bahers, J.-B.; Rosado, L. The material footprints of cities and importance of resource use indicators for urban circular economy policies: A comparison of urban metabolisms of Nantes-Saint-Nazaire and Gothenburg. Clean. Prod. Lett. 2023, 4, 100029. [Google Scholar] [CrossRef]
- Razzaq, A.; Sharif, A.; Ozturk, I.; Skare, M. Inclusive infrastructure development, green innovation, and sustainable resource management: Evidence from China’s Trade-adjusted material footprints. Resour. Policy 2022, 79, 103076. [Google Scholar] [CrossRef]
- Harris, S.; Martin, M.; Diener, D. Circularity for Circularity’s Sake? Scoping Review of Assessment Methods for Environmental Performance in the Circular Economy. Sustain. Prod. Consum. 2021, 26, 172–186. [Google Scholar] [CrossRef]
- Delgado, M.; López, A.; Esteban-García, A.L.; Lobo, A. The Importance of Particularising the Model to Estimate Landfill GHG Emissions. J. Environ. Manag. 2023, 325, 116600. [Google Scholar] [CrossRef]
- Yin, S.; Jia, F.; Chen, L.; Wang, Q. Circular Economy Practices and Sustainable Performance: A Meta-Analysis. Resour. Conserv. Recycl. 2023, 190, 106838. [Google Scholar] [CrossRef]
- EUR-Lex. Communication from the Commission to the European Parliament, the Council, the European Economic and Social Committee and the Committee of the Regions. 2020. Available online: https://eur-lex.europa.eu/legal-content/EN/TXT/?uri=CELEX:52020DC0098 (accessed on 4 March 2025).
- European Environment Agency. Circular Material Use Rate in Europe. Available online: https://www.eea.europa.eu/en/analysis/indicators/circular-material-use-rate-in-europe?activeAccordion=ecdb3bcf-bbe9-4978-b5cf-0b136399d9f8 (accessed on 4 March 2025).
- Hondroyiannis, G.; Sardianou, E.; Nikou, V.; Evangelinos, K.; Nikolaou, I. Recycling Rate Performance and Socioeconomic Determinants: Evidence from Aggregate and Regional Data across European Union Countries. J. Clean. Prod. 2024, 434, 139877. [Google Scholar] [CrossRef]
- Hondroyiannis, G.; Sardianou, E.; Nikou, V.; Evangelinos, K.; Nikolaou, I.E. Circular Economy and Macroeconomic Performance: Evidence across 28 European Countries. Ecol. Econ. 2024, 215, 108002. [Google Scholar] [CrossRef]
- Mccarthy, J.; Mccarthy, C.; Carlos, P.; Sigüenza, G.; Suto, C.; Gibson, C.; Downey, A.; Boland, A. A Critical Analysis of Ireland’s Circular Material Use Rate (CAIR); EPA Research Report; Published by the Environmental Protection Agency: Wexford, Ireland, 2022; pp. 1–70. [Google Scholar]
- Christis, M.; Vercalsteren, A.; Nuss, P.; Marra Campanale, R.; Steger, S. ETC/CE Report 2023/6 Analysis of the Circular Material Use Rate and the Doubling Target. Available online: https://www.eionet.europa.eu/etcs/etc-ce/products/etc-ce-report-2023-6-analysis-of-the-circular-material-use-rate-and-the-doubling-target (accessed on 23 March 2025).
- Martins, F.F.; Castro, H.; Smitková, M.; Felgueiras, C.; Caetano, N. Energy and Circular Economy: Nexus beyond Concepts. Sustainability 2024, 16, 1728. [Google Scholar] [CrossRef]
- Aloini, D.; Dulmin, R.; Mininno, V.; Stefanini, A.; Zerbino, P. Driving the Transition to a Circular Economic Model: A Systematic Review on Drivers and Critical Success Factors in Circular Economy. Sustainability 2020, 12, 10672. [Google Scholar] [CrossRef]
- Alola, A.A.; Olanipekun, I.O.; Shah, M.I. Examining the drivers of alternative energy in leading energy sustainable economies: The trilemma of energy efficiency, energy intensity and renewables expenses. Renew. Energy 2023, 202, 1190–1197. [Google Scholar] [CrossRef]
- George, D.A.R.; Lin, B.C.; Chen, Y. A circular economy model of economic growth. Environ. Model. Softw. 2015, 73, 60–63. [Google Scholar] [CrossRef]
- Platon, V.; Pavelescu, F.M.; Antonescu, D.; Frone, S.; Constantinescu, A.; Popa, F. Innovation and Recycling—Drivers of Circular Economy in EU. Front. Environ. Sci. 2022, 10, 902651. [Google Scholar] [CrossRef]
- Constantinescu, A.; Platon, V.; Surugiu, M.; Frone, S.; Antonescu, D.; Mazilescu, R. The Influence of Eco-Investment on E-Waste Recycling-Evidence From EU Countries. Front. Environ. Sci. 2022, 10, 928955. [Google Scholar] [CrossRef]
- Dickey, D.A.; Fuller, W.A. Distribution of the Estimators for Autoregressive Time Series with a Unit Root. J. Am. Stat. Assoc. 1979, 74, 427–431. [Google Scholar] [CrossRef]
- Levin, A.; Lin, C.-F.; Chu, C.-S. Unit root tests in panel data: Asymptotic and finite-sample properties. J. Econom. 2002, 108, 1–24. [Google Scholar] [CrossRef]
- Im, K.S.; Pesaran, M.H.; Shin, Y. Testing for unit roots in heterogeneous panels. J. Econom. 2003, 115, 53–74. [Google Scholar] [CrossRef]
- Phillips, P.C.B.; Hansen, B.E. Statistical Inference in Instrumental Variables Regression with I (1) Processes. Rev. Econ. Stud. 1990, 57, 99–125. [Google Scholar] [CrossRef]
- Wooldridge, J.M. Econometrics: Panel Data Methods. In Encyclopedia of Complexity and Systems Science, 1st ed.; Meyers, R.A., Ed.; Springer: New York, NY, USA, 2009. [Google Scholar] [CrossRef]
- Baltagi, B.H. Econometric Analysis of Panel Data, 6th ed.; Springer: Cham, Switzerland, 2021; pp. 75–228. [Google Scholar] [CrossRef]
- Vlăduţ, O.; Grigore, G.E.; Bodislav, D.A.; Staicu, G.I.; Georgescu, R.I. Analysing the Connection between Economic Growth, Conventional Energy, and Renewable Energy: A Comparative Analysis of the Caspian Countries. Energies 2024, 17, 253. [Google Scholar] [CrossRef]
- Johansen, S. Estimation and Hypothesis Testing of Cointegration Vectors in Gaussian Vector Autoregressive Models. Econometrica 1991, 59, 1551–1580. [Google Scholar] [CrossRef]
- Kao, C. Spurious regression and residual-based tests for cointegration in panel data. J. Econom. 1999, 90, 1–44. [Google Scholar] [CrossRef]
- Mazur, A.; Phutkaradze, Z.; Phutkaradze, J. Economic Growth and Environmental Quality in the European Union Countries—Is There Evidence for the Environmental Kuznets Curve? Int. J. Manag. Econ. 2015, 45, 108–126. [Google Scholar] [CrossRef]
- Dumitrescu, D.G.; Horobeț, A.; Tudor, C.D.; Belașcu, L. Renewables and Decarbonization: Implications for Energy Policy in the European Union. Amfiteatru Econ. 2023, 25, 345–361. [Google Scholar] [CrossRef]
- Laurenti, R.; Singh, J.; Frostell, B.; Sinha, R.; Binder, C. The Socio-Economic Embeddedness of the Circular Economy: An Integrative Framework. Sustainability 2018, 10, 2129. [Google Scholar] [CrossRef]
- Donia, E.; Mineo, A.M.; Sgroi, F. A methodological approach for assessing business investments in renewable resources from a circular economy perspective. Land Use Policy 2018, 76, 823–827. [Google Scholar] [CrossRef]
- Lehmann, C.; Cruz-Jesus, F.; Oliveira, T.; Damásio, B. Leveraging the circular economy: Investment and innovation as drivers. J. Clean. Prod. 2022, 360, 132146. [Google Scholar] [CrossRef]
- Lupu, I.; Hurduzeu, G.; Lupu, R.; Popescu, M.F.; Gavrilescu, C. Drivers for Renewable Energy Consumption in European Union Countries. A Panel Data Insight. Amfiteatru Econ. 2023, 25, 380–396. [Google Scholar] [CrossRef]
- Vakulchuk, R.; Overland, I.; Scholten, D. Renewable Energy and geopolitics: A review. Renew. Sustain. Energy Rev. 2020, 122, 109547. [Google Scholar] [CrossRef]
- Geyikci, U.B.; Çınar, S.; Sancak, F.M. Analysis of the Relationships among Financial Development, Economic Growth, Energy Use, and Carbon Emissions by Co-Integration with Multiple Structural Breaks. Sustainability 2022, 14, 6298. [Google Scholar] [CrossRef]
- Cudečka-Puriņa, N.; Atstāja, D.; Koval, V.; Purviņš, M.; Nesenenko, P.; Tkach, O. Achievement of Sustainable Development Goals through the Implementation of Circular Economy and Developing Regional Cooperation. Energies 2022, 15, 4072. [Google Scholar] [CrossRef]
- Geissdoerfer, M.; Savaget, P.; Bocken, N.M.P.; Jan Hultink, E. The Circular Economy—A new sustainability paradigm? J. Clean. Prod. 2017, 143, 757–768. [Google Scholar] [CrossRef]
- Rizos, V.; Tuokko, K.; Behrens, A. The Circular Economy. A Review of Definitions, Processes, and Impacts. CEPS Research Report- Centre for European Policy Studies 2017; pp. 1–40. Available online: https://circulareconomy.europa.eu/platform/sites/default/files/rr2017-08_circulareconomy_0.pdf (accessed on 2 February 2025).
- Heshmati, A. A Review of the Circular Economy and Its Implementation. Int. J. Green Econ. 2017, 11, 251–288. [Google Scholar] [CrossRef]
- Pirlogea, C.; Cicea, C. Econometric perspective of the energy consumption and economic growth relation in European Union. Renew. Sustain. Energy Rev. 2012, 16, 5718–5726. [Google Scholar] [CrossRef]
- Georgescu, I.; Kinnunen, J.; Androniceanu, A.-M. Empirical Evidence on Circular Economy and Economic Development in Europe: A Panel Approach. J. Bus. Econ. Manag. 2022, 23, 199–217. [Google Scholar] [CrossRef]
- Androniceanu, A.; Kinnunen, J.; Georgescu, I. Circular economy as a strategic option to promote sustainable economic growth and effective human development. J. Int. Stud. 2021, 14, 60–73. [Google Scholar] [CrossRef]
- Alonso-Almeida, M.d.M.; Rodríguez-Antón, J.M.; Bagur-Femenías, L.; Perramon, J. Sustainable development and circular economy: The role of institutional promotion on circular consumption and market competitiveness from a multistakeholder engagement approach. Bus. Strategy Environ. 2020, 29, 2803–2814. [Google Scholar] [CrossRef]
- Bulkeley, H. Managing Environmental and Energy Transitions in Cities: State of the Art & Emerging Perspectives. Background Paper for an OECD/EC Workshop on 7 June 2019 Within the Workshop Series “Managing Environmental and Energy Transitions for Regions and Cities”, Paris, pp. 1–44. Available online: https://www.oecd.org/cfe/regionaldevelopment/Bulkeley-2019-Managing-TransitionCities.pdf (accessed on 2 February 2025).
- Cayzer, S.; Griffiths, P.; Beghetto, V. Design of indicators for measuring product performance in the circular economy. Int. J. Sustain. Eng. 2017, 10, 289–298. [Google Scholar] [CrossRef]
- Moraga, G.; Huysveld, S.; Mathieux, F.; Blengini, G.A.; Alaerts, L.; Van Acker, K.; de Meester, S.; Dewulf, J. Circular economy indicators: What do they measure? Resour. Conserv. Recycl. 2019, 146, 452–461. [Google Scholar] [CrossRef]
- Camón Luis, E.; Celma, D. Circular Economy. A Review and Bibliometric Analysis. Sustainability 2020, 12, 6381. [Google Scholar] [CrossRef]
- Ekins, P.; Domenech, T.; Drummond, P.; Bleischwitz, R.; Hughes, N.; Lotti, L. The Circular Economy: What, Why, How and Where. Background Paper for an OECD/EC Workshop on 5 July 2019 Within the Workshop Series “Managing Environmental and Energy Transitions for Regions and Cities”, Paris, pp. 3–82. Available online: https://www.oecd.org/cfe/regionaldevelopment/Ekins-2019-Circular-Economy-What-Why-How-Where.pdf (accessed on 2 February 2025).
- Milios, L. Advancing to a Circular Economy: Three essential ingredients for a comprehensive policy mix. Sustain. Sci. 2018, 13, 861–878. [Google Scholar] [CrossRef]
- Lingaitiene, O.; Burinskiene, A. Development of Trade in Recyclable Raw Materials: Transition to a Circular Economy. Economies 2024, 12, 48. [Google Scholar] [CrossRef]
- European Environment Agency. Europe’s Material Footprint. 2023. Available online: https://www.eea.europa.eu/en/analysis/indicators/europes-material-footprint (accessed on 2 February 2025).
- European Environment Agency. European Monitoring and Evaluation Programme /European Environment Agency Air Pollutant Emission Inventory Guidebook 2023—Technical Guidance to Prepare National Emission Inventories. 2023. pp. 1–50. Available online: https://www.eea.europa.eu//publications/emep-eea-guidebook-2023 (accessed on 2 February 2025).
- Türkeli, S.; Kemp, R.; Huang, B.; Bleischwitz, R.; McDowall, W. Circular economy scientific knowledge in the European Union and China: A bibliometric, network and survey analysis (2006–2016). J. Clean. Prod. 2018, 197 Pt 1, 1244–1261. [Google Scholar] [CrossRef]
- Skare, M.; Gavurova, B.; Kovac, V. Investigation of selected key indicators of circular economy for implementation processes in sectorial dimensions. J. Innov. Knowl. 2023, 8, 100421. [Google Scholar] [CrossRef]
- de Jesus, A.; Mendonça, S. Lost in Transition? Drivers and Barriers in the Eco-innovation Road to the Circular Economy. Ecol. Econ. 2018, 145, 75–89. [Google Scholar] [CrossRef]
- Axhami, M.; Ndou, V.; Milo, V.; Scorrano, P. Creating Value via the Circular Economy: Practices in the Tourism Sector. Adm. Sci. 2023, 13, 166. [Google Scholar] [CrossRef]
- Hosseinian, A.; Ylä-Mella, J.; Pongrácz, E. Current Status of Circular Economy Research in Finland. Resources 2021, 10, 40. [Google Scholar] [CrossRef]
- Maricuț, A.C.; Grădinaru, G.I.; Matei, F.B. Waste management. The trigger of circular economy. J. Soc. Econ. Stat. 2022, 11, 84–101. [Google Scholar] [CrossRef]
- Pacurariu, R.L.; Vatca, S.D.; Lakatos, E.S.; Bacali, L.; Vlad, M. A Critical Review of EU Key Indicators for the Transition to the Circular Economy. Int. J. Environ. Res. Public Health 2021, 18, 8840. [Google Scholar] [CrossRef]
- Purcărea, T.; Ioan-Franc, V.; Ionescu, Ş.-A.; Purcărea, I.M.; Purcărea, V.L.; Purcărea, I.; Mateescu-Soare, M.C.; Platon, O.-E.; Orzan, A.-O. Major Shifts in Sustainable Consumer Behavior in Romania and Retailers’ Priorities in Agilely Adapting to It. Sustainability 2022, 14, 1627. [Google Scholar] [CrossRef]
- Nautiyal, H.; Goel, V. Sustainability assessment: Metrics and methods. In Methods in Sustainability Science. Assessment, Prioritization, Improvement, Design and Optimization; Ren, J., Ed.; Elsevier: Amsterdam, The Netherlands, 2021; pp. 27–46. [Google Scholar] [CrossRef]
- U.S. Department of Energy. Sustainable Manufacturing and the Circular Economy. 2023; pp. 1–54. Available online: https://www.energy.gov/sites/default/files/2023-03/Sustainable%20Manufacturing%20and%20Circular%20Economy%20Report_final%203.22.23_0.pdf (accessed on 2 February 2025).
- Marques, A.C.; Fuinhas, J.A.; Pires Manso, J.R. Motivations driving renewable energy in European countries: A panel data approach. Energy Policy 2010, 38, 6877–6885. [Google Scholar] [CrossRef]
- Zisopoulos, F.K.; Schraven, D.F.J.; de Jong, M. How robust is the circular economy in Europe? An ascendency analysis with Eurostat data between 2010 and 2018. Resour. Conserv. Recycl. 2022, 178, 106032. [Google Scholar] [CrossRef]
| Variable | Acronym | Definition | Measurement Unit | Data Source | Form of Variable |
|---|---|---|---|---|---|
| Consumption of recyclable materials | RECYCL | The indicator measures the annual quantity of recyclable materials that is consumed and subsequently utilised, collected, processed, and returned to the economy as raw materials or products. | Tonnes | Eurostat 1 | Dependent variable |
| Raw material footprint | RMF | The indicator shows the amount of extraction required to produce the products demanded by end users in the geographical reference area, regardless of where in the world the material was extracted from the environment. | Tonnes per capita | Eurostat 2 | Independent variable |
| Trade with recyclable materials | TRADE | This indicator measures the quantities of recyclable waste, scrap, and other secondary raw materials (by-products) transported between EU Member States (intra-EU) and across EU borders (extra-EU). | Tonnes | Eurostat 3 | Independent variable |
| Greenhouse gas emissions | GHGE | This indicator covers greenhouse gas emissions from all production activities, including the production of goods and services. | Kilograms per capita | Eurostat 4 | Independent variable |
| Investments in circular economy sectors | INV | This indicator includes “Gross investment in tangible goods” and “Value added at factor costs” in the following three sectors: the recycling sector, repair and reuse sector, and rental and leasing sector. | EUR million | Eurostat 5 | Independent variable |
| Real GDP per capita | GDP_CAP | This indicator is calculated as the ratio of the real GDP to the average population each year. | EUR per capita | Eurostat 6 | Independent variable |
| Renewable energy sources | RENEW | This indicator measures the share of renewable energy consumption in the gross final energy consumption. | Percentage | Eurostat 7 | Independent variable |
| Circular material use rate | CMR | This indicator measures the proportion of total material used that is recycled and returned to the economy, thereby avoiding the extraction of primary raw materials. | Percentage | Eurostat 8 | Independent variable |
| Population | PPL | This indicator refers to population data for each country in the European Union. | Number of people | Eurostat 9 | Independent variable |
| RECYCL | RMF | TRADE | GHGE | INV | GDP_CAP | RENEW | CMR | PPL | |
|---|---|---|---|---|---|---|---|---|---|
| Mean | 10,311.34 | 18.1767 | 1,470,049.00 | 7694.312 | 3474.531 | 26,280.04 | 21.4802 | 8.7761 | 16,481,980.00 |
| Median | 430.2355 | 16.0560 | 501,411.00 | 6836.263 | 800.00 | 20,780.00 | 18.0010 | 7.00 | 8,772,865.00 |
| Std.Dev. | 42,246.81 | 7.8072 | 1,861,019.00 | 2937.259 | 6033.555 | 17,108.94 | 11.7135 | 6.292 | 21,768,937.00 |
| Maximum | 233,320.00 | 52.5260 | 8,062,841.00 | 16,698.00 | 34,489.00 | 86,690.00 | 62.5730 | 29.00 | 83,166,711.00 |
| Minimum | 0.2512 | 7.3500 | 1118.00 | 3786.840 | 33.00 | 5390.00 | 3.4940 | 1.30 | 422,509.00 |
| Skewness | 4.84 | 1.73 | 1.52 | 1.006 | 2.84 | 1.52 | 0.95 | 1.16 | 1.79 |
| Kurtosis | 24.69 | 6.87 | 4.51 | 3.24 | 11.57 | 5.64 | 3.70 | 3.89 | 5.02 |
| Jarque–Bera (prob.) | 5714.64 (0.00) | 273.56 (0.00) | 116.99 (0.00) | 41.62 (0.00) | 1071.62 (0.00) | 164.87 (0.00) | 41.93 (0.00) | 62.70 (0.00) | 172.29 (0.00) |
| Observations | 243 | 243 | 243 | 243 | 243 | 243 | 243 | 243 | 243 |
| RECYCL | CMR | GHGE | INV | RMF | PPL | GDP_CAP | RENEW | TRADE | |
|---|---|---|---|---|---|---|---|---|---|
| RECYCL | 1.00 | ||||||||
| CMR | 0.32 * | 1.00 | |||||||
| GHGE | 0.17 * | 0.097 | 1.00 | ||||||
| INV | 0.29 * | 0.53 * | 0.10 | 1.00 | |||||
| RMF | 0.19 * | 0.26 * | 0.33 * | 0.23 | 1.00 | ||||
| PPL | 0.46 * | 0.41 * | 0.18 * | 0.86 * | 0.29 * | 1.00 | |||
| GDP_CAP | 0.002 | 0.26 * | 0.53 * | 0.20 * | 0.26 * | 0.017 | 1.00 | ||
| RENEW | 0.06 | 0.28 * | 0.22 * | 0.15 ** | 0.51 * | 0.19 * | 0.081 | 1.00 | |
| TRADE | 0.27 * | 0.62 * | 0.023 | 0.62 * | 0.43 * | 0.70 * | 0.21 * | 0.25 * | 1.00 |
| Variable | Levin, Lin, and Chu | Im, Pesaran, and Shin | ADF-Fisher | PP-Fisher | ||||
|---|---|---|---|---|---|---|---|---|
| Level | First Difference | Level | First Difference | Level | First Difference | Level | First Difference | |
| RECYCL | 1.63 | 10.33 * | 4.07 | 4.23 * | 23.41 | 115.83 * | 20.28 | 136.83 * |
| RMF | 5.56 * | 18.33 * | 1.70 | 7.92 * | 81.33 * | 175.40 * | 76.54 | 187.61 * |
| TRADE | 4.24 * | 13.22 * | 1.40 | 6.26 * | 82.22 * | 149.79 * | 105.70 * | 216.97 * |
| GHGE | 2.56 * | 11.81 * | 0.09 | 4.83 * | 56.98 | 127.44 * | 49.07 | 116.95 * |
| INV | 4.00 * | 13.88 * | 2.10 | 6.03 * | 84.26 * | 146.21 * | 125.41 * | 201.94 * |
| GDP_CAP | 4.24 * | 13.71 * | 0.30 | 6.65 * | 50.70 | 159.12 * | 39.18 | 205.02 * |
| RENEW | 3.43 | 10.11 * | 5.23 | 4.19 * | 21.60 | 117.96 * | 25.24 | 138.06 * |
| CMR | 3.57 * | 12.27 * | 0.71 | 6.43 * | 68.00 | 151.14 * | 66.80 | 154.58 * |
| PPL | 7.94 * | 5.62 * | 0.23 | 0.97 | 75.68 | 67.38 | 98.40 * | 80.98 * |
| Result | I (1) | |||||||
| Estimated Coefficients | |||
|---|---|---|---|
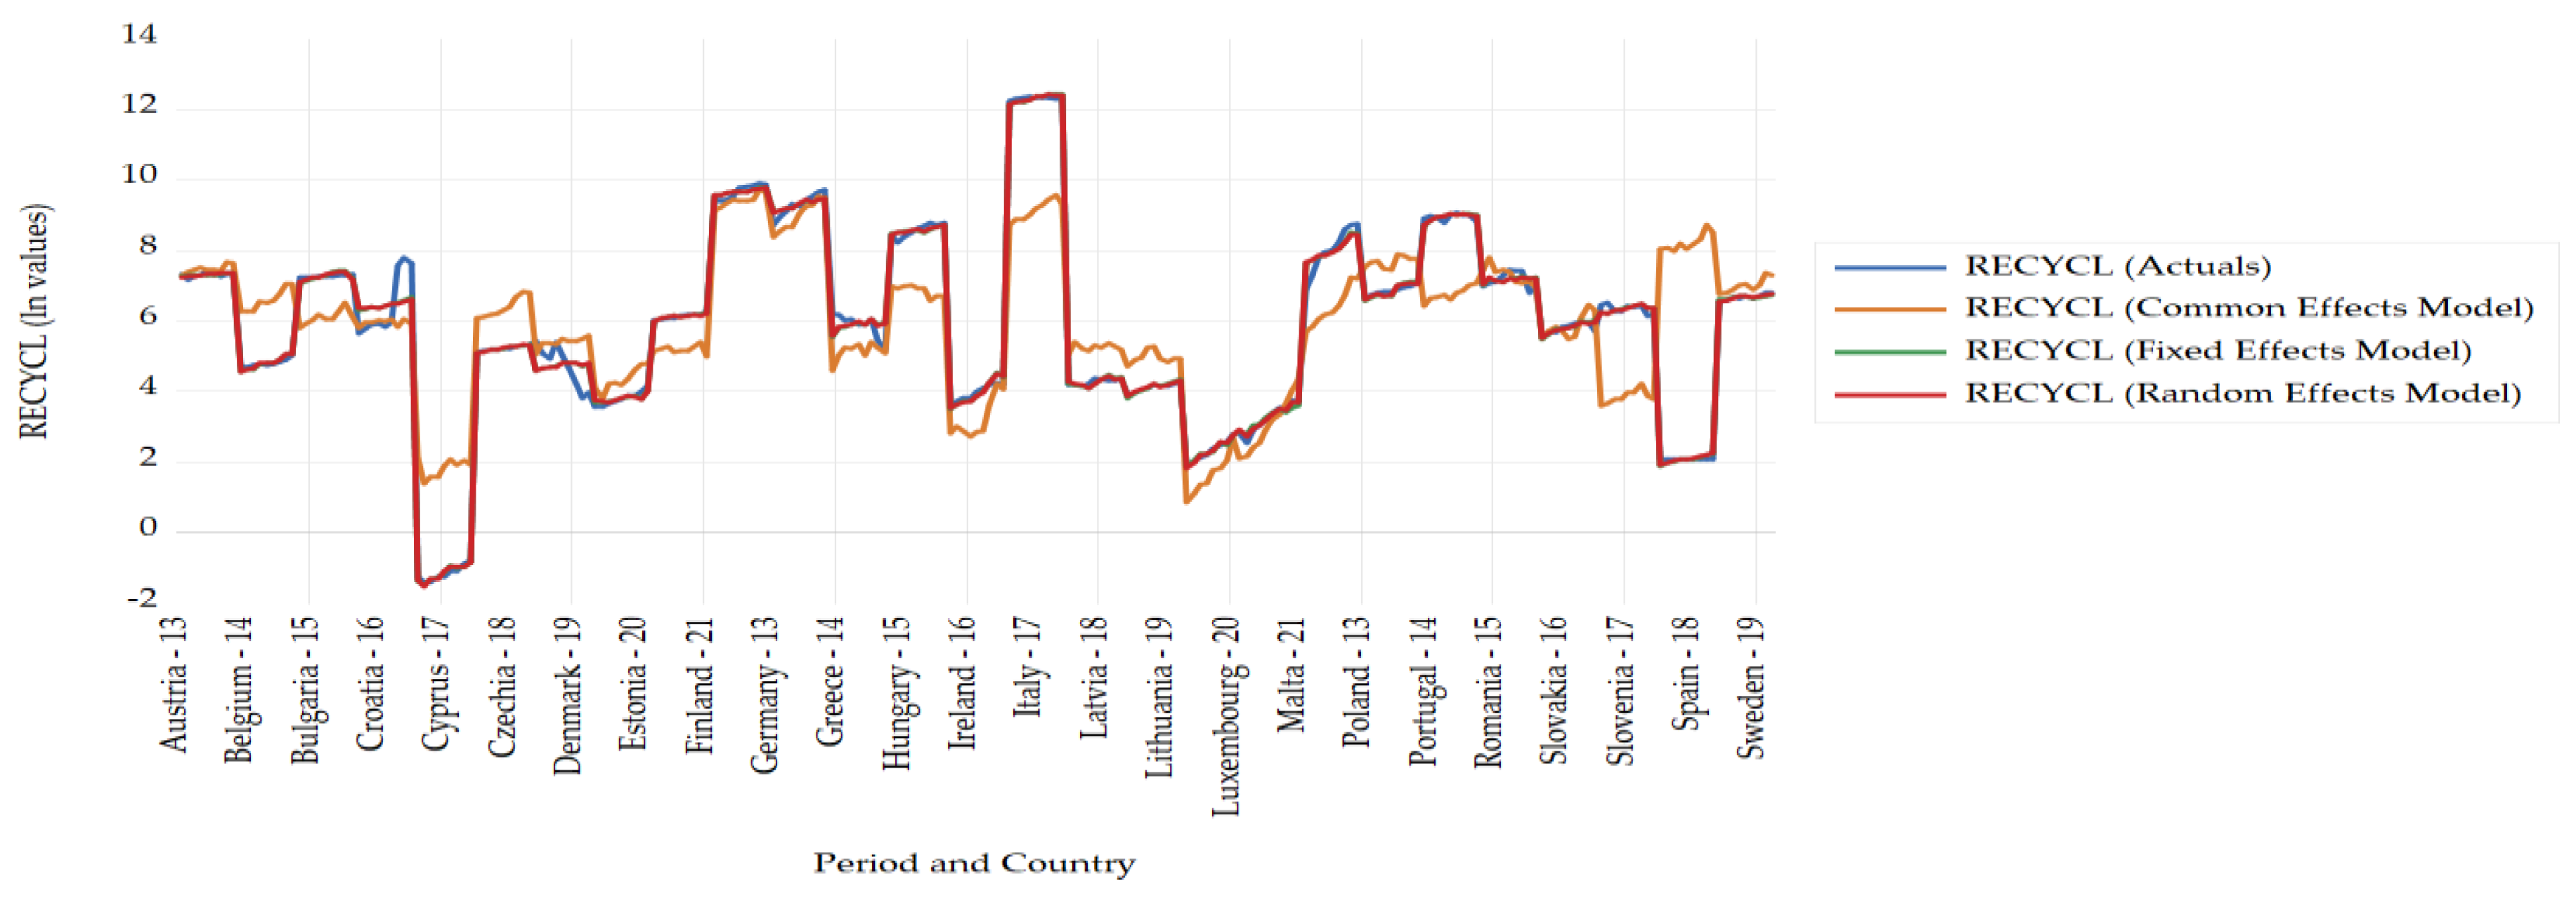
| Independent Variables | Common-Effects Model | Fixed-Effects Model | Random-Effects Model |
| b0 | 2.04 | 8.55 | 14.85 ** |
| RMF | 0.32 | 0.16 | 0.069 |
| TRADE | 0.24 ** | 0.096 | 0.12 *** |
| GHGE | 0.70 *** | 0.12 | 0.15 |
| INV | 0.59 ** | 0.21 * | 0.23 * |
| GDP_CAP | 0.70 ** | 0.32 | 0.16 |
| RENEW | 0.88 * | 0.73 * | 0.61 * |
| CMR | 0.35 *** | 0.069 | 0.048 |
| PPL | 0.87 * | 0.70 | 0.84 * |
| Diagnostic and Robustness Tests | |||
| R2 | 0.55 | 0.99 | 0.32 |
| Adj. R2 | 0.54 | 0.98 | 0.30 |
| S.E. of regression | 1.84 | 0.26 | 0.26 |
| F-statistic | 36.54 | 783.86 | 13.72 |
| F-statistic (prob.) | 0.00 | 0.00 | 0.00 |
| Forecast Evaluation Indicators | |||
| RMSE | 1.80 | 0.28 | 0.24 |
| MAE | 1.26 | 0.14 | 0.14 |
| Bias Proportion | 0.00 | 0.00 | 0.00 |
| U statistic indicator | 0.14 | 0.018 | 0.018 |
| Estimated Coefficients | |||
|---|---|---|---|
| Independent Variable | Common-Effects Model | Fixed-Effects Model | Random-Effects Model |
| b0 | 1.28 ** | 2.54 | 1.37 |
| RMF | 0.15 | 0.07 | 0.11 |
| TRADE | 0.073 | 0.080 | 0.075 |
| GHGE | 0.11 | 0.28 | 0.14 |
| INV | 0.09 *** | 0.11 *** | 0.09 *** |
| GDP_CAP | 0.59 *** | 0.39 | 0.48 |
| RENEW | 0.30 *** | 0.29 *** | 0.24 *** |
| CMR | 0.008 | 0.0029 | 0.024 |
| PPL | 0.65 | 2.98 | 1.60 |
| RECYCL (−1) | 1.00 * | 0.80 * | 0.99 * |
| RMF (−1) | 0.20 | 0.21 | 0.18 |
| TRADE (−1) | 0.065 | 0.048 | 0.063 |
| GHGE (−1) | 0.17 | 0.26 | 0.21 |
| INV (−1) | 0.081 | 0.030 | 0.069 |
| GDP_CAP (−1) | 0.63 *** | 0.42 | 0.54 *** |
| RENEW (−1) | 0.36 ** | 0.33 ** | 0.33 ** |
| CMR (−1) | 0.022 | 0.001 | 0.001 |
| PPL (−1) | 0.67 | 2.81 | 1.62 |
| Diagnostic and Robustness Tests | |||
| R2 | 0.99 | 0.99 | 0.99 |
| Adj. R2 | 0.98 | 0.98 | 0.98 |
| S.E. of regression | 0.17 | 0.16 | 0.16 |
| F-statistic | 3108.62 | 1452.61 | 1329.08 |
| F-statistic (prob.) | 0.00 | 0.00 | 0.00 |
| Forecast Evaluation Indicators | |||
| RMSE | 0.37 | 0.16 | 0.20 |
| MAE | 0.23 | 0.09 | 0.13 |
| Bias proportion | 0.0028 | 0.00014 | 0.0041 |
| U statistic indicator | 0.028 | 0.012 | 0.015 |
| Johansen Cointegration Test | |||
|---|---|---|---|
| Trace | |||
| Equation | Trace Statistic | 0.05 Critical Value | Prob. ** |
| None * | 265.98 | 197.37 | 0.0000 |
| At most 1 * | 197.88 | 159.52 | 0.0001 |
| At most 2 * | 137.31 | 125.61 | 0.0079 |
| At most 3 | 94.39 | 95.75 | 0.0618 |
| At most 4 | 55.45 | 69.81 | 0.4001 |
| At most 5 | 25.50 | 47.85 | 0,9045 |
| At most 6 | 11.63 | 29.79 | 0.9436 |
| A most 7 | 1.27 | 15.49 | 0.9997 |
| At most 8 | 0.11 | 3.84 | 0.7293 |
| Maximum Eigenvalue | |||
| Equation | Max. Eigen Statistic | 0.05 Critical Value | Prob.** |
| None * | 68.10 | 58.43 | 0.0043 |
| At most 1 * | 60.57 | 52.36 | 0.0059 |
| At most 2 | 42.91 | 46.23 | 0.1088 |
| At most 3 | 38.94 | 40.07 | 0.0668 |
| At most 4 | 29.94 | 33.87 | 0.1372 |
| At most 5 | 13.86 | 27.58 | 0.8317 |
| At most 6 | 10.86 | 21.13 | 0.7094 |
| A most 7 | 1.15 | 14.26 | 0.9996 |
| At most 8 | 0.11 | 3.84 | 0.7293 |
| Kao Residual Cointegration Test | |||
| ADF | |||
| T-Statistic | 12.044 * | ||
| Prob. | 0.0000 | ||
| Independent Variables | RMF | TRADE | GHGE | INV | GDP_CAP | RENEW | CMR | PPL |
|---|---|---|---|---|---|---|---|---|
| Estimated coefficients | −0.1647 * | 0.1587 * | 0.1895 * | 0.2492 * | 0.2343 * | 0.6835 * | −0.0370 * | −0.7785 * |
| R2 | 0.9931 | |||||||
| Adj. R2 | 0.9918 | |||||||
| Estimated Long-Run Coefficient | Value |
|---|---|
| RECYCL t−1 | 1.00 * |
| CMRt−1 | 76.95 * |
| GHGEt−1 | 2.67 * |
| INVt−1 | −2.44 * |
| RMFt−1 | 449.45 * |
| PPLt−1 | 7.53 × 10⁻⁵ * |
| GDP_CAPt−1 | −0.25 * |
| RENEWt−1 | 32.18 * |
| TRADEt−1 | −0.003 * |
| Δ (Dependent Variables) | |||||||||
|---|---|---|---|---|---|---|---|---|---|
| Δ (Independent Variables) | RECYCLt | CMRt | GHGEt | INVt | RMFt | PPLt | GDP_CAPt | RENEWt | TARDEt |
| ECTt−1 | −0.014 * | −0.003 | 0.023 * | −0.764 * | −0.0001 | −0.133 | |||
| RECYCLt−1 | −0.080 | −0.091 | 0.138 | 12.280 | −0.098 | −6.245 | |||
| RECYCLt−2 | −0.133 ** | −0.0001 | 0.086 | 0.235 ** | 0.0002 | 28.555 * | 0.306 *** | −0.0001 | 80.483 * |
| RECYCLt−3 | 0.035 | 0.015 | −0.089 | −0.0001 | −16.286 ** | −0.105 | −31.746 *** | ||
| CMRt−1 | −1.992 | 0.235 ** | 11.810 | 60.206 | −0.127 | −3557.026 | −63.540 | −0.001 | −7741.093 |
| CMRt−2 | −1.278 | −0.298 ** | −19.923 | −41.973 | 0.021 | 4734.505 | −60.119 | −0.294 *** | −925.504 |
| CMRt−3 | −29.566 | −0.048 | −44.164 | 24.413 | −0.074 | 1204.022 | −48.219 | 0.285 *** | −3416.642 |
| GHGEt−1 | −0.016 | 0.288 * | −0.021 | −0.0002 | 5.125 | −0.593 * | 0.0004 | −10.640 | |
| GHGEt−2 | 0.008 | −0.278 ** | 0.064 | 0.0001 | −2.751 | 0.071 | −0.0009 * | 36.023 | |
| GHGEt−3 | 0.027 | −0.0004 *** | −0.299 ** | −0.080 | −0.0003 | 7.579 | −0.450 *** | 0.0003 | −9.619 |
| INVt−1 | −0.074 | 0.022 | 0.104 | −0.0001 | −11.297 | 0.029 | 24.432 | ||
| INVt−2 | −0.031 | −0.023 | −0.241 * | 7.567 | 0.048 | −0.0001 | 1.561 | ||
| INVt−3 | −0.006 | −0.002 | 0.185 * | −0.0001 *** | −19.404 * | −0.134 | 0.213 | ||
| RMFt−1 | 30.901 | −0.030 | −95.359 ** | −28.337 | −0.144 | 549.265 | −16.710 | 0.096 | −2798.767 |
| RMFt−2 | 3.981 | 0.046 | −72.722 *** | 0.575 | −0.050 | −2697.182 | −106.618 | 0.030 | −6883.586 |
| RMFt−3 | 17.440 | −0.011 | 10.831 | 14.872 | −0.096 | −1676.384 | −105.46 | −0.047 | 3326.290 |
| PPLt−1 | −0.001 * | −0.0004 | 0.011 * | 0.152 ** | 0.0008 | 0.352 *** | |||
| PPLt−2 | 0.002 ** | −0.0007 | 0.0008 | 0.391 * | −0.001 | −0.776 ** | |||
| PPLt−3 | 0.001 *** | −0.0001 ** | −0.003 * | −0.035 | −0.001 | −0.257 | |||
| GDP_CAPt−1 | 0.111 ** | 0.0003 ** | −0.149 ** | 0.077 | −0.0001 | 7.286 | −0.216 *** | −10.773 | |
| GDP_CAPt−2 | −0.028 | 0.011 | −0.027 | 3.421 | 0.445 * | −21.473 | |||
| GDP_CAPt−3 | −0.064 | 0.070 | −0.045 | −0.0001 | 0.004 | 0.502 * | 53.688 * | ||
| RENEWt−1 | −35.924 | −0.067 | 5.746 | −69.565 | 0.018 | 1165.866 | 76.147 | −0.168 | 1263.726 |
| RENEWt−2 | −12.890 | 0.020 | −66.945 | −52.302 | −0.176 | −5866.790 | −36.150 | 0.035 | 16391.08 |
| RENEWt−3 | 37.814 | −0.128 | −53.716 | −21.994 | 0.152 | 6180.600 | 15.133 | −0.148 | −8655.599 |
| TRADEt−1 | −0.0002 | *** | 0.0006 *** | −0.028 | −0.0008 | −0.451 * | |||
| TRADEt−2 | −0.001 | *** | −0.0001 | 0.0007 *** | −0.041 | −0.0006 | 0.072 | ||
| TRADEt−3 | −0.0003 | 0.0001 | 0.0002 | 0.051 *** | 0.0004 | −0.234 * | |||
| Dependent Variable | RECYCL | CMR | GHGE | INV | RMF | PPL | GDP_CAP | RENEW | TRADE |
|---|---|---|---|---|---|---|---|---|---|
| R2 | 0.71 | 0.22 | 0.31 | 0.76 | 0.17 | 0.74 | 0.42 | 0.23 | 0.57 |
| Adj. R2 | 0.64 | 0.01 | 0.13 | 0.70 | −0.044 | 0.67 | 0.27 | 0.03 | 0.45 |
| S.E. | 467.21 | 1.24 | 607.31 | 804.02 | 1.55 | 65,071.60 | 1216.96 | 1.69 | 152,241.00 |
| F-Statistic | 9.44 * | 1.07 | 1.72 * | 12.21 * | 0.79 | 10.51 * | 2.69 * | 1.15 | 4.95 * |
| DW stat | 1.61 | 1.84 | 2.13 | 1.59 | 1.94 | 2.17 | 2.37 | 2.15 | 2.14 |
| LM test | 1.24 (0.21) | 10.28 (0.00) | 1.58 (0.11) | 3.60 (0.063) | 7.36 (0.00) | 3.76 (0.00) | 28.26 (0.071) | 10.39 (0.00) | 0.32 (0.74) |
| Null Hypothesis (H0) → Variable on the Column Does Not Cause Variable on the Line. | |||||||||
|---|---|---|---|---|---|---|---|---|---|
| Variable | RECYCL | CMR | GHGE | INV | RMF | PPL | GDP_CAP | RENEW | TRADE |
| RECYCL | - | 0.40 | 0.51 | 4.39 * | 0.20 | 11.20 * | 0.70 | 0.30 | 2.73 ** |
| CMR | 1.51 | - | 0.97 | 0.06 | 1.37 | 0.08 | 1.78 | 1.001 | 0.01 |
| GHGE | 0.06 | 0.86 | - | 0.29 | 1.01 | 0.41 | 2.30 *** | 2.77 ** | 0.73 |
| INV | 8.00 * | 0.59 | 0.82 | - | 0.83 | 0.79 | 1.42 | 0.40 | 3.42 ** |
| RMF | 0.38 | 2.41 *** | 5.18 * | 0.33 | - | 0.07 | 0.69 | 0.95 | 1.08 |
| PPL | 30.88 * | 0.99 | 0.49 | 36.65 * | 0.67 | - | 1.14 | 0.85 | 3.73 * |
| GDP_CAP | 0.33 | 6.04 * | 0.06 | 0.18 | 3.90 * | 1.14 | - | 1.99 *** | 0.12 |
| RENEW | 0.84 | 1.90 *** | 2.15 *** | 0.36 | 2.43 *** | 0.11 | 2.54 ** | - | 0.80 |
| TRADE | 2.43 *** | 0.87 | 0.28 | 2.37 *** | 0.45 | 0.96 | 0.72 | 0.16 | - |
Disclaimer/Publisher’s Note: The statements, opinions and data contained in all publications are solely those of the individual author(s) and contributor(s) and not of MDPI and/or the editor(s). MDPI and/or the editor(s) disclaim responsibility for any injury to people or property resulting from any ideas, methods, instructions or products referred to in the content. |
© 2025 by the authors. Licensee MDPI, Basel, Switzerland. This article is an open access article distributed under the terms and conditions of the Creative Commons Attribution (CC BY) license (https://creativecommons.org/licenses/by/4.0/).
Share and Cite
Bodislav, D.A.; Moraru, L.C.; Georgescu, R.I.; Grigore, G.E.; Vlăduț, O.; Staicu, G.I.; Chenic, A.Ș. Recyclable Consumption and Its Implications for Sustainable Development in the EU. Sustainability 2025, 17, 3110. https://doi.org/10.3390/su17073110
Bodislav DA, Moraru LC, Georgescu RI, Grigore GE, Vlăduț O, Staicu GI, Chenic AȘ. Recyclable Consumption and Its Implications for Sustainable Development in the EU. Sustainability. 2025; 17(7):3110. https://doi.org/10.3390/su17073110
Chicago/Turabian StyleBodislav, Dumitru Alexandru, Liviu Cătălin Moraru, Raluca Iuliana Georgescu, George Eduard Grigore, Oana Vlăduț, Gabriel Ilie Staicu, and Alina Ștefania Chenic. 2025. "Recyclable Consumption and Its Implications for Sustainable Development in the EU" Sustainability 17, no. 7: 3110. https://doi.org/10.3390/su17073110
APA StyleBodislav, D. A., Moraru, L. C., Georgescu, R. I., Grigore, G. E., Vlăduț, O., Staicu, G. I., & Chenic, A. Ș. (2025). Recyclable Consumption and Its Implications for Sustainable Development in the EU. Sustainability, 17(7), 3110. https://doi.org/10.3390/su17073110