Article

Physical and Chemical Properties Evaluation of Liquid Organic Fertilizers (LOFs) and Their Effects on Promoting Rice Growth

1
Department of Microbiology, Faculty of Science, Khon Kaen University, Khon Kaen 40002, Thailand
2
Department of Agronomy, Faculty of Agriculture, Khon Kaen University, Khon Kaen 40002, Thailand
3
Salt-Tolerant Rice Research Group, Department of Biology, Faculty of Science, Khon Kaen University, Khon Kaen 40002, Thailand
*
Author to whom correspondence should be addressed.
Sustainability 2025, 17(7), 3087; https://doi.org/10.3390/su17073087
Submission received: 3 March 2025 / Revised: 27 March 2025 / Accepted: 28 March 2025 / Published: 31 March 2025
(This article belongs to the Section Sustainable Agriculture)

Abstract

:
With growing importance in sustainable agriculture and environmental protection, the use of liquid organic fertilizers (LOFs) as a replacement for or supplement to chemical fertilizers has grown in popularity. The effectiveness of LOFs depends on the content of elemental nutrients as well as plant growth regulators. Three types of materials, i.e., brassica vegetables, mushrooms, and soybeans, were fermented for 60 days to produce LOFs. The soybean-based fertilizer (SOF) contained the highest concentrations of mineral nutrients (0.99% N, 0.11% P), organic carbon (6.75%), and IAA (24 µg/mL), followed by the mushroom-based fertilizer (MOF) and brassica-based fertilizer (BOF). During fermentation, polyamines (PAs) in LOFs dramatically increased with time, with MOF and SOF containing higher concentrations of PAs than BOF. Greenhouse-grown rice (Oryza sativa L.) plants at 21 d old were sprayed with diluted (1:75) solutions of LOFs or chemical fertilizers (CF) before being treated for 7 and 14 days with 100 mM NaCl. For both non-stress and salt-stress groups, the root and shoot dry weights, chlorophyll contents, net photosynthesis rates, and endogenous PAs of the LOF- and CF-treated plants were significantly higher than those of the plants receiving no fertilizers. The SOF was the most effective and enhanced growth and photosynthesis at a similar level as the chemical fertilizer and had good potential to be employed as an eco-friendly substitute for chemical fertilizer.

1. Introduction

Intensive use of chemical fertilizers over the past decades has led to significant soil deterioration and worsening environmental pollution. Reducing chemicals while increasing the use of organic fertilizers can benefit soil health, crop productivity, and environmental sustainability [1]. The application of organic fertilizers improves the soil organic matter, soil structure and water holding capacity, cation exchange capacity (CEC), nutrient availability, soil fauna community, and microbial activities, resulting in a significant increase in crop productivity [2]. Climate change and rising temperatures have brought about a variety of problematic soils, including increasing areas of salt-affected soils. The use of organic fertilizers has been reported to restore fertility to saline soils by increasing the CEC and macronutrient availability of the soils, improving water-holding capacity, and stimulating microbial biomass and activity [3,4]. Various forms of organic fertilizers not only improved the physical properties of saline soils but also increased rice yield, yield components, and grain mineral contents [5,6].
Liquid organic fertilizers (LOFs), one of the common types of organic fertilizers, are widely used for sustainable farming to increase yield and protect the environment. It is effective and suitable for use in many ways, such as pouring, spraying, drip irrigation, and hydroponics. LOF is produced from agricultural residues or industrial wastes through fermentation [7]. LOF contains a considerable amount of macro- and micro-nutrients in soluble forms that plants easily absorb. Furthermore, LOF is a good source of amino acids, plant hormones, and other substances [8]. LOFs produced from distillery slop and sugarcane leaves have been reported to enhance the growth and chlorophyll synthesis of Green Cos Lettuce (Lactuca sativa var. longifolia) [7]. LOFs produced from maize residues and fecal sheep manure promoted biomass, nutrient uptake, and carbohydrate content in citrus plants [9]. LOFs also enhance plant tolerance to abiotic stress [10]. LOFs can be produced by farmers or companies using various materials, and their quality must be evaluated before use. Evaluation of the quality of LOFs is based on pH, electrical conductivity, and nutrient composition [11,12]. The phytotoxicity test of LOFs is also an important quality indicator to make sure that there is no presence of some toxic compounds that can pose a negative impact on plant growth [13]. Furthermore, an evaluation of the content of plant growth regulators (PGRs) and beneficial microorganisms gives a more precise prediction about their effects on plants and soils [7].
The presence of plant growth-regulating substances in LOFs gives extra benefits that distinguish LOFs from other forms of organic fertilizers and chemical fertilizers. Auxin, gibberellins, and cytokinins are the main phytohormones commonly detected in LOFs and are most widely reported to enhance plant growth. These classical microbial phytohormones were widely reported to exhibit multifaceted regulatory roles in plant growth and development from seed germination to reproduction, flowering, fruit/seed development, and delayed senescence [14]. In contrast, polyamines (PAs), a group of plant growth-promoting regulators, have rarely been reported to be present in LOFs. PAs are organic compounds containing more than two amino groups that are widely present in almost all living organisms. Putrescine (Put), spermidine (Spd), and spermine (Spm) are major PAs in higher plants that regulate different aspects of plant growth, development, and tolerance to abiotic stresses, including salinity, drought, chilling, heat, and heavy metals, among others [15]. PAs are emerging as new plant growth regulators that effectively promote salt stress tolerance in plants [16]. Application of exogenous PAs enhanced salt tolerance by regulating ion channels, leading to inhibition of uptake and transport of the toxic Na+ while maintaining K+ absorption [17], increasing antioxidant capacity by activating reactive oxygen species scavenging enzymes [18] or directly quenching free radical molecules [19] and mitigating photosynthesis inhibition through thylakoid membrane stabilization and promoting chlorophyll biosynthesis [20]. As mentioned above, PAs have been shown to possess beneficial roles for plant growth and stress tolerance, but the information about these compounds in LOFs is still lacking.
In this study, we produced LOFs through fermentation of plant materials and mushrooms, which were documented to be rich in PA content. Chemical characteristics and phytotoxicity of the LOFs were investigated for their suitability and safety as an organic fertilizer. The presence of phytohormones, including IAA, GA, and PAs, as well as nutrient composition, was evaluated to provide information regarding the beneficial functions of LOFs on plant growth. Finally, the beneficial roles of LOFs in alleviating salt-stress effects on rice plants were investigated. The findings from this study are expected to highlight a potential use of LOFs as both eco-friendly nutrient sources and bio-remedy for plants exposed to salt stress conditions and provide an alternative way to make use of agricultural wastes.

2. Materials and Methods

2.1. Production of Liquid Organic Fertilizers (LOFs)

Three types of biological samples rich in polyamines [21] viz. brassica vegetables, mushrooms, and soybean seeds, were used as starting materials for the production of LOF. The vegetables used were (1) cauliflower (Brassica oleracea var. botytris L.), broccoli (B. oleracea var. italica L.), and (2) mushrooms, including Pleurotus sajor-caju, P. ostreatus, and Lentinus edodes (Berk.) Sing. The fresh plant materials and mushrooms were purchased at a local market. For soybeans, dried seeds were soaked in water for at least 6 h before use. The fresh materials were chopped into approximately 1–2.5 mm sized pieces. Each group of fresh starting materials was then analyzed for pH, electrical conductivity (EC), nutrient composition, and PA contents. The well-chopped plant materials (3 kg) were mixed with 1 kg of molasses, 1 L of distilled water, and 3 g of microbial inoculants. The microbial inoculants (namely Bodor 2, provided by the Department of Land Development, Ministry of Agriculture and Co-operatives, Thailand), which are specialized for fermenting LOF, were used to make the fermentation faster. Three replications were conducted for each LOF. All containers were placed in a shady area to avoid direct sunlight for 60 days. During the fermentation period, the samples were stirred every week. Sampling was taken on days 0, 15, 30, 45, and 60 to monitor the changes in pH, EC, total microorganism, and PA contents. On day 60 of fermentation, the liquid extraction was separated by filtration and kept at 4 °C. The finished LOFs, namely brassica-based LOF (BOF), mushroom-based LOF (MOF), and soybean-based LOF (SOF), were analyzed for nutrient compositions, plant growth promoting bacteria (PGPB), plant hormones (indole acetic acid (IAA) and gibberellic acid (GA)), polyamines (PAs), and phytotoxicity.

2.2. Analysis of Chemical Parameters

The changes in pH and EC were, respectively, measured using a pH meter (Starter 2100, Ohaus, Shanghai, China) and an EC meter (Five Easy FE30-1, Mettler-Toledo, Colombus, OH, USA). Total N was analyzed using the Kjeldahl method. For total P and K, the samples were treated with wet oxidation and then assayed using a spectrophotometer (U-5100, Hitachi Hi-Tech, Tokyo, Japan) and atomic absorption spectrometer (Model GBC 932 AAA, Cambridge, UK), respectively. Organic matter (OM) and organic carbon (OC) were analyzed using the method from [22].

2.3. Determination of Microbial Parameters

The total microorganisms were recorded during fermentation at days 0, 15, 30, 45, and 60 by spreading plate technique on nutrient agar. At the end of fermentation, the number of plant growth-promoting bacteria (PGPB) was counted on selective agar for nitrogen-fixing bacteria (NFB) (Ashby’s medium), phosphorus solubilizing bacteria (PSB; NBRIP Agar), and potassium solubilizing bacteria (KBS; Aleksandrov medium). Meanwhile, pathogen populations (E. coli and Salmonella) were tested on MacConkey medium and Xylose Lysine Deoxycholate agar, respectively, using the spreading plate technique.

2.4. Determination of Plant Hormones

Detection of indoleacetic acid (IAA) was conducted using the method from [23] with slight modification. Three milliliters of LOF (diluted 20 times with distilled water) was placed in a fifty-milliliter Erlenmeyer flask, mixed with six milliliters of phosphate buffer (0.2 M, pH 7.0) and four milliliters of an L-tryptophan (5.3 g/kg LOF). All flasks were incubated (in dark condition) on a shaker set at 150 rpm, 40 °C for 48 h. After incubation, the flasks were treated with 2 mL of 5% tri-chloroacetic acid and 1 mL of calcium chloride (0.5 M). The treated solutions were filtered through Whatman filter paper No.2. Three milliliters of the filtrate was placed in a glass tube, and two milliliters of the Salkowski reagent was added. All test tubes were placed in the dark for 30 min. The red color of the reacted product was measured using a spectrophotometer at 535 nm, and then IAA concentration (µg/mL) was estimated from an IAA standard curve.
For gibberellic acid (GA), a slightly modified protocol from [24] was followed. The LOF was centrifuged at 5000 rpm for 10 min. Later, 15 mL of supernatant was transferred to a 50 mL Erlenmeyer flask, then added with 2 mL of zinc acetate solution (21.9 g zinc acetate mixed with 1 mL of glacial acetic acid in a total volume of 100 mL by addition of distilled water). After 2 min, 2 mL of 10.6% potassium ferrocyanide (in distilled water) was added and centrifuged at 2000 rpm for 15 min. The supernatant was mixed with 30% HCl (1:1, v/v ratio) and incubated at 20 °C for 75 min. For the blank, a solution of 5% HCl was used. Absorbance was recorded using a spectrophotometer (U-5100, Hitachi Hi-Tech, Tokyo, Japan) at 254 nm. The concentration of GA was calculated using the standard curve of GA standard (100–1000 µg/mL).

2.5. Analysis of Polyamine (PA) Content

For PA contents, the procedure from [25] was followed. All samples were kept at −20 °C before analysis. For the vegetables, mushrooms, and soybean materials, the samples were homogenized in liquid nitrogen into powder. One gram of tissue powder or one milliliter of LOF was extracted in 10 mL 5% per chloric acid (HClO4) in an ice bath for 30 min. Then, all samples were centrifuged at 4 °C, 12,000 rpm for 15 min. A 100 µL aliquot of each extraction was placed in a 1.5 mL vial containing 100 µL of sodium carbonate solution (0.22 g/mL). A 100 µL volume of dansyl chloride solution (10 mg/mL in acetone) was added to the vials. All vials were incubated in the dark at 60 °C for 1 h. An amount of 100 µL of proline solution (100 mg/mL) was added to the mixture to remove the excess dansyl chloride and then incubated for 30 min. All vials were opened for 2 min (for evaporation of acetone). The dansylated polyamines were extracted by adding 500 µL of toluene and vigorously vortexed for 30 s. Next, centrifugation was performed at 5000 rpm for 2 min to separate the mixture into 2 phases. The amount of 400 µL toluene extraction was transferred to a new vial. All unclosed vials were dried at 60 °C overnight. The polyamine residue was dissolved in 1 mL of acetonitrile. Finally, a 500 µL volume of extraction was filtered through a 0.45 µm pore size syringe filter, and 10–20 µL was injected into an HPLC system (Shimadzu LC-20 System, Kyoto, Japan). Three PA standards (Put, Spd, and Spm) were prepared as stock solutions at the concentration of 20 mM in 0.01 N HCl. From stock solutions, gradient concentrations from 0.01 to 0.1 mM of each standard were made in 0.01 N HCl. These gradient standards were dansylated as described above. The correlation between concentration and peak area was calculated to draw the standard curve. The polyamine contents were determined by the HPLC system using gradient solvent (v/v) of acetonitrile/water at a flow rate of 1 mL min−1. Initially, the mixture of 70% acetonitrile and 30% water was pumped for 4 min. Next, the concentration of acetonitrile was increased to 100% and kept constant for 4 min. Lastly, the concentration of acetonitrile was returned to its initial condition at 70% for 5 min. The separation of PAs was finished in 15 min. The column used was Intensil ODS-3 (C18, 0.5 µm particle diameter, 4.6 × 250 mm). Dansylated polyamines were detected by fluorescence spectrophotometer with excitation and emission wavelengths of 340 and 510 nm, respectively. The concentration of polyamine in each sample was converted using a standard curve.

2.6. Evaluation of Phytotoxicity of LOF

Phytotoxicity was determined through the germination index (GI) and vigor index (VI) of three tested plants, namely, tomato (Solanum lycopersicum), rice (Oryza sativa L.), and pakchoi (Brassica rapa subsp. chinensis) following the procedure from [26]. The LOF solutions were diluted with sterile water at three different ratios (v/v), increasing in dilution from 1:10, 1:50, to 1:100. The seeds were surface sterilized by soaking in 6% Clorox for 5–10 min and rinsed 3 times by autoclaved distilled water. The seeds were immersed in sterilized distilled water or diluted LOF solutions. One hour later, ten seeds were selected to place on a sterilized petri dish containing 2 layers of filter paper. Next, a 5 mL volume of each soaking solution was added to each plate. Then, all petri plates were incubated in the dark for 7 d. Sterilized water was added every 2 days to maintain moisture. On day 7, germination percentage, root length, and shoot length were measured to calculate GI and VI from the following equations:
GI = (GR × RGI)/100
When:
G R % = N u m b e r   o f   s e e d s   g e r m i n a t e d   i n   L O F   s o l u t i o n N u m b e r   o f   s e e d s   g e r m i n a t e d   i n   d i s t i l l e d   w a t e r × 100
R G I % = M e a n   r o o t   l e n g t h   i n   L O F   s o l u t i o n M e a n   r o o t   l e n g t h   i n   d i s t i l l e d   w a t e r × 100
VI = germination percentage × seedling length

2.7. Effects of LOF on Growth and Physiology of Rice Seedlings

Seeds of an aromatic rice cultivar Khao Dawk MaLi 105 (KDML 105) were kindly provided by Khon Kaen Rice Research Center, Khon Kaen, Thailand. To sterilize the seed’s surface, the seeds were soaked for 5 min in 6% sodium hypochlorite (v/v). Then, they were rinsed in sterile water three times and incubated in the dark at 30 °C for 48h before being sown in a seedling tray. The uniformed 14-day-old seedlings were transplanted into black plastic pots containing 3.5 kg of paddy soil. Tap water was added daily and maintained at a level of 5 cm above the soil surface. One week later, when seedlings adapted well in the pots, different fertilizers were applied. The five treatments included CK: control (no fertilizer); BOF; MOF; SOF; and CF (chemical fertilizer containing N:P:K at 16:16:16). Five pots were set up for each treatment, with five plants in each pot, and three plants were randomly selected for growth and physiological measurements. The LOF was prepared by diluting it with water at the ratio of 1:75 (v/v), while the NPK fertilizer was dissolved in water (5g/L). Each pot was sprayed with 50 mL of prepared LOF or chemical fertilizer twice per day (in the early morning and after 5.30 pm) for seven days. For the control treatment, distilled water was used instead. At 30 d old, to create salt stress conditions, seedling pots were divided into two groups, control and salt-treated, with five fertilizer treatments for each group. For the salt-treated pots, the flooded water was drained and replaced with 100 mM NaCl solution, while the control pots were replaced with fresh tap water. Salinity exposure was maintained for 14 days. On days 7 and 14, after adding NaCl (DAT), leaf gas exchange was measured, and leaf tissues were sampled and stored at −20 °C for analysis of chlorophyll and proline.
For an estimation of chlorophyll, each 0.1 g leaf sample was extracted in 80% acetone, and the absorbance was measured at 663 and 645 nm in the spectrophotometer (U-5100, Hitachi Hi-Tech, Tokyo, Japan). Chlorophyll content (mg/g FW) was calculated based on the formulas below [27]:
Chlorophyll a = (12.7 A663 − 2.69 A645) × (V/1000 W)
Chlorophyll b = (22.9 A645 − 4.68 A663) × (V/1000 W)
Total chlorophyll = (20.2 A645 + 8.02 A663) × (V/1000 W)
where V = volume of acetone (mL), and W = weight of leaf tissue (g).
For the analysis of proline content, 0.1 g of leaf sample was ground in liquid nitrogen, and free proline was extracted with 3% (w/v) sulfosalicylic acid. After centrifugation, the supernatant was treated following the protocol of Bates et al. [28]. L-proline was used to construct a standard curve. The amount of proline was expressed in μmol/g FW.
All photosynthetic traits were measured from 9.00 to 11.30 on the middle of the third leaf from the top of plants using a LI-6400xt portable photosynthesis system (Li-cor Inc, Lincoln, NE, USA). Gas exchange parameters, including net photosynthesis rate (Pn), stomatal conductance (Gs), and transpiration rate (Tr), were recorded under the conditions of the photosynthetic photon flux density at 1200 µmol m−2 s−1 and the CO2 concentration at 400 µmol mol−1. Water-use efficiency (WUE) was calculated from the ratio Pn/Tr.
For polyamine analysis, fresh leaf (collected at 7 DAT and 14 DAT) was homogenized in liquid nitrogen and stored at −20 °C before extraction. Polyamines were extracted and analyzed as described in Section 2.5.
On 14 DAT, rice plants were uprooted, and the underground and aboveground parts were separated, washed, and dried in a hot air oven at 70 °C for 3–4 days until the dry weight stabilized. The dried root weight (DRW) and dried shoot weight (DSW) were recorded.

2.8. Statistical Analysis

Data obtained in this study were analyzed using one-way analysis of variance (ANOVA). The mean values were compared based on the least significant difference (LSD) test at the p value lower than 0.05 level. Data sorting and figure preparation were performed using Microsoft Excel 2010, and Statistix 8.0 was used for statistical analysis.

3. Results

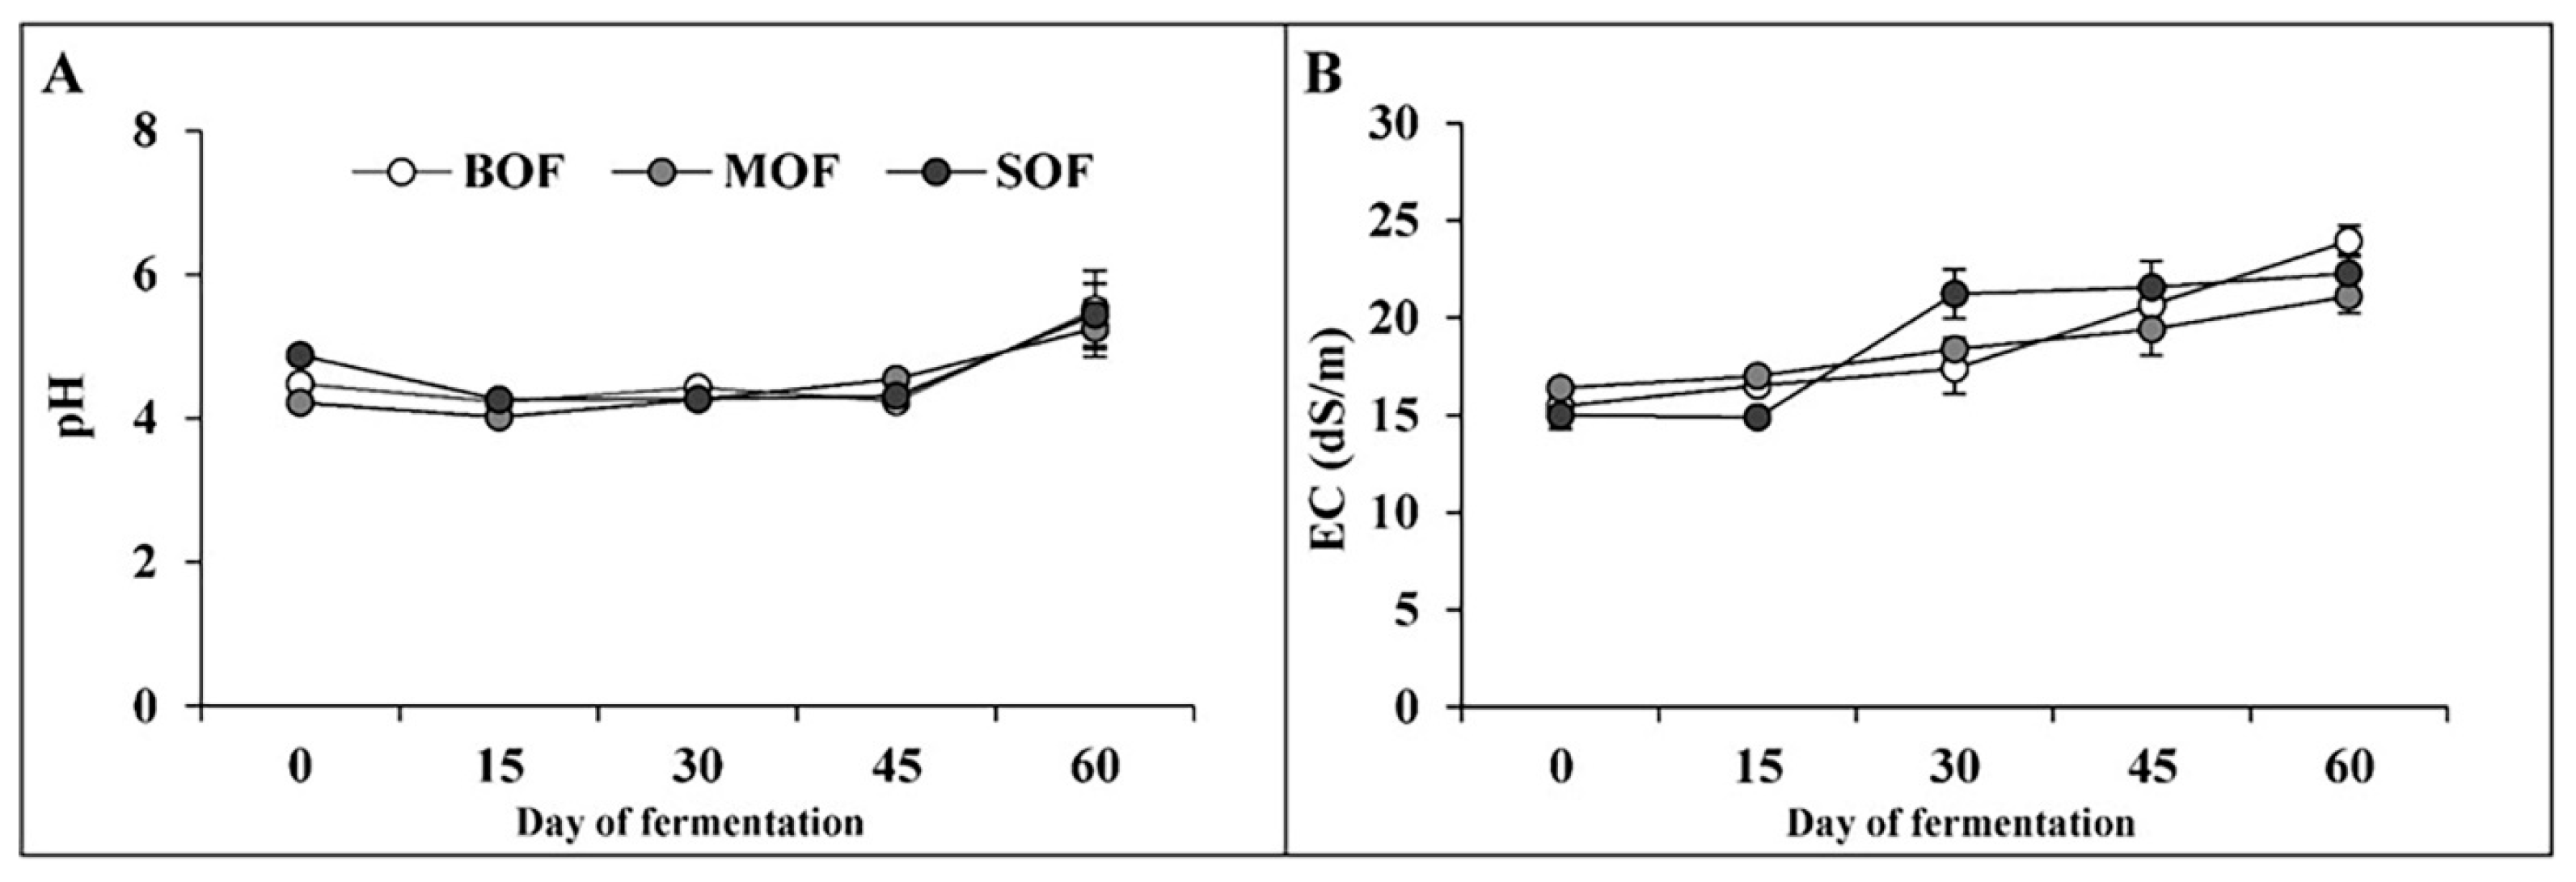
3.1. Physicochemical Parameters of Liquid Organic Fertilizers (LOFs)

All fresh materials had neutral pH1:5 (6.4–6.8) and low EC (1.4–1.8 dS/m). The changes in pH and EC of the three LOFs during fermentation were introduced in Figure 1. At the beginning of the fermentation process, the pH of all LOFs was about 4.2–4.8, then slightly decreased to 4.0–4.2 on day 15. These pH values mildly fluctuated around these values for the next 30 days, then increased and maintained between 5.2 and 5.5 on day 60. The EC of LOFs gradually increased with time. At the beginning, the EC values of LOFs were about 15 to 16 dS/m, then steadily rose during fermentation time and finally reached 21–24 dS/m on day 60.
The information about the nutrient compositions of the fresh starting materials is shown in Table 1. The total N and organic matter (OM) among them were not much different, while the amount of total P and K highly differed (p < 0.01). Among the three starting materials, soybeans had the highest amount of total N (0.65%), followed by that of mushrooms (0.56%) and brassica (0.41%). Fresh mushrooms had the highest amount of total P (0.1%), which was significantly higher than those in brassica (0.07%) and soybean (0.05%). The raw materials of brassica contained the highest amount of total K (0.51%), followed by mushrooms (0.46%) and soybeans (0.23%). The highest amounts of OM and OC were found in the raw material of soybean (88.02% and 50.89%, respectively). Brassica and mushrooms had similar amounts of OM (78.13 and 76.47%, respectively) and OC (45.24 and 44.39%, respectively).
After 60 days of fermentation, all liquid extraction of LOFs was analyzed for macronutrients and OM (Table 1). All three LOFs were rich in N, P, and K. The amount of N in SOF (0.99%) was more than twice that in MOF (0.44%) and more than three times that in BOF (0.32%). The amount of P in SOF (0.11%) and MOF (0.1%) was similar and about double the amount of P in BOF (0.06%). A high concentration of K was found in all three LOFs (ranging from 1.2 to 1.34%). The total Na of the three LOFs was in the range of 182 to 236 mg/L. Contents of OM and OC in SOF were 11.62% and 6.75%, respectively, which were higher than those in MOF (9.39% and 5.48%) and in BOF (6.94% and 4.06%). The ANOVA tables showing the level of significant differences in pH and EC, and nutrient composition among the three LOFs are shown in Supplementary Tables S1 and S2, respectively.

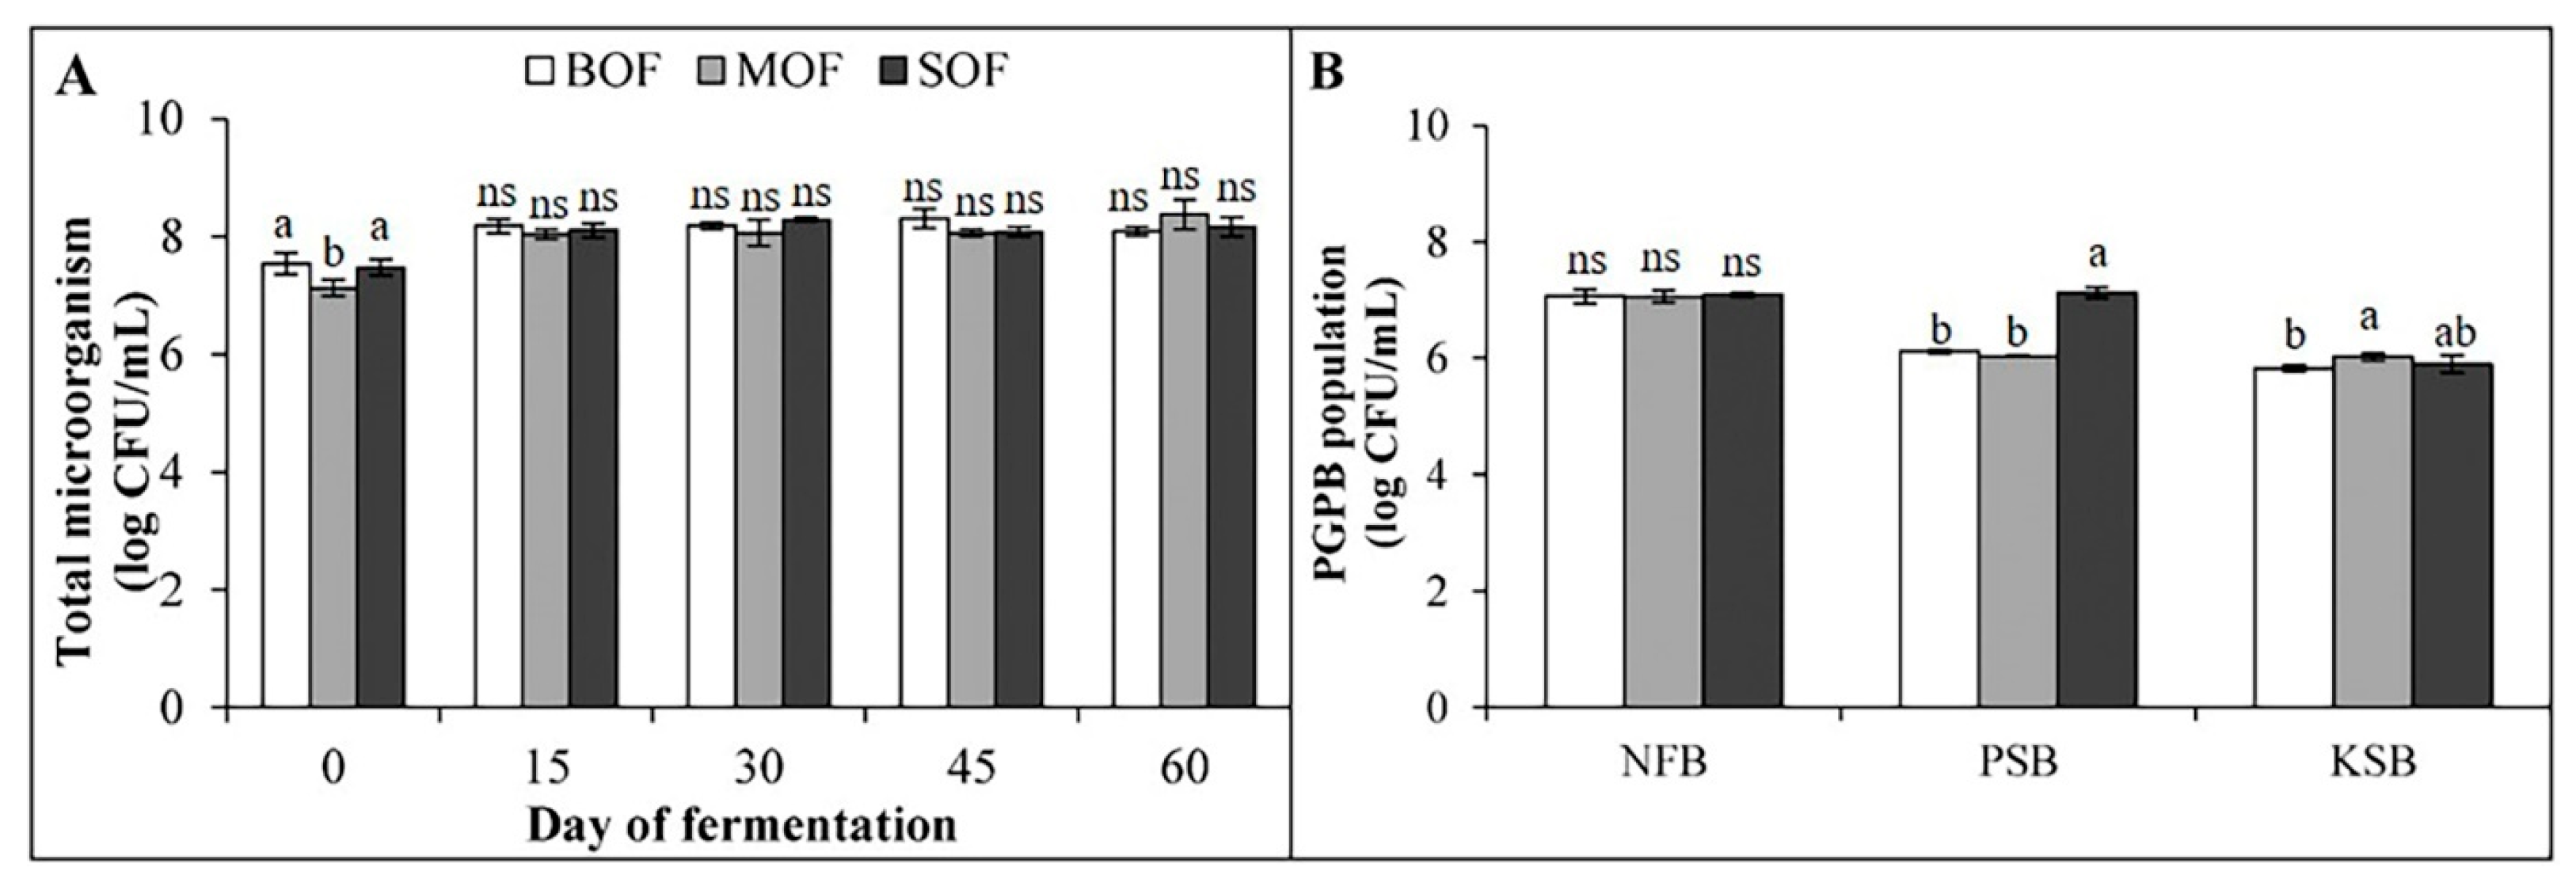
3.2. Change in Microbial Population Parameters in LOFs During Fermentation

The total microorganism (TM) in liquid extraction during the fermentation process is shown in Figure 2A. In the beginning, the total microorganisms in the three LOFs ranged from 7.1 to 7.5 log CFU/mL. On day 15, the population of TM in all LOFs grew to more than 8 log CFU/mL, in which BOF and MOF reached the highest population (8.6 and 8.1 log CFU/mL, respectively). On day 30, the TM in SOF reached the highest population. Afterward, these bacterial densities decreased in BOF and SOF or unchanged for MOF on day 45. The TM was then stabilized until day 60. At the final stage, the populations of TM in BOF, MOF, and SOF were 8.7, 8.1, and 8.2 log CFU/mL, respectively.
The final LOFs also contained a considerably dense population of PGPB (Figure 2B). The populations of NFB in BOF, MOF, and SOF were similar (approximately 7 log CFU/mL). Meanwhile, the density of PSB in SOF (7.1 log CFU/mL) was significantly higher than those in MOF (6.0 log CFU/mL) and BOF (6.1 log CFU/mL). The population of KSB found in each LOF was approximately 5.8–6.0 log CFU/mL. There was no detection of E. coli and Salmonella in the final products of these organic fertilizers. The ANOVA table showing the level of significant differences in TM and PGPB among the three LOFs is shown in Supplementary Table S3.

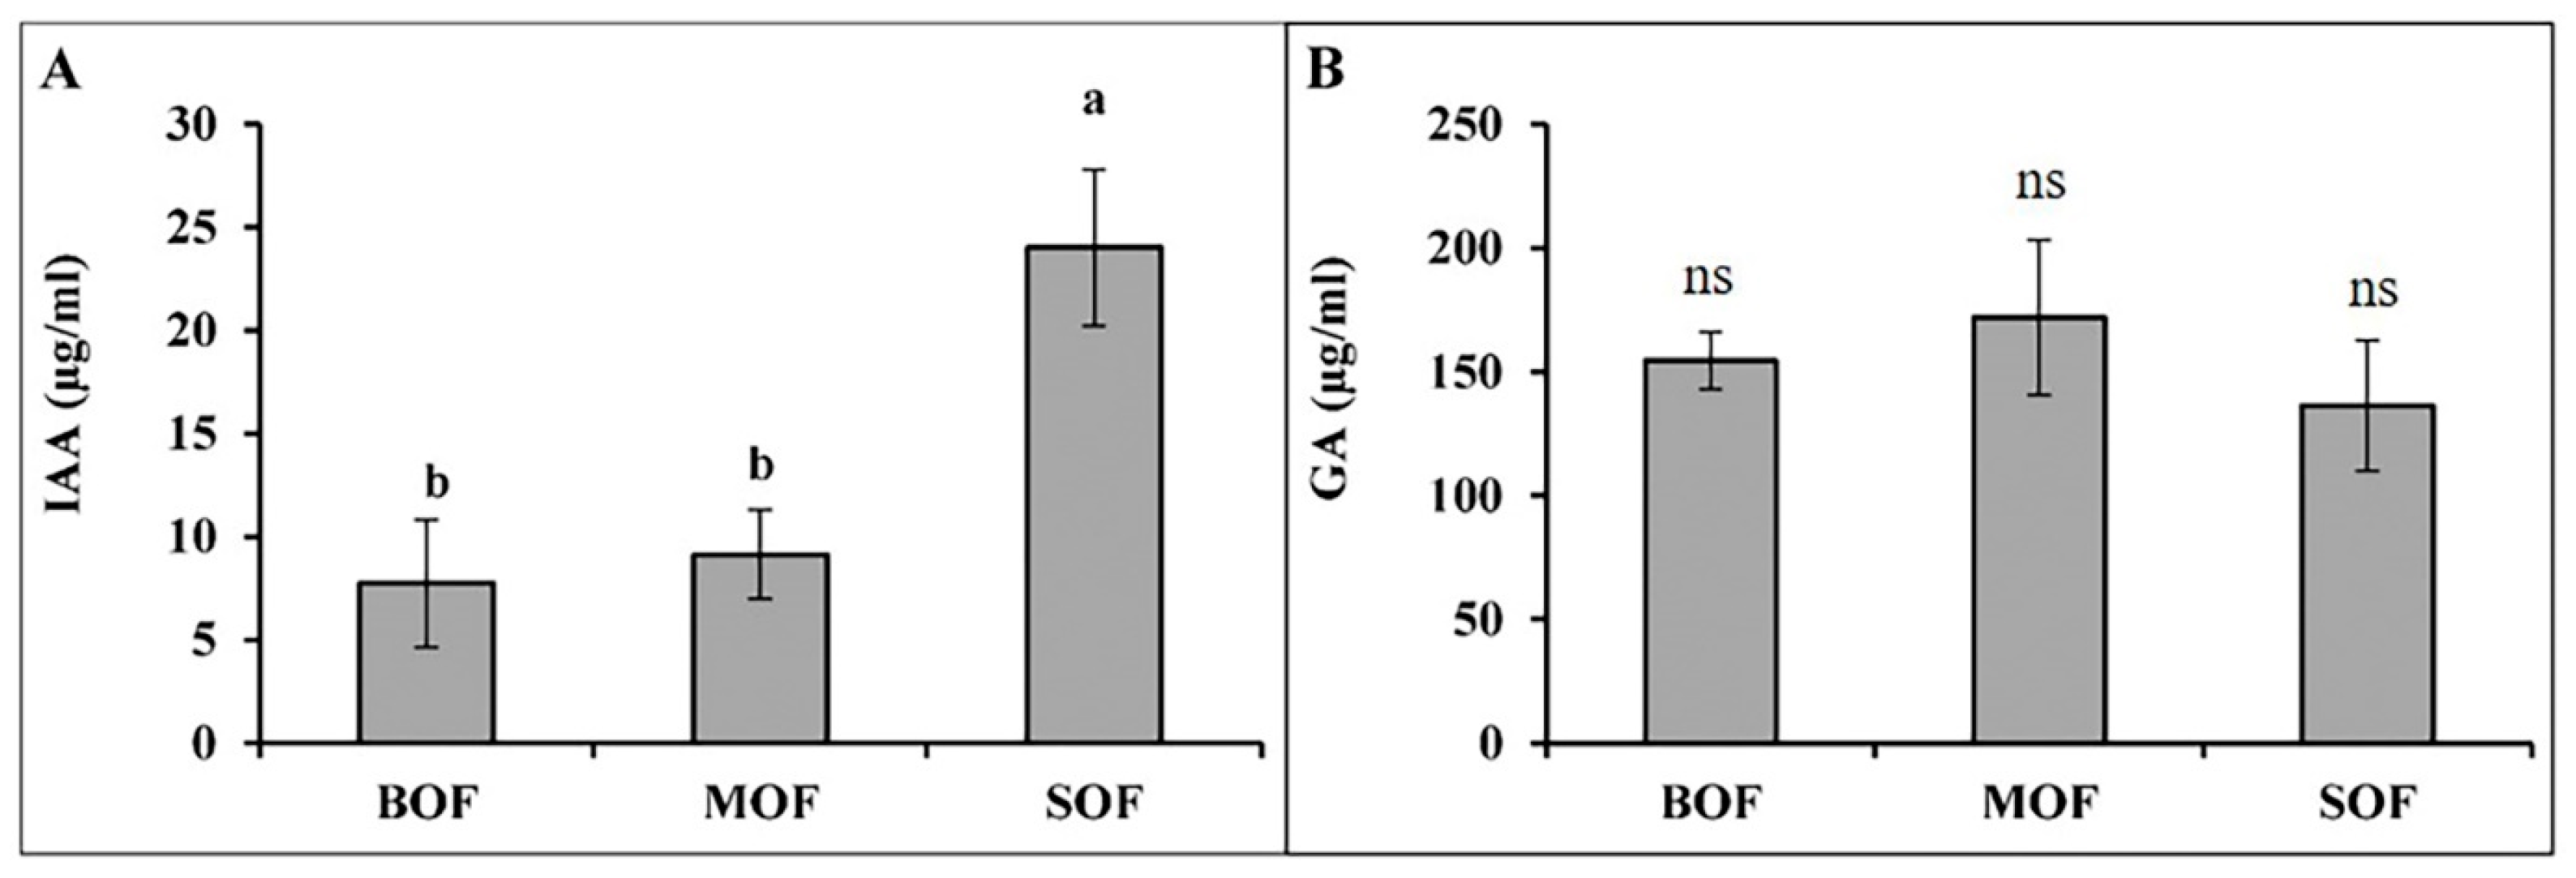
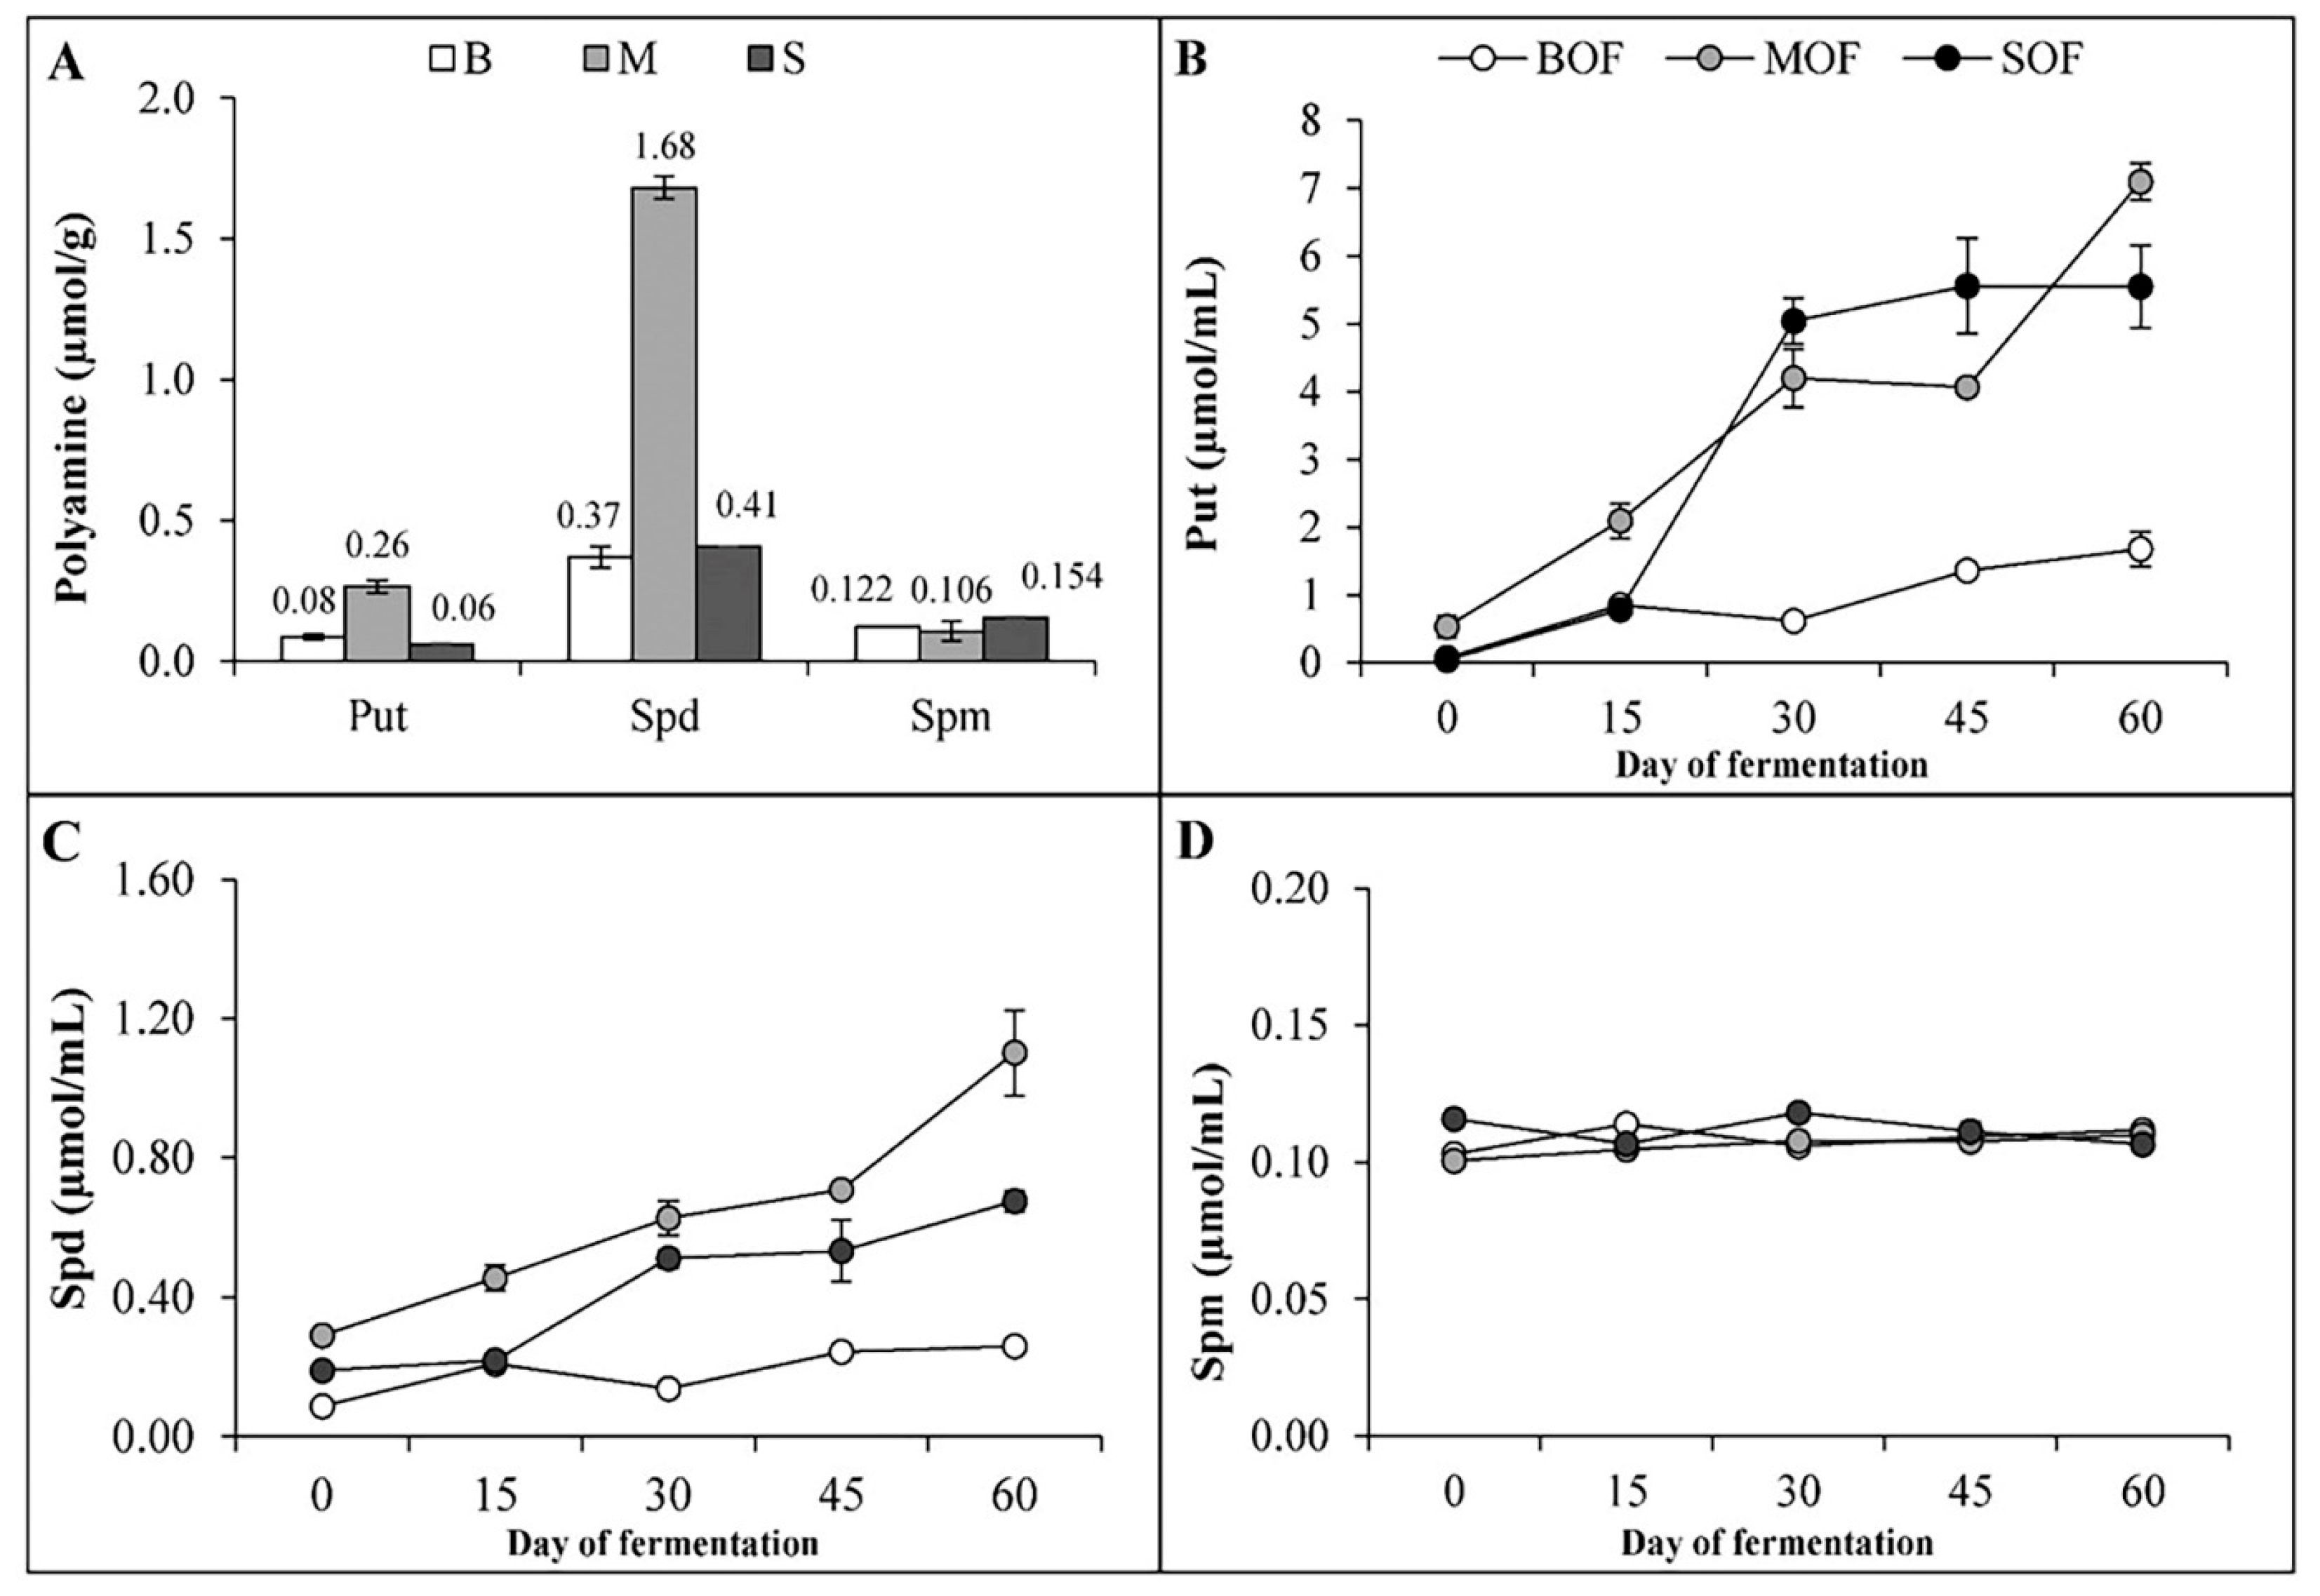
3.3. Phytohormones and Polyamines Concentration

The three LOFs contained a considerable amount of plant hormones, such as IAA and GA (Figure 3). IAA produced in SOF (24 µg/mL) was significantly higher than that in BOF (9 µg/mL) and MOF (13 µg/mL). Meanwhile, the amount of GA in three LOFs was not significantly different (ranging from 136 to 171 µg/mL). The ANOVA table showing the level of significant differences in IAA and GA content among the three LOFs is shown in Supplementary Table S4.
The concentration of each of the three kinds of PA in the fresh materials varied, as shown in Figure 4A. Spd was the main PA found in the raw materials, especially in mushrooms. Among the three groups of raw materials, mushroom was the richest source of Spd (1.68 µmol/g) and Put (0.26 µmol/g). In contrast, the PA contents were not much different in brassica and soybean. The amount of Spm in these raw ingredients was similar (ranging from 0.11 to 0.15 µmol/g). During the fermentation process, the amount of Put and Spd increased gradually and reached the highest concentration on day 60 (Figure 4B,C). However, the content of Spm did not increase with fermentation time (Figure 4D). At the end of fermentation, Put and Spd were the main PAs found in LOFs. MOF was the fertilizer that contained the highest amount of Put and Spd (7.1 and 1.1 µmol/mL, respectively), followed by SOF (5.6 and 0.68 µmol/mL) and BOF (1.70 and 0.26 µmol/mL). The amount of Spm in the three LOFs was around 0.11 µmol/mL. The ANOVA table showing the level of significant differences in Put, Spd and Spm in the starting materials, and in the three LOFs during fermentation is shown in Supplementary Table S5.

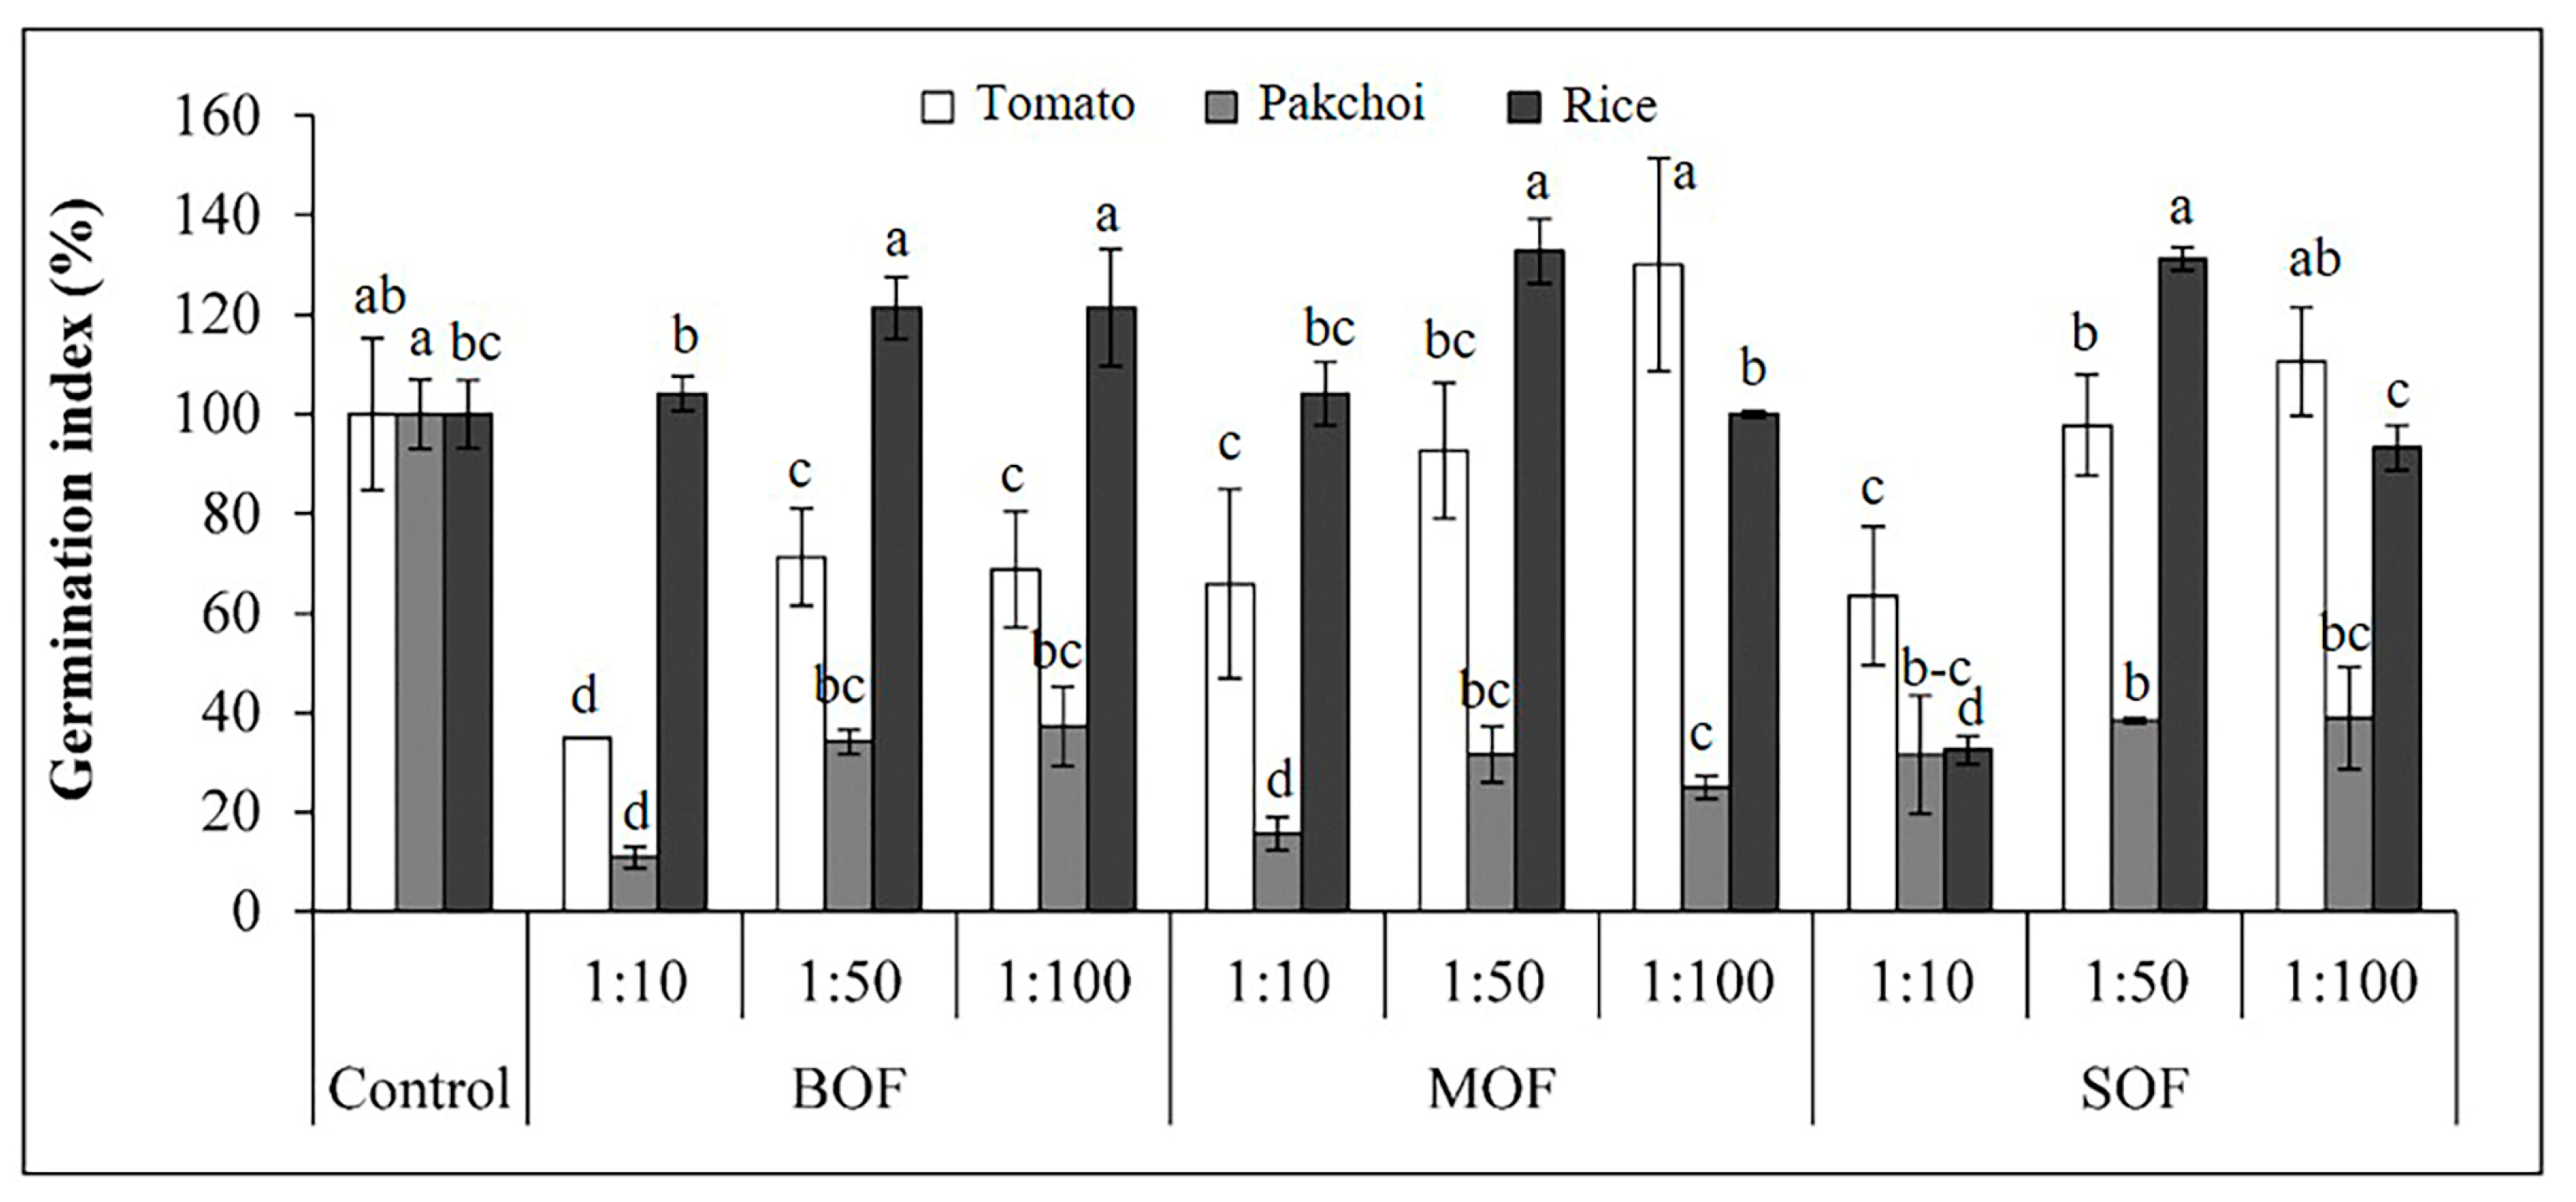
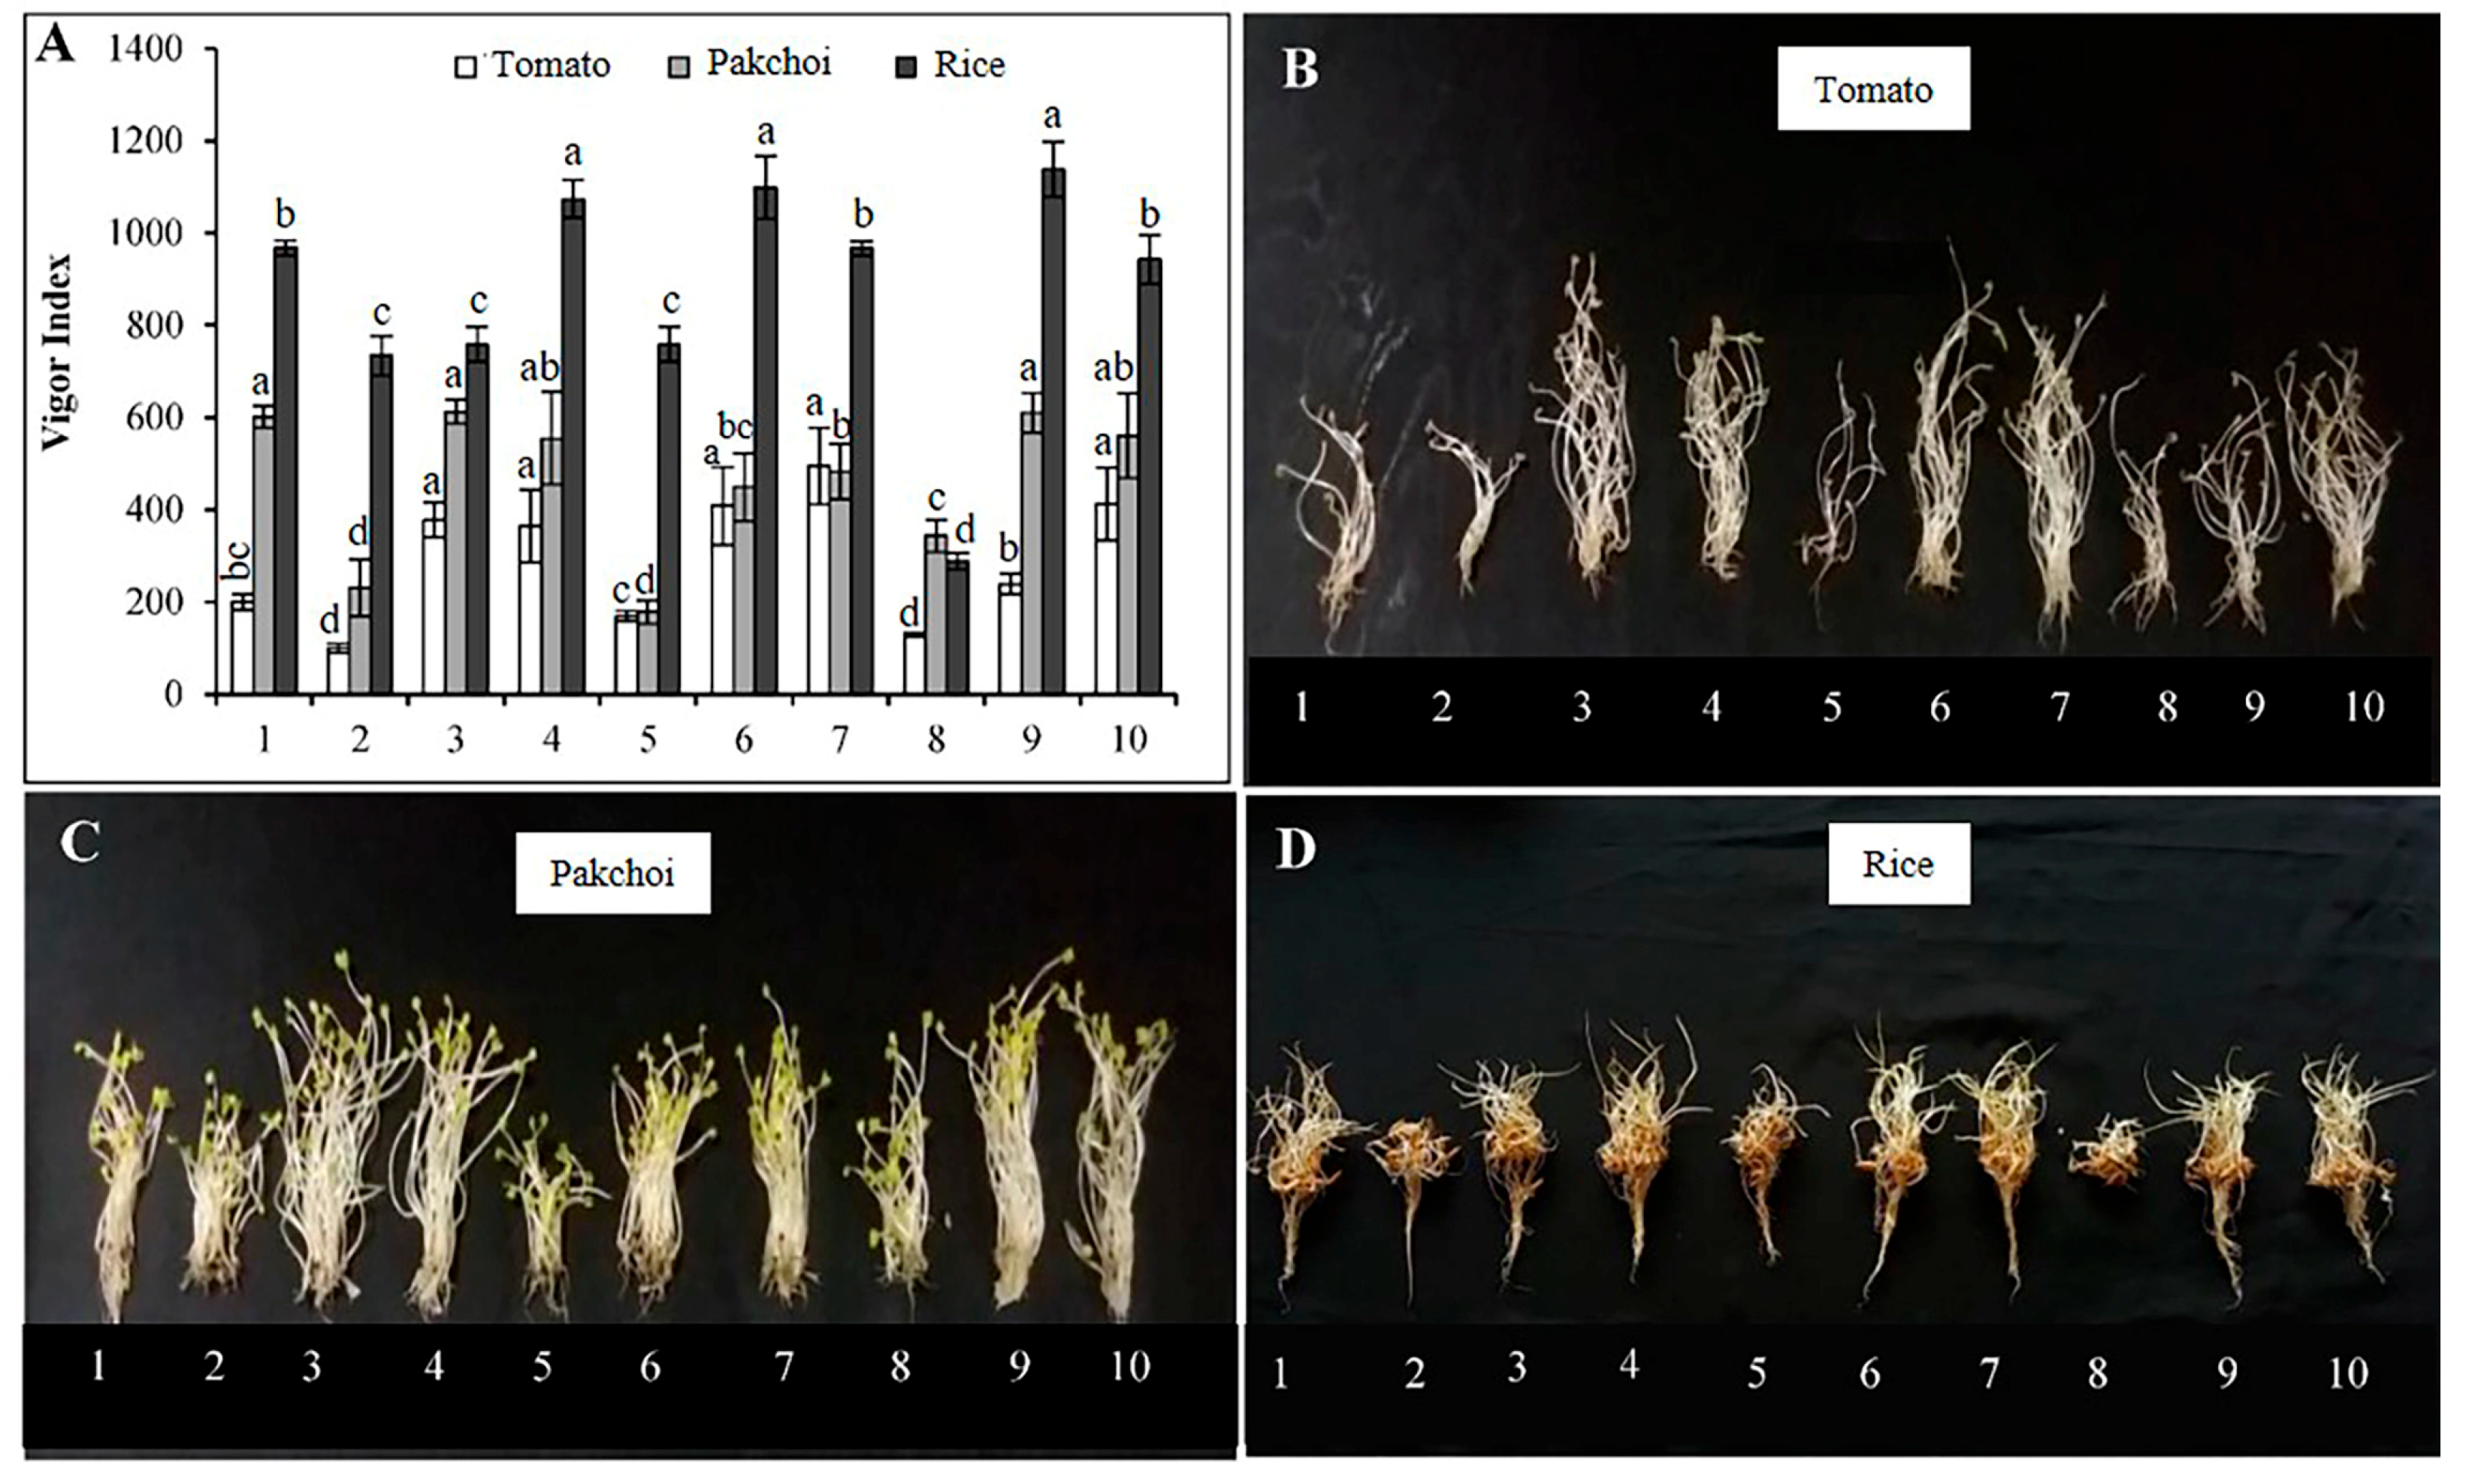
3.4. Effects of LOFs on Germination Index (GI), Vigor Index (VI), and Seedling Growth

The GI of all seedlings treated with diluted solutions of LOFs was presented in Figure 5. The GI of tomato was lower than 80% at a high concentration of LOFs (1:10 dilution). Low GI was also found in other concentrations of BOF. Meanwhile, the GI of tomato seeds treated by MOF and SOF (1:50 and 1:100) were higher than 80%. The GI of pakchoi was extremely low, less than 40%, at all dilution ratios of all LOFs. Oppositely, the GI of rice in all dilutions of all LOFs was higher than 80%, except for SOF at 1:10. The ANOVA table showing level of significance differences for GI of tomato, pakchoi and rice seeds treated with the three LOFs is shown in Supplementary Table S6.
The VI and effect of LOFs on seedling growth are shown in Figure 6. Similar to GI, the most concentrated liquid fertilizer (ratio 1:10) reduced VI and growth of seedlings compared to the control. At such a dilution rate, LOFs inhibited both germination percentage and growth of seedlings (Figure 6B–D). At more diluted concentrations (ratio 1:50 and 1:100), LOFs did not affect germination percentage; however, their impact on seedling growth varied greatly depending on plant species. At these concentrations, tomato seedlings in LOF treatment had a higher VI than control. Here, LOFs clearly showed great promotion on the shoot growth of tomato seedlings but did not have much effect on root length (Figure 6B). At the same dilutions, the VI of pakchoi was similar (in BOF and SOF) or slightly lower (in MOF) compared to control. LOFs enhanced shoot growth well yet inhibited root development (Figure 6C). Meanwhile, the VI of rice seedlings in BOF (1:100), MOF (1:50), and SOF (1:50) were higher than the control, while the 1:100 dilution of MOF and SOF gave similar results as the control. Based on this result, the LOFs at the dilution of 1:75 were used to investigate the effects of LOF application on the growth and physiology of rice at the vegetative growth stage. The ANOVA table showing level of significance differences for VI of tomato, pakchoi and rice treated with the three LOFs is shown in Supplementary Table S7.

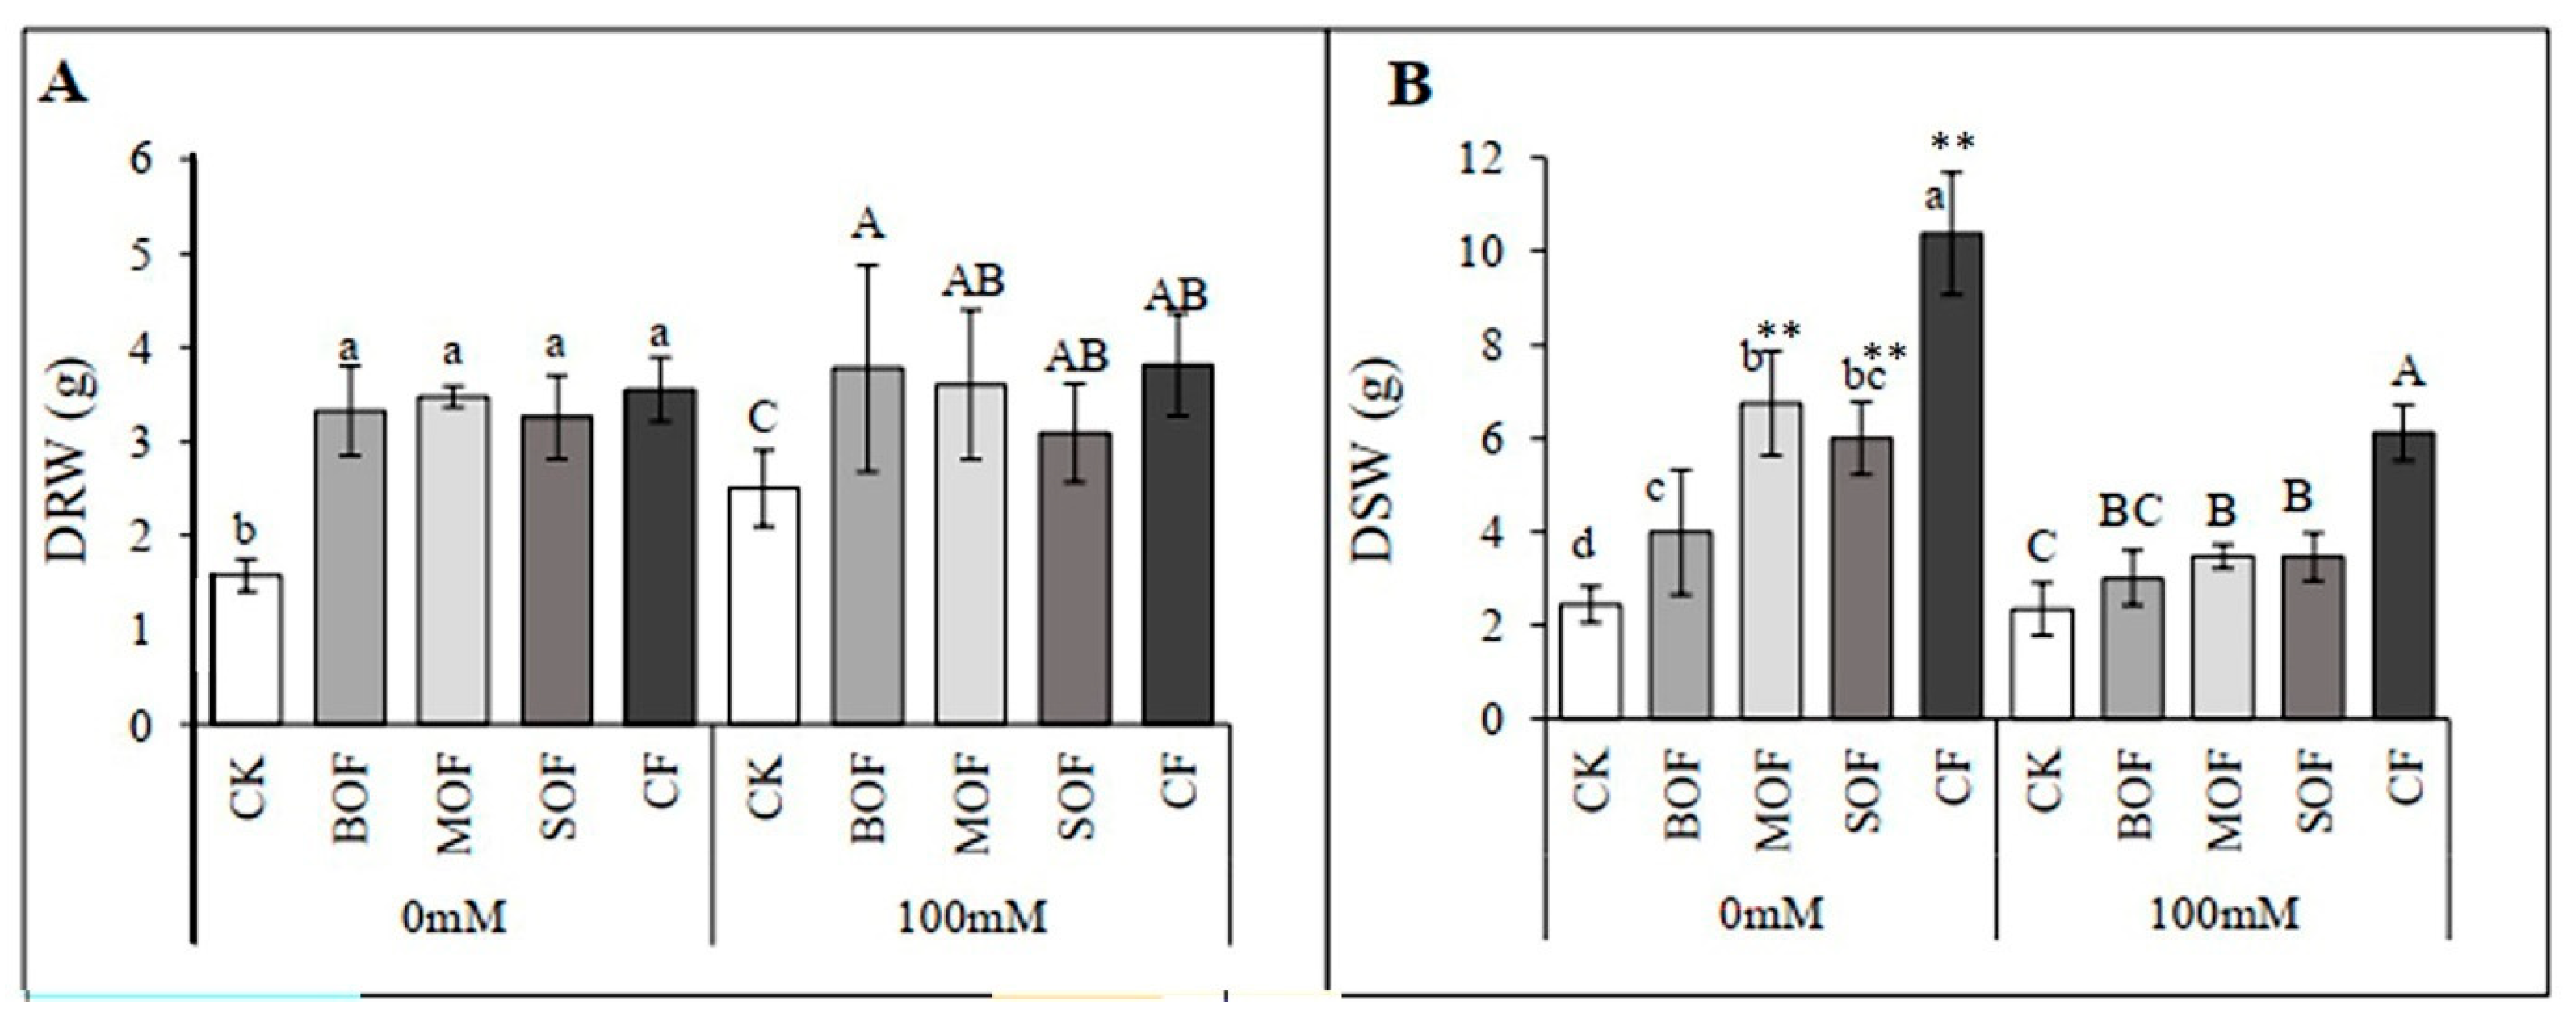
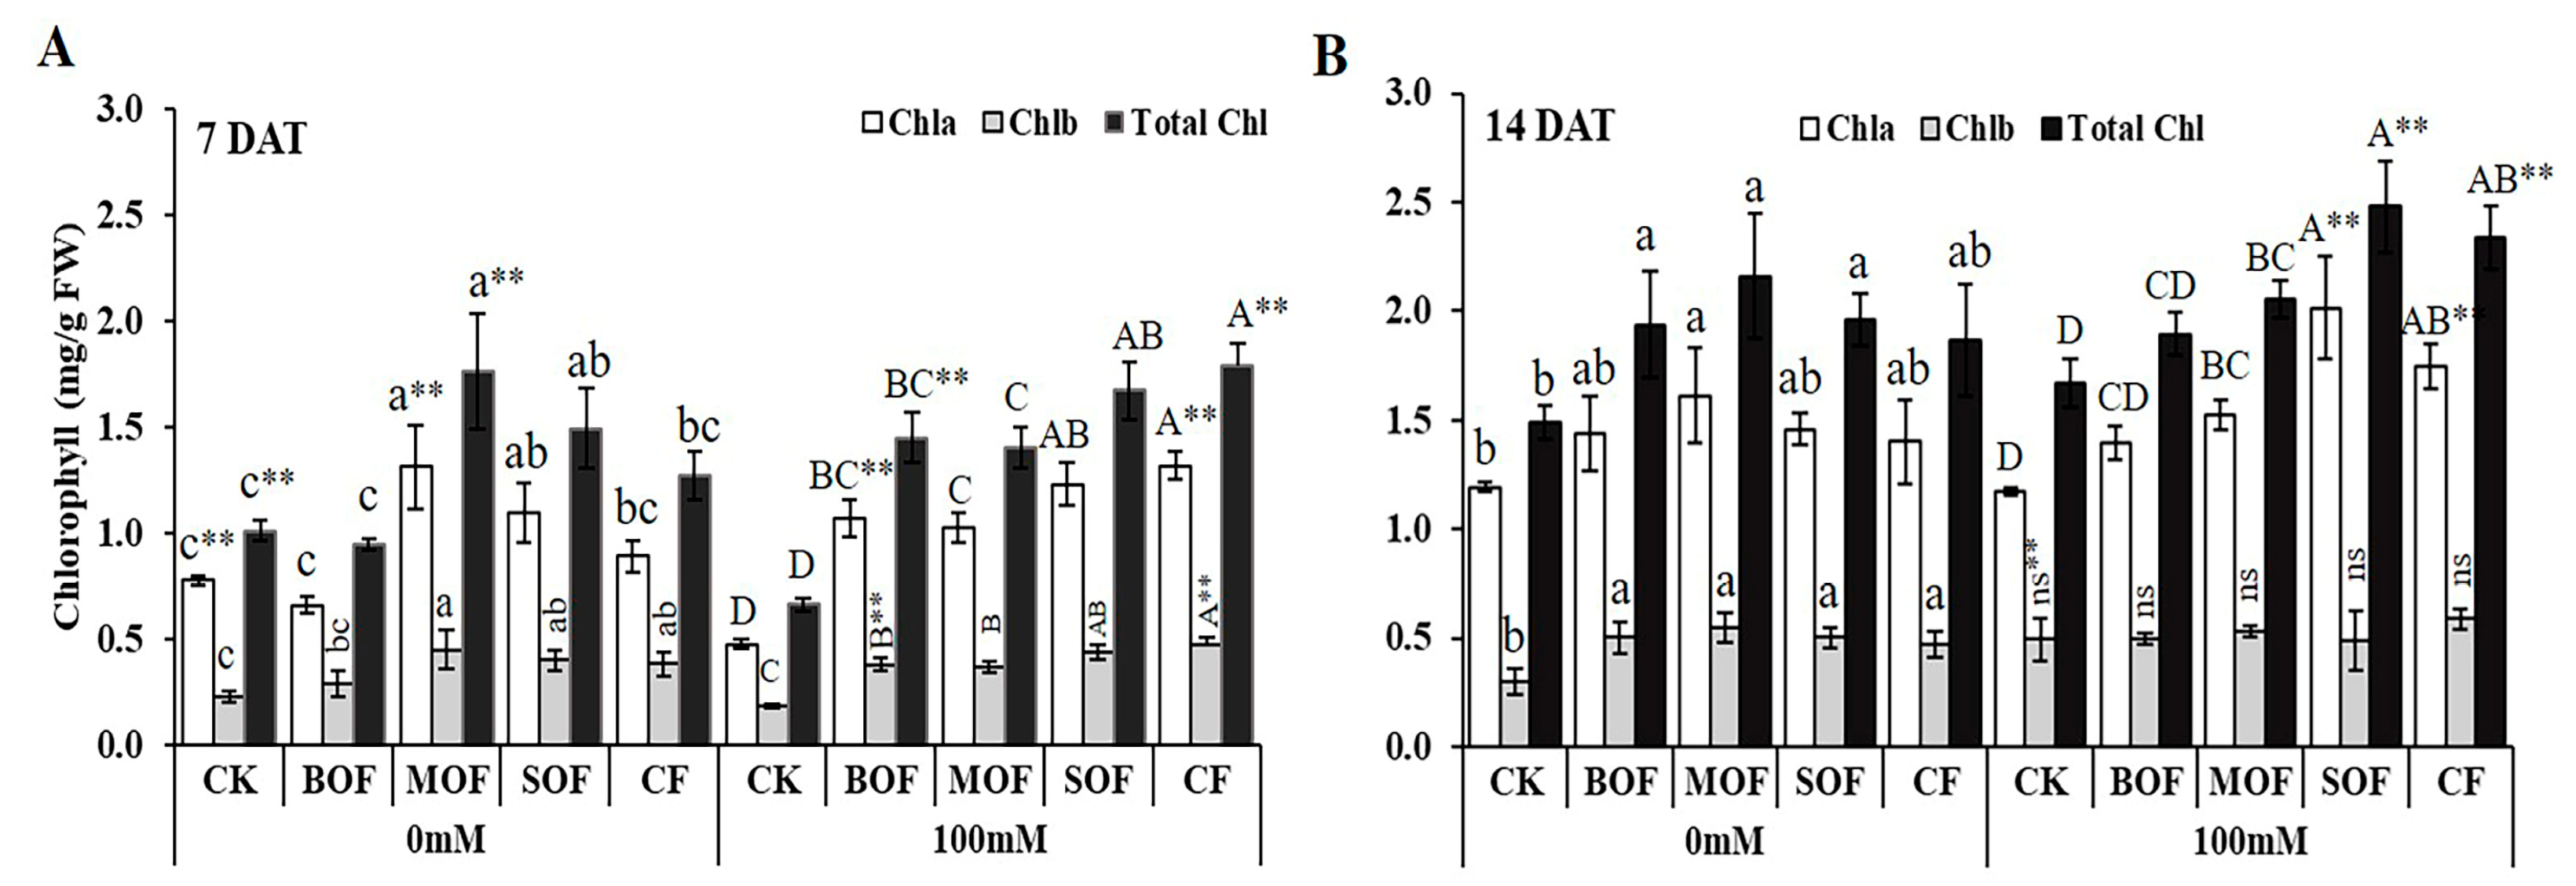
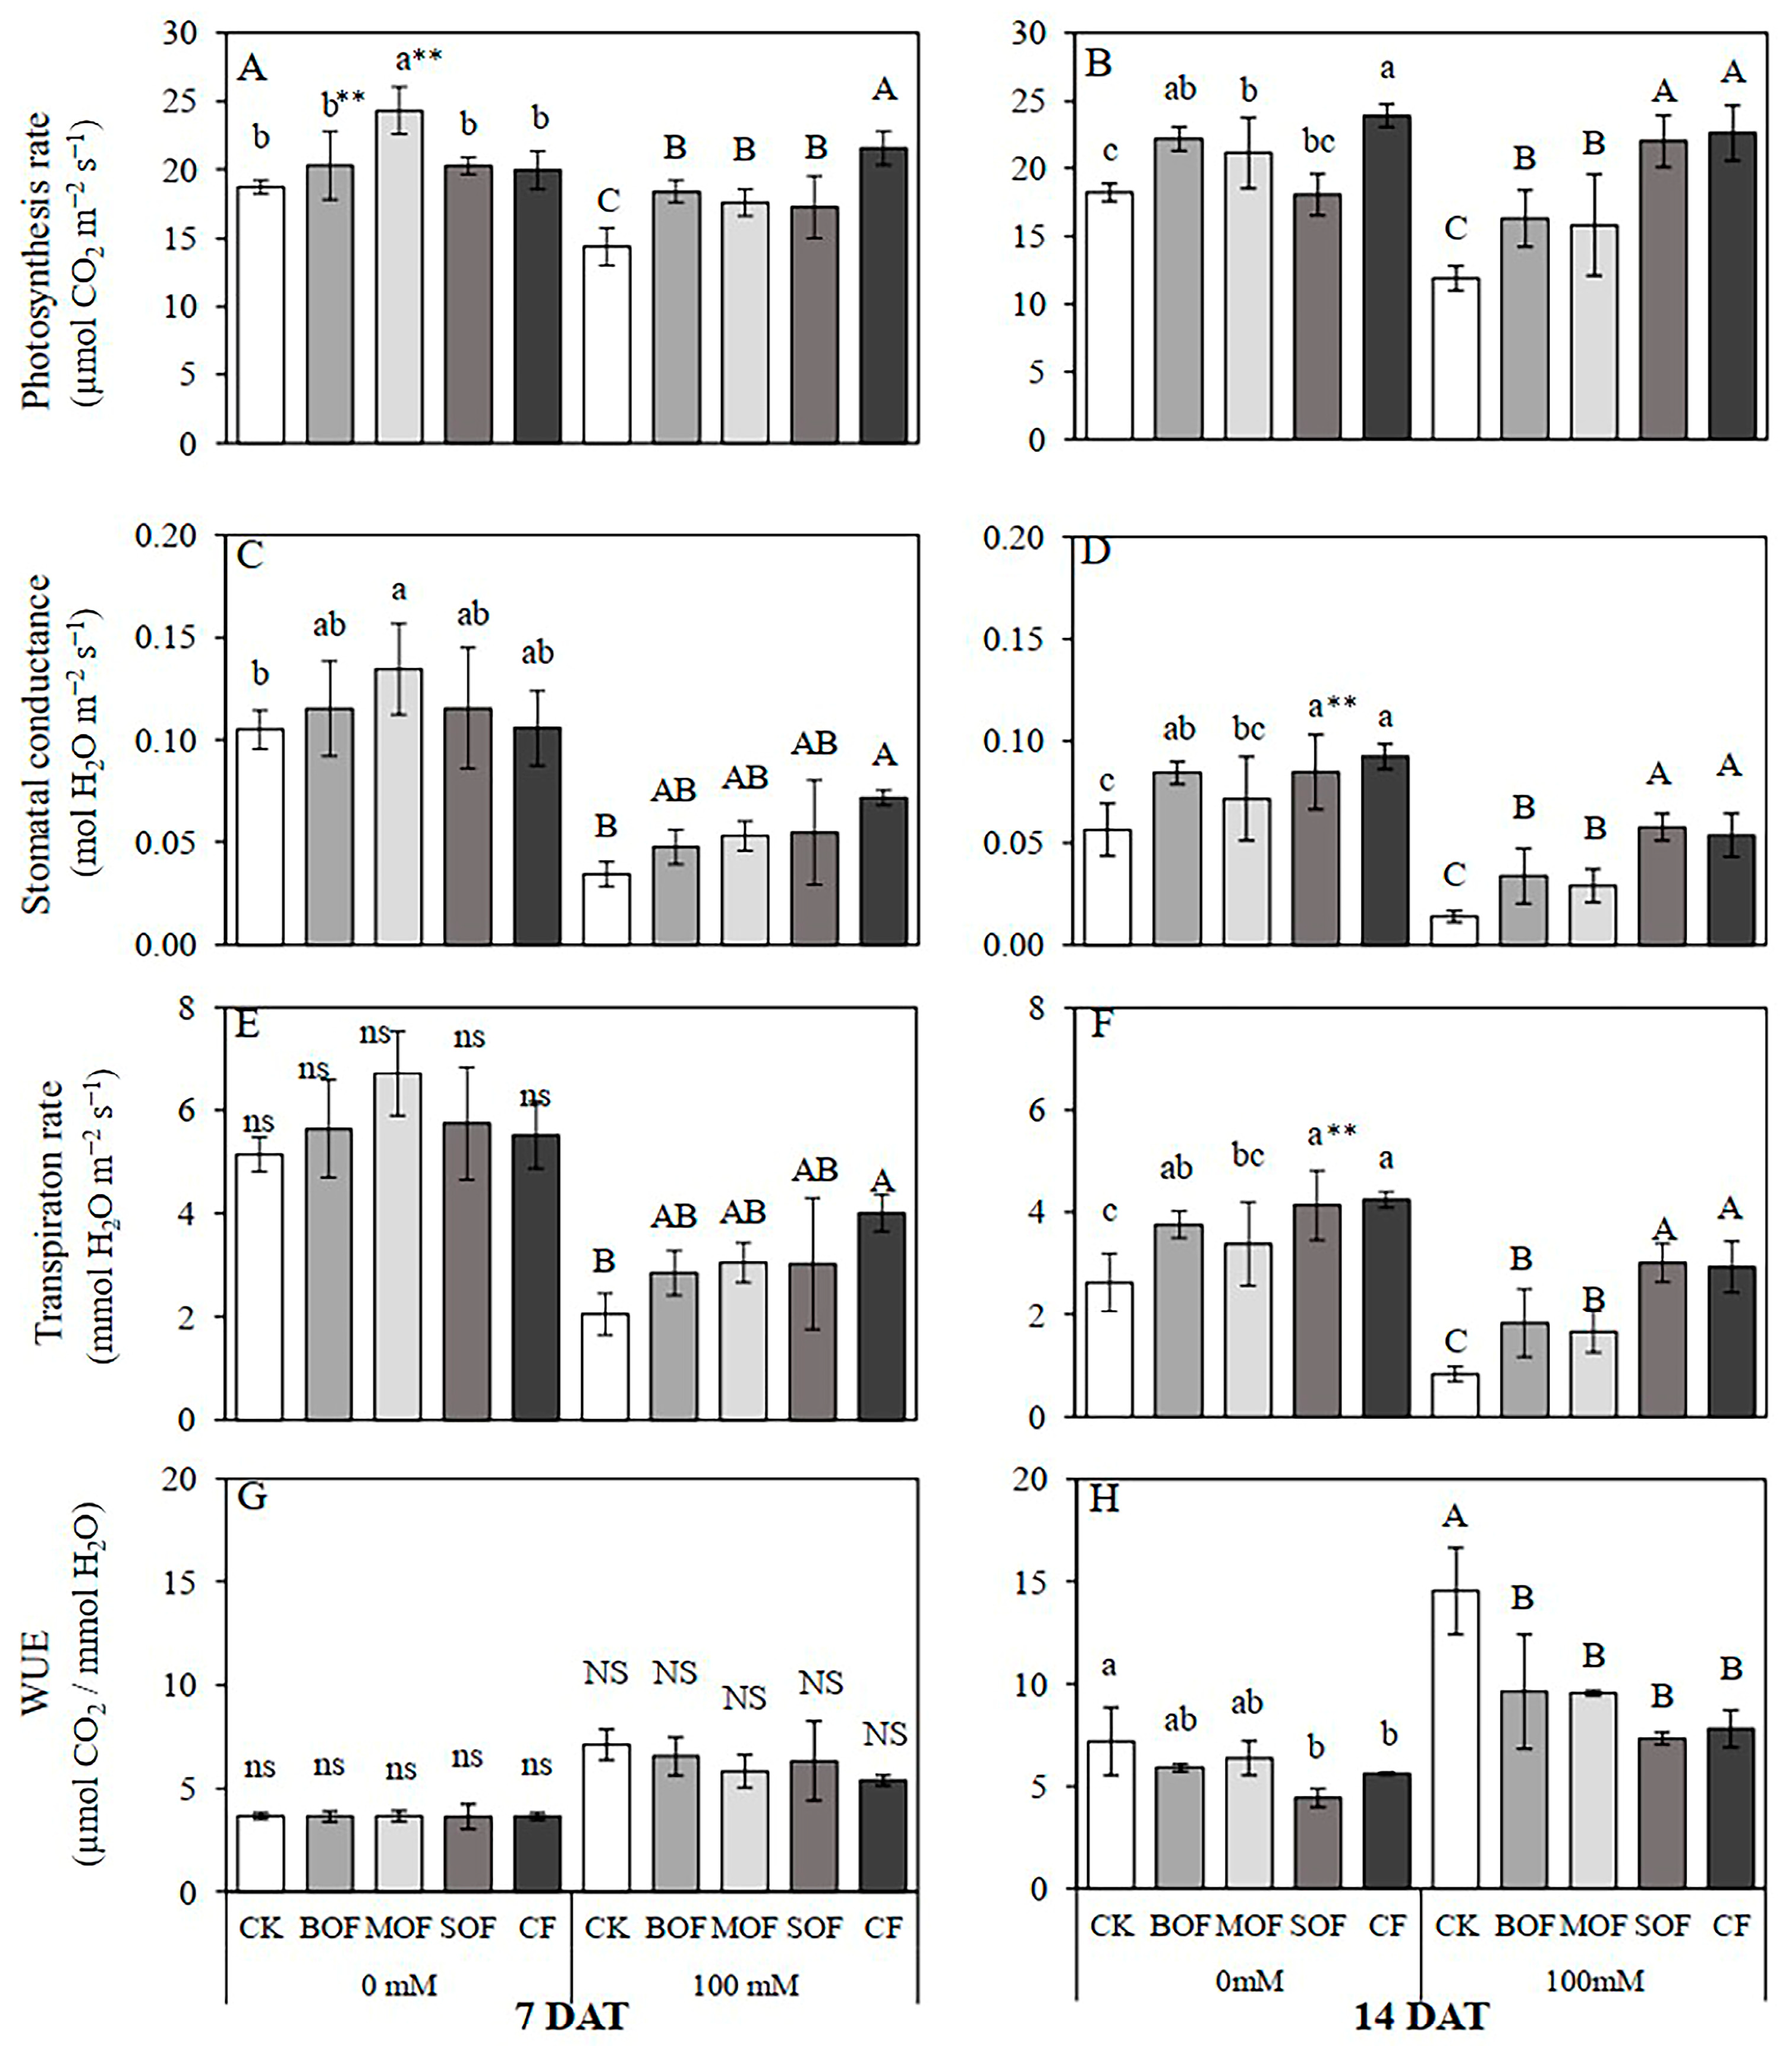
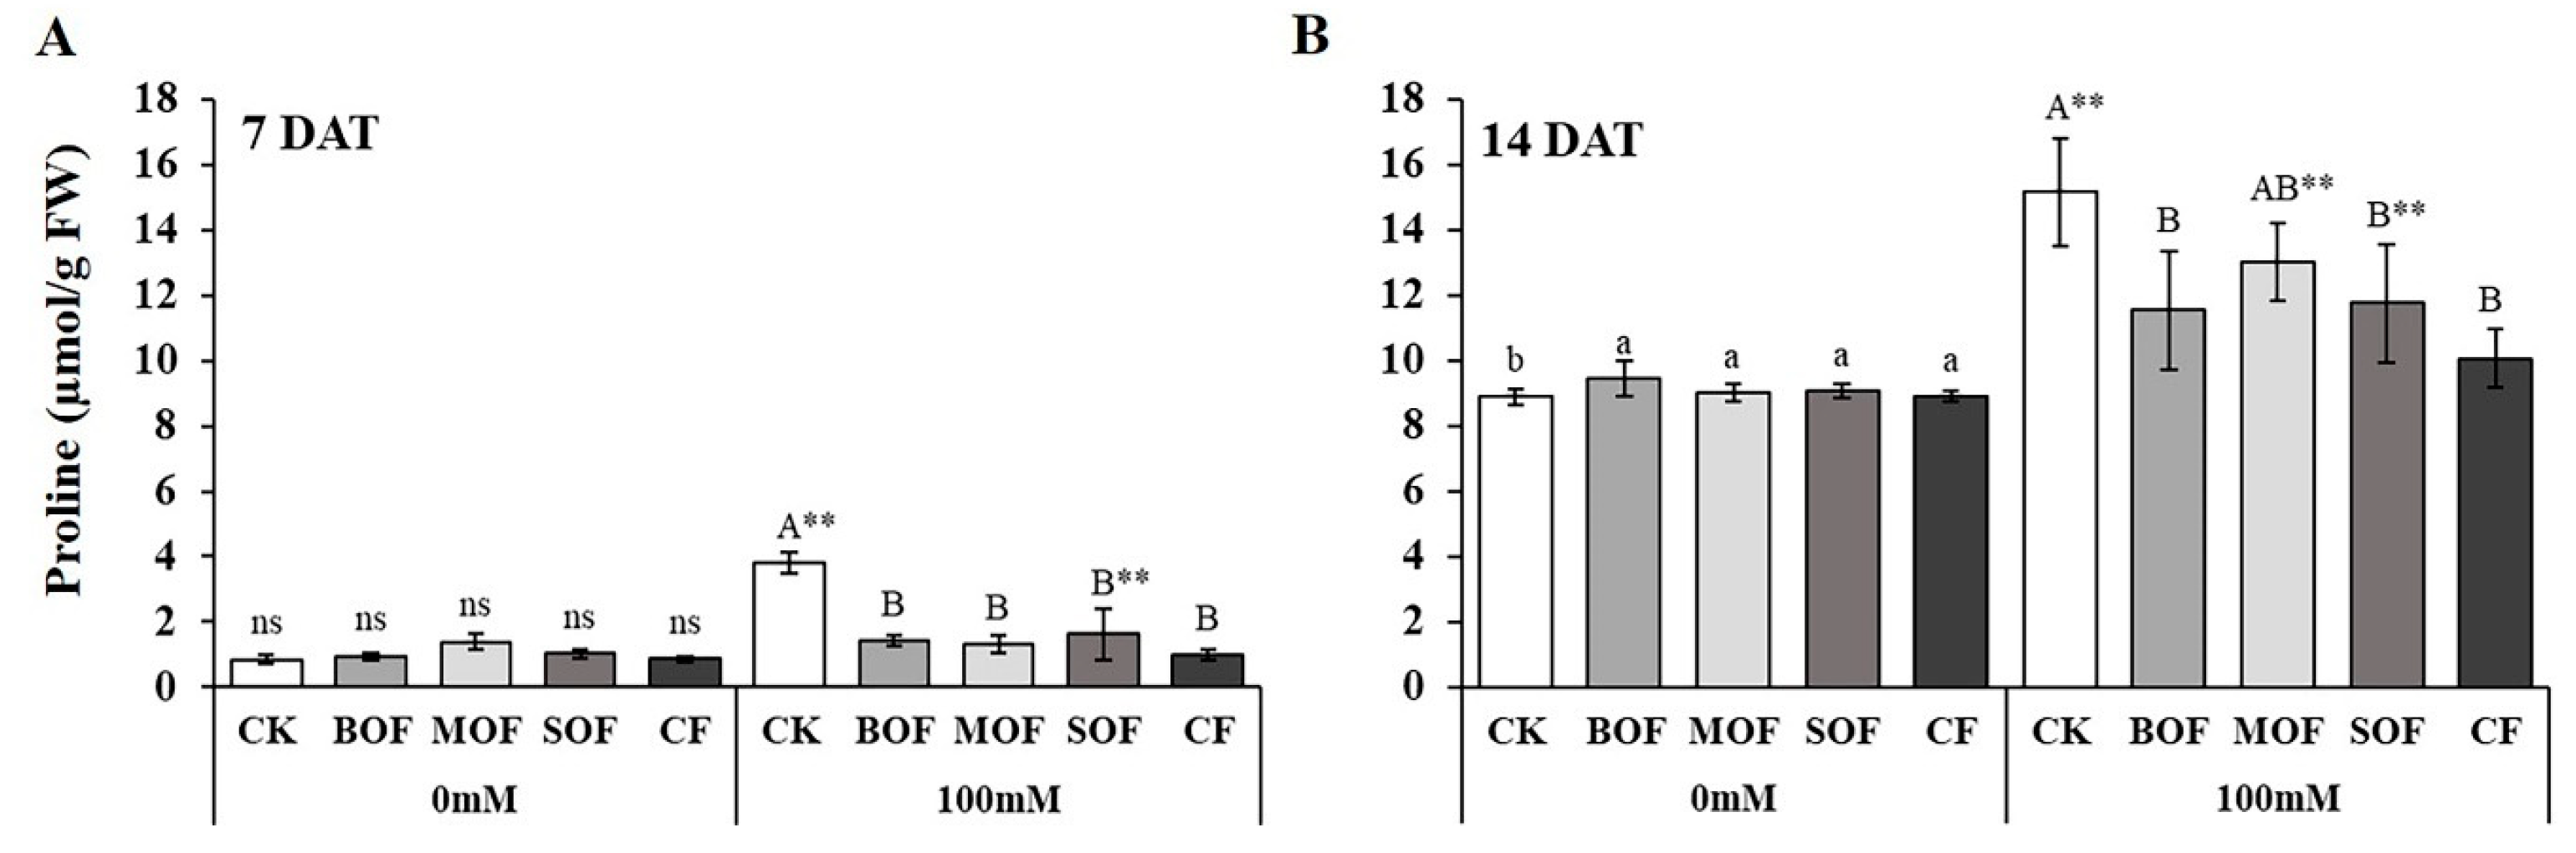
3.5. Effects of LOF on Growth and Physiology of Rice Under Salt Stress

The application of all three types of LOF and CF significantly and similarly boosted root growth for both non-stressed (106 to 124% increase in DRW) and salt-stressed plants (23 to 53% increase in DRW) (Figure 7A). For shoot growth, the LOFs and CF also significantly enhanced shoot growth under both conditions but with different efficiency (Figure 7B). Among LOFs, DSW of non-stressed plants was enhanced by 176, 145, and 63% for MOF, SOF, and BOF, respectively, while CF was the most effective treatment, resulting in 325% shoot growth increment. The ability of LOFs and CF in growth promotion was much reduced for salt-stressed plants, with 160, 48, 48, and 29% increases in DSW for CF, MOF, SOF, and BOF, respectively. Under 100 mM NaCl stress, all three LOFs significantly enhanced root growth compared with CK, but only MOF and SOF enhanced shoot growth. The ANOVA table showing the level of significant differences for DRW and DSW of rice treated with the three LOFs and CF is shown in Supplementary Table S8.
Chlorophyll contents were evaluated 7 and 14 days after adding 100 mM NaCl to pots. After 7 days of salt stress, the total chlorophyll of the CK plants was reduced by 34% from 1.01 to 0.66 mg/g (Figure 8A). Exogenous applications of LOFs and CF dramatically boosted the total chlorophyll content of the stressed plants by 110, 119, 151, and 169% for MOF, BOF, SOF, and CF, respectively. The supply of MOF, SOF, and CF also significantly enhanced chlorophyll in the non-stressed plants. Chlorophyll content generally increased with plant age, and the plants tended to adapt to salt stress; there was no significant difference in total chlorophyll between the control and salt-treated CK plants after 14 days of salt stress (Figure 8B). Total chlorophyll contents in the non-stressed plants significantly increased by 25, 29, 30, and 45% when supplied with CF, BOF, SOF, and MOF, respectively. The increments in chlorophyll content of the stressed plants were 14, 23, 40, and 48% by the supplement of BOF, MOF, CF, and SOF, respectively. Therefore, similar to the effects on growth, MOF and SOF were more beneficial for chlorophyll production of rice under salt stress than BOF. The ANOVA table showing the level of significant differences for chlorophyll contents of rice plants treated with the three LOFs and CF after 7 and 14 days is shown in Supplementary Table S9.
Salt stress for 7 days imposed an inhibitory effect on leaf photosynthesis, resulting in a 23% reduction in Pn of the stressed CK plants compared with the non-stressed ones (Figure 9A), and after 14 days, the reduction in Pn was further reduced to 33% (Figure 9B) due to a huge reduction in stomatal conductance (Figure 9C,D). Salt-induced inhibition of photosynthesis of rice subjected to salt stress for 7 days was significantly alleviated by fertilizer supplements yielding 20, 30, 31, and 50% increments in Pn for SOF, MOF, BOF, and CF, respectively (Figure 9A). With an extended period of stress, SOF and CF were similarly effective in mitigating salt stress effects on photosynthesis, showing the enhancement effects of 64 and 81% for SOF and CF, respectively, in comparison to CK (Figure 9B). BOF and MOF were less effective, showing 27 and 24% enhancement of Pn, respectively. The alleviating effects of LOFs and CF on raising the values of stomatal conductance (gs) and transpiration rates (Tr) were also evident, as shown in Figure 9C,D and Figure 9E,F, respectively. Treatment of NaCl for 14 days forced the plants to save water, causing a dramatic reduction in Tr (Figure 9F), leading to the doubling of water use efficiency (WUE) (Figure 9H). Supplement of LOFs and CF caused significant reductions in WUE (Figure 9H). Therefore, it was clearly evident that exogenous application of LOFs and CF enhanced photosynthesis in rice under salt stress. Like the beneficial effects on chlorophyll content, SOF and CF were better options for the promotion of photosynthesis than BOF and MOF. Moreover, SOF was as effective as CF in mitigating salt stress effects on photosynthesis, as is evident in Figure 9B. The ANOVA table showing the level of significant differences for photosynthetic performance of rice plants treated with the three LOFs and CF after 7 and 14 days is shown in Supplementary Table S10.
Under non-stress conditions, proline content in rice leaves increased 10 times with age from 0.85 µmol/g (Figure 10A) at 7DAT to 8.88 µmol/g at 14DAT (Figure 10B). For control plants without fertilizer supplements, salinity stress greatly enhanced proline accumulation in rice leaves, resulting in a 4.48-fold increase at 7DAT (from 0.85 to 3.81 µmol/g) and 1.71-fold increase (from 8.88 to 15.16 µmol/g) at 14DAT. Liquid fertilizer application had no effect on the proline content of the control plants at 7DAT (Figure 10A) but slightly enhanced proline accumulation at 14DAT (Figure 10B). For both timepoints, all fertilizer applications significantly reduced the leaf proline of salt-stressed plants (except for MOF at 14DAT). At 7DAT, the proline contents under salt stress were reduced by 57% for SOF to 74% for CF, and at 14DAT, the level of reduction ranged from 14% for MOF to 34% for CF. The effects of all three types of LOFs and CF on reducing proline content were statistically similar, although CF tended to be slightly more effective than the LOFs. The ANOVA table showing the level of significant differences for proline content of rice plants treated with the three LOFs and CF after 7 and 14 days is shown in Supplementary Table S11.

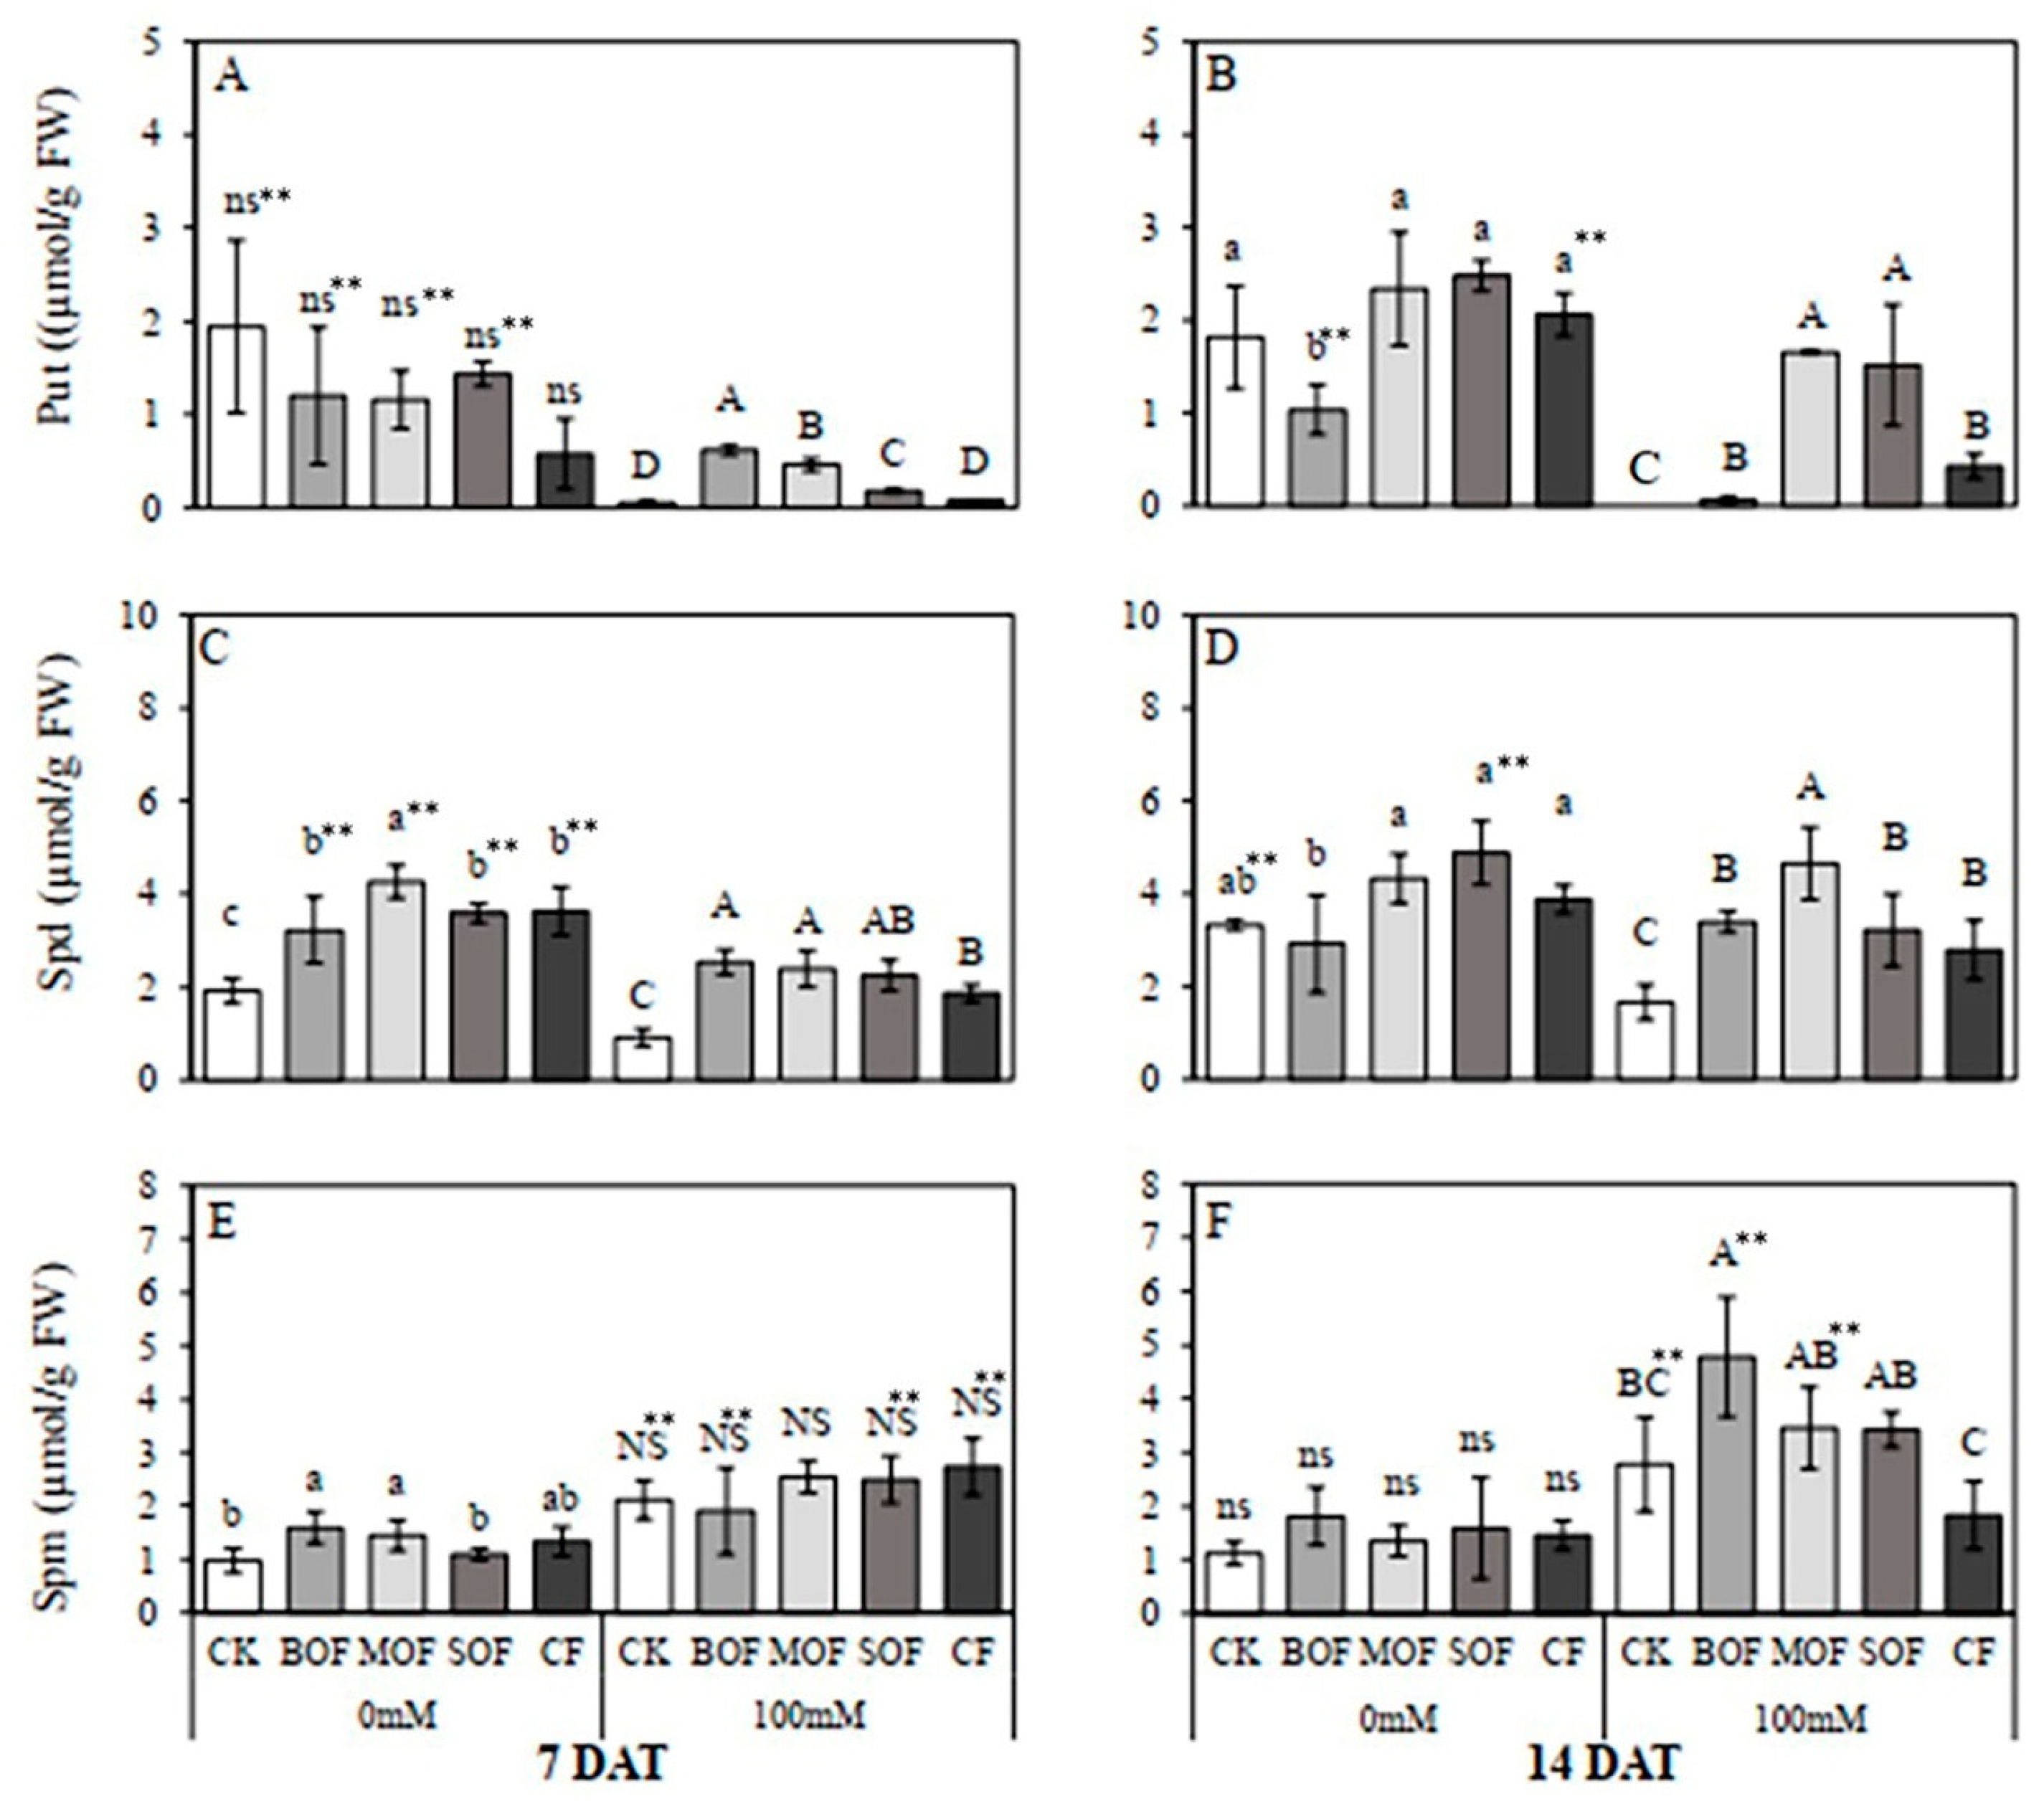
3.6. Effects of LOFs on Endogenous Polyamine (PA) Content in Rice Leaf

The effects of LOFs on endogenous polyamine content in rice leaves of plants subjected to salt stress for 7 and 14 days are displayed in Figure 11. In the control non-stressed plants, rice leaves contained higher Put and Spd than Spm. Notably, in response to salt stress for 7 and 14 days, Put (Figure 11A,B) and Spd (Figure 11C,D) content significantly reduced while Spm (Figure 11E,F) increased significantly, resulting in higher content of Spm than Spd and Put in salt-stressed leaves. For the control non-stressed plants on 7DAT, significant effects of LOFs were observed only in the increment of Spd (Figure 11C) and Spm (only for BOF and MOF; Figure 11E). For salt-stressed plants at 7DAT, BOF, MOF, and SOF caused significant increases in Put (Figure 11A), while all three kinds of LOFs, as well as CF, enhanced Spd synthesis (Figure 11C). In contrast, none of the fertilizer applications had significant effects on the Spm content of salt-stressed plants (Figure 11E). When the period of salt stress was extended to 14 days, all fertilizer applications resulted in significantly greater amounts of Put (Figure 11B) and Spd (Figure 11D) than those in the controls. However, for Spm, only BOF resulted in significantly higher content compared with the control (Figure 11F). The highest Spd content was found with MOF application (Figure 11D), while the highest Put was recorded with MOF and SOF supplements (Figure 11B). It is noted that, for all fertilizer treatments, the amounts of Put (Figure 11A,B) and Spd (Figure 11C,D) in the salt-stressed plants were similar or lower than those in the non-stressed plants treated with the same fertilizers. In contrast, Spm contents in salt-stressed rice plants at 7DAT treated with all LOFs (except for MOF) and CF were significantly higher compared to the control plants receiving the same fertilizers (Figure 11E). However, at 14DAT, only salt-stressed plants supplemented with BOF and MOF produced significantly higher Spm than the control plants treated with the respective fertilizers (Figure 11F). The ANOVA table showing the level of significant differences for Put, Spd and Spm in rice plants treated with the three LOFs and CF after 7 and 14 days is shown in Supplementary Table S12.

4. Discussion

4.1. Physico-Chemical Characteristics of Liquid Organic Fertilizers (LOFs)

Liquid organic fertilizer (LOF) is known as liquid extraction from the fermentation of plant or animal materials with sugar and effective microorganisms. Under the activity of these microbes, the organic compounds in fresh materials were decomposed; consequently, a variety of substances were released, such as proteins, amino acids, organic acids, macronutrients, micronutrients, plant hormones, vitamins, and enzymes. Molasses are usually used as a main source of energy for microorganism proliferation. Microorganisms use carbon sources in molasses to reproduce and degrade fresh materials. One common feature of molasses is acidic pH and high EC value [29]. Therefore, the addition of molasses in the formula of LOF (pH 5.17 and EC 27.67 dS/m) immediately generated a lower pH (about 4.2–4.8) and higher EC (15–16 dS/m) at the beginning of the fermentation process (Figure 1). This reduction in pH created a suitable environment for the growth of lactic acid bacteria and yeast, which are predominant groups of microorganisms in highly concentrated sugar conditions [30]. Under the activity of the lactic acid bacteria group, the sugar was converted to organic acids (acetic acid, lactic acid, and citric acid), which mainly contributed to the pH decrease at a later stage [11]. These acids could be converted to alcohol, reflected by a strong wine odor during the first 30 days of fermentation. At the end of fermentation, these organic acids were either converted or evaporated [31]. Therefore, the pH in liquid fertilizer rose back (Figure 1A). The increased pH also indicates the increased ammonium contents in the extraction liquid. The increase in EC during the fermentation was caused by the release of minerals and salts from plant materials into the liquid (Table 1). Also, the evaporation of water during fermentation contributed to EC rising [7,32].
The quality of LOF was mainly decided by the quality of constituent substrates. Broccoli, cauliflower, mushroom, and soybean were documented to be rich in nutrients and minerals [33]. The difference of macronutrients in the finished LOF products, especially the N content, was consistent with the amount in the starting plant materials, in which SOF had the most concentrated N (Table 1). The superior amount of total P in SOF might relate to the high density of phosphorus-solubilizing bacteria in this fertilizer (Figure 2B). Meanwhile, a considerable amount of total K in all LOFs was mostly derived from a high concentration of K in molasses (3.6–5.25%) [34]. The low C/N was found at the final stage of fermentation. A high C/N ratio indicates the presence of unutilized complex carbon content, while a decrease in C/N ratio (<25:1) indicates an efficient decomposition process [35]. The growth trend of the microbial population in the three kinds of LOF followed the same pattern, showing the highest activity on days 15 or 30, then decreased or was stable later on (Figure 2) when most organic materials were utilized (low C/N). The high density of plant growth-promoting bacteria was also found in these LOFs (Figure 2). The presence of these beneficial microorganism groups was responsible for nutrient cycling to make the soil become more fertile when LOF was applied to the soil [36]. This is a benefit from LOF that chemical fertilizers do not possess.
Many plant growth-promoting rhizobacteria (PGPR) in organic fertilizers have been found as producers of IAA, cytokinins, and gibberellins [37]. LOFs contain living microorganisms that can produce such beneficial compounds [38]. However, the presence of PAs in organic fertilizers has been rarely reported. It was discovered in this study that the fermentation process significantly increased the concentration of PAs, particularly that of Put and Spd (Figure 4). Although high concentrations of PAs were reported to be commonly present in fermented food resulting mostly from the activity of lactic acid bacteria [39], PAs were rarely analyzed in organic fertilizers or LOFs. The high variation in PA content in LOFs (Figure 4) was mainly attributed to the difference between raw materials. Mushrooms and soybeans were documented as substrates higher in Spd and Put than broccoli [33,40]. The change in PAs in the fermentation process was also contributed by the microorganism community in liquid fertilizer [41,42], which was reported to produce a higher amount of intracellular PAs in an acid environment [43].

4.2. Phytoxicity Evaluation of the LOFs Based on Seed Germination Test

Phytotoxicity can be defined as a delay in germination or inhibition of plant growth or any other adverse effects caused by specific substances or inadequate growth conditions. GI is the most sensitive parameter for assessing the phytotoxicity of organic fertilizers, which provides a direct and reliable result [44,45,46]. A sample was assumed to have no toxicity when GI is >80% [26]. In this experiment, LOFs showed high toxicity at a low dilution ratio and less toxicity when the dilution ratio increased (Figure 5). At the dilution of 1:10, most GI values were less than 80%, indicating that LOFs were toxic. The inhibitory effect here was shown by germination rate reduction and/or inhibition of root elongation (Figure 6). High concentration of salts and nutrients creates high osmotic pressure, which prevents the water absorption of seeds and, in turn, reduces seed germination and radical development [47]. Therefore, the safer use of LOFs in this present study would be mainly focused at two higher dilutions (1:50 and 1:100). Most LOFs were free of toxicity at the dilution of 1:50 or above, which were in agreement with previous research [7,48]. However, seeds of different plant species showed different levels of sensitivity to different LOFs. In this study, pakchoi was the most sensitive seed, and rice was the least sensitive. According to Jagadabhi [49], the toxicity of specific seeds to LOF soaking solution may be attributed to the susceptibility of seeds, nutrient availability in growing media, and the specific types of toxins in LOF.
It was also noted in Figure 6B,C,D that LOFs at the dilutions of 1:50 and 1:100 in most cases stimulated shoot growth of all three tested seedlings but inhibited root growth of tomato and pakchoi. GA is mainly responsible for promoting shoot length, while the presence of IAA concentration in certain ranges was reported to stimulate the growth of the shoot but inhibit the growth of the root [50]. In addition, PAs were found to have positive effects on seed germination and seedling growth, particularly under abiotic stress [51]. However, these effects varied depending on the types and concentrations of PAs and plant species. Put was found to be able to stimulate root growth of Arabidopsis thaliana at low concentrations but increasingly inhibited it at high concentrations, while Spd and Spm did not affect root growth but inhibited seed germination [52]. Spm and Spd improved seed germination and the seedling vigor of rice, but Put failed to improve the seed vigor of tomato [53,54]. Most toxic effects of LOFs were evident in the root growth inhibition, especially for tomato and pakchoi (Figure 6B,C) but not in rice (Figure 6D). Jang et al. [55] found that 1 mM Spd promoted root and shoot growth of A. thaliana but inhibited root growth in carnation culture. Furthermore, IAA and cytokinin-activated PA-synthesizing enzymes (Arginine decarboxylase and S-adenosyl methionine decarboxylase) in carnation tissues, resulting in a sharp increase in endogenous PAs to a toxic level leading to root growth inhibition. Therefore, root growth inhibition in this study could possibly be related to a high concentration of IAA and/or PAs in the LOFs, as well as hormonal crosstalk between IAA and PAs.

4.3. LOFs Alleviated Salt-Stress Impact on Growth and Physiology of Rice

The application of LOFs as foliar spray significantly enhanced the growth of rice under both non-stress and salt-stress conditions (Figure 7). Growth enhancement could be related to the significant increase in chlorophyll contents (Figure 8) and net photosynthesis rates (Figure 9) consistent with previous reports in rice [56,57]. Increased chlorophyll contents enhanced the light-harvesting efficiency, net photosynthesis rates (Figure 9), and growth (Figure 7), as reviewed by Gitelson et al. [58]. The beneficial roles of LOFs could be associated with the presence of plant growth-promoting hormones, including IAA, GA, and polyamines (Figure 3 and Figure 4). Plants respond to salinity by an accumulation of endogenous PAs (particularly Spd and Spm), which exert their functions through many different mechanisms, including osmotic adjustment, modulating ion transporters and channels to maintain K+/Na+ homeostasis, activating antioxidant enzymes, and interacting with other plant hormones, thus leading to an enhancement of salt tolerance [15,59,60]. However, the pattern of changes in endogenous Put, Spd, and Spm in response to salinity varied depending on plant species or even different varieties in the same species. In a study involving eighteen rice cultivars, Do et al. [61] found strikingly different patterns of change in PA contents between salt-tolerant and salt-sensitive cultivars. In response to salt stress, the tolerant cultivars displayed an increase in Put, Spd, and Spm (the most prominent increase in Spm), while the sensitive cultivars showed dramatic reductions in Put and a slight reduction in Spd but an increase in Spm. The cultivar used in this study, KDML105, is classified as salt-sensitive. The comparison between CK plants (0 mM NaCl) with salt stress CK plants (100 mM NaCl) in Figure 11 revealed that salt stress resulted in a dramatic reduction in endogenous Put (Figure 11A,B), a small decrease in Spd (Figure 11C,D) and a significant increase in Spm (Figure 11E,F). This pattern of modulation of PA metabolism under salt stress was consistent with the results obtained by Do et al. [61] in salt-sensitive cultivars and Islam [57] in Nipponbare, another salt-sensitive cultivar. In response to salt stress, Put is converted to Spd and then to Spm, resulting in an increased Spm. A higher endogenous level of Spd/Spm compared to Put is an important indicator of salt tolerance [57,60].
Application of exogenous PAs to rice in the form of seed priming [59,62], foliar spray [63], or root immersion in hydroponics [56,64] was reported to improve salinity tolerance. Among the three most common PAs in plant cells, Spd and Spm were reported to effectively alleviate salt-stress damage in rice, both when applied exogenously and when their endogenous levels were raised under salt stress [56,57,61,65,66]. Among the three LOFs, SOF and MOF, which contained higher concentrations of Spd (Figure 4C), tended to promote higher chlorophyll contents (Figure 8B) and boosted photosynthetic performance (Figure 9A,B), resulting in slightly higher shoot growth (Figure 7B) than BOF. Stimulation of chlorophyll biosynthesis and photosynthesis under salt stress by exogenous Spd and/or Spm was previously reported to involve activation of chlorophyll biosynthesizing enzymes, stabilization of thylakoid membrane, and enhanced protection of PSII D1 protein [15,17,67]. Higher ratios of (Spd + Spm):Put was reported as a significant indicator of salt tolerance, and conversion of Put to Spd and Spm contributed to rice salt tolerance [16,57].
Rice seedlings subjected to salt stress accumulated a high concentration of proline, which was significantly reduced when sprayed with LOFs and CF (Figure 10). Proline accumulation in rice in response to salt stress was reported to have multiple protective functions, including osmoregulation, protection of protein and cellular structure, scavenging reactive oxygen species, and supplying nitrogen and energy upon stress recovery [68,69]. Application of LOFs and CF effectively alleviated damaging impacts of salt stress by enhancing the photosynthesis system, protecting chloroplast ultrastructure, and activating the antioxidant defense system [20,67], hence reducing the need to utilize proline as a protective molecule.
Significant stimulating effects of LOFs, which are enriched in nutrients, IAA and PAs, on chlorophyll production, photosynthesis, and growth of rice in both control and salt-stress conditions implied the wide range of practical applications of LOFs for rice cultivation. However, further studies in saline rice fields are needed to ensure that LOFs are beneficial at the reproductive stage, leading to yield enhancement and soil improvement. The field experiments should also be performed in multiple years and locations due to variability in salinity levels. Nevertheless, the results from this study suggested the potential of LOFs in sustainable agriculture. Aerial spraying of eco-friendly LOFs at low concentrations could possibly lead to reduced use of chemical fertilizers in rice cultivation. The integrated use of LOFs not only reduces the cost for farmers but also slows down the rate of soil degradation and environmental pollution due to excessive use of chemical fertilizers. Compared with the energy-intensive manufacturing of chemical fertilizers, the production of LOFs uses molasses as a cheap energy source, requires no expensive machinery, and produces almost no toxic pollution. Moreover, the large-scale production of LOFs involves recycling agricultural waste, such as kitchen scraps, and industrial waste, such as soybean meal, which support the Zero Waste Challenge of the Sustainable Development Goals (SDGs).

5. Conclusions

Although soybean and soybean-based LOF (SOF) contained slightly lower content of PAs than mushrooms and mushroom-based LOF (MOF), SOF contained the highest amount of mineral nutrients and IAA and moderate content of PAs (Put and Spd). Brassica-based LOF (BOF), on the other hand, contained the lowest nutrients and PAs. Foliar spraying with diluted solutions of all three LOFs significantly enhanced growth, chlorophyll contents, and net photosynthesis rates of greenhouse-grown rice under both non-stress and salt-stress conditions. The beneficial effects of LOFs could be related to plant growth-promoting properties of IAA, GA, and PAs. The performance of SOF was comparable to that of the chemical fertilizer (CF) and more effective than MOF and BOF. Therefore, soybeans are considered the most suitable material for the production of LOFs containing high mineral nutrients, IAA and PAs.

Supplementary Materials

The following supporting information can be downloaded at: https://www.mdpi.com/article/10.3390/su17073087/s1, Supplementary ANOVA Tables.

Author Contributions

Conceptualization, N.R. and P.T.; methodology, N.R., S.B. and A.D.; validation, N.R. and P.T.; formal analysis, M.N.N. and S.S.; investigation, M.N.N. and S.S.; resources, S.B. and A.D.; data curation, M.N.N.; writing—original draft preparation, N.R., M.N.N. and P.T.; writing—review and editing, N.R., S.B., A.D. and P.T.; visualization, M.N.N. and S.S.; supervision, P.T.; project administration, P.T.; funding acquisition, P.T. All authors have read and agreed to the published version of the manuscript.

Funding

This research was funded by the Research Affairs Division, Khon Kaen University, grant number 11-1231/2562 and RP67-10-001.

Institutional Review Board Statement

Not applicable.

Informed Consent Statement

Not applicable.

Data Availability Statement

Data are available upon request.

Acknowledgments

The authors wish to thank the Faculty of Agriculture, Khon Kaen University, for supporting the greenhouse facility.

Conflicts of Interest

The authors declare no conflicts of interest.

Abbreviations

The following abbreviations are used in this manuscript:
LOFLiquid organic fertilizer
BOFBrassica-based fertilizer
MOFMushroom-based fertilizer
SOFSoybean-based fertilizer
CFChemical fertilizer
ECElectrical conductivity
IAAIndole acetic acid
GAGibberellic acid
PAPolyamine
PutPutrescine
SpdSpermidine
SpmSpermine
PGPBPlant growth-promoting bacteria
NFBNitrogen-fixing bacteria
PSBPhosphorus solubilizing bacteria
KSBPotassium solubilizing bacteria
GIGermination index
VIVigor index
CKControl without fertilizer
DATDays after NaCl treatment
DRWDried root weight
DSWDried shoot weight
PnNet photosynthesis rate

References

  1. Liu, Y.; Lan, X.; Hou, H.; Ji, J.; Liu, X.; Lv, Z. Multifaceted ability of organic fertilizers to improve crop productivity and abiotic stress tolerance: Review and perspectives. Agronomy 2024, 14, 1141. [Google Scholar] [CrossRef]
  2. Culas, R.J.; Anwar, M.R.; Maraseni, T.N. A framework for evaluating benefits of organic fertilizer use in agriculture. J. Agric. Food Res. 2025, 19, 101576. [Google Scholar] [CrossRef]
  3. Wang, L.; Sun, X.; Li, S.; Zhang, T.; Zhang, W.; Zhai, P. Application of organic amendments to a coastal saline soil in North China: Effects on soil physical and chemical properties and tree growth. PLoS ONE 2014, 98, e89185. [Google Scholar] [CrossRef] [PubMed]
  4. Wichern, F.R.; Islam, M.; Hemkemeyer, M.; Watson, C.; Joergensen, R. Organic amendments alleviate salinity effects on soil microorganisms and mineralisation processes in aerobic and anaerobic paddy rice soils. Front. Sustain. Food Syst. 2020, 4, 30. [Google Scholar] [CrossRef]
  5. Zayed, B.A.; Elkhoby, W.M.; Salem, A.K.; Ceesay, M.; Uphoff, N.T. Effect of integrated nitrogen fertilizer on rice productivity and soil fertility under saline soil conditions. J. Plant Biol. Res. 2013, 2, 14–24. [Google Scholar]
  6. Litardo, R.C.M.; Bendezú, S.J.G.; Zenteno, M.D.C.; Pérez-Almeida, I.B.; Parismoreno, L.L.; García, E.D.L. Effect of mineral and organic amendments on rice growth and yield in saline soils. J. Saudi Soc. Agric. Sci. 2022, 21, 29–37. [Google Scholar] [CrossRef]
  7. Phibunwatthanawong, T.; Riddech, N. Liquid organic fertilizer production for growing vegetables under hydroponic condition. Int. J. Recycl. Org. Waste Agric. 2019, 8, 369–380. [Google Scholar] [CrossRef]
  8. Rengasamy, K.R.R.; Kulkarni, M.G.; Papenfus, H.B.; Van Staden, J. Quantification of plant growth biostimulants, phloroglucinol and eckol, in four commercial seaweed liquid fertilizers and some by-products. Algal Res. 2016, 20, 57–60. [Google Scholar] [CrossRef]
  9. Martinez-Alcantara, B.; Marinez-Cuenca, M.-R.; Bermejo, A.; Legaz, F.; Quiñones, A. Liquid organic fertilizers for sustainable agriculture: Nutrient uptake of organic versus mineral fertilizers in citrus trees. PLoS ONE 2016, 11, e0161619. [Google Scholar] [CrossRef]
  10. Vinoth, S.; Sundari; Gurusaravanan, P.; Sivakumar, S.; Siva, G.; Kumar, G.P.; Manju; Velmurugan, K.; Lakshminarayana, V.; Jayabalan, N. Evaluation of seagrass liquid extract on salt stress alleviation in tomato plants. Asian J. Plant Sci. 2017, 16, 172–183. [Google Scholar] [CrossRef]
  11. Sunaryo, Y.; Purnomo, D.; Darini, M.T.; Cahyani, V.R. Nutrients content and quality of liquid fertilizer made from goat manure. J. Phys. Conf. Ser. 2018, 1022, 012053. [Google Scholar] [CrossRef]
  12. Widjajanto, D.W.; Purbajanti, E.D.; Sumarsono; Utama, C.S. The role of local microorganisms generated from rotten fruits and vegetables in producing liquid organic fertilizer. J. Appl. Chem. Sci. 2017, 4, 325–332. [Google Scholar] [CrossRef]
  13. Kebrom, T.H.; Woldesenbet, S.; Bayabil, H.K.; Garcia, M.; Gao, M.; Ampim, P.; Awal, R.; Fares, A. Evaluation of phytotoxicity of three organic amendments to collard greens using the seed germination bioassay. Environ. Sci. Pollut. Res. 2019, 26, 5454–5462. [Google Scholar] [CrossRef]
  14. Wong, W.S.; Tan, S.N.; Ge, L.; Chen, X.; Yong, J.W.H. The importance of phytohormones and microbes in biofertilizers. In Bacterial Metabolites in Sustainable Agroecosystem; Maheshwari, D.K., Ed.; Springer International Publishing: Cham, Switzerland, 2015; pp. 105–158. [Google Scholar] [CrossRef]
  15. Biondi, S.; Antognoni, F.; Marincich, L.; Lianza, M.; Tejos, R.; Ruiz, K.B. The polyamine “multiverse” and stress mitigation in crops: A case study with seed priming in quinoa. Sci. Hortic. 2022, 304, 111292. [Google Scholar] [CrossRef]
  16. Amiri, H.; Banakar, M.H.; Hemmati Hassan Gavyar, P. Polyamines: New plant growth regulators promoting salt stress tolerance in plants. J. Plant Growth Regul. 2024, 43, 4923–4940. [Google Scholar] [CrossRef]
  17. Pottosin, I.; Olivas-Aguirre, M.; Dobrovinskaya, O.; Zepeda-Jazo, I.; Shabala, S. Modulation of ion transport across plant membranes by polyamines: Understanding specific modes of action under stress. Front. Plant Sci. 2021, 11, 616077. [Google Scholar] [CrossRef]
  18. Wu, J.; Shu, S.; Li, C.; Sun, J.; Guo, S. Spermidine-mediated hydrogen peroxide signaling enhances the antioxidant capacity of salt-stressed cucumber roots. Plant Physiol. Biochem. 2018, 128, 152–162. [Google Scholar] [CrossRef]
  19. Shabala, S.; Munns, R. Salinity stress: Physiological constraints and adaptive mechanisms. In Plant Stress Physiology; Shabala, S., Ed.; CABI: Allen, TX, USA, 2012; pp. 59–93. [Google Scholar] [CrossRef]
  20. Hassan, N.; Ebeed, H.; Aljaarany, A. Exogenous application of spermine and putrescine mitigate adversities of drought stress in wheat by protecting membranes and chloroplast ultra-structure. Physiol. Mol. Biol. Plants 2020, 26, 233–245. [Google Scholar] [CrossRef]
  21. Atiya Ali, M.; Poortvliet, E.; Strömberg, R.; Yngve, A. Polyamines in foods: Development of a food database. Food Nutr. Res. 2011, 55, 5572. [Google Scholar] [CrossRef]
  22. Walkley, A.; Black, I.A. An examination of the Degtjareff method for determining soil organic matter, and a proposed modification of the chromic acid titration method. Soil Sci. 1934, 37, 29–38. [Google Scholar] [CrossRef]
  23. Sarwar, M.; Arshad, M.; Martens, D.A.; Frankenberger, W.T. Tryptophan-dependent biosynthesis of auxins in soil. Plant Soil 1992, 147, 207–215. [Google Scholar] [CrossRef]
  24. Holbrook, A.A.; Edge, W.J.W.; Bailey, F. Spectrophotometric method for determination of gibberellic acid. Adv. Chem. Ser. 2009, 28, 159–167. [Google Scholar] [CrossRef]
  25. Pedrol, N.; Tiburcio, A.F. Polyamines determination by TLC and HPLC. In Handbook of Plant Ecophysiology Techniques; Roger, M.J.R., Ed.; Kluwer Academic Publishers: Dordrecht, The Netherlands, 2002; pp. 335–363. [Google Scholar] [CrossRef]
  26. Zucconi, F.; Forte, M.; Monaco, A.; De Bertoldi, M. Biological evaluation of compost maturity. Biocycle 1981, 22, 27–29. [Google Scholar]
  27. Arnon, D.I. Copper enzymes in isolated chloroplasts. Polyphenoloxidase in Beta Vulgaris. Plant Physiol. 1949, 24, 1–15. [Google Scholar] [CrossRef]
  28. Bates, L.S.; Waldren, R.P.; Teare, I.D. Rapid determination of free proline for water-stress studies. Plant Soil 1973, 39, 205–207. [Google Scholar] [CrossRef]
  29. Wynne, A.T.; Meyer, J.H. An economic assessment of using molasses and condensed molasses solids as a fertiliser in the South African sugar industry. In Proceedings of the South African Sugar Technology Association, Mount Edgecombe, South Africa, 30 July–2 August 2002; pp. 71–78. [Google Scholar]
  30. Olstorpe, M.; Lyberg, K.; Lindberg, J.E.; Schnürer, J.; Passoth, V. Population diversity of yeasts and lactic acid bacteria in pig feed fermented with whey, wet wheat distillers’ grains, or water at different temperatures. Appl. Environ. Microbiol. 2008, 74, 1696–1703. [Google Scholar] [CrossRef]
  31. Sundberg, C.; Smårs, S.; Jönsson, H. Low pH as an inhibiting factor in the transition from mesophilic to thermophilic phase in composting. Bioresour. Technol. 2004, 95, 145–150. [Google Scholar] [CrossRef]
  32. Kadir, A.A.; Rahman, N.A.; Azhari, N.W. The utilization of Banana Peel in the fermentation liquid in food waste composting. IOP Conf. Ser. Mater. Sci. Eng. 2016, 136, 012055. [Google Scholar] [CrossRef]
  33. Okamoto, A.; Sugi, E.; Koizumi, Y.; Yanagida, F.; Udaka, S. Polyamine content of ordinary foodstuffs and various fermented foods. Biosci. Biotechnol. Biochem. 2009, 61, 1582–1584. [Google Scholar] [CrossRef]
  34. Prachyakij, P.; Charernjiratrakul, W.; Kantachote, D. Improvement in the quality of a fermented seaweed beverage using an antiyeast starter of Lactobacillus plantarum DW3 and partial sterilization. World J. Microbiol. Biotechnol. 2008, 24, 1713–1720. [Google Scholar] [CrossRef]
  35. Pan, I.; Dam, B.; Sen, S.K. Composting of common organic wastes using microbial inoculants. 3 Biotech 2012, 2, 127–134. [Google Scholar] [CrossRef]
  36. Podile, A.; Kishore, G. Plant growth-promoting rhizobacteria. In Plant-Associated Bacteria; Springer: Dordrecht, The Netherlands, 2006; pp. 195–230. [Google Scholar] [CrossRef]
  37. Maheshwari, D.M.; Dheeman, S.; Agarwal, M. Phytohormone-producing PGPR for sustainable agriculture. In Bacterial Metabolites in Sustainable Agroecosystem; Maheshwari, D.K., Ed.; Springer International Publishing: Cham, Switzerland, 2015; pp. 159–182. [Google Scholar] [CrossRef]
  38. Kantachote, D.; Kowpong, K.; Charernjiratrakul, W.; Pengnoo, A. Microbial succession in a fermenting of wild forest noni (Morinda coreia Ham) fruit plus molasses and its role in producing a liquid fertilizer. Electron. J. Biotechnol. 2009, 12, 1–11. [Google Scholar] [CrossRef]
  39. Shirasawa, H.; Nishiyama, C.; Hirano, R.; Koyanagi, T.; Okuda, S.; Takagi, H.; Kurihara, S. Isolation of the high polyamine-producing bacterium Staphylococcus epidermidis FB146 from fermented foods and identification of polyamine-related genes. Biosci. Microbiota Food Health 2023, 42, 24–33. [Google Scholar] [CrossRef] [PubMed]
  40. Handa, A.K.; Fatima, T.; Mattoo, A.K. Polyamines: Bio-molecules with diverse functions in plant and human health and disease. Front. Chem. 2018, 6, 10. [Google Scholar] [CrossRef]
  41. Zaman, M.Z.; Abu Bakar, F.; Jinap, S.; Bakar, J. Novel starter cultures to inhibit biogenic amines accumulation during fish sauce fermentation. Int. J. Food Microbiol. 2011, 145, 84–91. [Google Scholar] [CrossRef]
  42. Latorre-Moratalla, M.L.; Bover-Cid, S.; Veciana-Nogués, M.T.; Vidal-Carou, M.C. Control of biogenic amines in fermented sausages: Role of starter cultures. Front. Microbiol. 2012, 3, 169. [Google Scholar] [CrossRef]
  43. Jin, Y.H.; Lee, J.H.; Park, Y.K.; Lee, J.-H.; Mah, J.-H. The occurrence of biogenic amines and determination of biogenic amine-producing lactic acid bacteria in Kkakdugi and Chonggak Kimchi. Foods 2019, 8, 73. [Google Scholar] [CrossRef]
  44. Tiquia, S.M.; Tam, N.F.Y.; Hodgkiss, I.J. Effects of composting on phytotoxicity of spent pig-manure sawdut litter. Environ. Pollut. 1996, 93, 249–256. [Google Scholar] [CrossRef]
  45. Warman, P.R. Evaluation of seed germination and growth tests for assessing compost maturity. Compost Sci. Util. 1999, 7, 33–37. [Google Scholar] [CrossRef]
  46. Selim, S.M.; Zayed, M.S.; Houssam, M.A. Evaluation of phytotoxicity of compost during composting process. Nat. Sci. 2012, 10, 69–77. [Google Scholar]
  47. Irik, H.A.; Bikmaz, G. Effect of different salinity on seed germination, growth parameters and biochemical contents of pumpkin (Cucurbita pepo L.) seeds cultivars. Sci. Rep. 2024, 14, 6929. [Google Scholar] [CrossRef] [PubMed]
  48. Hepsibha, B.T.; Tha, A.G. Revealing the non-phytotoxic effect of gunapaselam (fermented fish waste) by a dose dependent in vitro study. Int. J. Pharma Bio Sci. 2017, 8, 643–648. [Google Scholar] [CrossRef]
  49. Jagadabhi, P.S.; Wani, S.P.; Kaushal, M.; Patil, M.; Vemula, A.K.; Rathore, A. Physico-chemical, microbial and phytotoxicity evaluation of composts from sorghum, finger millet and soybean straws. Int. J. Recycl. Org. Waste Agric. 2019, 8, 279–293. [Google Scholar] [CrossRef]
  50. Tanimoto, E. Regulation of root growth by plant hormones—Roles for auxin and gibberellin. Crit. Rev. Plant Sci. 2005, 24, 249–265. [Google Scholar] [CrossRef]
  51. Alcázar, R.; Bueno, M.; Tiburcio, A.F. Polyamines: Small amines with large effects on plant abiotic stress tolerance. Cells 2020, 9, 2373. [Google Scholar] [CrossRef]
  52. Mirza, J.I.; Bagni, N. Effects of exogenous polyamines and difluoromethylornithine on seed germination and root growth of Arabidopsis thaliana. Plant Growth Regul. 1991, 10, 163–168. [Google Scholar] [CrossRef]
  53. Farooq, M.; Basra, S.M.A.; Rehman, H.; Hussain, M. Seed priming with polyamines improves the germination and early seedling growth in fine rice. J. New Seeds 2008, 9, 145–155. [Google Scholar] [CrossRef]
  54. Afzal, I.; Munir, F.; Ayub, C.M.; Basra, S.M.A.; Hameed, A.; Nawaz, A. Changes in antioxidant enzymes, germination capacity and vigour of tomato seeds in response of priming with polyamines. Seed Sci. Technol. 2009, 37, 765–770. [Google Scholar] [CrossRef]
  55. Jang, S.J.; Choi, Y.J.; Park, K.Y. Effects of polyamines on shoot and root development in arabidopsis seedlings and carnation cultures. J. Plant Biol. 2002, 45, 230–236. [Google Scholar] [CrossRef]
  56. Saleethong, P.; Sanitchon, J.; Kong-ngern, K.; Theerakulpisut, P. Pretreatment with spermidine reverses inhibitory effects of salt stress in two rice (Oryza sativa L.) cultivars differing in salinity tolerance. Asian J. Plant Sci. 2011, 10, 245–254. [Google Scholar] [CrossRef]
  57. Islam, A.; Pang, J.; Meng, F.; Li, Y.; Xu, N.; Yang, C.; Liu, J. Putrescine, spermidine, and spermine play distinct roles in rice salt tolerance. J. Integr. Agric. 2020, 19, 643–655. [Google Scholar] [CrossRef]
  58. Gitelson, A.A.; Peng, Y.; Viña, A.; Arkebauer, T.; Schepers, J.S. Efficiency of chlorophyll in gross primary productivity: A proof of concept and application in crops. J. Plant Physiol. 2016, 201, 101–110. [Google Scholar] [CrossRef] [PubMed]
  59. Paul, S.; Roychoudhury, A. Seed priming with spermine and spermidine regulates the expression of diverse groups of abiotic stress-responsive genes during salinity stress in the seedlings of indica rice varieties. Plant Gene 2017, 11, 124–132. [Google Scholar] [CrossRef]
  60. Shao, J.; Huang, K.; Batool, M.; Idrees, F.; Afzal, R.; Haroon, M.; Noushahi, H.A.; Wu, W.; Hu, Q.; Lu, X.; et al. Versatile roles of polyamines in improving abiotic stress tolerance of plants. Front. Plant Sci. 2022, 13, 1003155. [Google Scholar] [CrossRef]
  61. Do, P.T.; Drechsel, O.; Heyer, A.G.; Hincha, D.K.; Zuther, E. Changes in free polyamine levels, expression of polyaminebiosynthesis genes, and performance of rice cultivars under salt stress: A comparison with responses to drought. Front. Plant Sci. 2014, 5, 182. [Google Scholar] [CrossRef]
  62. Chuntaburee, S.; Sanitchon, J.; Pattanagul, W.; Theerakulpisut, P. Alleviation of salt stress in seedlings of black glutinous rice by seed priming with spermidine and gibberellic acid. Not. Bot. Horti Agrobot. Cluj-Napoca 2014, 42, 405–413. [Google Scholar] [CrossRef]
  63. Theerakulpisut, P.; Madee, P.; Pamuta, D.; Nounjan, N. Exogenous application of spermidine (SPD) and wood vinegar improves salt tolerance in salt-sensitive rice (Oryza sativa L.). Pak. J. Bot. 2021, 53, 1–9. [Google Scholar] [CrossRef]
  64. Ghosh, N.; Das, S.P.; Mandal, C.; Gupta, S.; Das, K.; Dey, N.; Adak, M.K. Variations of antioxidative responses in two rice cultivars with polyamine treatment under salinity stress. Physiol. Mol. Biol. Plants 2012, 18, 301–313. [Google Scholar] [CrossRef]
  65. Roychoudhury, A.; Basu, S.; Sengupta, D.N. Amelioration of salinity stress by exogenously applied spermidine or spermine in three varieties of indica rice differing in their level of salt tolerance. J. Plant Physiol. 2011, 168, 317–328. [Google Scholar] [CrossRef]
  66. Jiang, D.X.; Chu, X.; Li, M.; Hou, J.J.; Tong, X.; Gao, Z.P.; Chen, G.X. Exogenous spermidine enhances salt-stressed rice photosynthetic performance by stabilizing structure and function of chloroplast and thylakoid membranes. Photosynthetica 2020, 58, 61–71. [Google Scholar] [CrossRef]
  67. Ahanger, M.A.; Qin, C.; Maodong, Q.; Dong, X.X.; Ahmad, P.; Abd_Allah, E.F.; Zhang, L. Spermine application alleviates salinity induced growth and photosynthetic inhibition in Solanum lycopersicum by modulating osmolyte and secondary metabolite accumulation and differentially regulating antioxidant metabolism. Plant Physiol. Biochem. 2019, 144, 1–13. [Google Scholar] [CrossRef] [PubMed]
  68. Mansour, M.M.F.; Ali, E.F. Evaluation of proline functions in saline conditions. Phytochemistry 2017, 140, 52–68. [Google Scholar] [CrossRef] [PubMed]
  69. Nguyen, H.T.T.; Das Bhowmik, S.; Long, H.; Cheng, Y.; Mundree, S.; Hoang, L.T.M. Rapid accumulation of proline enhances salinity tolerance in Australian wild rice Oryza australiensis domin. Plants 2021, 10, 2044. [Google Scholar] [CrossRef] [PubMed]
Figure 1. Change in pH (A) and EC (B) in liquid organic fertilizers during 60 days of fermentation. (BOF, brassica-based liquid fertilizer; MOF, mushroom-based liquid fertilizer; SOF, soybean-based liquid fertilizer).
Sustainability 17 03087 g001
Figure 2. Population of total microorganism (A) during 60 days of fermentation and plant growth promoting bacteria (B) in the finished liquid organic fertilizers. Each bar expressed mean ± SD, and means with different letters were significantly different at p < 0.05 (BOF, brassica-based liquid fertilizer; MOF, mushroom-based liquid fertilizer; SOF, soybean-based liquid fertilizer; NFB, nitrogen-fixing bacteria; PSB, phosphorus solubilizing bacteria; KSB, potassium solubilizing bacteria; ns, non-significant).
Sustainability 17 03087 g002
Figure 3. Concentration of indole acetic acid (A) and gibberellic acid (B) in the three liquid organic fertilizers. Each bar expressed mean ± SD, and means with different letters were significantly different at p < 0.05 (BOF, brassica-based liquid fertilizer; MOF, mushroom-based liquid fertilizer; SOF, soybean-based liquid fertilizer; ns, non-significant).
Sustainability 17 03087 g003
Figure 4. Polyamine contents in fresh starting plant materials (A) and concentration of Put (B), Spd (C), and Spm (D) in the three liquid fertilizers during fermentation (B, brassica vegetables; M, mushrooms; S, soaked soybean seeds; BOF, brassica-based liquid fertilizer; MOF, mushroom-based liquid fertilizer; SOF, soybean-based liquid fertilizer; Put, putrescine; Spd, spermidine; Spm, spermine).
Sustainability 17 03087 g004
Figure 5. Effects of liquid organic fertilizers on germination index of tomato (white bar), pakchoi (gray bar), and rice seedling (black bar). Each bar expressed mean ± SD and means with different letters were significantly different at p < 0.05 (BOF, brassica-based liquid fertilizer; MOF, mushroom-based liquid fertilizer; SOF, soybean-based liquid fertilizer).
Sustainability 17 03087 g005
Figure 6. Vigor index (A) and seedlings of tomato (B), pakchoi (C) and rice (D) at 7 days after seed germination in the presence of different dilutions of liquid organic fertilizers: (1) distilled water; (2, 3, 4) 1:10, 1:50 and 1:100 dilution of BOF; (5, 6, 7) 1:10, 1:50 and 1:100 dilution of MOF; (8, 9, 10) 1:10, 1:50 and 1:100 dilution of SOF. Each bar in (A) expressed mean ± SD, and means with different letters were significantly different at p < 0.05.
Sustainability 17 03087 g006
Figure 7. Dried root weight (DRW) (A) and dried shoot weight (DSW) (B) of rice plants treated with water (0 mM) and salt stress (100 mM NaCl) after 14 days. For each group, the bar expressed mean ± SD, and means with different letters were significantly different at p < 0.05. The significant difference (p < 0.01) between means of the non-stressed (0 mM) and salt-stressed (100 mM NaCl) receiving the same fertilizer was indicated by ** (CK, no fertilizer; BOF, brassica-based liquid fertilizer; MOF, mushroom-based liquid fertilizer; SOF, soybean-based liquid fertilizer; CF, chemical fertilizer).
Sustainability 17 03087 g007
Figure 8. Chlorophyll content in the leaf of rice plants after 7 days (A) and 14 days (B) treatment with water (0 mM) and salt stress (100 mM NaCl). For each group, the bar expressed mean ± SD and means with different letters were significantly different at p < 0.05. The significant difference (p < 0.05 or p < 0.01) among the means of the non-stressed (0 mM) and salt-stressed (100 mM NaCl) receiving the same fertilizer was indicated by * or ** (CK, no fertilizer; BOF, brassica-based liquid fertilizer; MOF, mushroom-based liquid fertilizer; SOF, soybean-based liquid fertilizer; CF, chemical fertilizer; ns, non-significant).
Sustainability 17 03087 g008
Figure 9. Effect of liquid organic fertilizers on net photosynthesis rate: (A,B) stomatal conductance (C,D), transpiration rate, and (E,F) water use efficiency (WUE) (G,H) of rice plants after 7 days (A,C,E,G) and 14 days (B,D,F,H) treatment with water (0 mM) and salt stress (100 mM NaCl). For each group, the bar expressed mean ± SD, and means with different letters were significantly different at p < 0.05. The significant difference (p < 0.01) between means of the non-stressed (0 mM) and salt-stressed (100 mM NaCl) receiving the same fertilizer was indicated by ** (CK, no fertilizer; BOF, brassica-based liquid fertilizer; MOF, mushroom-based liquid fertilizer; SOF, soybean-based liquid fertilizer; CF, chemical fertilizer; ns/NS, non-significant).
Sustainability 17 03087 g009
Figure 10. Proline content in the leaf of rice plants after 7 days (A) and 14 days (B) treatment with water (0 mM) and salt stress (100 mM NaCl). For each group, the bar expressed mean ± SD, and means with different letters were significantly different at p < 0.05. The significant difference (p < 0.01) between means of the non-stressed (0 mM) and salt-stressed (100 mM NaCl) receiving the same fertilizer was indicated by ** (CK, no fertilizer; BOF, brassica-based liquid fertilizer; MOF, mushroom-based liquid fertilizer; SOF, soybean-based liquid fertilizer; CF, chemical fertilizer; ns, non-significant).
Sustainability 17 03087 g010
Figure 11. Effect of liquid organic fertilizers on the endogenous contents of Put (A,B), Spd (C,D), and Spm (E,F) in the leaf of rice after 7 days (A,C,E) and 14 days (B,D,F) treatment with water (0 mM) and salt stress (100 mM NaCl). For each group, the bar expressed mean ± SD, and means with different letters were significantly different at p < 0.05. The significant difference (p < 0.01) between means of the non-stressed (0 mM) and salt-stressed (100 mM NaCl) receiving the same fertilizer was indicated by ** (CK, no fertilizer; BOF, brassica-based liquid fertilizer; MOF, mushroom-based liquid fertilizer; SOF, soybean-based liquid fertilizer; CF, chemical fertilizer; Put, putrescine; Spd, spermidine; Spm, spermine; ns/NS, non-significant).
Sustainability 17 03087 g011
Table 1. Nutrient composition in the three groups of original fresh materials and finished fertilizers after 60 days of fermentation.
Original Fresh Materials (Dry Weight)After 60 Days of Fermentation (in Liquid Extraction)
ParametersBrassicaMushroomsSoybeanBOFMOFSOF
Total N (%)0.41 ± 0.013 c0.56 ± 0.03 b0.65 ± 0.006 a0.32 ± 0.02 b0.44 ± 0.10 b0.99 ± 0.11 a
Total P (%)0.07 ± 0.003 b0.10 ± 0.01 a0.05 ± 0.001 c0.06 ± 0.004 b0.1 ± 0.06 a0.11 ± 0.02 a
Total K (%)0.51 ± 0.03 a0.46 ± 0.004 b0.23 ± 0.001 c1.23 ± 0.02 a1.34 ± 0.01 a1.2 ± 0.01 a
Total Na (mg/L)---218 ± 9.8 ab236 ± 28 a182 ± 14 b
OM (%)78.13 ± 3.08 b76.47 ± 1.50 b88.02 ± 1.35 a6.94 ± 0.24 b9.39 ± 1.47 a11.62 ± 1.27 a
OC (%)45.24 ± 1.92 b44.39 ± 0.82 b50.89 ± 2.78 a4.06 ± 0.12 c5.48 ± 0.76 b6.75 ± 0.77 a
C/N107.3 ± 0.46 a 80.4 ± 0.35 b79.2 ± 0.32 c12.96 ± 0.56 a12.77 ± 2.16 a6.87 ± 0.95 b
Mean values ± SD (n = 3) in the same row of each group followed by different letters indicate significant differences at p < 0.05 by the LSD test. (BOF, brassica-based liquid fertilizer; MOF, mushroom-based liquid fertilizer; SOF, soybean-based liquid fertilizer).
Disclaimer/Publisher’s Note: The statements, opinions and data contained in all publications are solely those of the individual author(s) and contributor(s) and not of MDPI and/or the editor(s). MDPI and/or the editor(s) disclaim responsibility for any injury to people or property resulting from any ideas, methods, instructions or products referred to in the content.

