Article

The Integration of a Multidomain Monitoring Platform with Structural Data: A Building Case Study

1
ENEA, Italian National Agency for New Technologies, Energy and Sustainable Economic Development, Via dei Mille, 21, 40121 Bologna, Italy
2
LIS, Live Information System SRL, 60131 Ancona, Italy
3
School of Architecture and Design (SAAD), University of Camerino, 63100 Ascoli Piceno, Italy
4
ENEA, Italian National Agency for New Technologies, Energy and Sustainable Economic Development, Cittadella della Ricerca SS7 km 706, 72100 Brindisi, Italy
5
ENEA, Italian National Agency for New Technologies, Energy and Sustainable Economic Development, CR Casaccia, Via Anguillarese, 301, 00123 Rome, Italy
*
Author to whom correspondence should be addressed.
Sustainability 2025, 17(7), 3076; https://doi.org/10.3390/su17073076
Submission received: 10 February 2025 / Revised: 24 March 2025 / Accepted: 26 March 2025 / Published: 31 March 2025

Abstract

:
In recent years, innovative Non-Destructive Testing (NDT) techniques, applicable for the assessment of existing civil structures, have become available for in situ analysis on Reinforced Concrete (RC) and masonry structures, but they are still not established for regular inspections, especially after seismic events. The damage assessment of RC buildings after seismic events is a very relevant issue in Italy, where most of the structures built in the last 50 years are RC structures. Furthermore, there is also a growing interest in being able to monitor structural health aspects by storing them on the building’s digital twin. For these reasons, it is necessary to develop an affordable and ready-to-use NDT procedure that provides more accurate indications on the real state of damage of reinforced concrete buildings after seismic events and to integrate these data into an interoperable digital twin for automated, optimized building performance monitoring, management, and preventive maintenance. To this end, a case study was conducted on a building in the Marche region in Italy, damaged by the 2016 earthquake. Non-destructive tests were performed and inserted into the LIS platform for the creation of a digital twin of the building. This platform seamlessly manages, visualizes, and analyzes the collected data and integrates various sensor nodes deployed throughout the building. The paper also presents a methodology to simplify the work of the test operator and make the entire process of knowledge of the building faster and more sustainable through a QR-code interface.

1. Introduction

Nowadays it is necessary to rethink the design of the built environment to make it more resilient to the growing threats posed by climatic and natural hazards. Improving the design of the built environment using digital twins offers several compelling benefits, primarily through enhanced efficiency, sustainability, and decision making. Digital twins (DT)—virtual replicas of physical spaces—allow architects, urban planners, and engineers to simulate, analyze, and optimize the design and operation of buildings, cities, and infrastructure. There is also a growing interest in being able to monitor structural health aspects by storing them in the building’s digital twin.
In recent years, the digital world, artificial intelligence, and BIM with integrated sensors are moving very quickly, even if there are few studies about innovative digital techniques incorporating traditional diagnostic approaches. These traditional methods still constitute the basis of the diagnosis of a building, especially after an extreme event, such as an earthquake or fire [1].
Recently, a strong push towards the use of BIM-based procedures and practices in the field of linear transport infrastructures has been addressed [2]. Most of the research, in fact, focuses on digital twins that include survey technologies and non-destructive diagnostic testing of infrastructure, roads, tunnels, and bridges for an increasingly smart management of cities.
In Italy, a series of ministerial decrees [3,4,5] have been approved to encourage the use of BIM-based procedures in the design and management operations of civil works. In such a framework, a novel approach to the management phases of civil works is required, based on different types of data and analyses within an integrated process, making use of digital models of the assets [2].
Some scholars examined the potential of an interoperable and upgradeable BIM model supplemented by ground-based non-destructive survey data for the analysis of the potential distresses identified in a transport infrastructure’s pavement [6]. Other authors implemented a BIM-centered framework that integrates synthetic data generation, data-driven interpretations, and risk management strategies for underground infrastructure maintenance, which can facilitate predictive monitoring for informed decision making [7].
Other research is focused on integrating multidisciplinary surveys for the inspection and characterization of parts of historical building, using BIM technology to make the model available for possible uses in the future, such as facility management, support to conservation activities, rehabilitation interventions, or further research [8]. Analysis methods regarding heritage buildings focus on the integration of conservation information and large-scale environmental analysis data for historic clusters in modern cities [9].
For these reasons, it is necessary and useful to test the reliability of a simple and ready-to-use NDT procedure [10] that provides more accurate indications of the real state of damage of reinforced concrete buildings even after seismic events and integrates these data into an interoperable digital twin for automated and optimized monitoring, management and preventive maintenance of building performance. This is one of the aims of the MULTICLIMACT project, financed by the Horizon Europe program, which involves 25 European partners, including ENEA and Rina Consulting S.p.A. (coordinator) for Italy. The MULTICLIMACT project is dedicated to safeguarding Europe’s built environment against the increasing threats of natural and climatic hazards. Through innovative strategies tested across four pilot sites (Camerino (Italy), Riga (Latvia), Barcellona (Spain), and Roermond (the Netherlands)) with diverse climatic conditions, MULTICLIMACT targets the urgent need for adaptive measures against floods, earthquakes, extreme weather conditions, and heatwaves.
In engineering and science, a fundamental aspect of quantitative analysis involves developing techniques for designing, controlling, and precisely measuring system performance based on well-defined criteria. Central to this process is the creation of models that replicate the behavior of complex systems. Intuitively, a model can be thought of as a device that duplicates the behavior of the system itself [11]. The key question, therefore, is as follows: how can we develop a “device”, or more precisely, a set of interconnected devices, that can accurately replicate the behavior of a building?
By integrating these interconnected devices and creating a mathematical model connected with computational simulations, sensors, and control systems, it becomes feasible to generate a highly accurate digital-to-physical representation of a building. Recognizing this potential, some scholars are moving directly to DT technology and its significant applications in buildings due to its ability to serve as a bridge between the physical and digital worlds. Unlike CAD, which focuses solely on digital design, and IoT, which mainly monitors and collects data from the physical world, DT enables two-way interaction between the two realms. The MULTICLIMACT project is developing an approach that will be a live one throughout its entire life cycle, i.e., it will be continuously updatable and upgradeable, moving from the BIM methodology with digital twinning technology and reaching an intelligent, “live” building state. This abstraction allows us to apply modeling techniques and frameworks commonly used in product design to the development of a DT for buildings. By viewing a building as a unified product or “device” (a set of interconnected devices), we can leverage established product design methodologies to create a DT that effectively represents and interacts with the physical environment. This approach is particularly beneficial because it brings structure and clarity to the complex task of modeling various building systems and their interactions. This not only increases the efficiency and effectiveness of building management but also enhances our capability to monitor, predict, and optimize building operations in real time [12].
By simulating construction processes and identifying potential problems before they occur, DT helps minimize waste, delays, and cost overruns. Virtual prototyping allows materials and systems to be tested prior to actual investment, although it is always necessary to start from a real baseline of building knowledge [13].

2. LIS Platform Design and Development

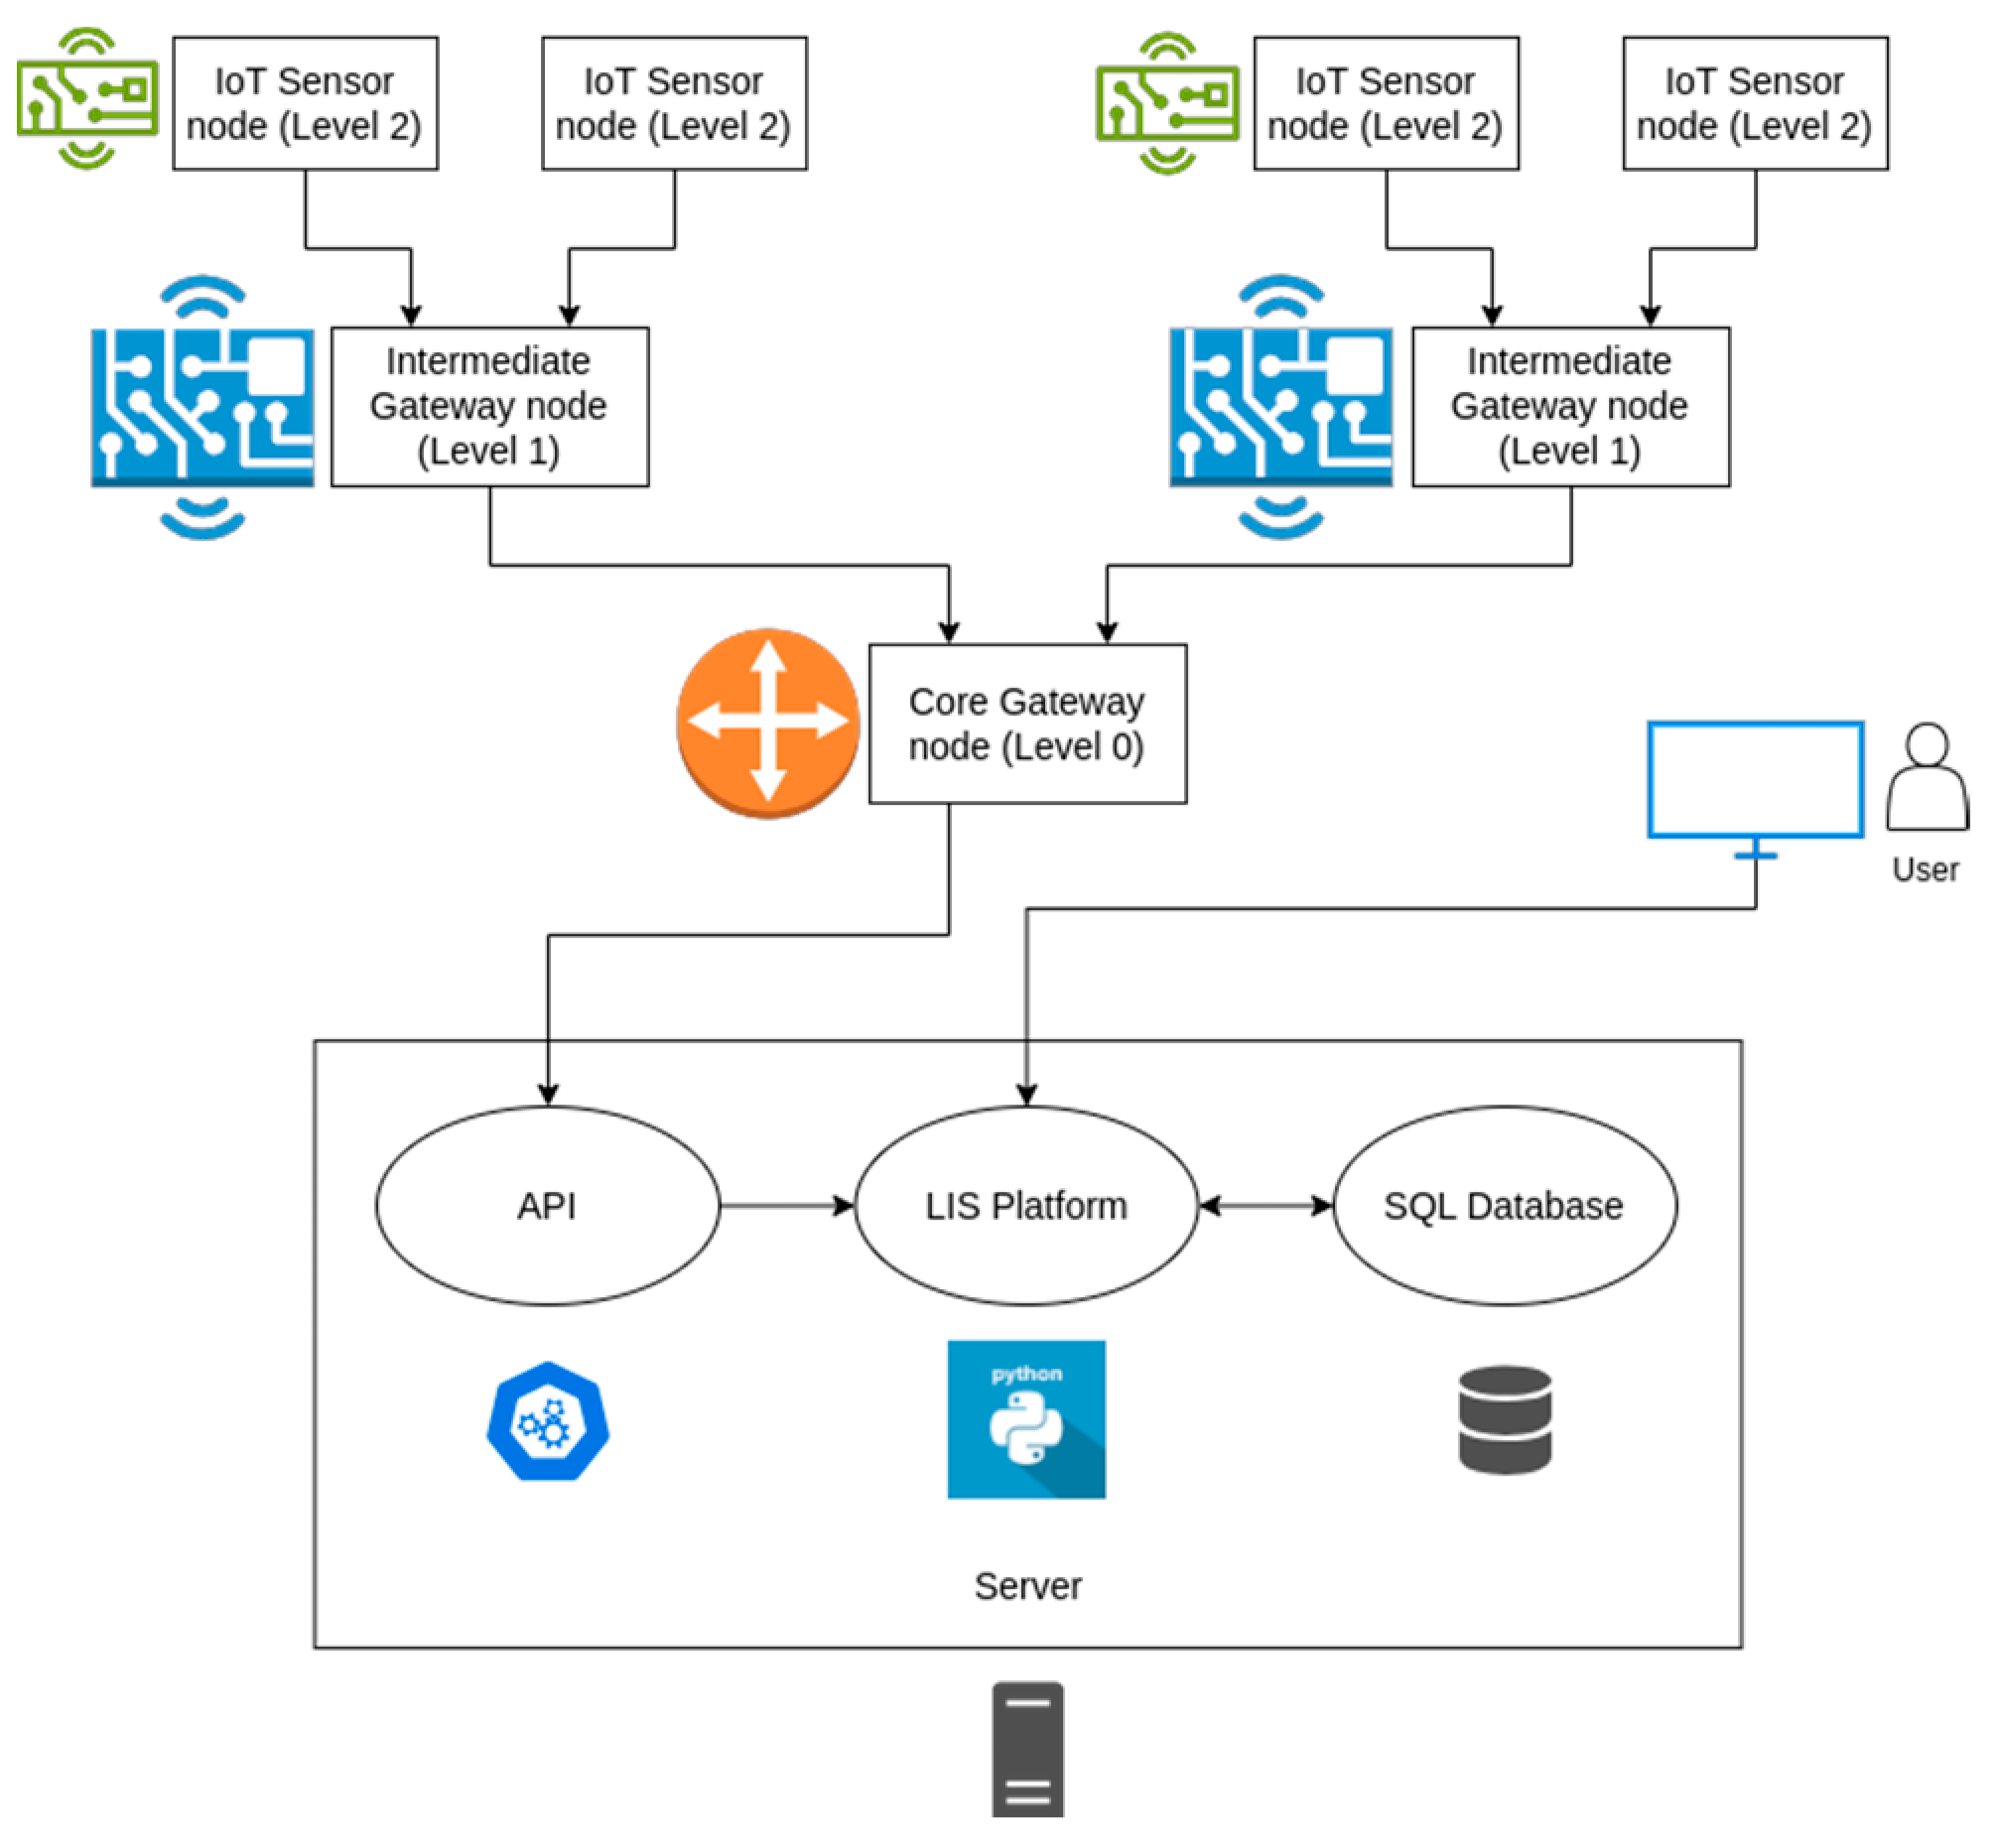
The LIS platform is a comprehensive digital solution utilized within the MULTICLIMACT EU Project as a multidomain monitoring system. It seamlessly manages, visualizes, and analyzes collected data (Figure 1 and Figure 2). It is designed to integrate with various sensor nodes deployed throughout the building (Figure 3). This platform provides a comprehensive overview of structural integrity and insights into areas needing intervention, leveraging a network of IoT (Internet of Things) devices and sensors. Wireless sensors serve as nodes for autonomous data acquisition, forming a Wireless Sensor Network, which is the foundation of the LIS network. The LIS network is delineated distinctly. The LIS platform, encompassing the LIS network, functions similarly to an IoT platform by incorporating all connected IoT devices, rather than focusing solely on the software or interfaces used for device control or sensor monitoring. The software stack runs on a virtualized Ubuntu Linux 24.04 LTS instance, which serves as the base operating system (OS) for the entire LIS platform. All other connected components are also Linux-based systems, including the server hosting the web application and the core and intermediate gateway nodes (explained below). Embedded sensors in various structures enable the creation of “smart structures”, useful in civil and mechanical engineering projects [14]. For building owners and high-level stakeholders, the LIS platform functions as a Smart Building Operating System. It aids in the design and management of energy-efficient, sensor-equipped structures that are safeguarded against natural threats and climatic hazards. By optimizing resources and asset management, it enhances the overall decision-making process. It is also feasible to integrate any kind of sensor as long as there is documentation on how to operate it, such as crack gauges to monitor for crack development with notifications and reports to whom the data may concern.
To facilitate design and development, the architecture was divided into multiple subsystems, as described.

2.1. Gateways

LIS assessed multiple devices for aggregating data from sensor nodes and transmitting it to the LIS platform via an API (Application Programming Interface, a specification through which external parties can interface with the platform). After thorough evaluation, the Raspberry Pi 5 single board computer was selected as the optimal solution. This decision was based on several key factors, including the mature and stable Linux software environment, extensive operating system support, long-term viability, and virtually limitless software customization potential. The OS used is Raspberry Pi OS 64 -bit Kernel version: 6.6 based Debian version: 12 (bookworm).
Additionally, the RPi5 offers built-in Wi-Fi and Bluetooth Low Energy (BLE) connectivity, powered by Infineon’s CYW43455 single-chip combo device. Newer models provide enhanced energy efficiency compared to previous versions. Although the possibility of using a mini PC was explored, it was determined to be unnecessary at the current stage of the project. However, a mini PC may be considered as a potential edge router in future phases.

2.2. Sensor Nodes

Our objective is to utilize devices built on open technological stacks, enabling us to compile custom firmware and leverage well-established standards, such as those widely used on the web, such as HTTP or MQTT (machine-to-machine messaging protocol), over conventional Wi-Fi or BLE networks. At present, the following devices are being tested: the Emotibit, from Connected Future Labs LLC, NY 11377, USA, Arduino SA Mega 2560 R3, from Arduino SRL 20900 Monza MB, Italy, NodeMCU, from Espressif Systems (Shanghai) Co., Ltd. Shanghai, China., and DomX from domX P.C. Thessaloniki 55133 Greece. This approach ensures flexibility in both hardware and software, enabling tailored solutions for specific needs while maintaining compatibility with widely adopted communication frameworks.

2.3. API/Integration

When feasible, we utilized an off-the-shelf MQTT API; alternatively, we developed a custom HTTP-based API to ensure an open technological stack. Although users of the LIS platform can manage multiple devices with a single set of credentials, we opted to implement per-device keys granting access to the API. This approach simplifies key rotation, allowing for easier generation and renewal of encryption keys, and enhances the security of device communication.

2.4. Web Application

The Django framework version 5.1, a Python-based web framework, was selected due to its versatility, robust built-in security features, and extensive documentation. Django, maintained by the Django Software Foundation (an open-source, non-profit organization), enabled the development team to minimize boilerplate code and concentrate on core product functionality. To enhance flexibility, the web application was modularized into several key sections, namely user management (for defining access roles), device management (add/edit/remove devices), BIM upload and interfacing, and security and access control.
For the user interface and user experience (UI/UX) strategy, we adopted a bifold approach. The primary design is optimized for desktop users, while still ensuring mobile accessibility. However, in critical scenarios, such as emergency SOS broadcasts, the UI/UX for mobile devices was prioritized to take advantage of more accurate location data and enhance usability in urgent situations.

2.5. Data Management

From the outset, the decision was made to leverage Django’s Object-Relational Mapping (ORM) to avoid common security pitfalls and ensure database agnosticism—the same code operates seamlessly with the SQLite database as well as with more sophisticated database management systems, like PostgreSQL. The platform generates data internally, such as user event logs, and accepts data entered by users, like facility management events, as well as data received from LIS API. Upon collection, these data are processed for visualization and analysis, including techniques, like clustering. Aligning with our commitment to open technologies, data will be available for export in machine-readable formats, like CSV and JSON, as well as in traditional human-readable formats, like PDF. Access control is designed on a per-user basis with granular permission settings, allowing for finetuned management of data accessibility.

2.6. Mobile App

Two options were evaluated for the mobile application, initially considering a native app to enable key features of the platform. A prototype was developed using Flutter, incorporating interactive BIM visualization and native file management capabilities, which can be installed on Android devices via an installable APK file. However, as web platform APIs were explored more closely, a progressive web app (PWA) became the preferred option due to the maturity of its ecosystem and the extensive range of available features. Additionally, a PWA offers the advantage of developing once and deploying across multiple platforms simultaneously, ensuring broader reach and streamlined maintenance.
In the case study presented here, the LIS platform is integrated with data derived from tests performed in situ on the materials of structural elements for building management and monitoring.

3. In Situ ND Tests: Typologies and Outputs

The onsite investigation begins with preliminary inspections involving visual surveys to compare the plans and the collected documentation with the building and allow a rapid assessment of the construction problem, type, position, and size of the vertical and horizontal structural elements, moisture problems, damage and crack localization, and energy plant type. They play a significant role in identifying the structural elements to be tested, especially regarding their accessibility [13].
During the preliminary investigations, the first non-destructive tests, important for the knowledge of structures, are carried out. It is necessary to determine the performance of the existing buildings to go back to both the construction techniques and the mechanical characteristics of the materials used.
Among the structural investigations, materials analyses performed through non-destructive tests play a key role, as they can be useful during quick inspections for obtaining a preliminary knowledge of the building and to plan subsequent tests on the structure [13]. Non-destructive testing is aimed at establishing a first hypothesis on the causes of degradation of the structure and to correctly direct subsequent tests, on site and in the laboratory, to further narrow the field of analysis. These investigations are useful not only in the preliminary design phase, but also during the construction phases or even later during the testing phases. They are also useful during the life of the building, especially after an extreme event, earthquake, fire, or flood.
In reinforced concrete structures attention is mainly paid to the compressive strength of the concrete and the condition of the embedded reinforcement bars including their location [6].
The most popular non-destructive tests used in RC buildings are reported below, and their usefulness on-site for rapid investigations is discussed.
-
Pachometric test
The pachometric test consists of identifying the presence of reinforcements in reinforced concrete structural elements (beams, columns, walls). These tests allow to define the diameter of the reinforcements, as well as to read, in projections on the concrete surface, the position of the reinforcements to allow an estimate of the size of the concrete cover, the distance between the longitudinal reinforcements, and the stirrups step. The positioning of the bars also allows us to identify the areas without bars to carry out the subsequent tests on the concrete.
-
Thermographic test
Thermography is a type of photography which is based on infrared wavelengths. Thermal imaging relies on radiated energy in the infrared (IR) spectrum which cannot be seen by our eyes. All objects emit radiation energy within the IR spectrum, and this IR radiation can and varies depending on the temperature of that object.
Thermography is very useful for energy diagnosis and for locating conduction thermal defects, ventilation defects, and moisture areas, and often enables the sources of moisture to be identified. It also allows the localization of thermal bridges in different positions of the building’s envelope.
Understanding the defective characteristics of the envelope is essential for reducing the loss of energy and increasing the safety of the building [15].
-
Rebound hammer (RH)
The method consists of measuring the rebound number (R) of a hammer mass striking a steel plunger in contact with the concrete surface with a known force. Schmidt hammer rebound tests can be used to estimate the strength of concrete with calibration curves [16]. Test results can be influenced by many factors, such as the characteristics of the mixture, surface carbonation, moisture condition, rate of hardening, and curing type. Therefore, correction factors must be used to take this effect into account for the existing concrete [17].
-
Ultrasonic pulse velocity (UPV)
This test implies the propagation of an ultrasonic wave (with a frequency generally about 50 kHz) through the material under test. Waves can be transmitted through the thickness of the component (direct method), along the same face (indirect method), or between two adjacent faces (semi-direct method) if two opposite faces are not available [18].
The velocity of propagation is closely correlated with the elastic modulus, which in turn is correlated with the compressive strength. Furthermore, the measurement of the propagation velocity of the ultrasonic pulse allows to determine the uniformity of the concrete and the presence of cracks or voids and casting defects.
The SonReb method arises from the need to estimate the compressive strength of concrete on site while minimizing destructive investigations. To achieve this, the results of two non-destructive tests are combined, namely the ultrasonic wave velocity (SONic) obtained with the ultrasonic test and the rebound index of the rebound hammer test (REBound).
-
Sonic test
The sonic velocity test technique is based on the generation of mechanical impulses with frequencies in the sound field. The sound wave is generated on the element by impacting it with an instrumented hammer and is received by a sensor (piezoelectric accelerator) placed at a different point on the element. To calculate the sonic velocity, it is necessary to measure the travel time of a sonic signal through a surface.
The sonic test is less used than UPV method, but some researchers have investigated the feasibility of adopting the sonic resonance (SR) test to determine the strength parameters of the concrete. Some authors propose using the sonic resonance (SR) test and UPV method simultaneously, thus eliminating the uncertainty of the standalone test and the dispersion of the results [19].
Both methods, i.e., the sonic test and UPV test, must be correlated with the strength estimated in the laboratory on cylindrical specimens extracted in situ (the destructive test).
Measurement on cores is considered to provide reference strength values, which can be used for comparison or calibration. All other methods provide a test result from which a strength value can be derived only through a conversion model [18].
Coring is the main destructive test on reinforced concrete constructions. It consists of taking standardized samples from the structure to determine the mechanical (compressive resistance to crushing) and chemical–physical (composition of the aggregates, quality of the concrete mix) characteristics. On these standardized specimens, first, the carbonation test is performed with the aid of the phenolphthalein colorimetric test; the results will concern the depth of the carbonated material. Subsequently, the same specimen can be subjected to laboratory tests. The specimens are extracted using a portable machine tool capable of extracting cylindrical specimens of a depth and diameter (usually Ø 100 mm) chosen based on the size of the aggregates.
Thus, non-destructive testing plays a very important role in checking structural integrity and safety, and they can be applied in various situations in quick surveys, as follows:
-
To identify structural elements with the same characteristics of the concrete, about velocity values, to plan other tests, and to limit destructive tests [18];
-
When surveying an existing structure in cases where no design documents exist but important changes must be made to the structure (removal of load carrying elements, changes to structural system) [15];
-
For the localization of defects in new structures due to poor construction quality and to elaborate means of compensation;
-
When monitoring of a structure during its lifetime;
-
Knowing the characteristics of the concrete over time allows for a comparison after an extreme event (e.g., an earthquake, fire, or flood).
All the data resulting from the tests are particularly useful in the digital twin, providing the possibility of monitoring the conditions of the building over time, the progress of the work, predicting failures, planning its maintenance, and optimizing energy performance.

4. The Study Case: Palazzo Fazzini

4.1. Building Description

Fazzini College is a reinforced concrete (RC) frame building owned by the University of Camerino, intended for use as a student residence.
Constructed in the early 1970s, the building was not designed according to seismic standards, since the town of Camerino was declared a seismic area only in 1981. The structure includes a partially underground level, five above-ground stories, and a roof, with a total height of approximately 19.20 m, excluding the roof.
The structural configuration is characterized by seismic-resistant frames in one direction only (the N–S one). The columns are cast-in-place with nearly squared cross-sections, while the beams are realized with a partially precast system known as “REP” beam, consisting of a steel lattice girder that is self-supporting during the concrete casting. Such beams are realized in the thickness of the floors (h = 21 cm). The stairs are realized with thin (15 cm) RC cantilever slabs resting only in the perimeter infills of the stairwell without connections to the concrete core of the lift or the perimeter columns of the stairwell.
Figure 4 shows a picture of the building before the occurrence of the 2016 seismic sequence and structural and architectural layouts of Fazzini College.
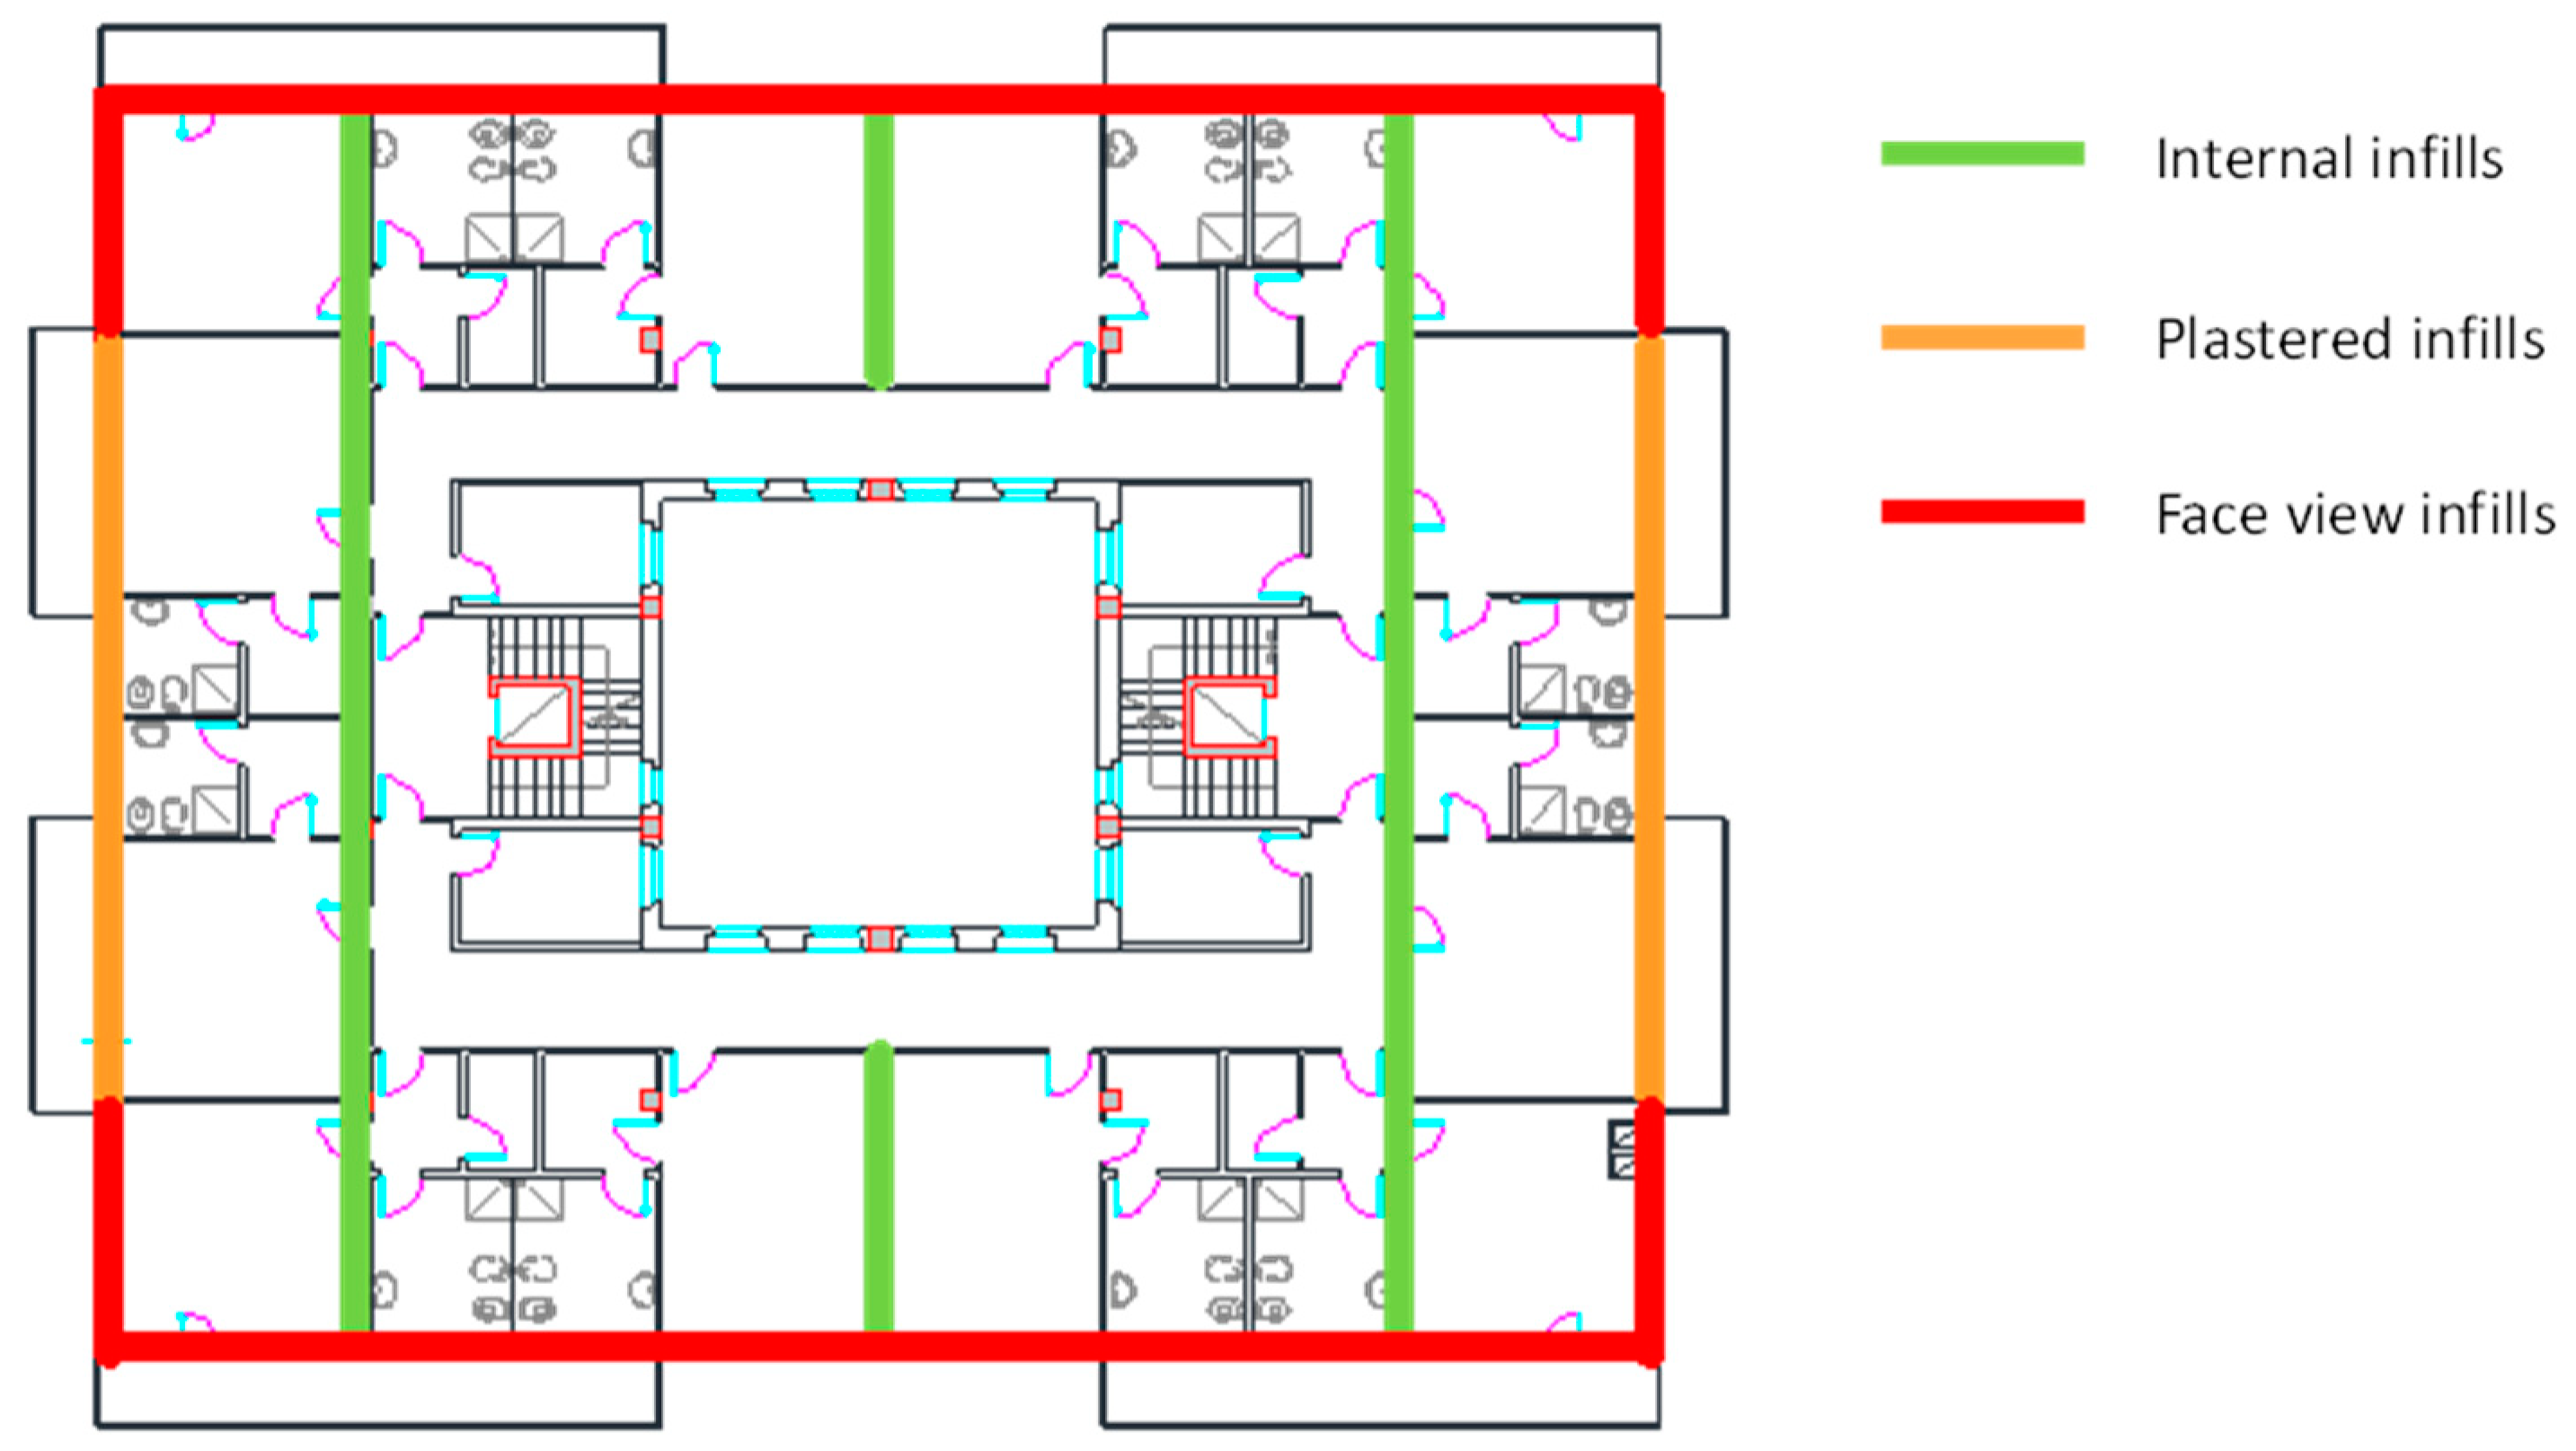
Regarding the infills, whose types and distributions are depicted in Figure 5, there are three main typologies, two for the external partitions and one for the internal ones. Concerning the external perimeter infill walls, it is possible to distinguish between the plastered infills and the “face view” ones. The first typology is realized with an internal leaf of hollow brick (s = 8 cm), a cavity of variable thickness, and an external unconnected leaf realized with thicker hollow bricks (s = 12.5 cm). The “face view” infill is composed of an internal leaf of hollow brick (s = 8 cm), a cavity of variable thickness, and an external unconnected leaf realized with semi-solid bricks (s = 12.5 cm). Finally, the internal infills are realized with a double lining in hollow brick type tile (s = 6 cm), separated by a cavity of variable thickness among the different elevations.
The building was damaged following the 2016 Central Italy seismic events, making it unusable. The damage suffered by Fazzini College occurred mainly during the mainshocks of 26 and 30 October 2016, whose epicenters were, respectively Castelsantangelo sul Nera, near to historical center of Camerino, and Norcia. The damage was mainly concentrated at the lower elevations of the building and was related to external and internal infills partitions walls. Some damage also occurred to the stairs, whose structural conception is quite unusual. Figure 6 shows some pictures of the damage suffered by Fazzini College.
Following the seismic events, a dynamic monitoring system was installed to track the evolution of the building’s damage, based on the assessment of changes in the building’s main vibration frequencies. Two different structural dynamic identifications of Fazzini College have been performed, namely before and after the main events of October 2016, revealing a very significant contribution of non-structural components in terms of stiffness on the modal properties of the building (i.e., fundamental frequencies and modal shapes). The first fundamental frequency, indeed, moved from nearly 3.72 Hz to nearly 2.60 Hz.
For the design of the structural retrofitting with fix base external passive system and to restore the state of safety regarding the seismic demand [20,21], additional tests were carried out for the mechanical characterization of the materials in the main structural elements (beams and columns), and verifications of the main construction details. With reference to the construction details, the arrangements of the steel reinforcement rebars (number, positions, and diameters) have been identified in the main representative structural elements of each floor, including columns, beams, the staircase slab, and the elevator core wall. Table 1 lists the main investigations performed in the building.
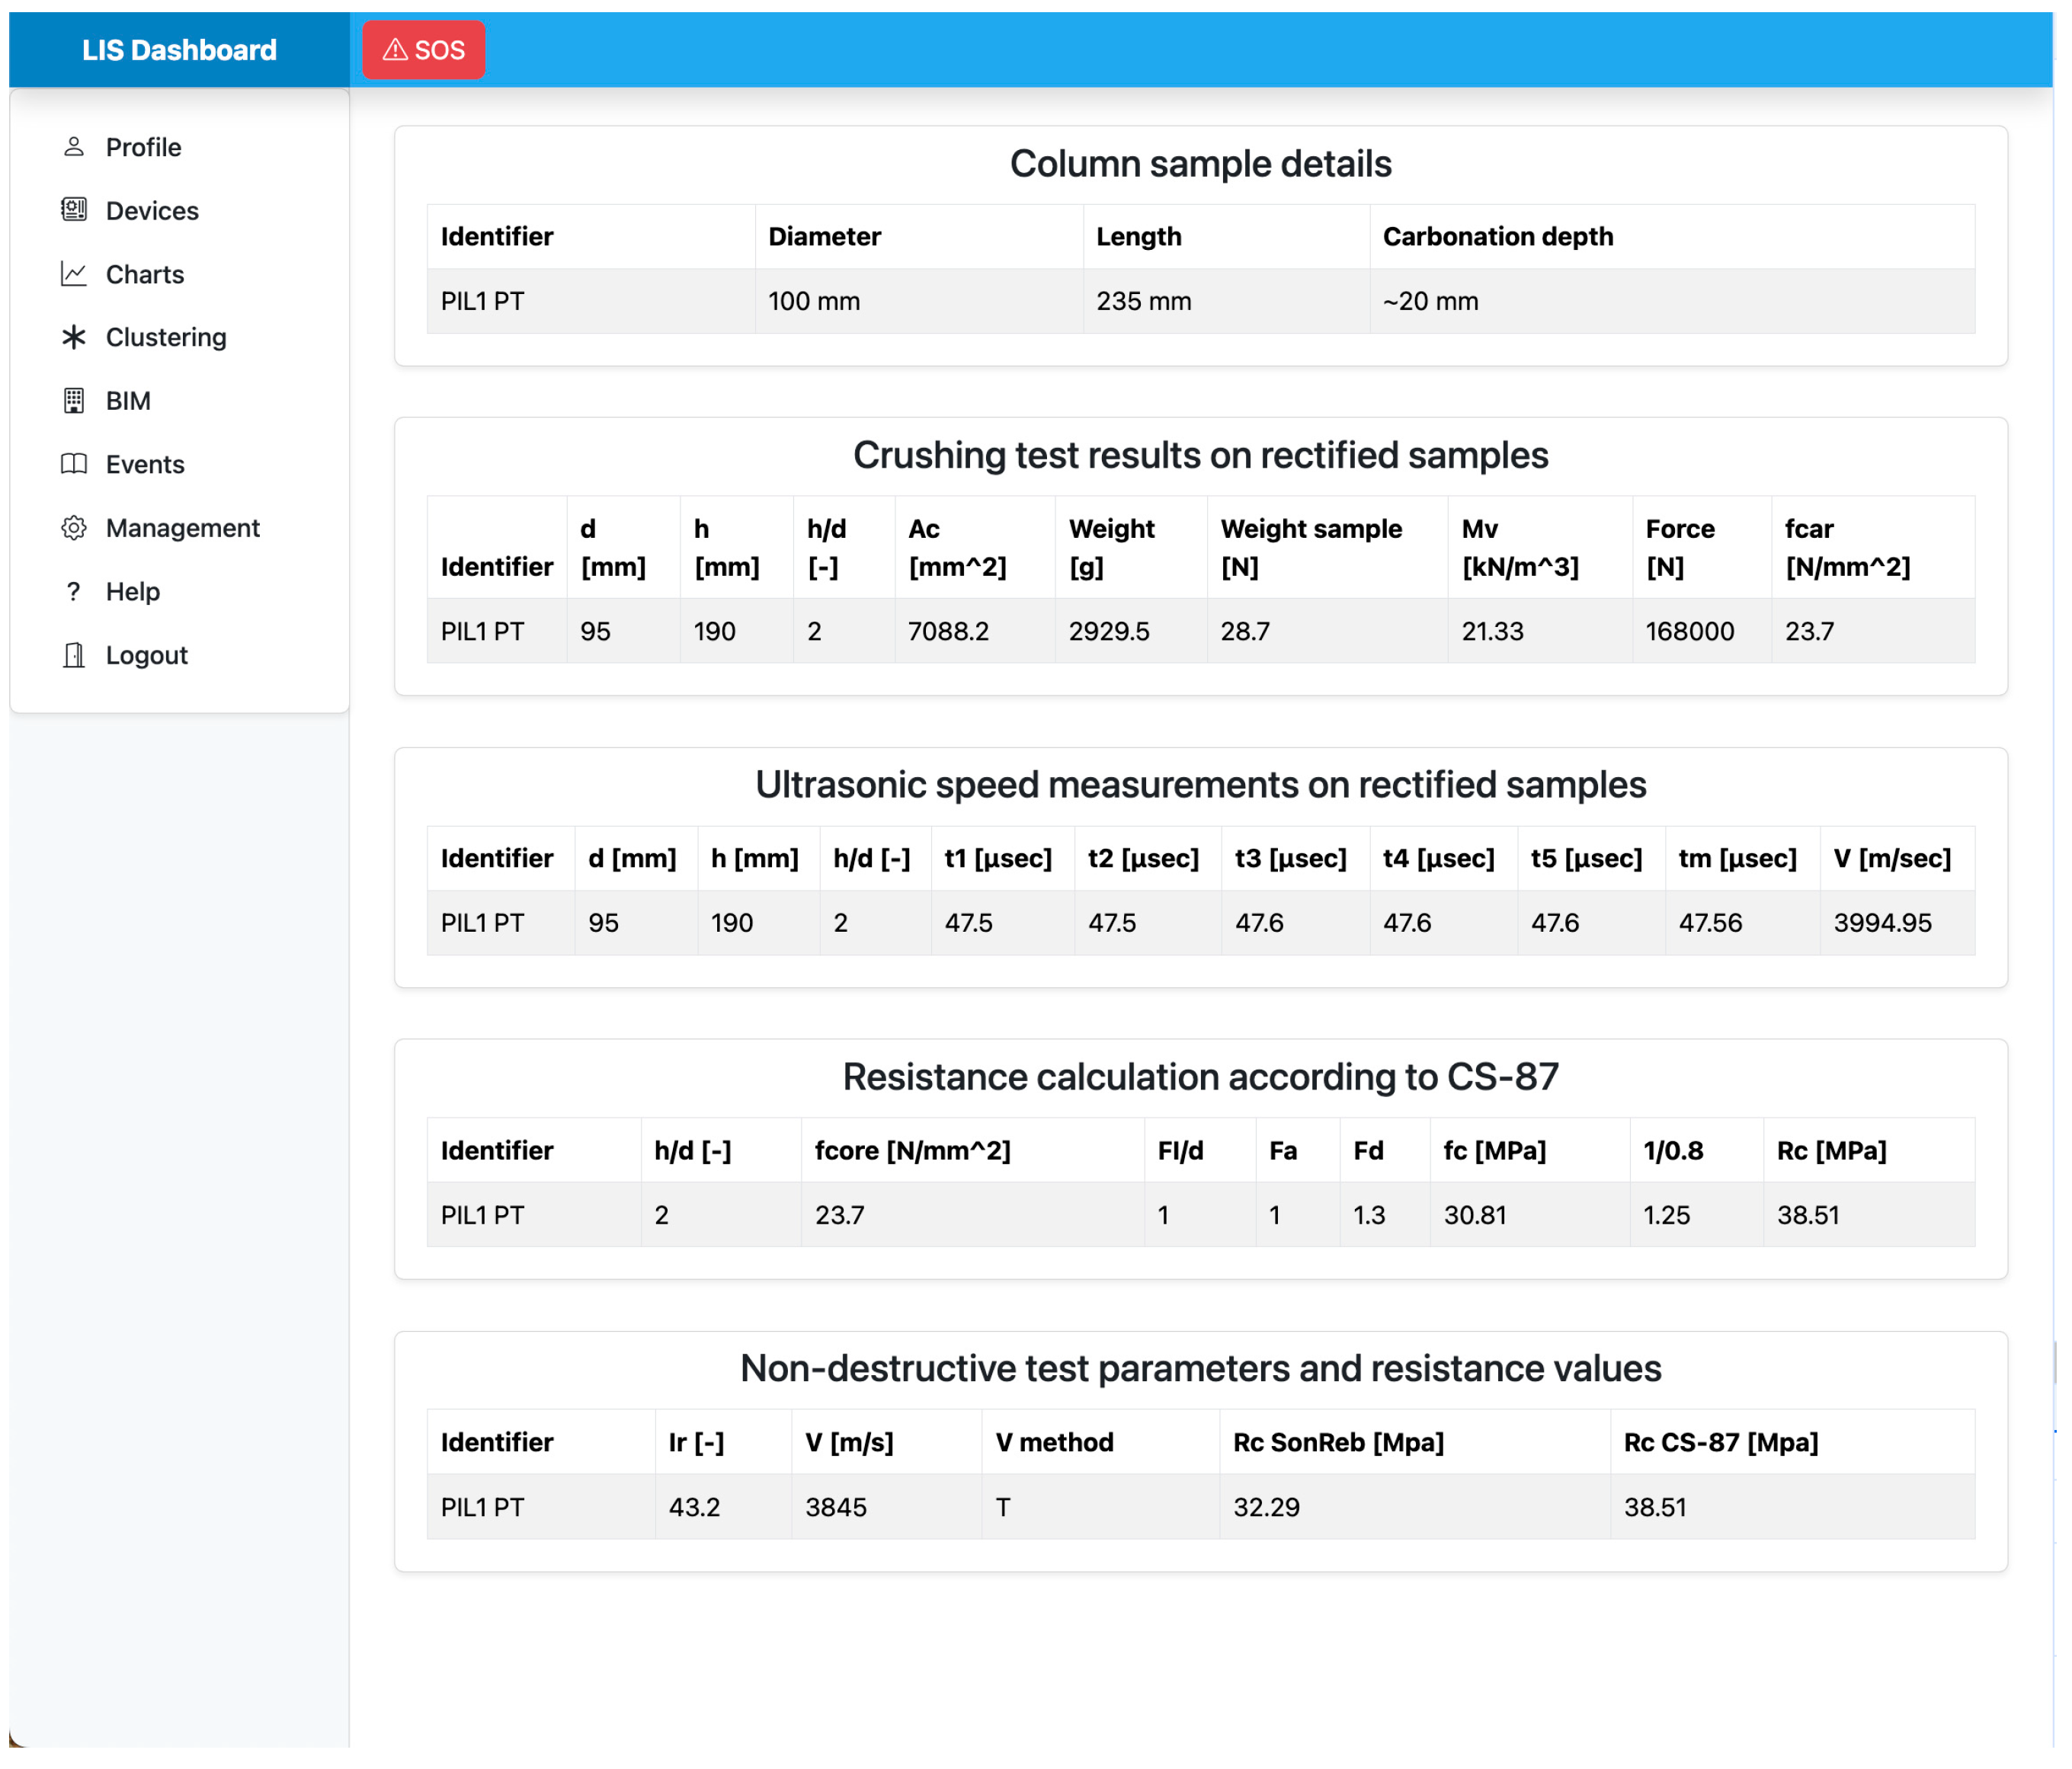
All the data resulting from the tests were entered into the digital twin on the LIS platform to monitor the building over time. As an example, Figure 7 shows a screenshot taken from the platform concerning column 1.
The information intended for integration into the digital BIM model originates from diverse sources, including sensors, IoT devices, users, AECO professionals, and in situ testing. At this stage, the focus has specifically been on integrating information related to the columns, as comprehensive data from non-destructive testing and detailed reports that can be directly associated with these elements is already available. Nonetheless, the primary objective of the LIS platform is the systematic indexing of all building elements along with their corresponding testing data, thereby creating an enriched and comprehensive BIM model. To facilitate this, each building element has been assigned a unique, unguessable, and randomly generated link, enabling the seamless submission of future data or test results without requiring an explicit login to the LIS platform or full access to the BIM model. This placeholder mechanism has already been implemented, ensuring efficient and direct updates of individual objects via these random links.

4.2. ND Tests: Experimental Setup and Results

4.2.1. Test Plan

For the assessment phase of Palazzo Fazzini, the methodology developed in [13] was applied only in relation to the structural part, considering that the building was not habitable and inhabited. Particular attention was paid to the preliminary inspection.
The experimental campaign performed by ENEA aims to determine which structural data to include in the LIS platform. To monitor the building’s health, tests were finalized to collect numbers relevant to following any deterioration in the elastic and mechanical properties of materials over time. The results of the ND tests were considered the most suitable for the purpose, since they are minimally invasive, periodically repeatable, and updatable. With this in mind, the LIS platform represented a smart solution for their storage because it allows the creation of a searchable repository such that the data may be linked to each other and processed by technicians over the years.
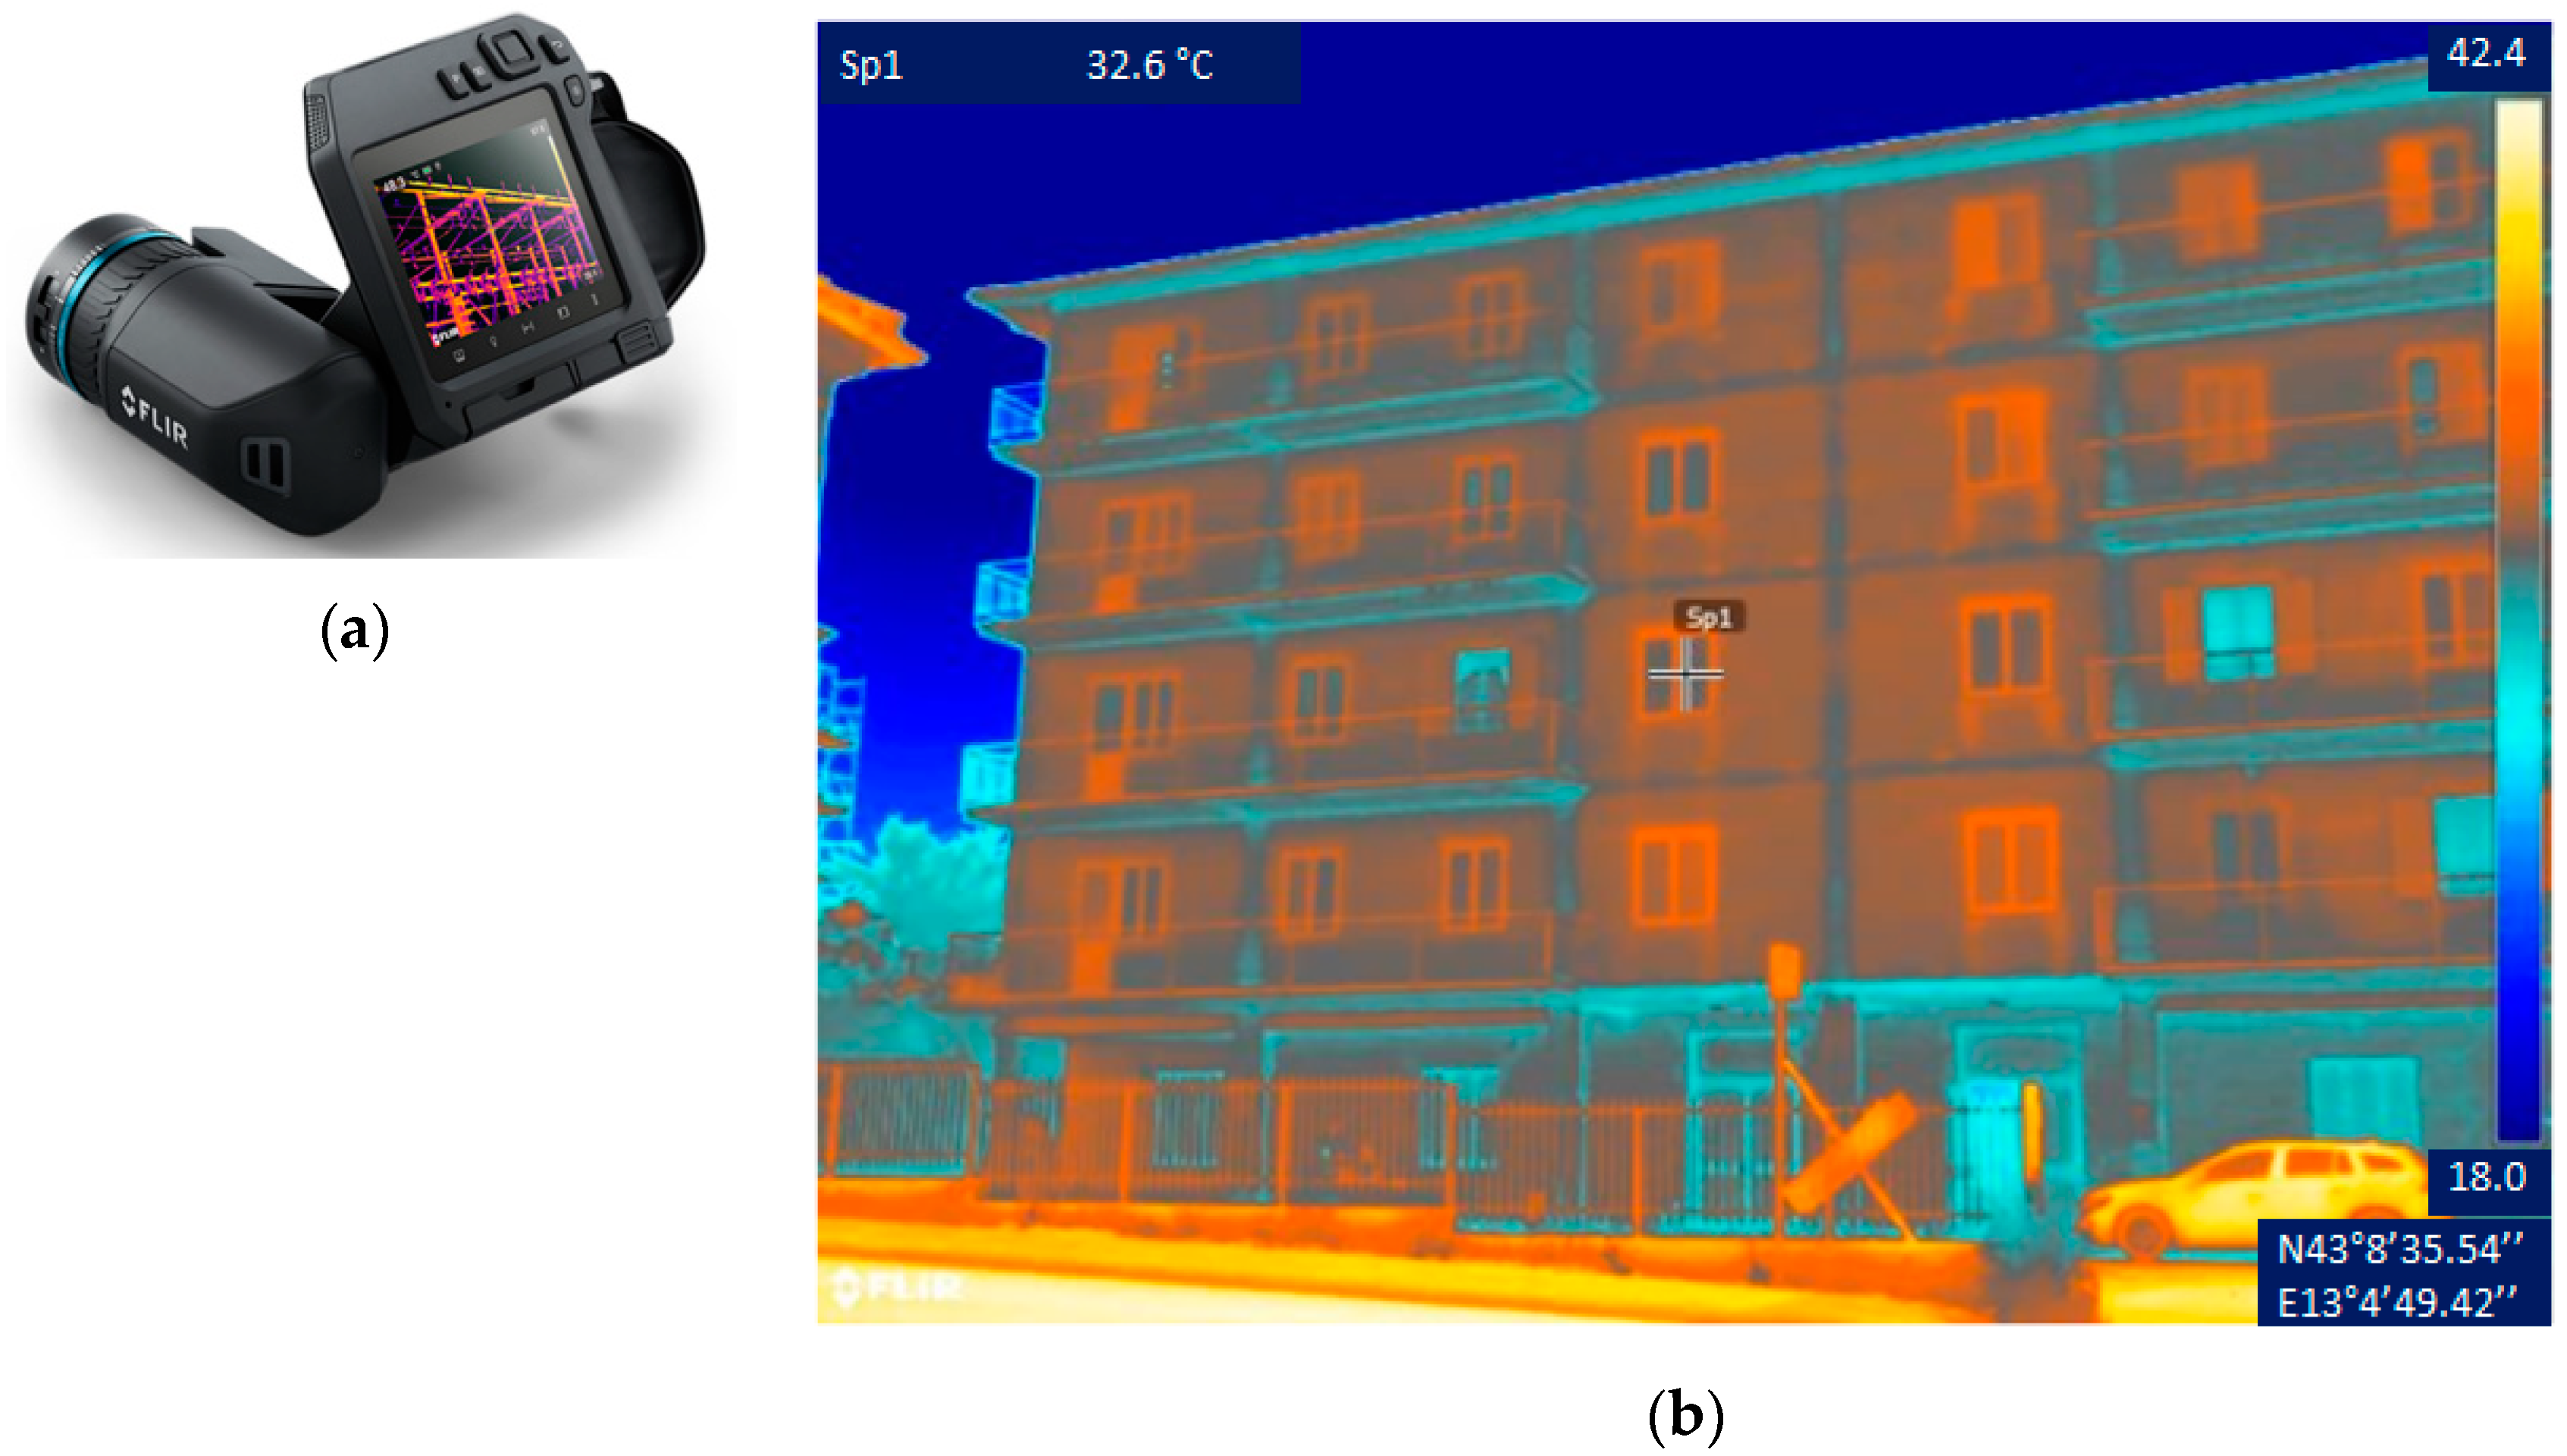
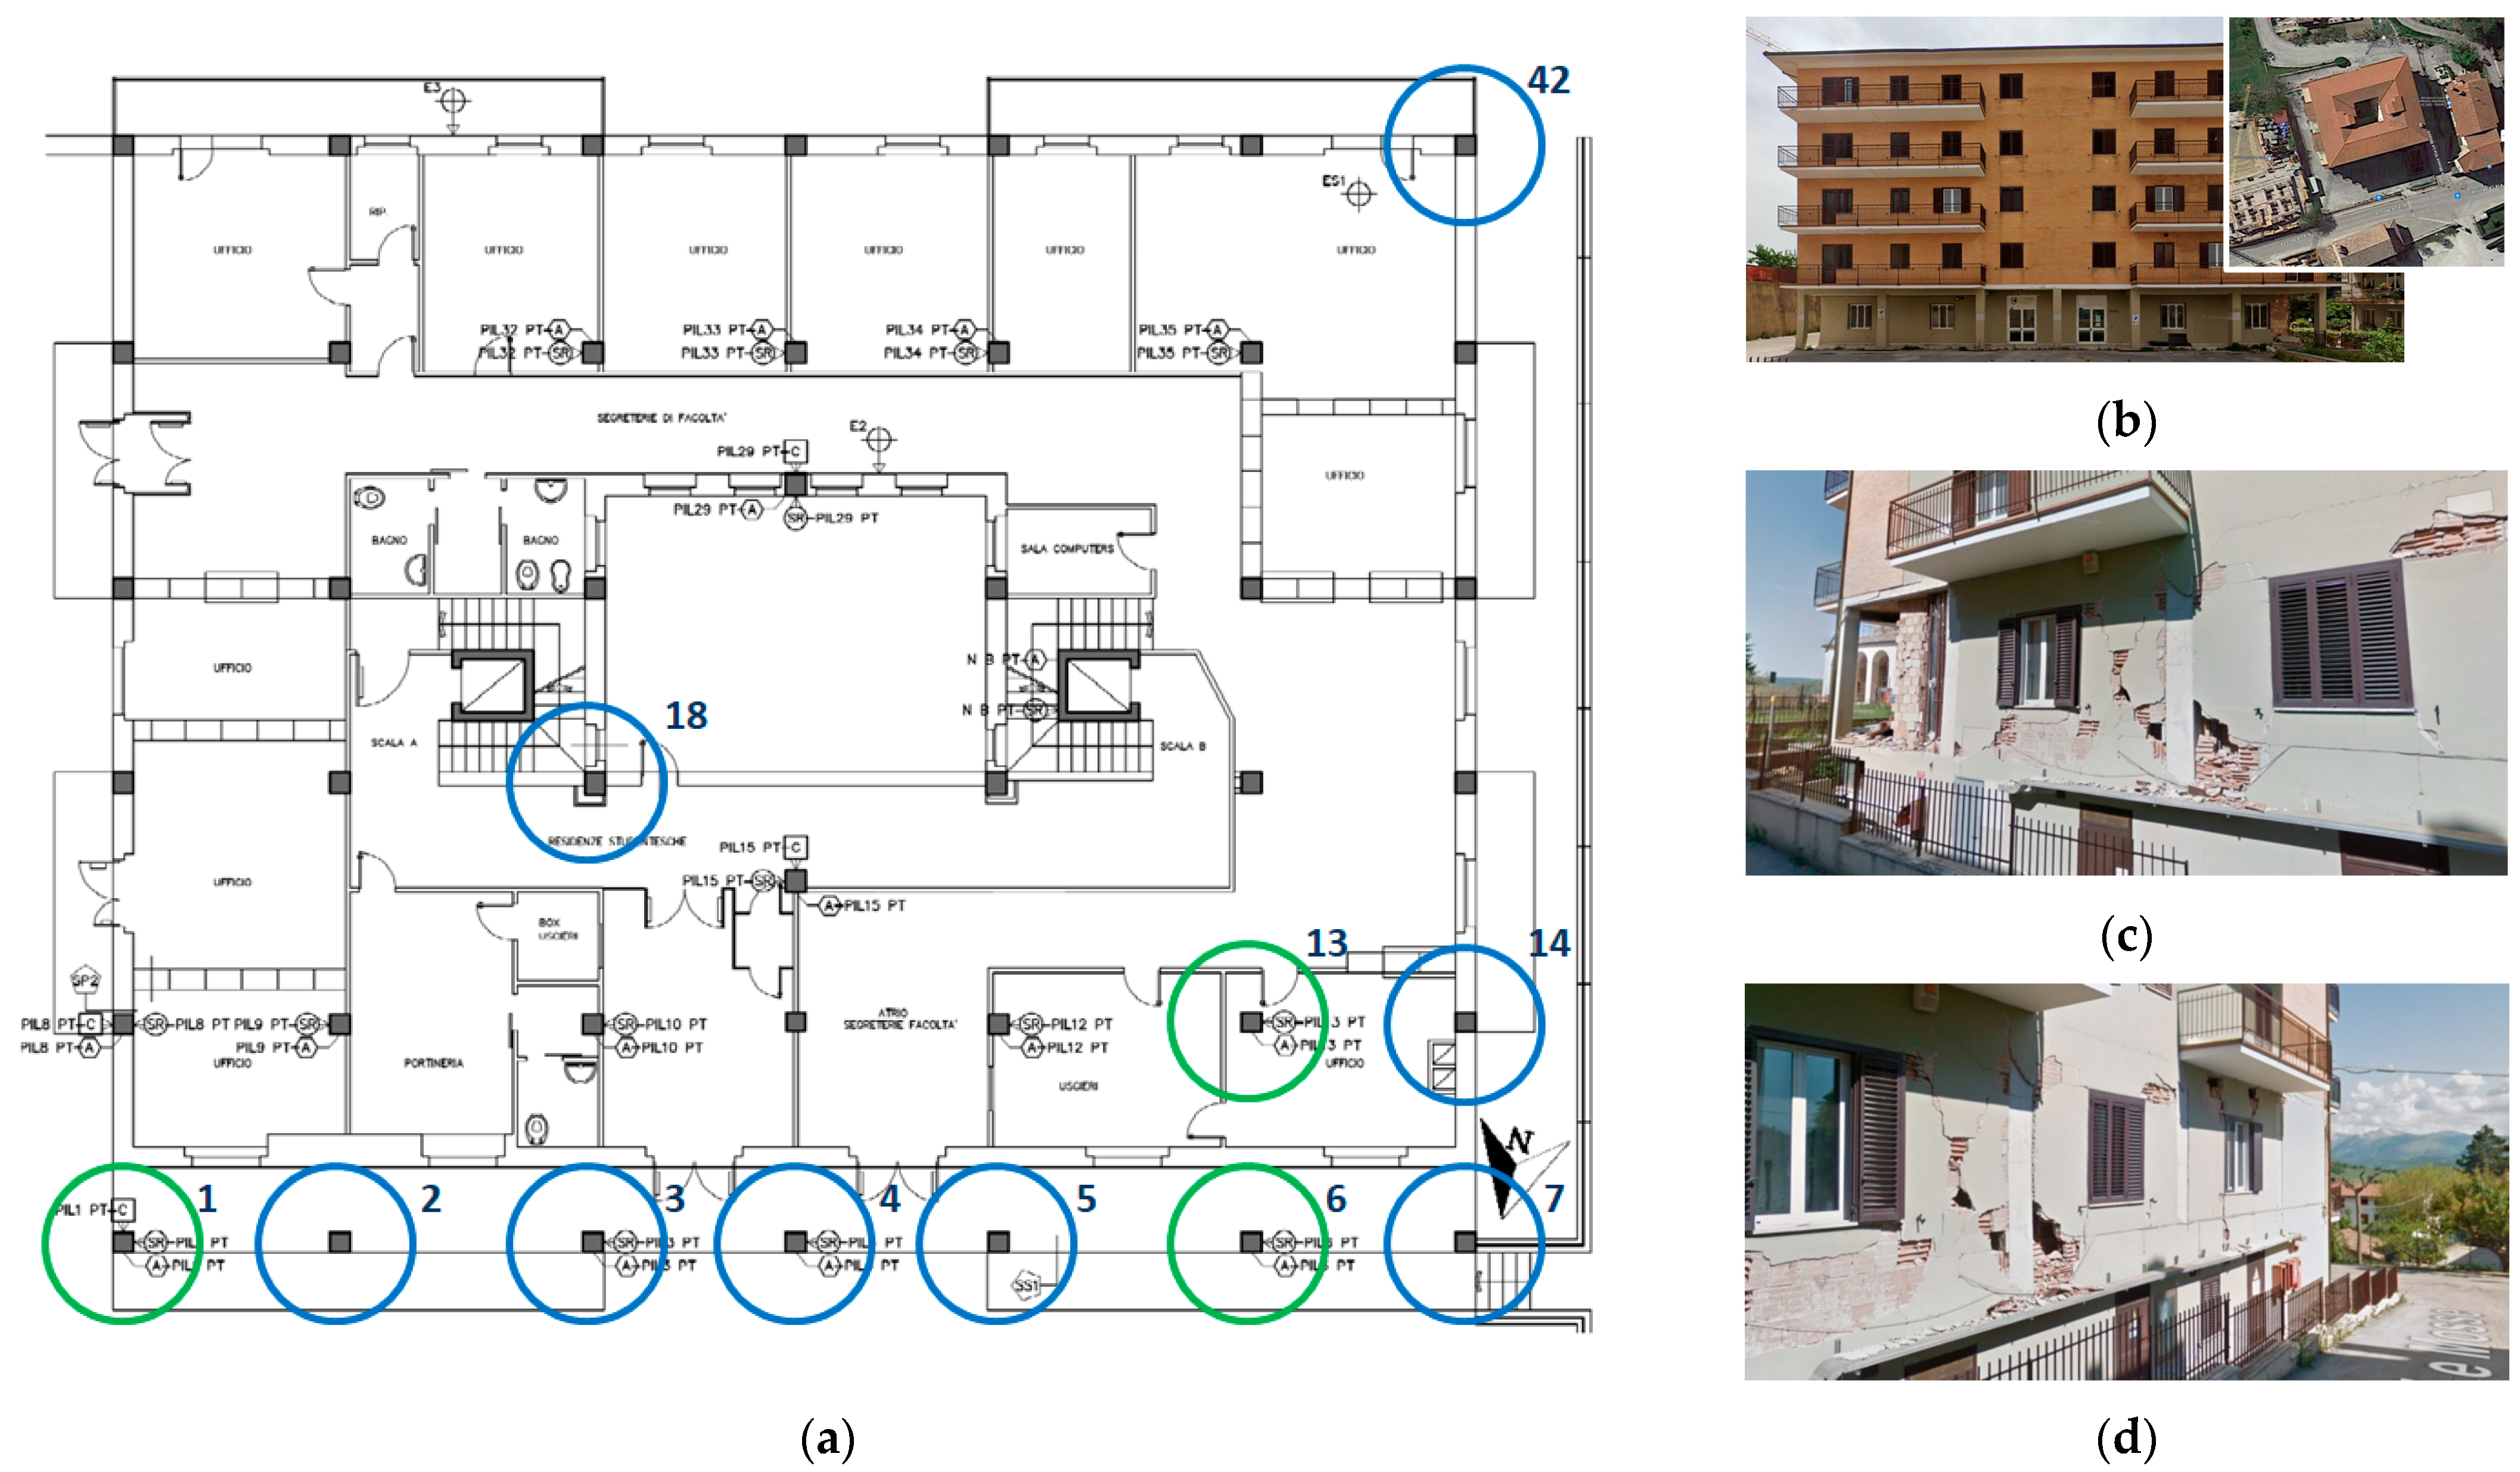
Since the building had been damaged and declared unusable, structural elements to test were selected mainly based on their accessibility, focusing on the columns of the ground floor. A field survey, including visual inspections and thermographic studies, allowed us to recognize the different building materials and any degradation processes, highlighting the thermal differences between parts, without the need for contact probes. The thermographic analyses were conducted through a FLIR T560® (Teledyne FLIR LLC Wilsonville, OR, USA) thermal imaging camera (Figure 8a). This is a camera with a microbolometer detector with a 640 × 480 pixel resolution and a wavelength between 7.5–14 mm. The data were collected in real time, viewed on a built-in 4″ LCD monitor, and recorded on a memory card. An example of the acquired images (thermograms) is given in Figure 8b, where the surface of the heat map (to a depth of approximately 3–4 cm) of the main façade (northward facing) is shown.
The ND tests comprised ultrasonic and sonic techniques preceded by a pacometric survey to search for the reinforcement steel position under the concrete cover (marked with chalk). Details of the experimental setup and main results are given below.
Figure 9a shows the plan of the ground level, where the columns chosen to be tested are highlighted by a circle (the green line indicates both sonic and ultrasonic tests, whereas the blue line indicates sonic tests only). Most of them have all four sides free from infill walls, and, thus, it is possible to perform direct tests. In the case of partially confined columns with adjacent sides uncovered only indirect tests are feasible. In the same figure some pictures of the building, documenting the external post-earthquake crack pattern, can be seen (Figure 9b–d).

4.2.2. Ultrasonic Tests

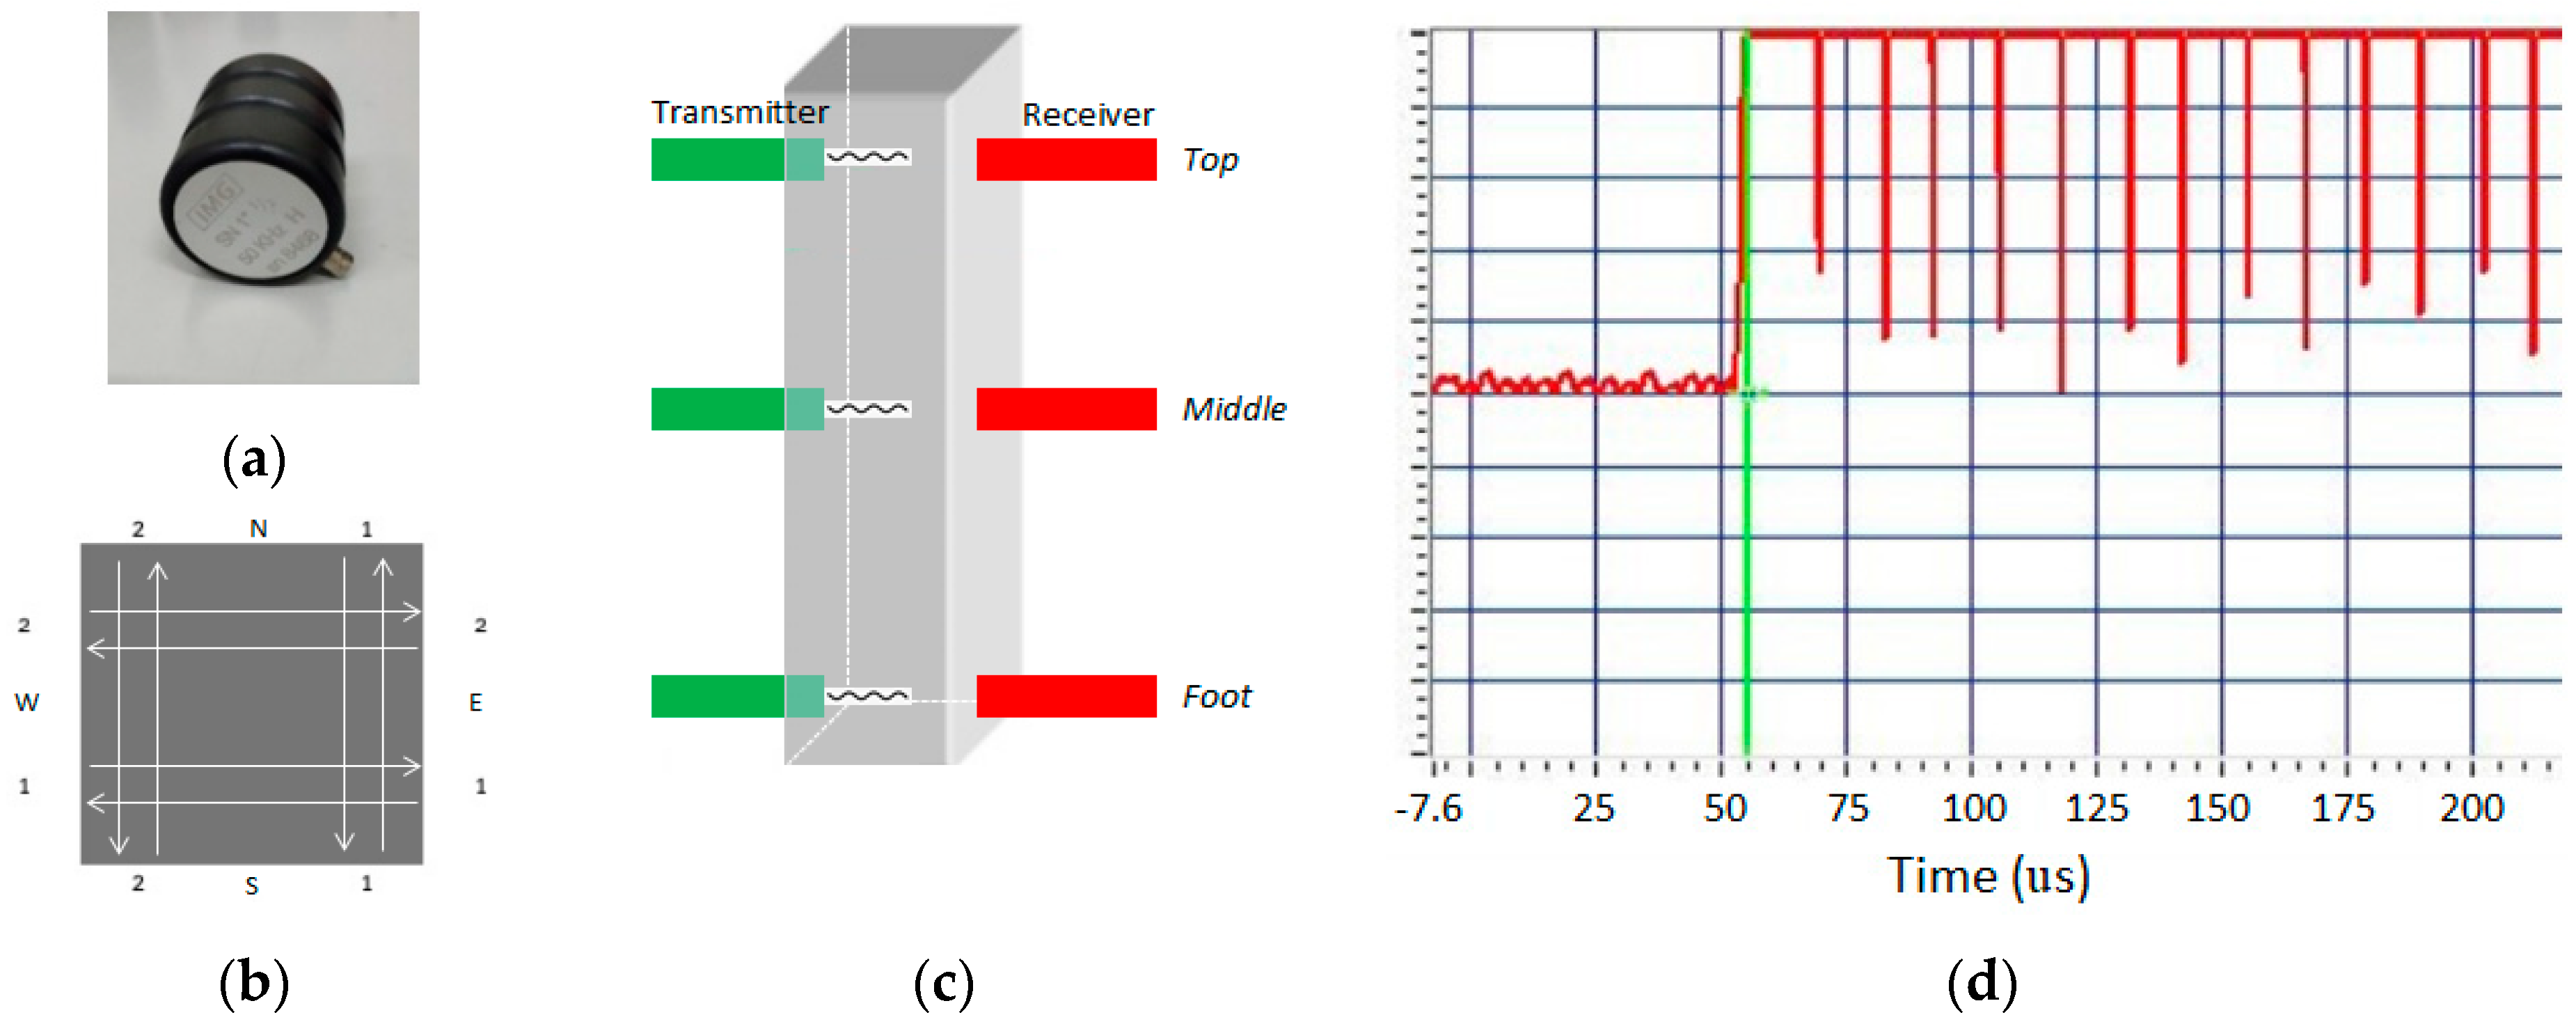
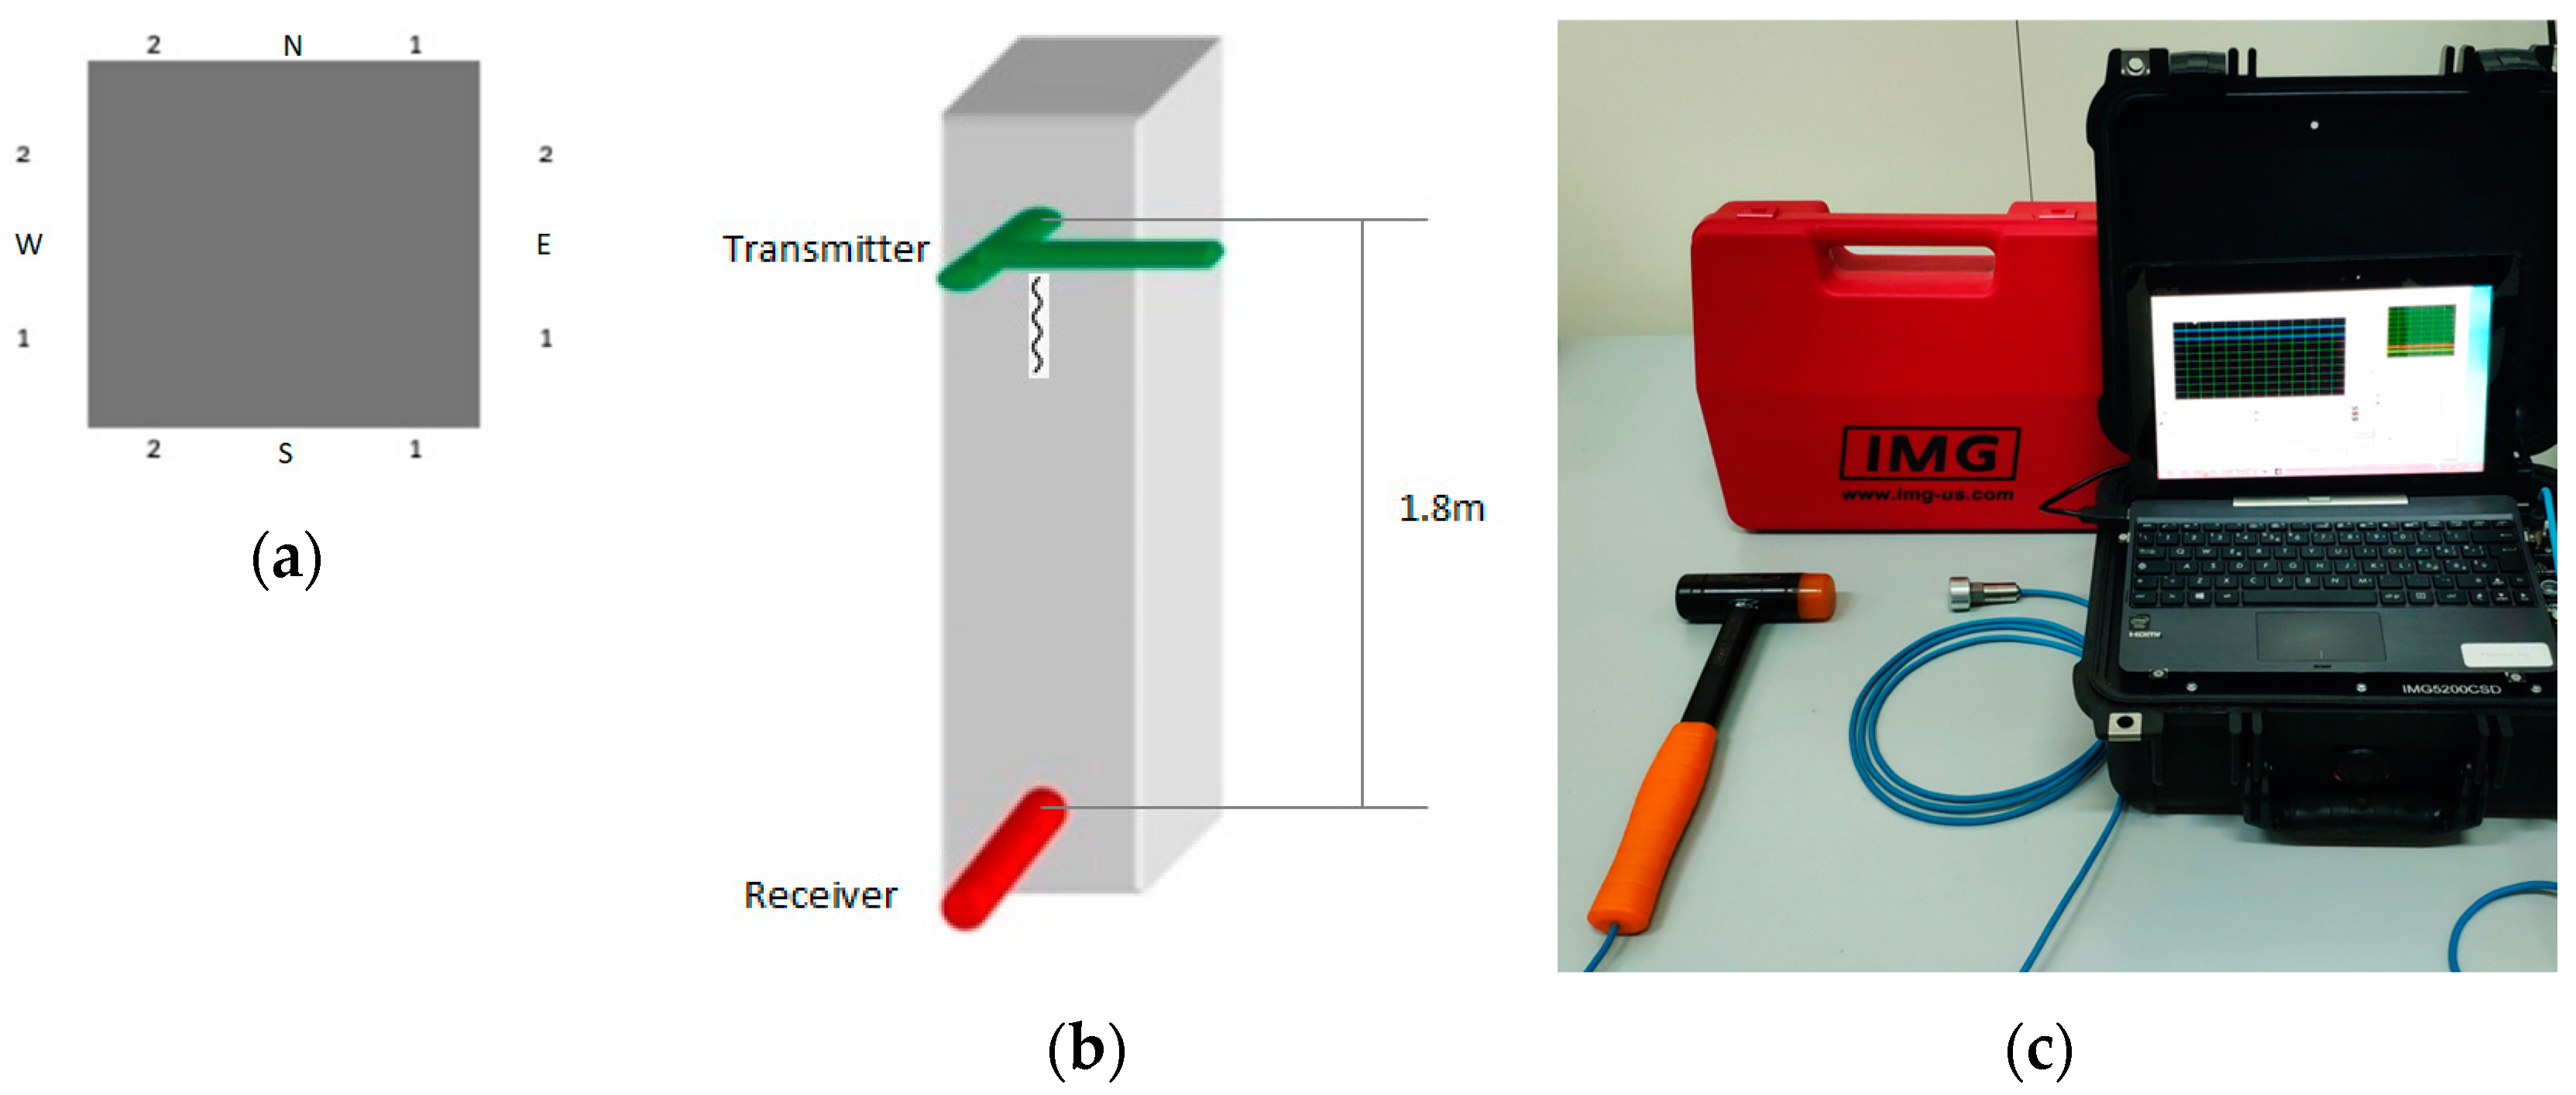
Ultrasonic tests were performed using a low-frequency instrument IMG5200CSD (IMG Ultrasuoni srl, Mandello Lario, Lecco, Italy)® equipped with 50 kHz probes of 5 cm diameter, such as the one depicted in Figure 10a. To study the variability of the mechanical properties, three sections have been investigated along the height of the columns (i.e., the Foot, the Middle span, and the Top). For a more precise analysis, both from a statistical and a structural perspective, two measurement points (1 and 2) were identified for each side (N, S, E, and W) establishing overall eight direct paths (Figure 10b): two from north to south (1-NS and 2-NS); two from south to north (1-SN and 2-SN), two from east to west (1-EW and 2-EW), and two from west to east (1-WE and 2-WE). The scheme of the direct measurement and a sampling of the instrument’s output are shown in Figure 10c and Figure 10d, respectively. This latter consists of the time it takes for the sound emitted by the transmitting probe to reach the opposite side of the element where the receiving probe is positioned. Since the distance between the two probes is known, the ultrasound speed is calculated and the mechanical quality of the material can be drawn.
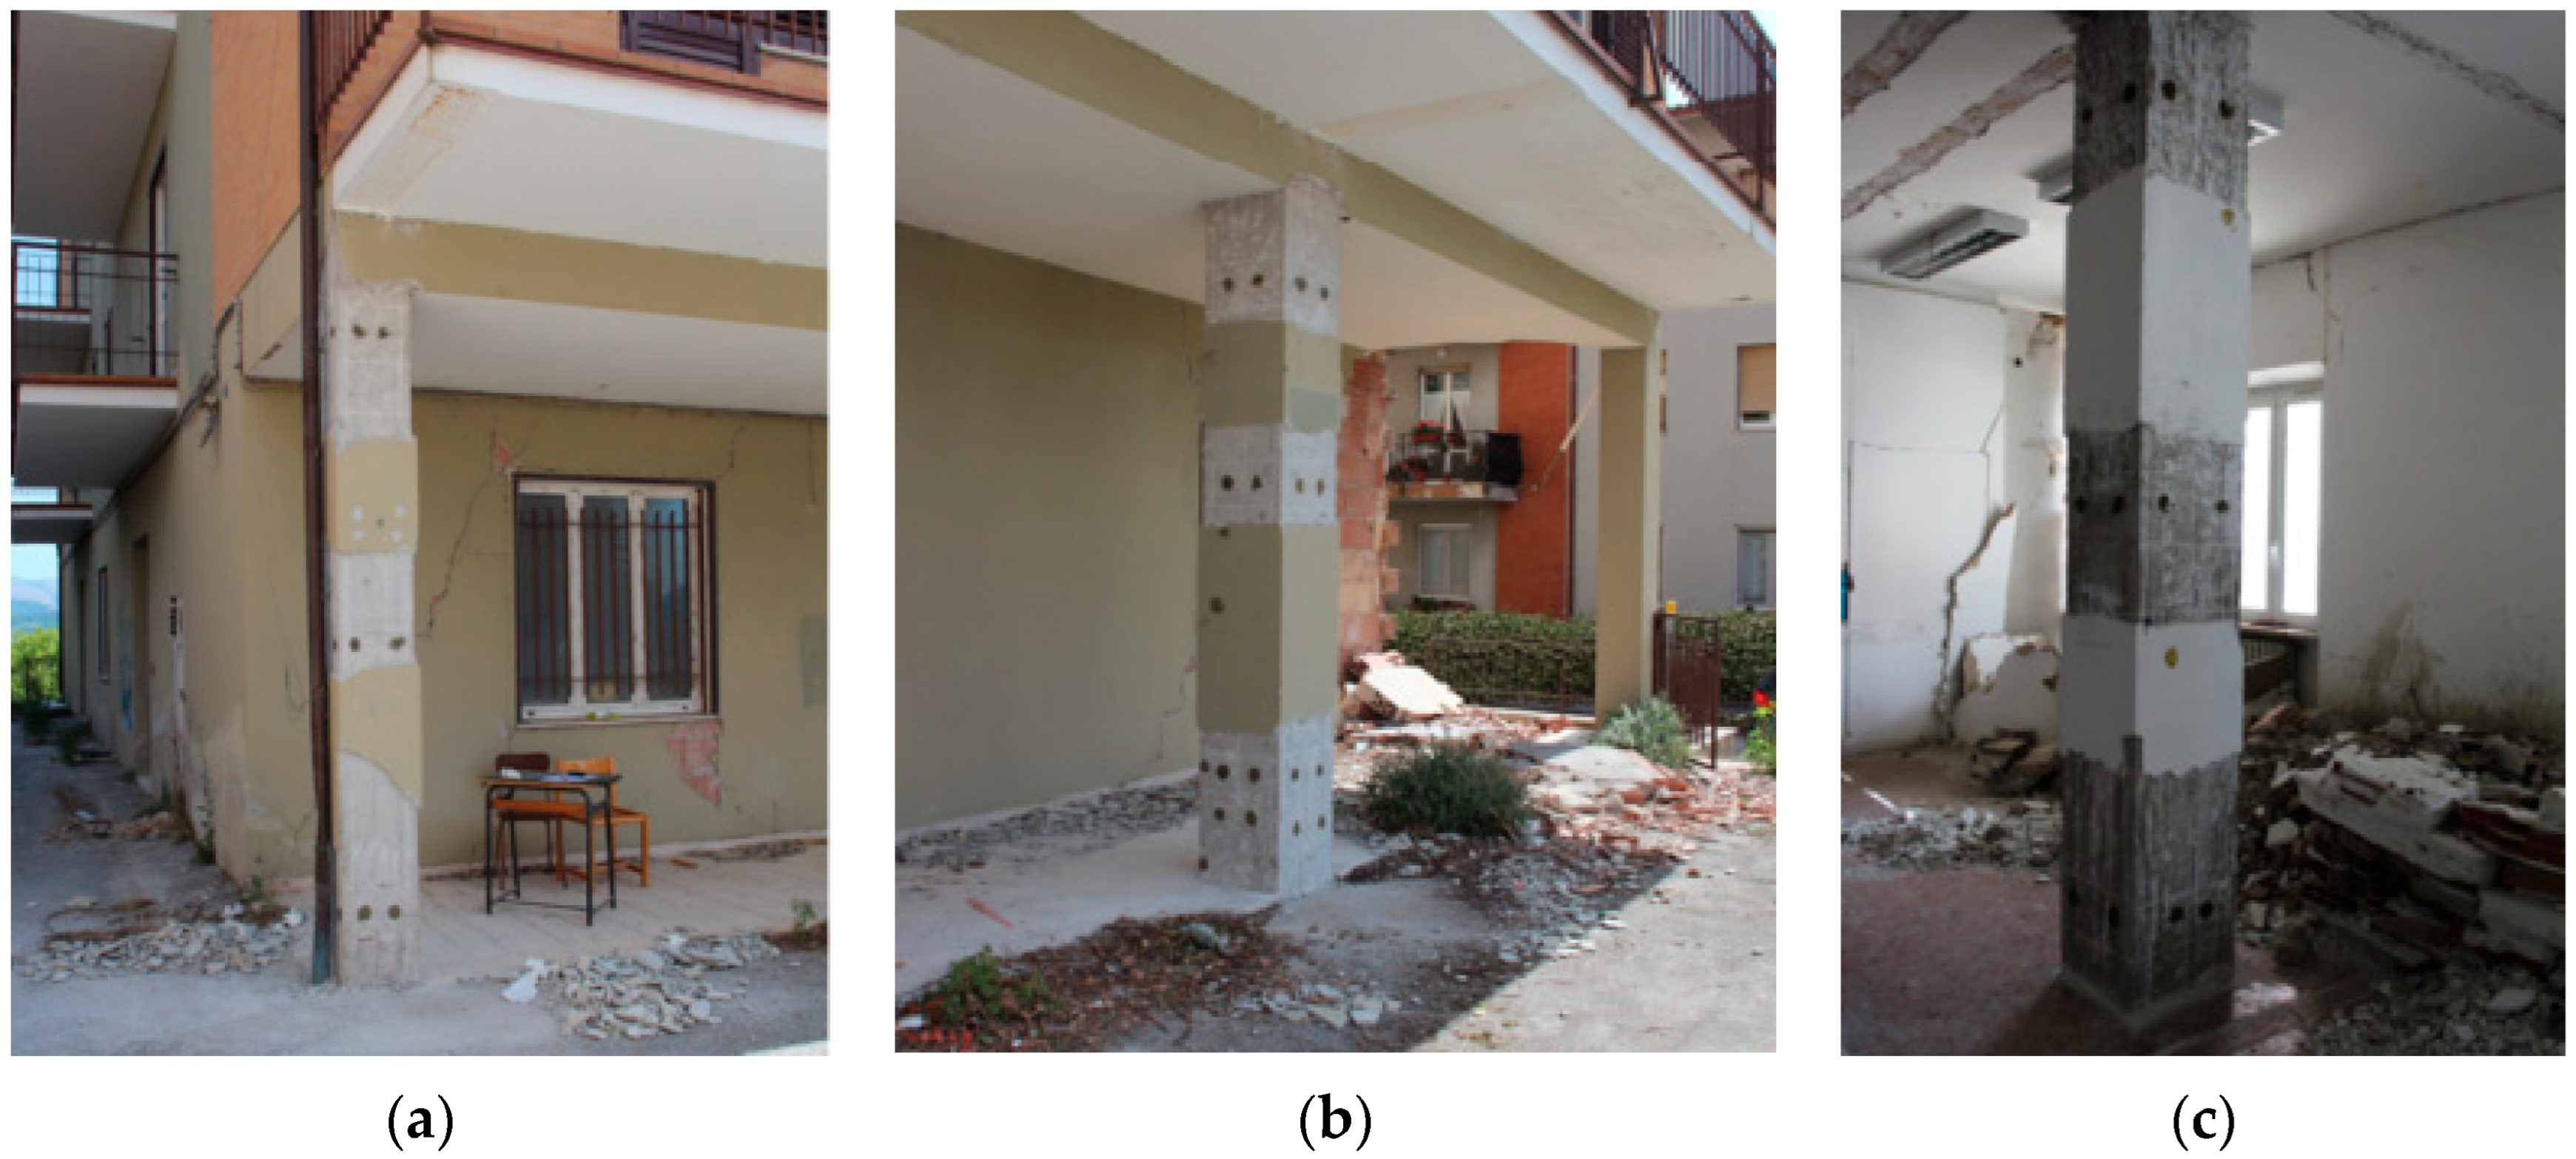
Ultrasonic tests were carried out at the ground floor level on columns 1, 6, and 13, as in Figure 9. In Figure 11a–c, some pictures of the elements prepared for tests, after plaster removal, are given, where the measurement points can be recognized.
To minimize errors, for each path, three ultrasonic measurements were repeated and transferred to the LIS platform through a form. There, they were averaged, and, for each column, a datasheet was created. These sheets contain all information useful to store with a view to the monitoring of the building’s health throughout its life. In Table 2, the one concerning column 13 is shown as an example. The speeds obtained along the different paths were kept as separate information to precisely locate any damage inferable from its variation over time. It is worth noting that, since the columns have a square shape, the distance between the points on the opposite faces is always the same.
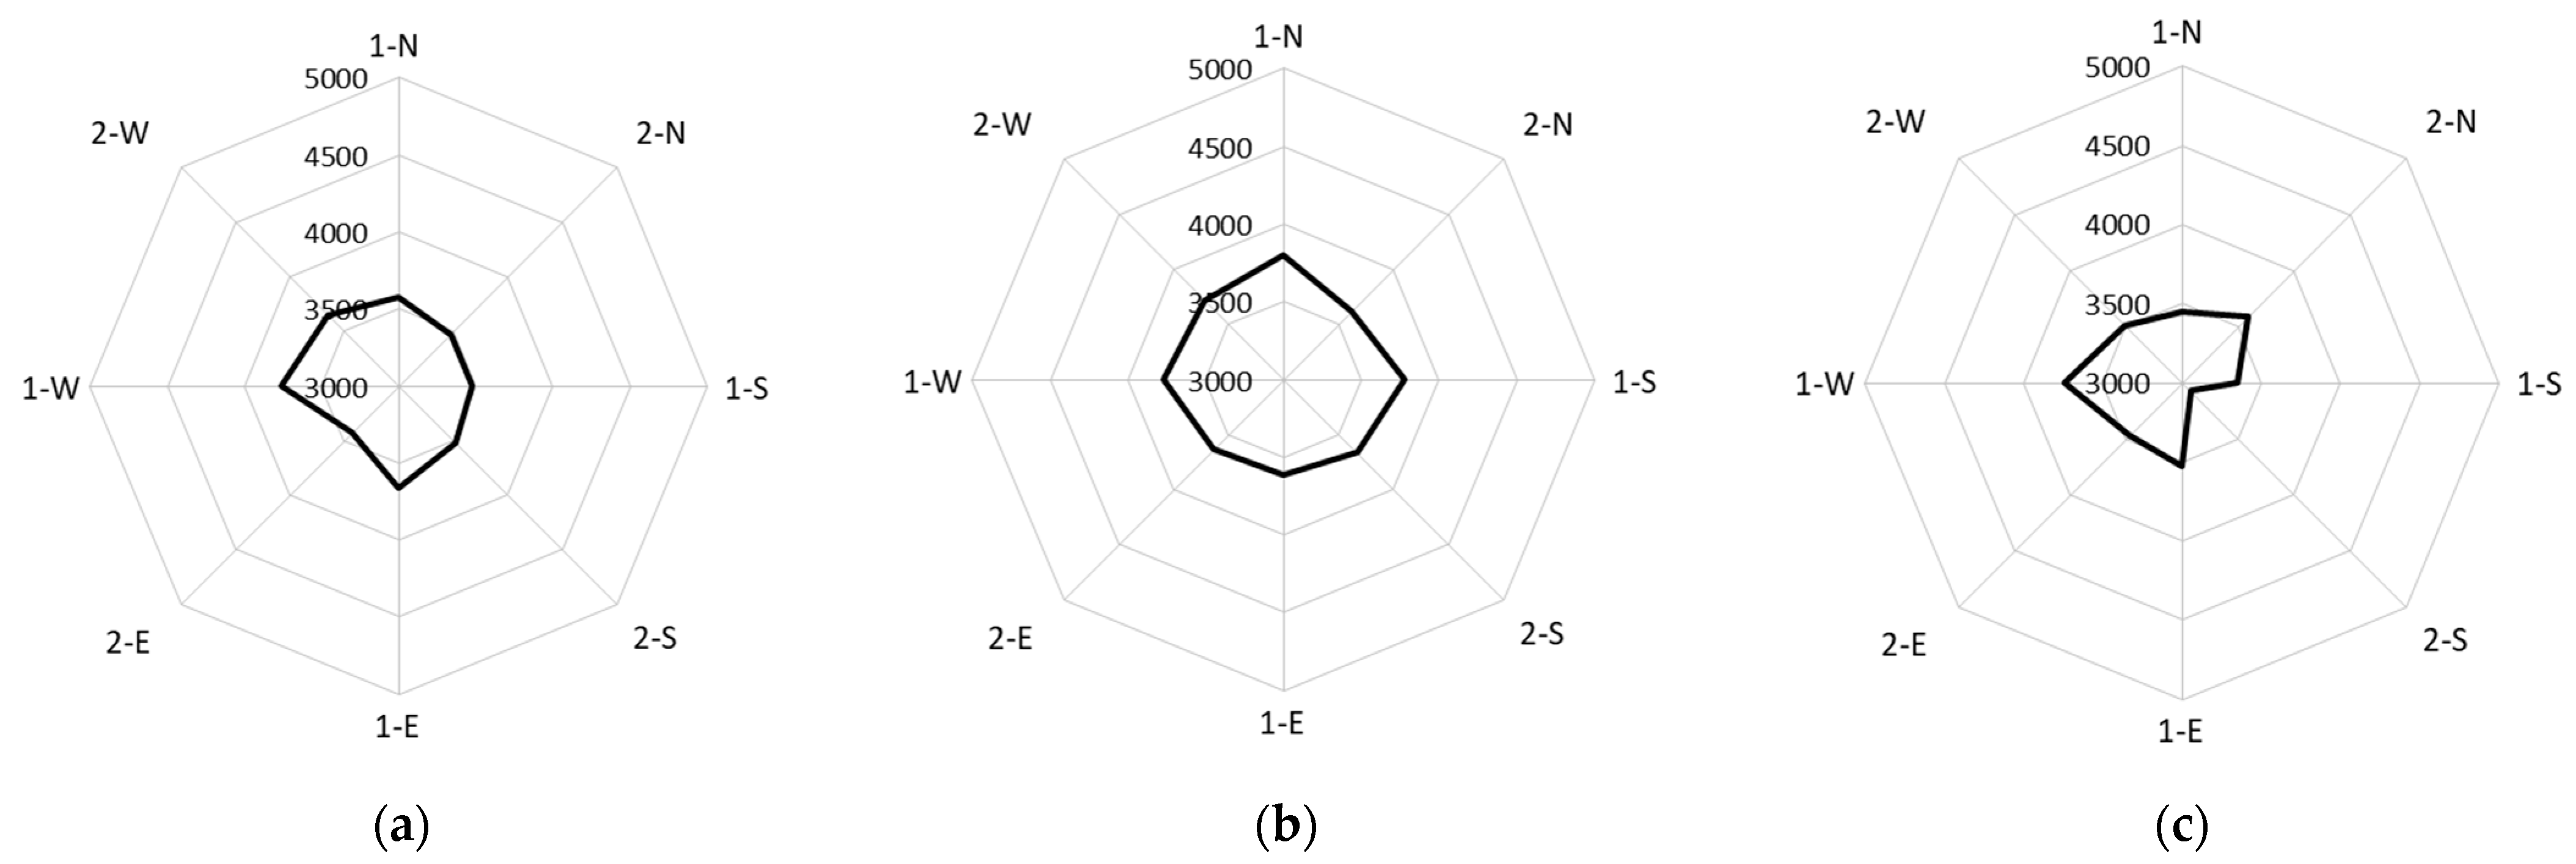
In Figure 12, the ultrasonic mean speeds (m/s), for each path at the three locations (the Foot, the Middle span, and the Top) of the three tested columns, are summarized. The quite regular shape of the octagons suggests that, in the cross-sections, the mechanical properties are almost independent from the point of application of the signal and the direction of the test. On the other hand, there is a certain longitudinal variation with the lowest values of velocities recorded at the Top.
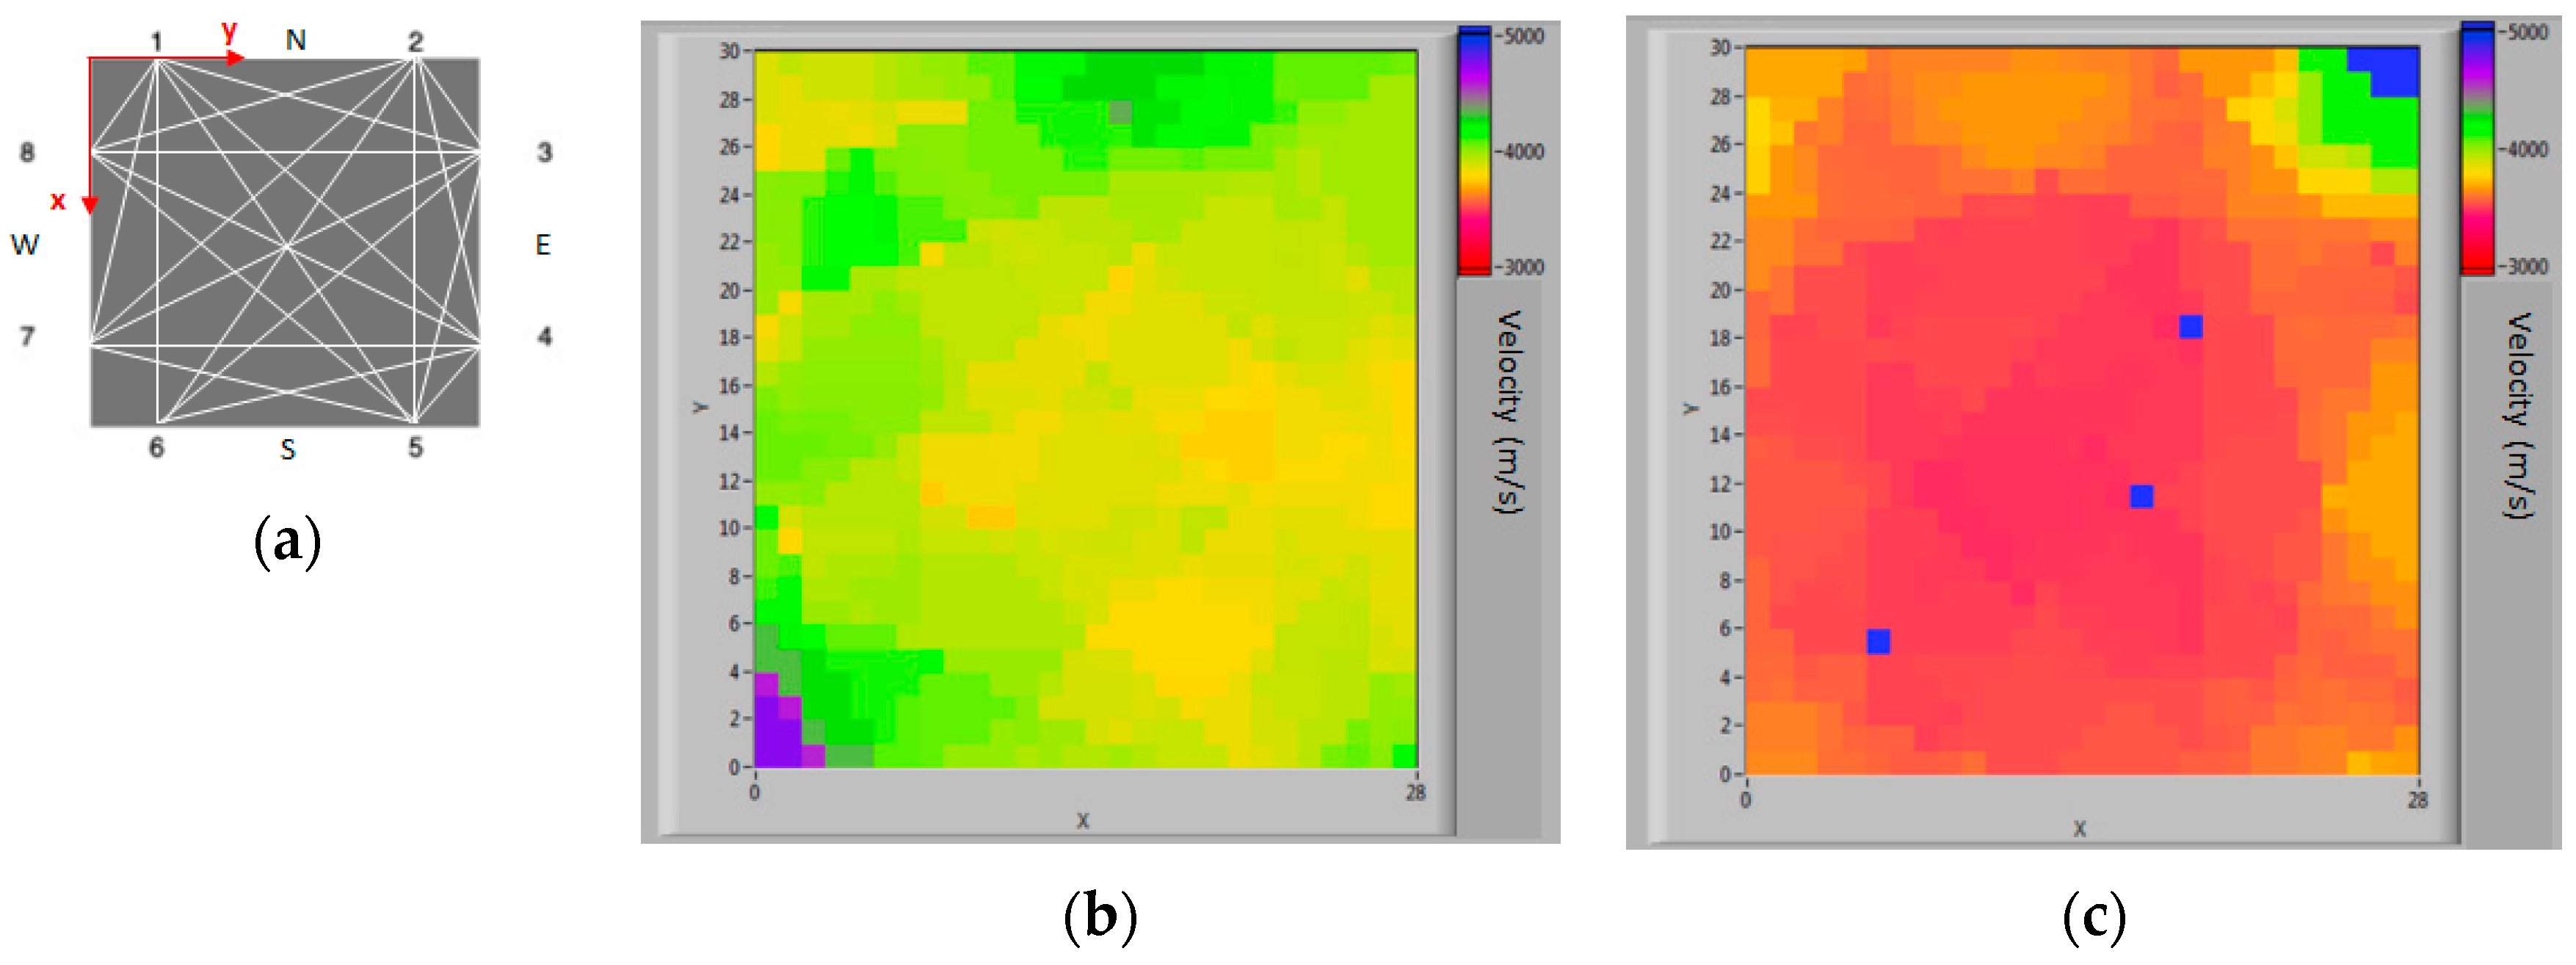
Ultrasonic tests have been integrated with ultrasound tomography. Eight measurement points were identified and marked with numbers from 1 to 8, putting the transmitter on each point and the receiver in the remaining seven, on a rotation basis. In Figure 13a the scheme of the paths is given. The results at the Foot and the Middle span of column 13 are summarized in Figure 13b and Figure 13c, respectively. In line with the results in Figure 12c, at the Foot, the distribution is homogeneous, indicating good structural integrity. Numerical data of the tomography were transferred to the LIS platform, processed to reproduce the charts of the speed distributions, and stored. Repeating these tests over time, by superimposing and comparing the charts, will be useful to recognize any evolving deterioration process.

4.2.3. Sonic Tests

To widen the knowledge of the structure, the eleven columns circled in Figure 9 have undergone sonic tests. The sound waves were generated by placing a receiving piezoelectric accelerator and impacting the column using an instrumented hammer on the same face at two points (1 and 2) for each side (N, S, E, and W), as shown schematically in Figure 14a,b. The data acquisition and processing were handled with the IMG5200CSD® (IMG Ultrasuoni srl, Mandello Lario, Lecco, Italy) device (Figure 14c), which is a digital low-frequency device for the control of inhomogeneous materials, to which the hammer instrumented with the accelerometer sensor is also connected.
Where possible, tests were carried out by placing both the hammer and the receiver directly on the concrete surface and maintaining a distance between them of 1.80 m. Once again, for each path, three distinct measurements were carried out and transferred to the LIS platform to be processed and stored. In Table 3, the datasheet available by clicking on column 13 of the model is shown as an example.
In Figure 15, for the same columns tested through the ultrasonic method, the mean speeds (m/s) obtained through sonic tests, for each point (1 and 2) and each side (N, S, E, and W), are summarized. The octagons appear to be irregular and close to the ones obtained at the Top location through ultrasonic tests.

4.3. Implementation of the LIS Platform

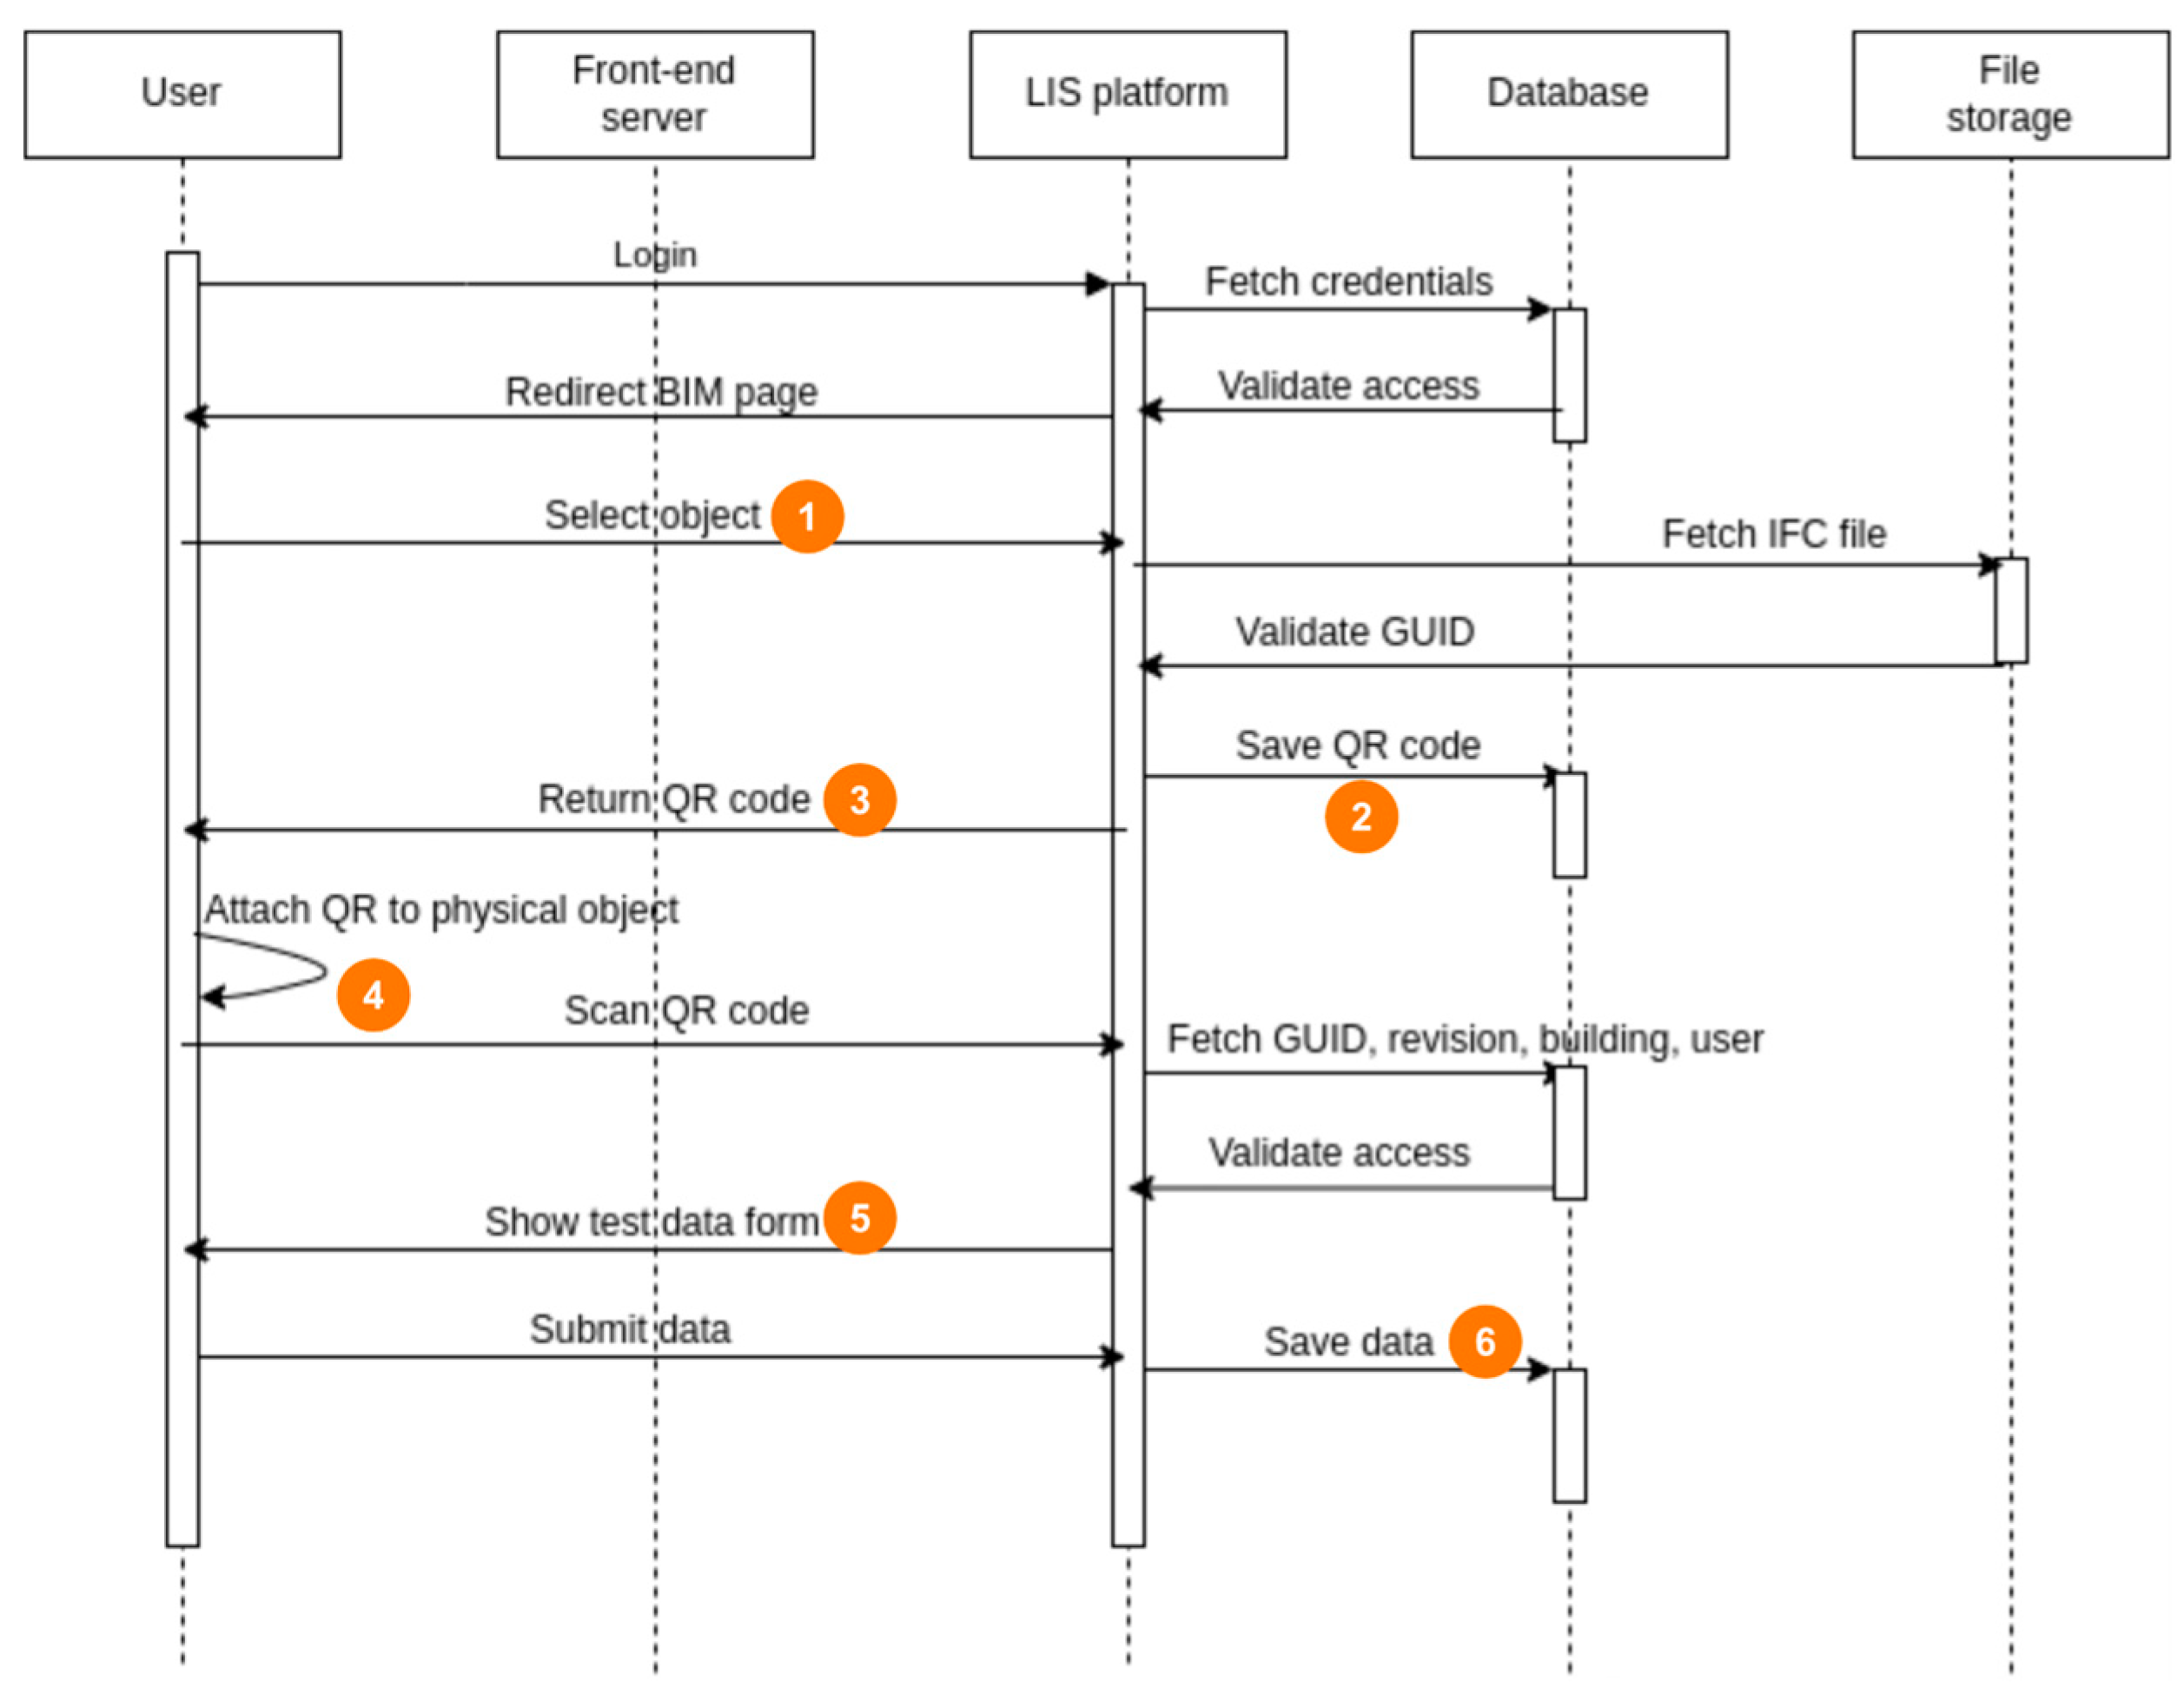
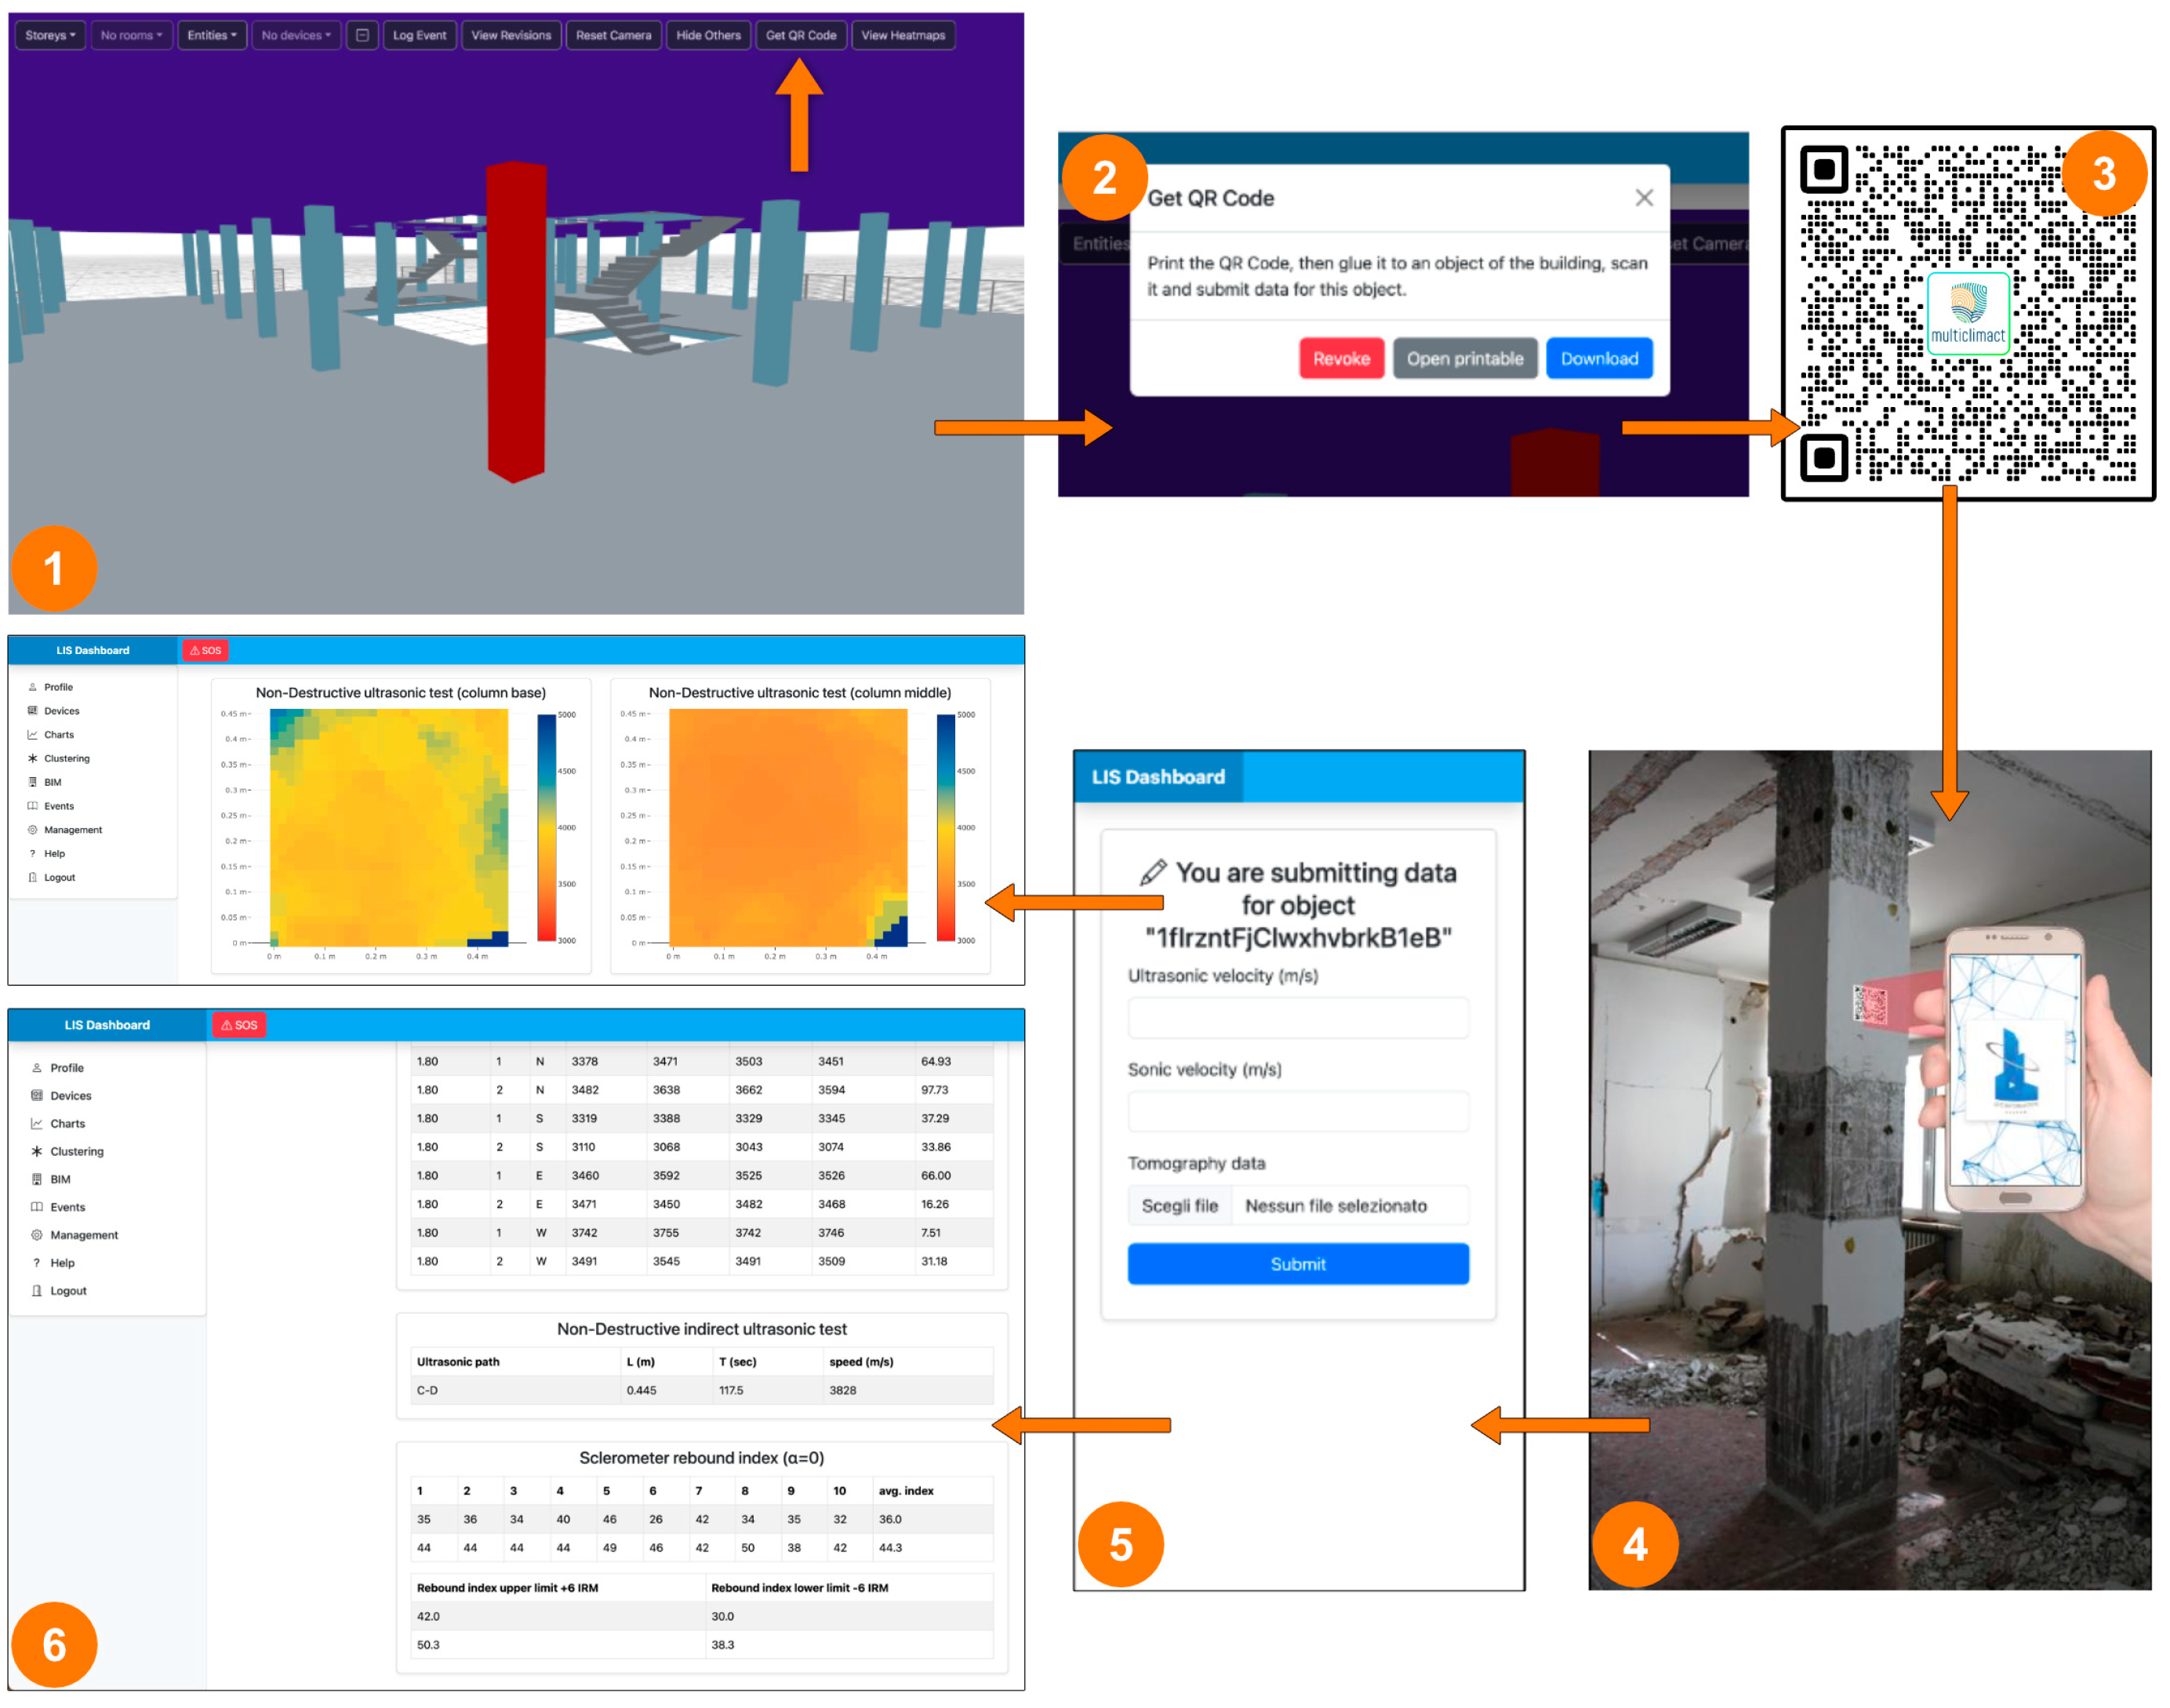
During the MULTICLIMACT project, a special profile designated as “Researcher” was created for ENEA, providing access to the final BIM model uploaded onto the LIS platform. ENEA focused on developing a non-destructive testing (NDT) method to provide accurate indications of potential damage in reinforced concrete buildings after seismic events. As a collaborative effort between the ENEA and LIS teams, an automated method was developed to insert data from non-destructive testing (NDT) directly into the objects within the semantically enriched BIM model on the LIS platform (Figure 16 and Figure 17). This special profile was generalized into a “Researcher” user role and was subsequently enabled for other partners and stakeholders involved in the MULTICLIMACT project.
In addition to a standard API capable of updating various elements of the BIM model, the LIS platform allows users to manually submit sensor data linked to a BIM element through a web page. The researcher generates a QR code that is physically attached to the building feature subject to measurement. Each QR code encodes a link containing a text string and the IFC Global Unique IDentifier of the element, linking the physical object to its corresponding BIM element. Upon visiting the link, the LIS platform automatically authenticates the researcher, preparing data input linked to the element, which is also associated with the latest BIM revision at the time of the QR code’s creation. If a new revision becomes available later, the LIS platform will suggest submitting data for the new revision, even if the QR code refers to a previous one but only if the new revision still contains an element with the same GUID. If this is not the case, a warning is displayed to inform the user that the element may have been removed from the building, indicating significant structural changes and that a new IFC model has been uploaded to the platform where the previously linked object has been removed.
Aside from data submission for a specific building element, the QR code link does not provide any additional access to the visitor. The encoded string is long and cannot be guessed, and the link can be deleted entirely by the researcher.

5. Conclusions

There is an urgent need for rapid and reliable condition assessment of existing reinforced concrete (RC) buildings as a basis for structural safety evaluation, especially in seismic regions [22].
Concrete structures may be affected due to the degradation of stiffness or strength originated from severe environmental stressors or unsystematic variations in the loads and resistances of the structure beyond the baseline conditions of the existing design. Therefore, physical changes in the performing system should be considered for assessing the future reliability and safety of the structures [22].
The question the authors asked themselves was how to develop a set of interconnected devices that can accurately replicate the behavior of a building. This was made possible through the construction of the digital twin and through the integration of architectural and structural data on the LIS platform. An approach has been developed that will be a live one throughout the building’s entire life cycle, i.e., one that is continuously updatable and upgradeable, moving from the BIM methodology with digital twinning technology and reaching the form of an intelligent “live” building.
In this case study, the tests on the building carried out immediately after the earthquake in 2016 were integrated with non-destructive tests (NDT) carried out in 2024. These tests can be replicated after several years or after an extreme event in order to check the building’s performance. All the data resulting from the tests are particularly useful in the platform, providing the possibility of monitoring the conditions of the building over time and the progress of the work, as well as predicting failures, planning its maintenance, and also optimizing energy performance.
Furthermore, an automated method was developed to insert data from non-destructive testing (NDT) directly into the objects within the semantically enriched BIM model on the LIS platform. By optimizing resources and asset management, it enhances the overall decision-making process.
The study’s limitation is the lack of data about the building before the earthquake, so it is not possible to establish if the actual conditions are due to construction details or the effects of post-earthquake damage. The implemented procedure intends to create a starting point for detecting future damage. Furthermore, the non-invasiveness and low cost of this kind of monitoring will allow the tests to be repeated frequently over time to promptly highlight anomalous structural behaviors.

Author Contributions

Conceptualization: E.C., O.C., L.G., V.L., G.M., A.M., S.M. (Saverio Mazzarelli), M.M., S.M. (Simone Murazzo), R.S., A.T., C.T., and V.A.M.L.; Methodology: E.C., O.C., L.G., V.L., G.M., A.M., S.M. (Saverio Mazzarelli), M.M., S.M. (Simone Murazzo), R.S., A.T., C.T., and V.A.M.L.; Software: O.C., S.M. (Simone Murazzo), and R.S.; Validation: E.C., O.C., L.G., V.L., G.M., A.M., S.M. (Saverio Mazzarelli), M.M., S.M. (Simone Murazzo), R.S., A.T., C.T., and V.A.M.L.; Formal analysis: E.C., O.C., L.G., V.L., G.M., A.M., S.M. (Saverio Mazzarelli), M.M., S.M. (Simone Murazzo), R.S., A.T., C.T., and V.A.M.L.; Investigation: E.C., O.C., L.G., V.L., G.M., A.M., S.M. (Saverio Mazzarelli), M.M., S.M. (Simone Murazzo), R.S., A.T., C.T., and V.A.M.L.; Resources: E.C., O.C., L.G., V.L., G.M., A.M., S.M. (Saverio Mazzarelli), M.M., S.M. (Simone Murazzo), R.S., A.T., C.T., and V.A.M.L.; Data curation: E.C., O.C., L.G., V.L., G.M., A.M., S.M. (Saverio Mazzarelli), M.M., S.M. (Simone Murazzo), R.S., A.T., C.T., and V.A.M.L.; Writing—original draft preparation: E.C., O.C., L.G., V.L., G.M., A.M., S.M. (Saverio Mazzarelli), M.M., S.M. (Simone Murazzo), R.S., A.T., C.T., and V.A.M.L.; Writing—review and editing: E.C., O.C., L.G., V.L., G.M., A.M., S.M. (Saverio Mazzarelli), M.M., S.M. (Simone Murazzo), R.S., A.T., C.T., and V.A.M.L.; Visualization: E.C., O.C., L.G., V.L., G.M., A.M., S.M. (Saverio Mazzarelli), M.M., S.M. (Simone Murazzo), R.S., A.T., C.T., and V.A.M.L.; Supervision, E.C., A.M., C.T., and V.A.M.L.; Project administration: R.S., and V.A.M.L.; Funding acquisition: R.S., and V.A.M.L. All authors have read and agreed to the published version of the manuscript.

Funding

The present work is related to the MULTICLIMACT Project. This project has received funding from the European Union’s Horizon Europe research and innovation program under grant agreement no. 101123538.

Institutional Review Board Statement

Not applicable.

Informed Consent Statement

Not applicable.

Data Availability Statement

The original contributions presented in this study are included in the article. Further inquiries can be directed at the corresponding author.

Conflicts of Interest

Authors Elena Candigliota, Orazio Colaneri, Giuseppe Marghella, Anna Marzo, Saverio Mazzarelli, Simone Murazzo, Rifat Seferi, Angelo Tatì, Concetta Tripepi and Vincenza A. M. Luprano are employed by companies ENEA, LIS. The remaining authors declare that the research was conducted in the absence of any commercial or financial relationships that could be construed as a potential conflict of interest.

References

  1. Ibrahim, E.A.; Goff, D.; Keyvanfar, A.; Jonaidi, M. Assessing Post-Fire Damage in Concrete Structures: A Comprehensive Review. Buildings 2025, 15, 485. [Google Scholar] [CrossRef]
  2. D’Amico, F.; Bertolini, L.; Napolitano, A.; Ciampoli, L.B.; Manalo, J.; Gagliardi, V.; Calvi, A. A possible implementation of non-destructive data surveys in the definition of BIM models for the analysis of road assets. Transp. Res. Procedia 2023, 69, 187–194. [Google Scholar] [CrossRef]
  3. MIMS. Ministero delle Infrastrutture e della Mobilità Sostenibile; DM 312/2021: Modifiche al DM 560/2017; Ministero delle Infrastrutture e della Mobilità Sostenibile: Rome, Italy, 2021.
  4. MIT. Modalità e i Tempi Di Progressiva Introduzione dei Metodi e Degli Strumenti Elettronici di Modellazione per l’edilizia e le Infrastrutture; DM 560/2017; Ministero delle Infrastrutture e dei Trasporti: Rome, Italy, 2017. [Google Scholar]
  5. MIT. Legge 109/2018: Disposizioni Urgenti per la Città di Genova, la Sicurezza Della Rete Nazionale Delle Infrastrutture e Dei Trasporti, Gli Eventi Sismici del 2016 e 2017, il Lavoro e le Altre Emergenze; Ministero delle Infrastrutture e dei Trasporti: Rome, Italy, 2018.
  6. Bertolini, L.; D’amico, F.; Napolitano, A.; Ciampoli, L.B.; Gagliardi, V.; Manalo, J.R.D. A BIM-Based Approach for Pavement Monitoring Integrating Data from Non-Destructive Testing Methods (NDTs). Infrastructures 2023, 8, 81. [Google Scholar] [CrossRef]
  7. Zhu, H.; Huang, M.; Zhang, Q.-B. TunGPR: Enhancing data-driven maintenance for tunnel linings through synthetic datasets, deep learning and BIM. Tunn. Undergr. Space Technol. 2024, 145, 105568. [Google Scholar] [CrossRef]
  8. Solla, M.; Gonçalves, L.M.S.; Gonçalves, G.; Francisco, C.; Puente, I.; Providência, P.; Gaspar, F.; Rodrigues, H. A Building Information Modeling Approach to Integrate Geomatic Data for the Documentation and Preservation of Cultural Heritage. Remote. Sens. 2020, 12, 4028. [Google Scholar] [CrossRef]
  9. Artopoulos, G.; Fokaides, P.; Lysandrou, V.; Deligiorgi, M.; Sabatakos, P.; Agapiou, A. Data-Driven Multi-Scale Study of Historic Urban Environments by Accessing Earth Observation and Non-Destructive Testing Information via an HBIM-Supported Platform. Int. J. Arch. Heritage 2023, 18, 920–939. [Google Scholar] [CrossRef]
  10. Polimeno, M.R.; Roselli, I.; Luprano, V.A.; Mongelli, M.; Tatì, A.; De Canio, G. A non-destructive testing methodology for damage assessment of reinforced concrete buildings after seismic events. Eng. Struct. 2018, 163, 122–136. [Google Scholar] [CrossRef]
  11. Cassandras, C.G.; Lafortune, S. Introduction to Discrete Event Systems, 2nd ed.; Springer: New York, NY, USA, 2008. [Google Scholar] [CrossRef]
  12. Tao, F.; Sui, F.; Liu, A.; Qi, Q.; Zhang, M.; Song, B.; Guo, Z.; Lu, S.C.-Y.; Nee, A.Y.C. Digital Twin-Driven Product Design Framework. Int. J. Prod. Res. 2019, 57, 3935–3953. [Google Scholar] [CrossRef]
  13. Santarsiero, G.; Misceo, M.; Aversa, P.; Candigliota, E.; Di Micco, A.; Hugony, F.; Manfredi, V.; Marghella, G.; Marzo, A.; Masi, A.; et al. Holistic Assessment for Social Housing Retrofitting: Integrating Seismic, Energy, and Social Aspects in the REHOUSE Project. Buildings 2024, 14, 3659. [Google Scholar] [CrossRef]
  14. Caballero, A.A.; Yen, K.K. The Use of Micro-Electro-Mechanical Systems (MEMS) in the Construction Industry. In Proceedings of the 20th International Symposium on Automation and Robotics in Construction (ISARC 2003), Eindhoven, The Netherlands, 21–24 September 2003; pp. 73–78. [Google Scholar] [CrossRef]
  15. Lang, C.; Willmes, M. Non-Destructive Testing of Reinforced Concrete Structures. In Proceedings of the International Symposium on Structural Health Monitoring and Nondestructive Testing, Saarbruecken, Germany, 4–5 October 2018. [Google Scholar]
  16. NTC. Aggiornamento Delle “Norme Tecniche per le Costruzioni”; Decreto 17 Gennaio 2018; Ministero delle Infrastrutture e Trasporti: Rome, Italy, 2018.
  17. Aydin, F. Schmidt hammer using on concrete of existing building, II. In Proceedings of the International Workshop on Earthquake and Sustainable Materials (IWesM), Ankara, Turkey, 23 January 2013. [Google Scholar]
  18. RILEM TC 249-ISC. Non destructive In Situ Strength Assessment of Concrete. Available online: https://www.rilem.net/groupe/249-isc-non-destructive-in-situ-strength-assessment-of-concrete-295 (accessed on 4 November 2024).
  19. Siorikis, V.G.; Antonopoulos, C.P.; Pelekis, P.; Christovasili, K.; Hatzigeorgiou, G.D. Numerical and experimental evaluation of sonic resonance against ultrasonic pulse velocity and compression tests on concrete core samples. Vibroengineering PROCEDIA 2020, 30, 168–173. [Google Scholar] [CrossRef]
  20. Gioiella, L.; Tubaldi, E.; Gara, F.; Dezi, L.; Dall’Asta, A. Modal properties and seismic behaviour of buildings equipped with external dissipative pinned rocking braced frames. Eng. Struct. 2018, 172, 807–819. [Google Scholar] [CrossRef]
  21. Gioiella, L.; Tubaldi, E.; Gara, F.; Dezi, L.; Dall’Asta, A. Stochastic seismic analysis and comparison of alternative external dissipative systems. Shock. Vib. 2018, 2018, 5403737. [Google Scholar] [CrossRef]
  22. Karatosun, S.; Yazar, M.; Gunes, O.; Taskin, B. Critical evaluation of NDT for rapid condition assessment of existing RC buildings: A case study. MATEC Web Conf. 2022, 361, 07001. [Google Scholar] [CrossRef]
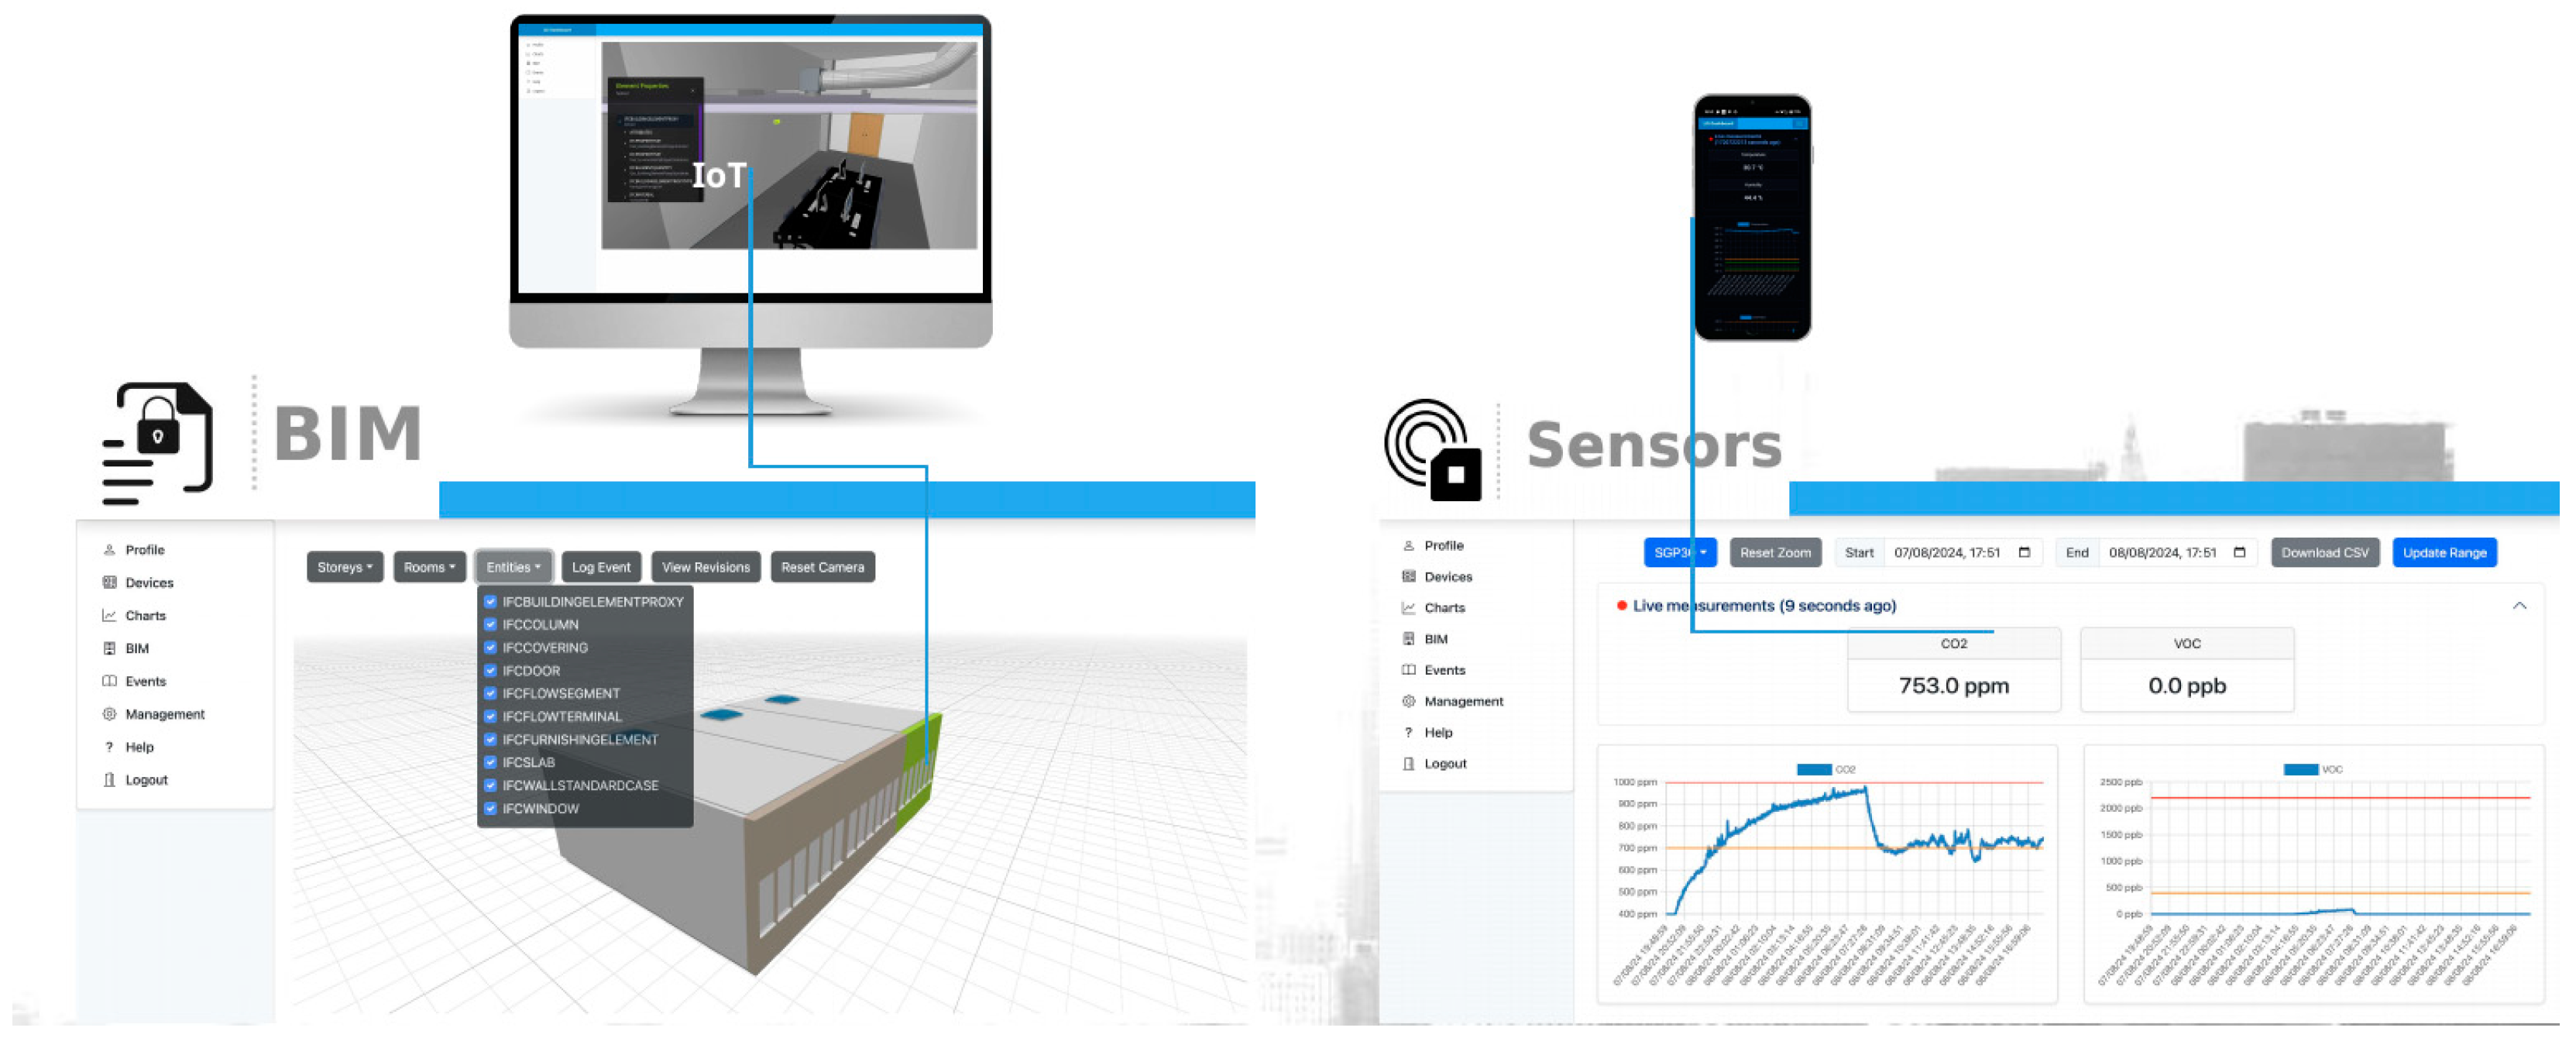
Figure 1. LIS platform BIM overview and sensor data charts page with real-time data.
Sustainability 17 03076 g001
Figure 2. BIM page in the LIS platform and charts page, on desktop and mobile.
Sustainability 17 03076 g002
Figure 3. Sensor data intake architecture of the LIS platform.
Sustainability 17 03076 g003
Figure 4. (a) Picture of Fazzini College before 2016; (b) architectural layout of the building; (c) structural layout of a floor type; (d) structural section of the building.
Sustainability 17 03076 g004
Figure 5. Layout and typologies of Fazzini College’s infill walls.
Sustainability 17 03076 g005
Figure 6. Pictures of the seismic damage suffered by Fazzini College in 2016: (a) damage to external infills; (b) damage to the stairs of the lower elevations; (c) damage to internal partitions.
Sustainability 17 03076 g006
Figure 7. Test results for column 1, ground floor, by UNICAM in the LIS platform.
Sustainability 17 03076 g007
Figure 8. Thermographic analyses: (a) FLIR T560® thermal camera; (b) example of the thermal processed image of the main façade.
Sustainability 17 03076 g008
Figure 9. (a) Plan of the ground level with NDT locations; (bd) some pictures of the building.
Sustainability 17 03076 g009
Figure 10. (a) IMG5200CSD® ultrasonic probe; (b) scheme of the ultrasonic paths; (c) scheme of direct measurement; (d) example of the sampling of the ultrasonic signal.
Sustainability 17 03076 g010
Figure 11. Pictures of (a) column 1, (b) column 6, and (c) column 13, as prepared for tests.
Sustainability 17 03076 g011
Figure 12. Mean speeds (m/s) from direct ultrasonic tests in (a): column 1, (b) column 6, and (c) column 13.
Sustainability 17 03076 g012
Figure 13. (a) Scheme of tomography paths. Column 13 speed distributions: (b) at the Foot; (c) at the Middle span.
Sustainability 17 03076 g013
Figure 14. (a) Measuring points; (b) scheme of sonic indirect measures; (c) IMG5200CSD® device.
Sustainability 17 03076 g014
Figure 15. Mean speeds (m/s) from indirect sonic tests in (a) column 1, (b) column 6, and (c) column 13.
Sustainability 17 03076 g015
Figure 16. UML diagram showing the steps from the user logging into the LIS platform to generating a QR code, scanning the QR code, and finally submitting test data.
Sustainability 17 03076 g016
Figure 17. Visual representation of the previous diagram in Figure 16. The full end-user experience is shown.
Sustainability 17 03076 g017
Table 1. List of investigations performed.
FloorTests Performed
Basement floorn. 1 horizontal endoscopy
n. 7 magnetic investigations to identify reinforcements
n. 7 non-destructive concrete tests using the SonReb method
n. 1 survey on the perimeter wall
n. 3 foundation surveys
n. 2 core samplings
Ground floorn. 2 horizontal endoscopies
n. 1 vertical endoscopy for stratification of the lower slab
n. 16 magnetic investigations to identify reinforcements
n. 16 non-destructive concrete tests using the SonReb method
n. 1 survey on the wall
n. 1 survey on the beam to verify construction details
n. 1 survey on the intrados of the upper slab
n. 4 core samplings
1st floorn. 4 horizontal endoscopies
n. 2 vertical endoscopies for stratification of the lower slab
n. 7 magnetic investigations to identify reinforcements
n. 7 non-destructive concrete tests using the SonReb method
n. 1 survey on the wall
n. 3 surveys on beams to verify construction details
n. 1 survey on the slab to verify construction details
n. 2 core samplings
n. 3 load tests on slabs
n. 2 load tests on beams
2nd floorn. 7 magnetic investigations for reinforcement detection
n. 7 non-destructive concrete tests using the SonReb method
n. 2 core drillings
3rd floorn. 6 magnetic investigations for reinforcement detection
n. 6 non-destructive concrete tests using the SonReb method
n. 2 core drillings
n. 1 reinforcement bar sampling
4th floorn. 6 magnetic investigations for reinforcement detection
n. 6 non-destructive concrete tests using the SonReb method
n. 2 core drillings
n. 1 survey on slab to verify construction details
Attic floorn. 1 vertical endoscopy for lower slab stratification
n. 1 magnetic investigations for reinforcement detection
n. 1 non-destructive concrete tests using the SonReb method
n. 1 reinforcement sample extraction
n. 1 survey on beam to verify construction details
n. 1 survey on slab to verify construction details
Table 2. Data available in the LIS platform (ultrasonic velocities, example of column 13).
Location: Foot; Side: 0.452 m; Height from Base: 0.33 m
PointDirectionSpeed 1
(m/s)
Speed 2
(m/s)
Speed 3
(m/s)
Mean Speed
(m/s)
1NS3984396139673971
SN3941393139293934
2NS4035402340444034
SN4039404240624048
1EW3867387338673869
WE3862386238693864
2EW3808380638213812
WE3807380238063805
Location: Middle; Side: 0.452 m; Height from Base: 1.72 m
PointDirectionSpeed 1
(m/s)
Speed 2
(m/s)
Speed 3
(m/s)
Mean Speed
(m/s)
1NS3566354335603556
SN3527354235163528
2NS3575357835793577
SN3581356235603568
1EW3469346934583465
WE3476346534733471
2EW3507350234993503
WE3511351535043510
Location: Top; Side: 0.452 m; Height from Base: 3.11 m
PointDirectionSpeed 1
(m/s)
Speed 2
(m/s)
Speed 3
(m/s)
Mean Speed
(m/s)
1NS3517351935003512
SN3530352535393531
2NS3588360635893594
SN3515354935513538
1EW3495350035163504
WE3496348034883488
2EW3495350335093502
WE3464346234723466
Table 3. Data available in the LIS platform (sonic velocities, example of columns 13).
Location: Foot; Side: 0.452 m; Height of Impact Point from Base: 2.13 m
SidePointSpeed 1
(m/s)
Speed 2
(m/s)
Speed 3
(m/s)
Mean Speed
(m/s)
N13378347135033451
23482363836623594
S13319338833293345
23110306830433074
E13460359235253526
23471345034823468
W13742375537423746
23491354534913509
Disclaimer/Publisher’s Note: The statements, opinions and data contained in all publications are solely those of the individual author(s) and contributor(s) and not of MDPI and/or the editor(s). MDPI and/or the editor(s) disclaim responsibility for any injury to people or property resulting from any ideas, methods, instructions or products referred to in the content.