Article

Increase or Decrease? The Impact of Land Development Rights Transfer on Regional Carbon Emission Governance

1
School of Public Administration, Guangxi University, Nanning 530004, China
2
School of Politics and Public Administration, Guangxi Minzu University, Nanning 530008, China
*
Author to whom correspondence should be addressed.
Sustainability 2025, 17(7), 3072; https://doi.org/10.3390/su17073072
Submission received: 1 February 2025 / Revised: 26 March 2025 / Accepted: 28 March 2025 / Published: 31 March 2025

Abstract

:
Carbon dioxide (CO2) emissions are a central issue in the conflict between economic development and environmental protection. Optimizing land use to balance development and conservation plays a crucial role in reducing carbon emissions. The transfer of development rights (TDR), as an emerging market-based policy tool, can effectively achieve a “win-win” situation between development and conservation. However, its empirical impact on carbon emission reduction remains insufficiently explored. This study focuses on the Guangxi Zhuang Autonomous Region in China. It constructs four scenarios—nature, development, protection, and TDR—using the PLUS model. These scenarios are combined with 2030 projections of energy consumption and socio-economic development generated by a Long Short-Term Memory (LSTM) network and evaluated using the carbon emission factor method. The results indicate that both urban–rural and cross-regional transfers of construction land rights positively contribute to reducing carbon emissions, and their combination yields the most significant benefits. The TDR scenario can protect the ecological environment while effectively controlling the scale of construction space. With a carbon emission level of 77.9 million tonnes, it serves as a rational choice for regional land use. This study contributes to advancing both the theory and practice of low-carbon land use and plays a significant role in optimizing land resource allocation and reducing carbon emissions.

1. Introduction

Global warming has caused a series of negative impacts on Earth’s ecosystems, primarily reflected in global climate change driven by greenhouse gas emissions. To address climate challenges and mitigate the impact on human societies, many countries have signed climate agreements, reaching a consensus on increasing carbon sinks and reducing carbon emissions [1]. Human activities are the primary drivers of carbon dioxide emissions and absorption [2]. As the foundation of human activities, land use plays a crucial role in carbon emissions. Comprehensive analysis of carbon emission changes from the perspective of land use is essential for mitigating global warming and addressing climate change.
In August 2019, the United Nations Intergovernmental Panel on Climate Change (IPCC) published the special report “Climate Change and Land”, stating that approximately 14% of global carbon emissions originate from land use, while 31% are absorbed by terrestrial ecosystems [3]. Land use disrupts the material cycles and energy flows of ecosystems, leading to structural and functional changes that ultimately impact carbon emissions [4]. At present, China has entered a critical period for reducing carbon emissions, and land resources, as the material basis for human survival and development, have become the mainstream choice for exploring low-carbon-oriented land utilization. The Chinese government has successively introduced the Action Plan for Peak Carbon by 2030 and the Outline of National Land Spatial Planning (2021–2035). These policies aim to optimize land use to enhance the carbon sink capacity of terrestrial ecosystems, reduce carbon emissions, and establish a development and conservation framework aligned with the goals of “peak carbon and carbon neutrality”.
According to the existing literature, research on the relationship between land use and carbon emissions primarily focuses on carbon emission mechanisms [5,6], the estimation of carbon emissions induced by LUCC, driving factors, and low-carbon optimization pathways [7,8,9,10,11]. Carbon emission estimation methods can be categorized into two types: direct and indirect. Direct methods assess the impact of land use on the natural carbon cycle using ecosystem process models [12] and sample plot inventories [13], among others. Indirect methods, on the other hand, rely on carbon emission coefficients [14], material balance analysis [15], and factor decomposition [16] to quantify carbon emissions resulting from land-use practices and intensities. Regarding driving mechanisms, most studies employ regression analysis, panel data models, and LMDI index decomposition to examine the influence of various factors [17]. At the micro-scale, studies primarily focus on measuring soil carbon, vegetation carbon, and microbial carbon. Meso-scale studies generally analyze the spatial and temporal evolution of land-use carbon emissions and their influencing factors. Macro-scale studies typically assess overall land-use carbon emissions at regional or national levels and propose scientific and rational low-carbon strategies. All these studies indicate that human activities influence carbon emissions by altering land-use types and energy consumption patterns [18]. Therefore, research on land-use carbon emissions generally comprises two key components. The first component is scenario simulation, which employs spatial simulation models to predict future land-use patterns. Commonly used models include CA-Markov, FLUS, PLUS, and CLUMondo [19]. The CA model effectively simulates complex land-use evolution using simple transition rules. However, compared to other models, its multi-type transition capability is limited, making it more suitable for simulating single-type urban expansion [20]. Liu et al. [21] proposed an advanced FLUS model, which builds upon the traditional CA framework and incorporates nonlinear relationship mining techniques to analyze interactions among various land-use types, thereby improving prediction accuracy. However, FLUS parameter calibration is complex [22], and in this study, its simulation accuracy was found to be lower than that of PLUS. The non-spatial demand module in the CLUMondo model makes this model highly applicable, but its parameters such as the drag coefficients are mainly dependent on expert knowledge and historical experience to determine, and the accuracy of the simulation is easily questionable [19]. Similar to the FLUS model, the CLUMondo model also suffers from poor accuracy in this study. The PLUS model, by employing a patch-generating mechanism, effectively captures land-use change dynamics, offering high simulation accuracy and fast data processing, making it widely recognized by scholars [23]. This study compares the accuracy of multiple spatial simulation models and concludes that PLUS is the most suitable for the research objectives. The second component involves forecasting future energy consumption. Common prediction methods include regression models, grey prediction models, and neural networks [24]. Regression models require the establishment of a linear relationship between independent and dependent variables, making them unsuitable for nonlinear problems [24]. Grey prediction models generate cumulative sequences from limited data for forecasting, but their long-term predictions are prone to error accumulation [25]. Neural networks are particularly effective in handling time-series data. In particular, the LSTM model mitigates the vanishing and exploding gradient issues that commonly affect traditional neural networks when processing long-sequence data [26,27]. Therefore, this study employs the LSTM model to effectively capture the time-series characteristics of energy consumption and the influence of various factors, ensuring accurate predictions of future energy consumption trends.
Existing studies have made significant progress in the relationship between land use and carbon emissions, but there remains room for further exploration. On one hand, current research primarily focuses on the impact of construction land expansion on carbon emissions [28]. The impact of the transfer and allocation of construction land on carbon emissions has been overlooked. Under China’s strict spatial land-use control system, construction land (referred to as Land Development Rights) is scarce. The construction land allocation system is inefficient due to the need for regional equity. In order to improve efficiency, the transfer of land development rights (TDR), oriented towards market-based allocation, has emerged [29].
Land Development Rights (LDR) originated from the provisions of the Town and Country Planning Act of 1947 in the United Kingdom concerning land-use conversion. The concept refers to the right to convert land use for value-added benefits, primarily expressed as the right to use land for non-agricultural development and construction [19]. In the United States, building upon the LDR model in the United Kingdom, land development transfer is proposed to be realized based on zoning [30]. Unlike in the United Kingdom and the United States, China’s LDR is not an independent land right but is embedded within the land property rights system, attached to land ownership or use rights. Chinese LDR lacks a clear definition at the legal level, yet it objectively exists in territorial spatial planning, arable land protection, and construction land development practices [31]. China’s arable land protection policy has led to the development of TDR. Subsequently, the policy linking the increase and decrease in urban and rural construction land, along with the ‘land ticket’ system, has further deepened TDR in China. This has gradually shifted the focus from protecting arable land to safeguarding both arable and ecological land. Current research on TDR mainly focuses on theoretical analysis and policy effect evaluations. Scholars typically discuss the effectiveness of TDR as a complementary mechanism for spatial land-use control, aiming to alleviate the rigidity of spatial land planning [32]. They focus on analyzing the role of TDR in the flexible allocation of construction land, the protection of arable land, and historical and cultural heritage [33]. However, its impact on carbon emissions remains unclear.
In the context of TDR, construction land in China is transferred across both urban and rural areas, as well as between cities. Cities facing a shortage of construction land quotas supplement the land development rights quotas to meet the needs of economic development; cities with an excess of construction land avoid its inefficient use and protect the ecological environment. Changes in the type and quantity of land use during the TDR process directly impact carbon emissions. The Chinese government requires that carbon emissions be reduced while ensuring a ‘win-win’ outcome for both economic development and ecological protection. Although TDR provides the foundation for this ‘win-win’ scenario, its impact on carbon emissions remains unclear. Therefore, this paper constructs a TDR scenario for the Guangxi Zhuang Autonomous Region of China as the study area and analyses its impact on regional carbon emissions by comparing it with the natural, development, and protection scenarios.

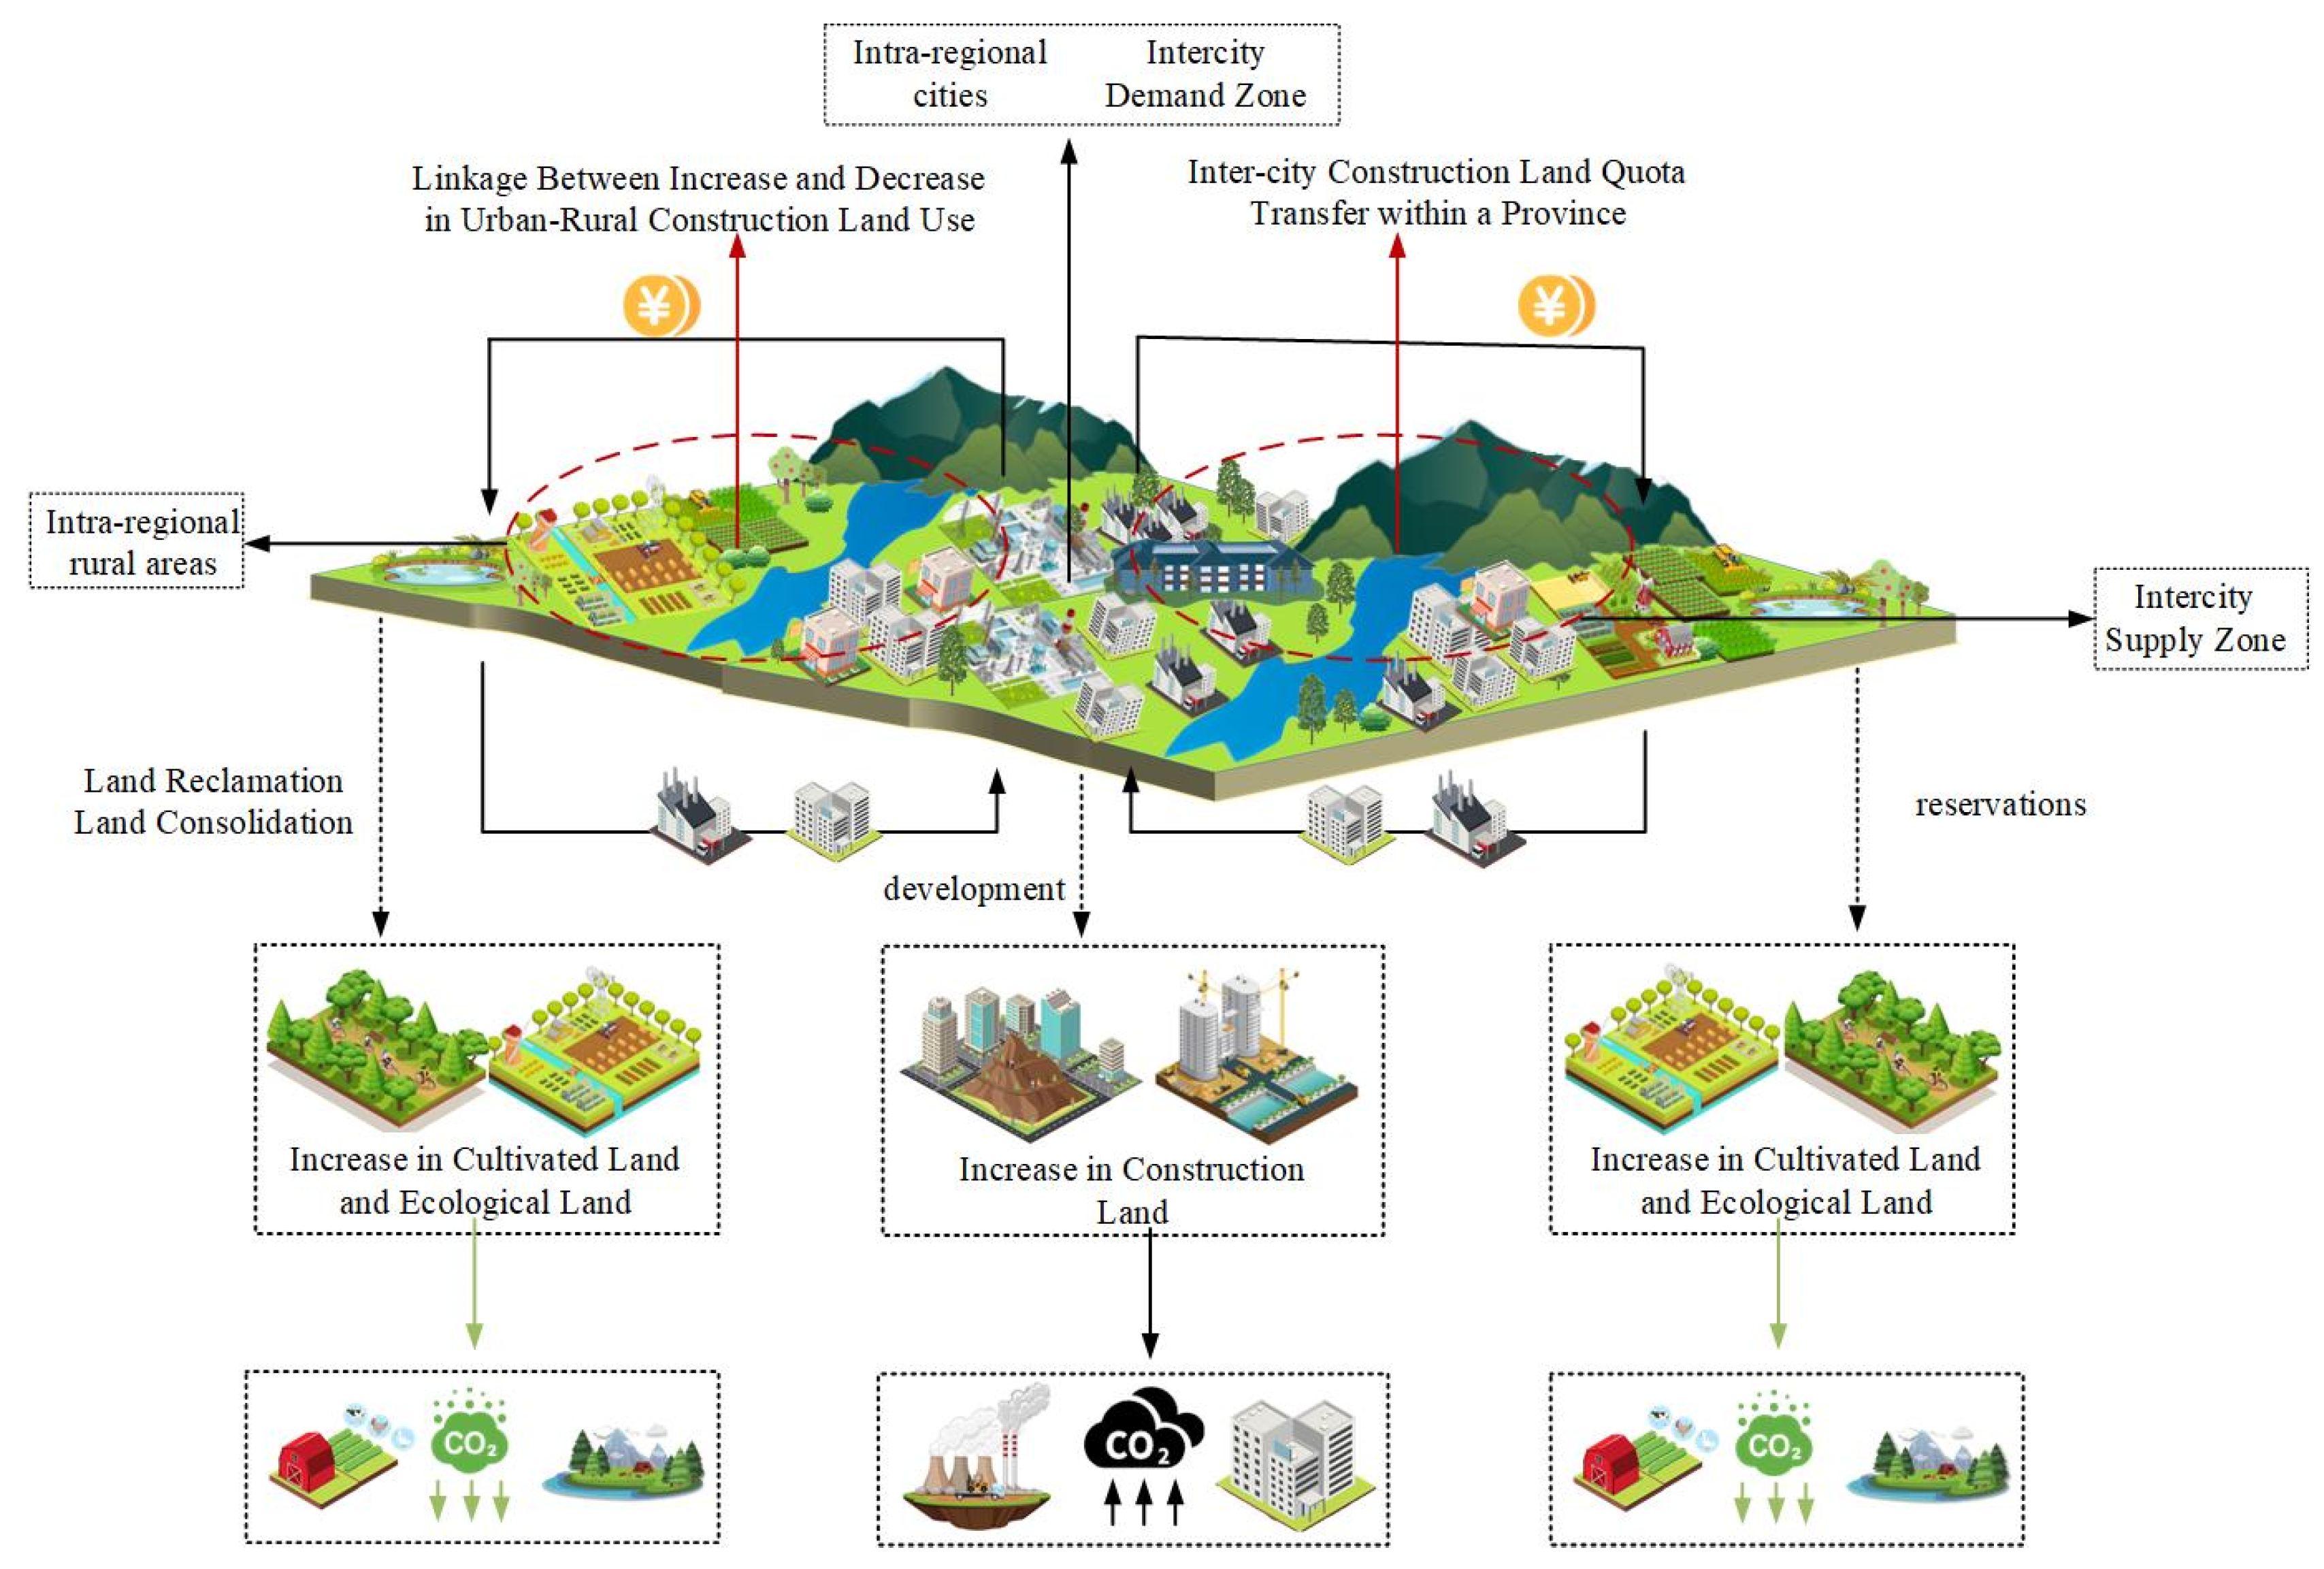
2. Theoretical Research Framework

In order to balance economic and social development with ecological and environmental protection, China has established a strict land-use control system, guided by territorial spatial planning [34]. To some extent, territorial spatial planning has promoted the rational and orderly use of land resources, helping to balance the pressures of food security and environmental protection. However, it also leads to spatial mismatches in land supply, affecting the efficiency of land resource use [35]. Scholars have begun to explore the complementary role of TDR in spatial planning. The basic principle of TDR is based on market transactions that recover part of the value-added proceeds generated by the additional development of land, compensating for the economic losses incurred by other parcels due to development constraints [19]. Based on planning and zoning, the area designated for development (the demand area) and the area designated for protection (the supply area) together constitute the TDR project area. The demand zone acquires LDR and the increase in the construction land quota. The supply area experiences a decrease in LDR but receives corresponding economic compensation. There are two main forms of TDR in China: one is urban–rural construction land replacement, which links the increase and decrease in urban and rural construction land, and the other is cross-city construction land transfer (Figure 1).
The first is the replacement of urban and rural construction land. The per capita area of rural land is larger than that of urban areas, and with the accelerated rate of urbanization, the rural population is migrating to urban areas. This theoretically releases a larger scale of non-construction land, increasing the area of arable land and natural ecological land [31]. However, in reality, the scale of rural construction land has not decreased, but rather shows an increasing trend. The actual impact of the shift in rural construction land types on carbon sequestration in terrestrial ecosystems has not been significant [36]. With the implementation of the policy linking the increase and decrease in urban and rural construction land, rural areas can transfer inefficiently utilized construction land to urban areas. In the process, they can increase the area of arable land and natural ecological space through land reclamation or remediation, restore surface vegetation, increase soil carbon storage, and reduce carbon emissions. Cities increase the area of construction land. The conversion of arable and ecological land into construction land will cause the carbon pool of terrestrial ecosystems to experience substantial carbon loss in a short period of time. In this process, surface vegetation is replaced by impermeable surfaces, such as cement and asphalt, leading to a weakening of the vegetation’s ability to sequester atmospheric carbon. Additionally, changes in the physicochemical properties of the soil reduce its ability to absorb organic carbon [4]. At the same time, as the area of construction land increases, the urban population grows, fossil energy consumption rises, and carbon emissions increase.
The second is cross-city construction land transfer. According to China’s construction land index approval policy, cities in the TDR supply area must transfer the current surplus land development right quotas in order to continuously obtain land development rights. This process reduces the use of arable land and ecological space for construction, prevents the destruction of surface vegetation, and preserves carbon stocks. The acquisition of land development rights by cities in the TDR supply zone increases the extent of construction land in these cities, which occupies arable land and ecological space, leading to a reduction in carbon stocks. At the same time, these cities will also experience an increase in carbon emissions due to population growth and higher fossil energy consumption.
The process of this paper consists of three main parts: data preprocessing, data prediction, and results analysis (Figure 2).

3. Data and Methodology

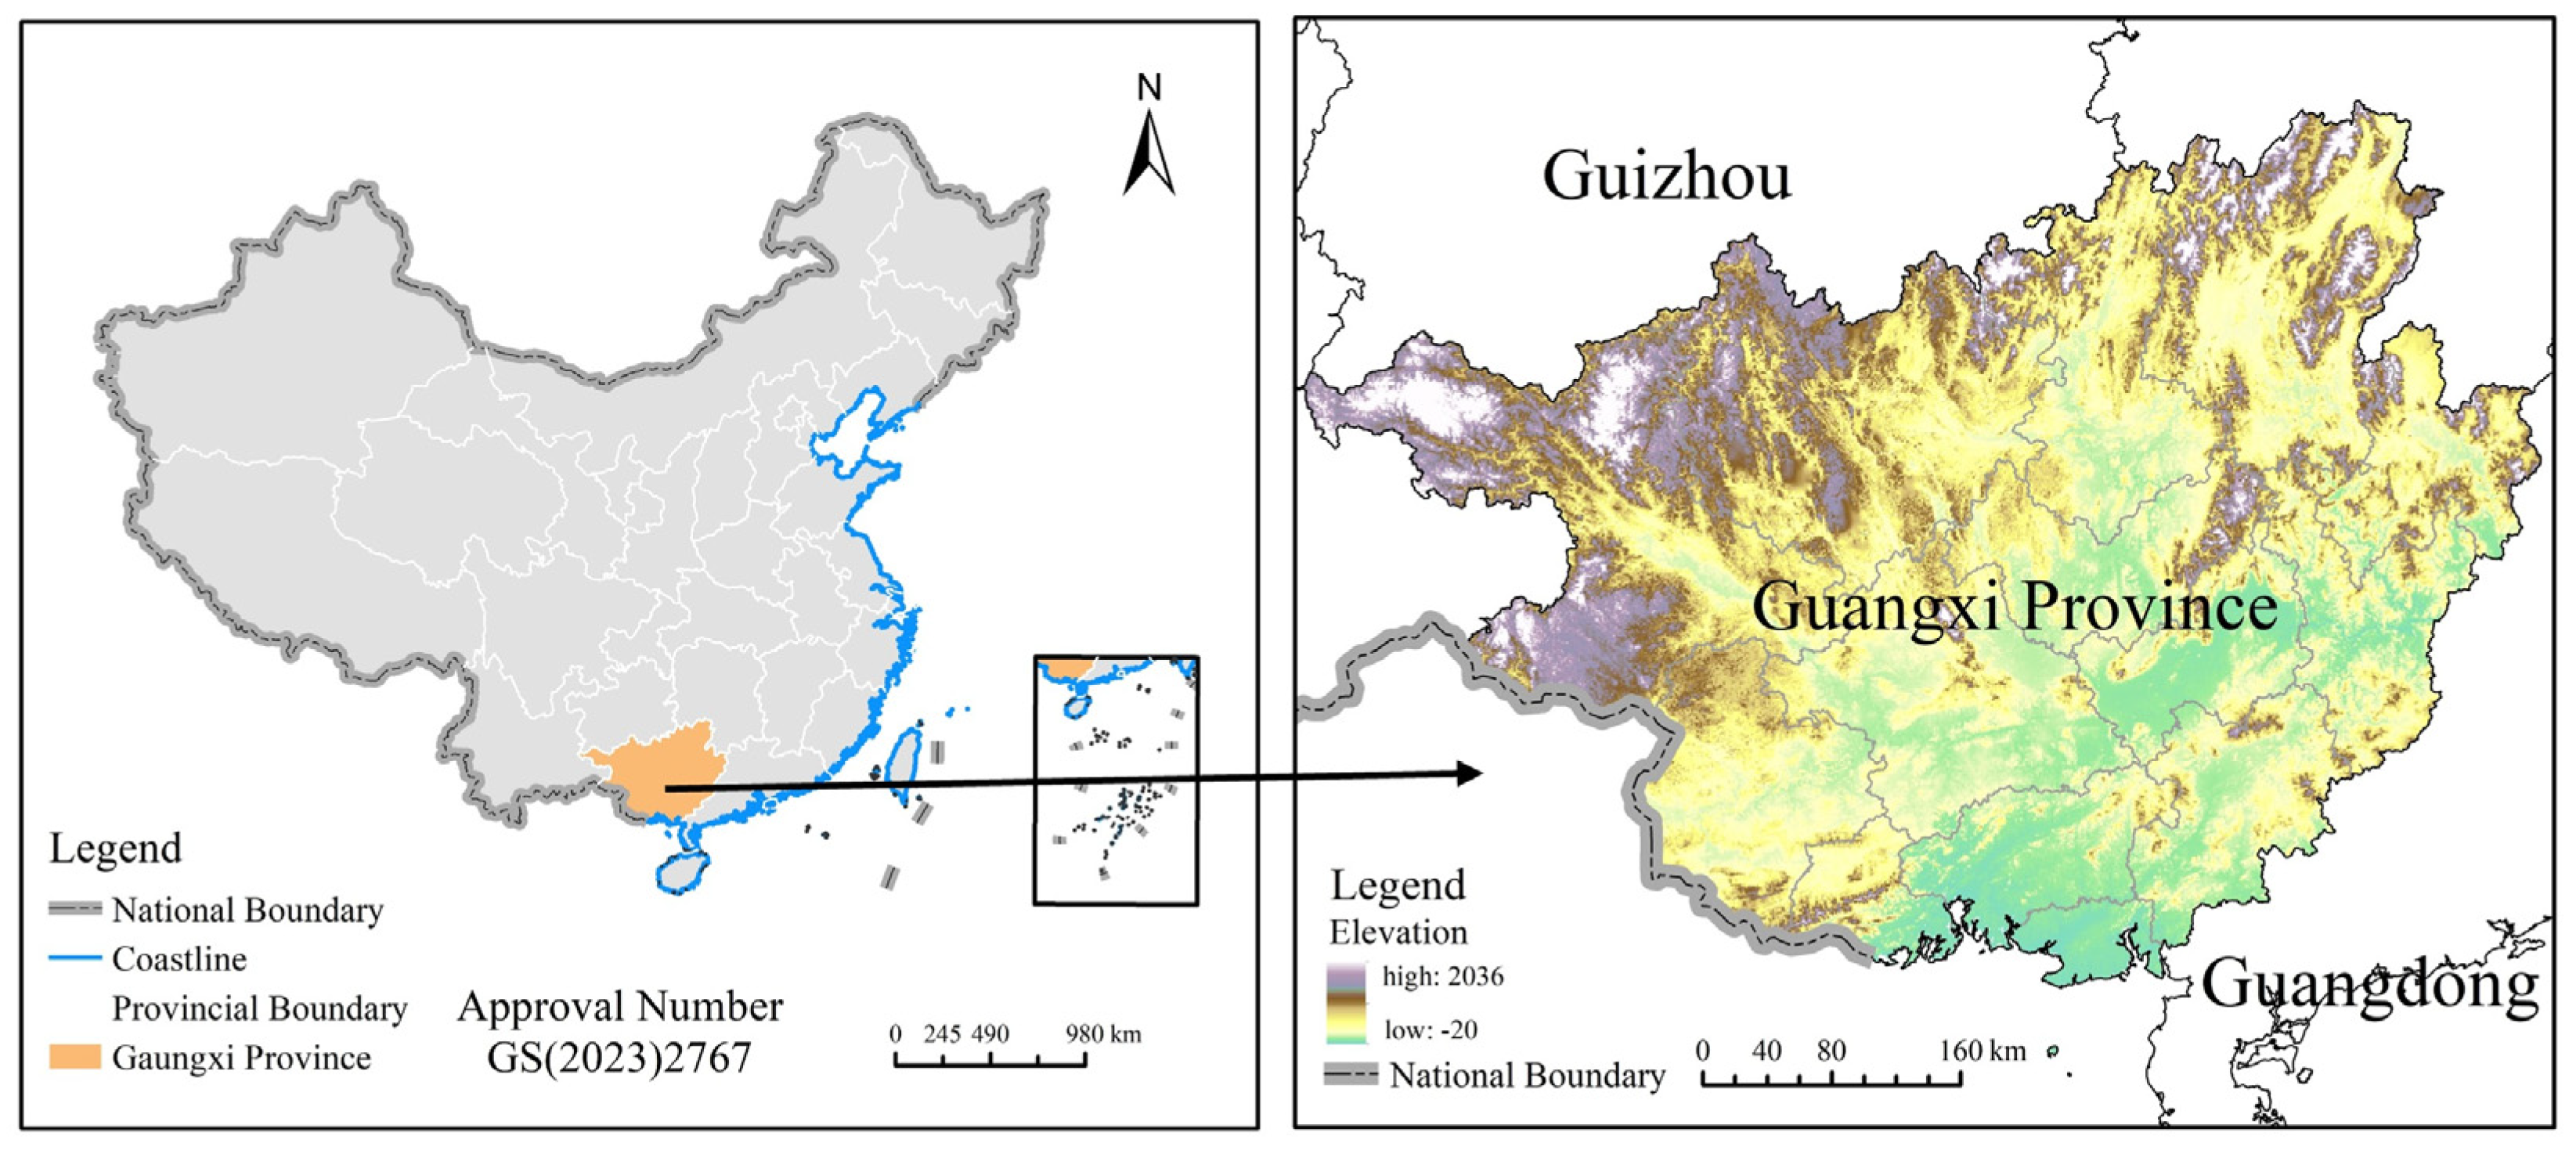
3.1. Overview of the Study Area

The Guangxi Zhuang Autonomous Region, located in southern China (Figure 3), is an important ecological source and one of the largest areas rich in forest resources, with a forest coverage rate of 62.55 percent, ranking third in the country. Recently, the Chinese government has instructed Guangxi to incorporate carbon peaking and carbon neutrality into the overall framework of economic and social development and ecological civilization construction. Recently, Guangxi has accelerated the development of China’s ecological civilization demonstration zone, strengthened its ecological environment advantages, continuously enhanced the carbon sink function of ecosystems, built an important ecological security barrier in the south, and promoted the green and low-carbon transformation of economic development. As an important region embodying the concept of ‘green mountains are golden mountains’, Guangxi needs to prioritize ‘dual-carbon’ efforts to reduce carbon emissions while balancing regional development and conservation.

3.2. Data Sources and Processing

The data sources and their processing methods in this paper are shown in Table 1. The land-use data for 2010 and 2020 were categorized into eight types: cultivated land, forest land, grassland, water bodies, urban, rural, industrial, and mining land, and unutilized land, based on the study’s requirements. The driving factors were uniformly projected using the Albers equal-area projection, and the spatial resolution was resampled to 30 m × 30 m.

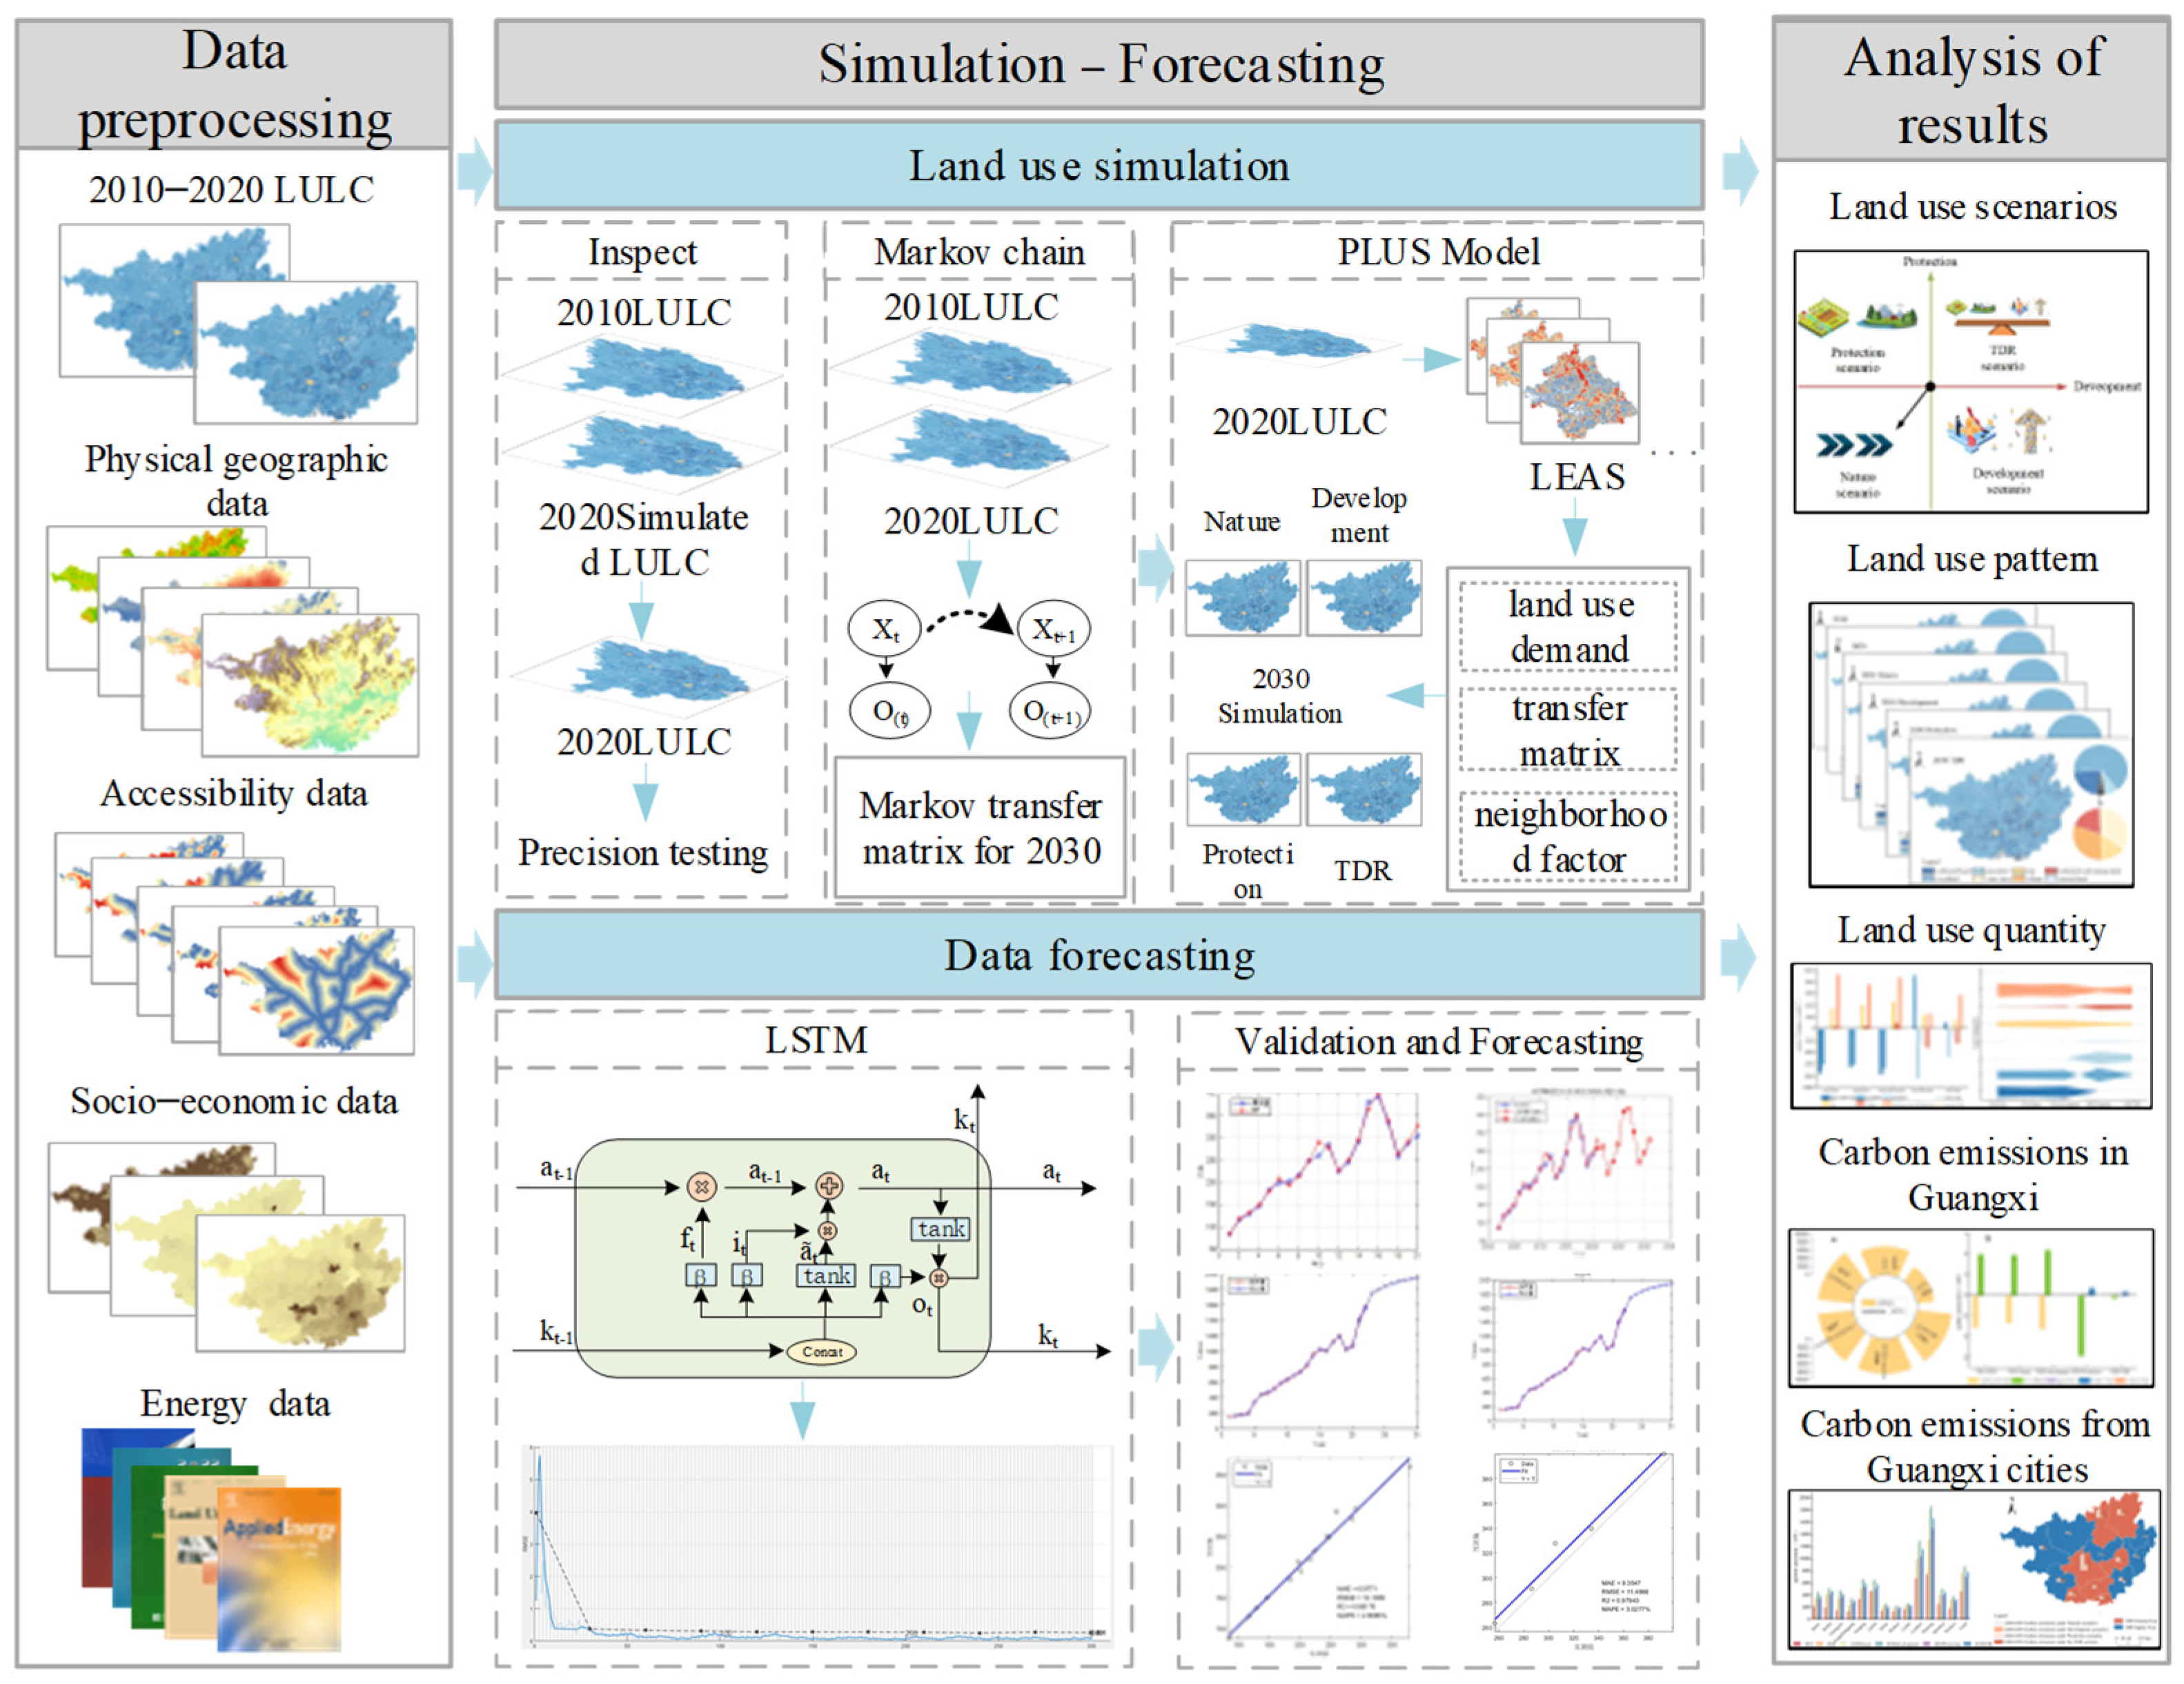
3.3. Research Methodology

3.3.1. MSPA Model

To strengthen ecological protection, this paper constructs a restricted conversion area in the process of future land-use change to safeguard important ecological spaces from being encroached upon. To identify important ecological spaces outside the nature reserves delineated in the Main Functional Area Plan of the Guangxi Zhuang Autonomous Region. This paper uses the morphological spatial pattern (MSPA) to identify ecological source areas [37]. Drawing on existing studies, this paper considers forest land and water as the foreground for MSPA profiling, with other land categories as the backdrop [38], and uses Conefor 2.6 to identify core ecological source sites, determining their importance based on the connectivity index (PC). Calculated as follows [37]:
P C = i = 1 n j = 1 n a i a j p i j * A L 2
where PC represents the connectivity index, n denotes the number of patches, a represents the patch area, p i j * is the maximum probability of species dispersal in patches i and j, and A L is the total landscape area.

3.3.2. Prediction of Land-Use Patterns Based on the PLUS Model

(1)
PLUS Model
The PLUS model, utilizing the Land Expansion Analysis Strategy (LEAS) and the multi-class stochastic patch fast seeding mechanism (CARS), effectively identifies the driving factors behind various types of land-use change and simulates patch-level transitions across different land types, achieving high simulation accuracy [39]. First, this paper selects 15 driving factors from both natural and socio-economic dimensions (Table 1). Subsequently, the 2010 land-use data were used as the initial input to assess the development potential of different land-use types. Finally, the 2010 data were input into the PLUS model as the baseline data for simulating land-use changes in 2020. We validated the simulation results against actual data to ensure the robustness of the study.
(2)
PLUS Model Scenario Setting
The optimization of the national territorial spatial pattern focuses on balancing the relationship between development and protection. To this end, this paper develops four land-use scenarios for 2030 based on the dual directions of development and protection in national territorial space (Figure 4).
The natural scenario maintains existing land-use patterns and serves as a baseline for modeling other scenarios.
The development scenario prioritizes land development and construction, limiting the conversion of urban, rural, industrial, and mining land to other land types while increasing the conversion of other land types to urban, industrial, and mining land. The probability of urban, industrial, and mining land being converted to other land types (excluding arable land) is reduced by 30%. The probability of rural land being converted to other land uses (excluding urban, industrial, and mining land) is reduced by 10%. The probability of arable land, forest land, grassland, water bodies, and unused land being converted to urban, industrial, and mining land increases by 10% [40].
The protection scenario prioritizes the protection of arable land and ecological integrity, ensuring no net loss of arable land based on its dynamic balance, while maximizing ecological benefits by expanding forested areas [19]. The probability of arable and forest land being converted to other land types is reduced by 50%. The probability of grasslands and water bodies being converted to other land types (excluding arable and forest land) is reduced by 30%. The probability of rural and other ecological land being converted to arable and forest land increases by 20% [29,40].
The TDR scenario seeks to balance development and conservation, necessitating the delineation of TDR supply and demand zones. We calculated the proportion of developed land to the total administrative area in each city in Guangxi and used this ratio as the primary criterion for delineating TDR supply and demand zones. Building on this, we refined the classification by incorporating objective indicators such as the number of non-agricultural employees and economic output [41] (Figure 5). In the parameter setting, we defined the parameters of the TDR demand zone based on those of the development scenario. Guided by the policy of maintaining a dynamic balance in the total arable land area, we considered the arable land resource endowments of cities within the TDR supply zone and referenced trading data on the supplementary arable land index, as well as surplus index data from urban–rural land-use adjustment transactions (sourced from the Guangxi Natural Resources Trading Centre), to proportionally replenish the arable land occupied by construction in the TDR demand zone. Similarly, following the policy of maintaining a dynamic balance in total forest land area, we employed a comparable method to replenish the forest land occupied by construction in the TDR demand zone. Following the urban–rural land-use adjustment policy and drawing on previous research on the decoupling relationship between the rural population and rural settlements, we propose that the probability of converting villages to arable land in the demand zone should be increased by 30% [42], while in the supply zone, this probability should be raised by 35%. This is based on the analysis of existing data, and the probability of shifting villages to arable land in the supply zone is about 5% higher than that in the demand zone. We believe that the probability of shifting unused land to cropland and forest land needs to be increased by 10 percent in both demand and supply areas [19].

3.3.3. Calculation of Carbon Emissions from Land Use

Land-use carbon emissions are categorized into direct and indirect types. Direct emissions stem from land use itself, while indirect emissions result from human activities supported by land, particularly production and living activities on construction land. The formula for calculating carbon emissions from land use is [5]:
E = E Z J + E J J = S i × δ i + C j × β j
where i and j represent the land-use type and fossil energy consumption type, respectively; S denotes the area of the land-use type (hm2), C represents the consumption of fossil energy (t or m3), and δ and β represent the direct carbon emission and carbon emission coefficient of energy consumption, respectively. Referring to existing studies and in combination with the IPCC Guidelines for National Greenhouse Gas Inventories, the carbon emission coefficients are presented in Table 2 [43,44,45].

3.3.4. Fossil Energy Consumption Forecasting

In time-series forecasting, the ‘sequence dependence’ among input variables increases the complexity of the model. A Recurrent Neural Network (RNN) is a type of neural network specifically designed to handle sequence dependency. The Long Short-Term Memory (LSTM) network builds upon the RNN by incorporating a ‘gated’ selection mechanism, enabling it to selectively retain or discard information and more effectively capture long-term dependencies. Fossil energy consumption is influenced not only by recent data but also by long-term trends, making LSTM an effective tool for forecasting its future trajectory [46]. In this study, a matrix containing energy consumption data for the first T periods is input into the LSTM model for training. The T + 1 period data serve as a reference for error correction of the output. These two datasets form a single batch for the LSTM model’s supervised learning, with T as the training step. To assess the model accuracy, RMSE (root mean square error), MAE (mean absolute error), and MAPE (mean absolute percentage error) were used for validation. The specific formulas are as follows [47]:
R M S E = 1 n y i y i ^ 2
M A E = 1 n i = 1 n y i y i ^
M A P E = 100 % n i = 1 n y i y i ^ y i
where y i is the true value, y i ^ is the predicted value and n is the number of samples.

4. Analysis of Results

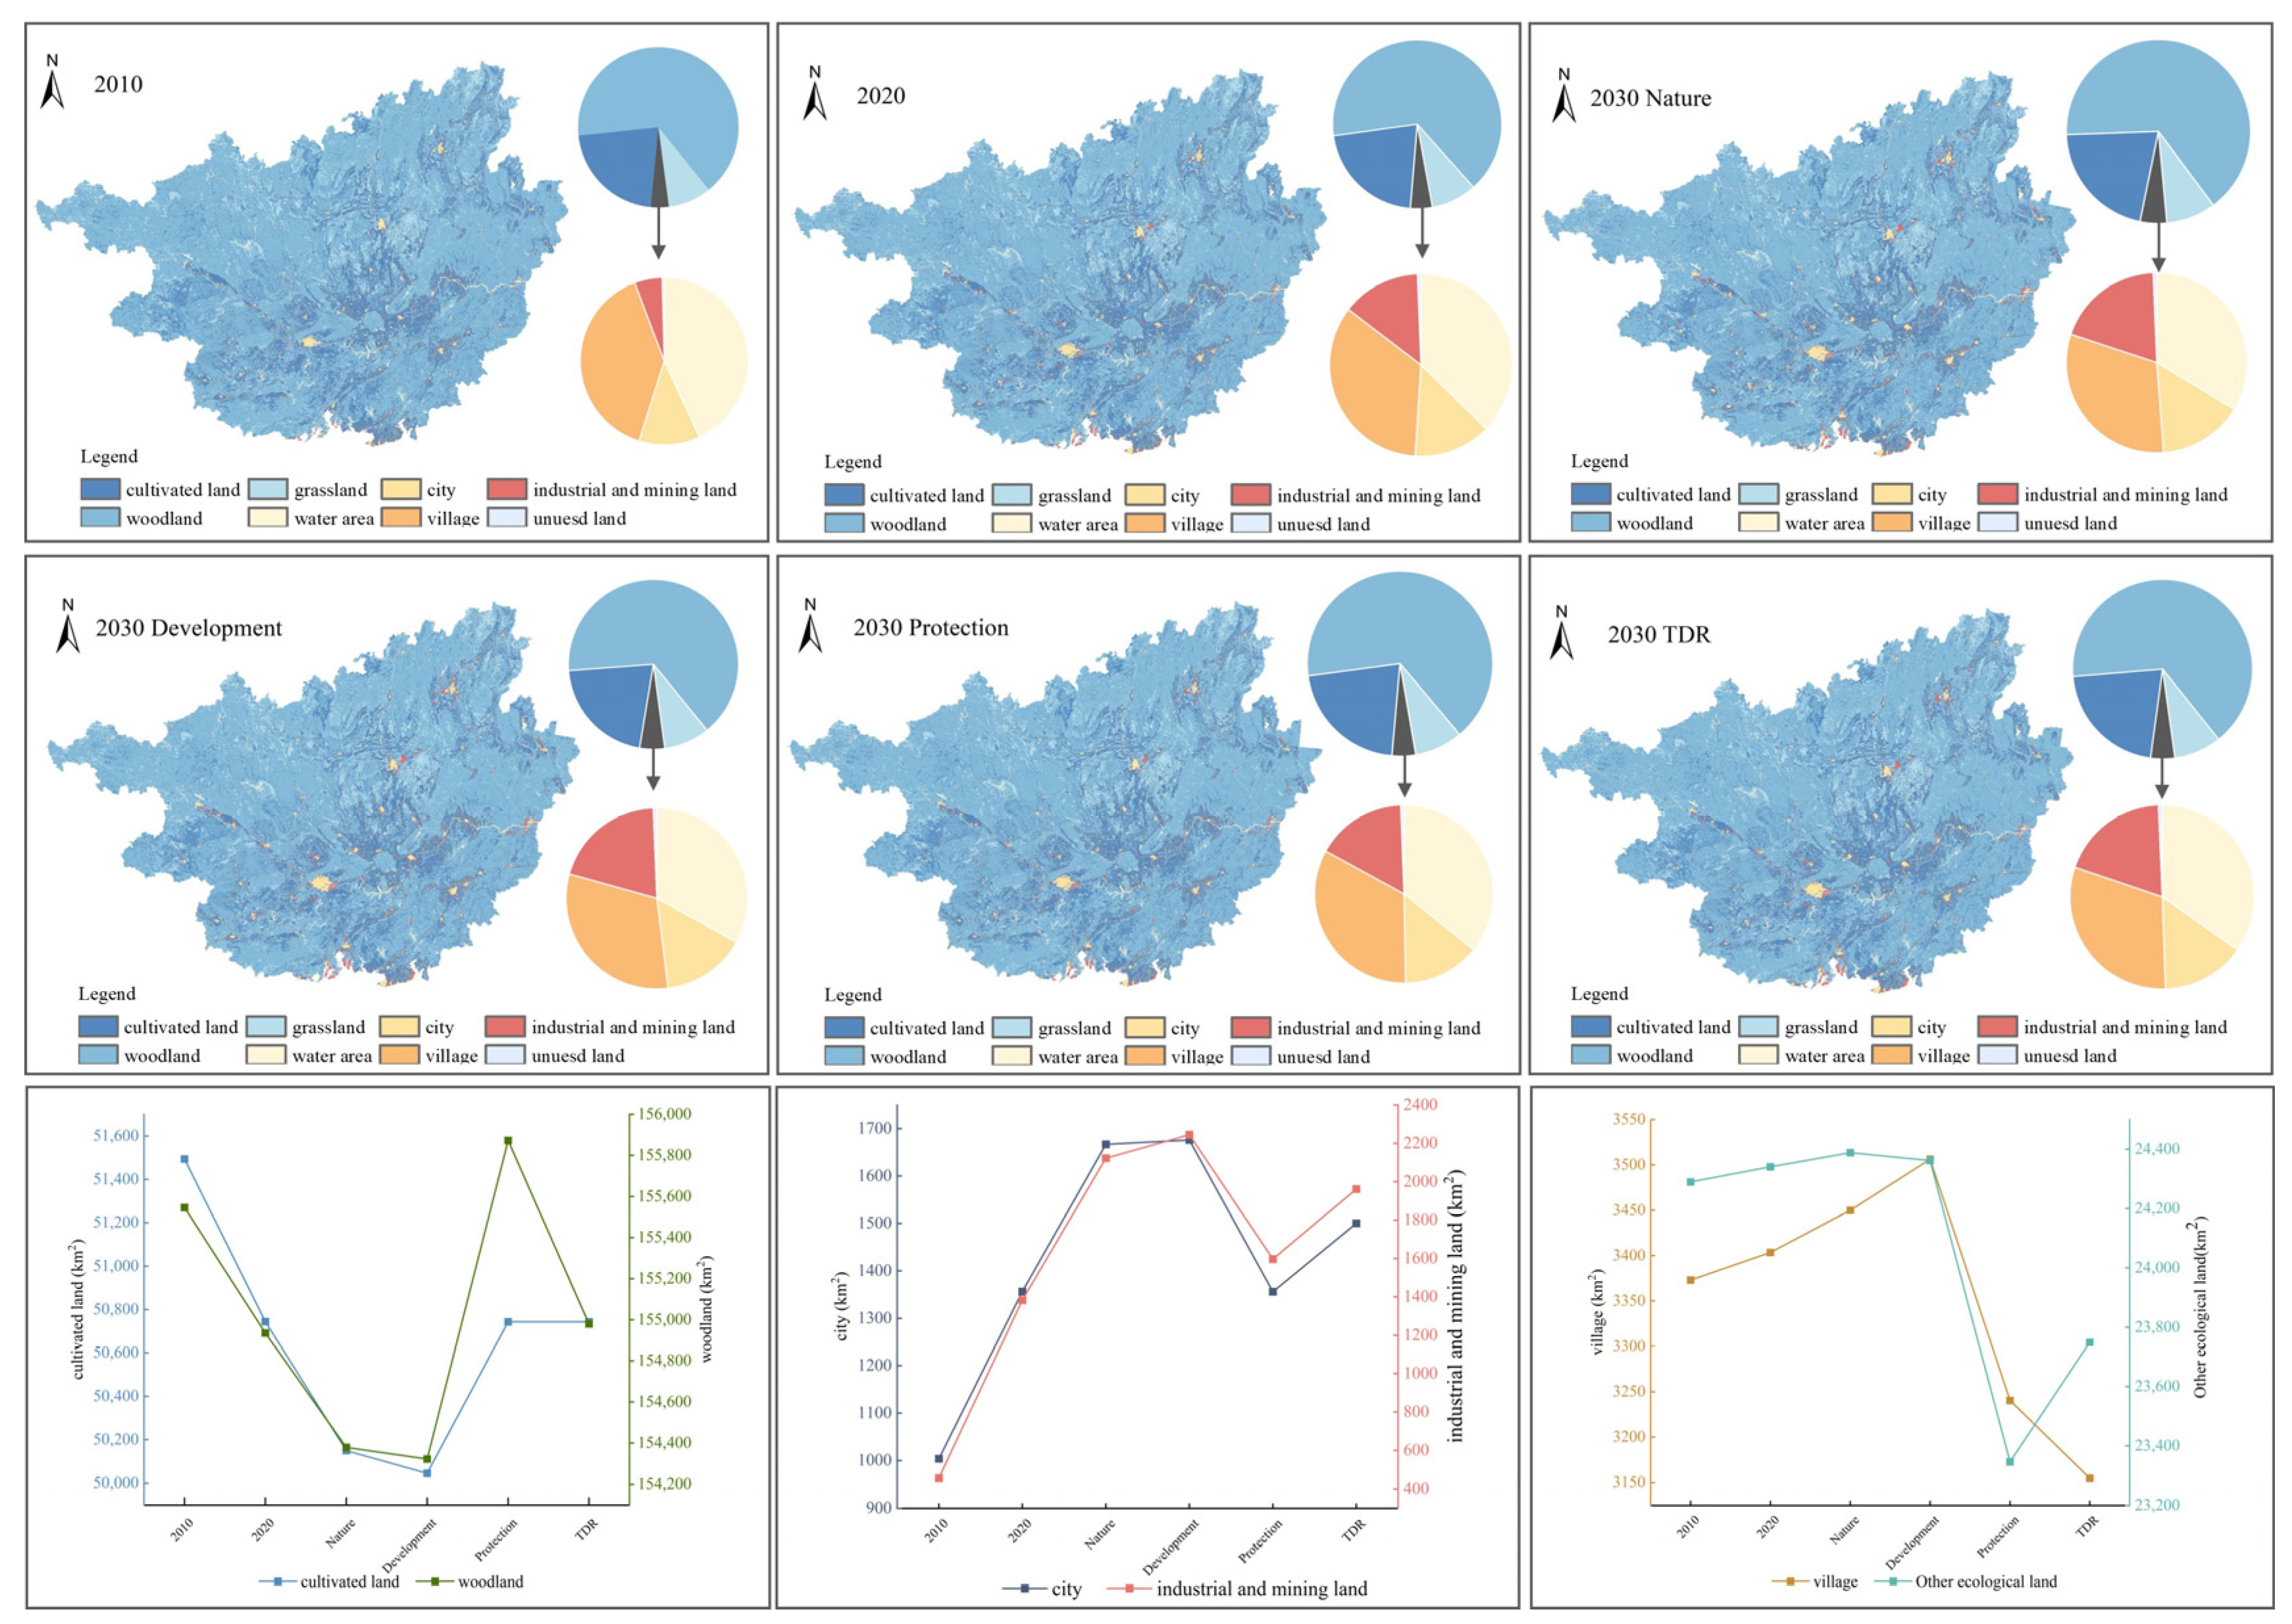
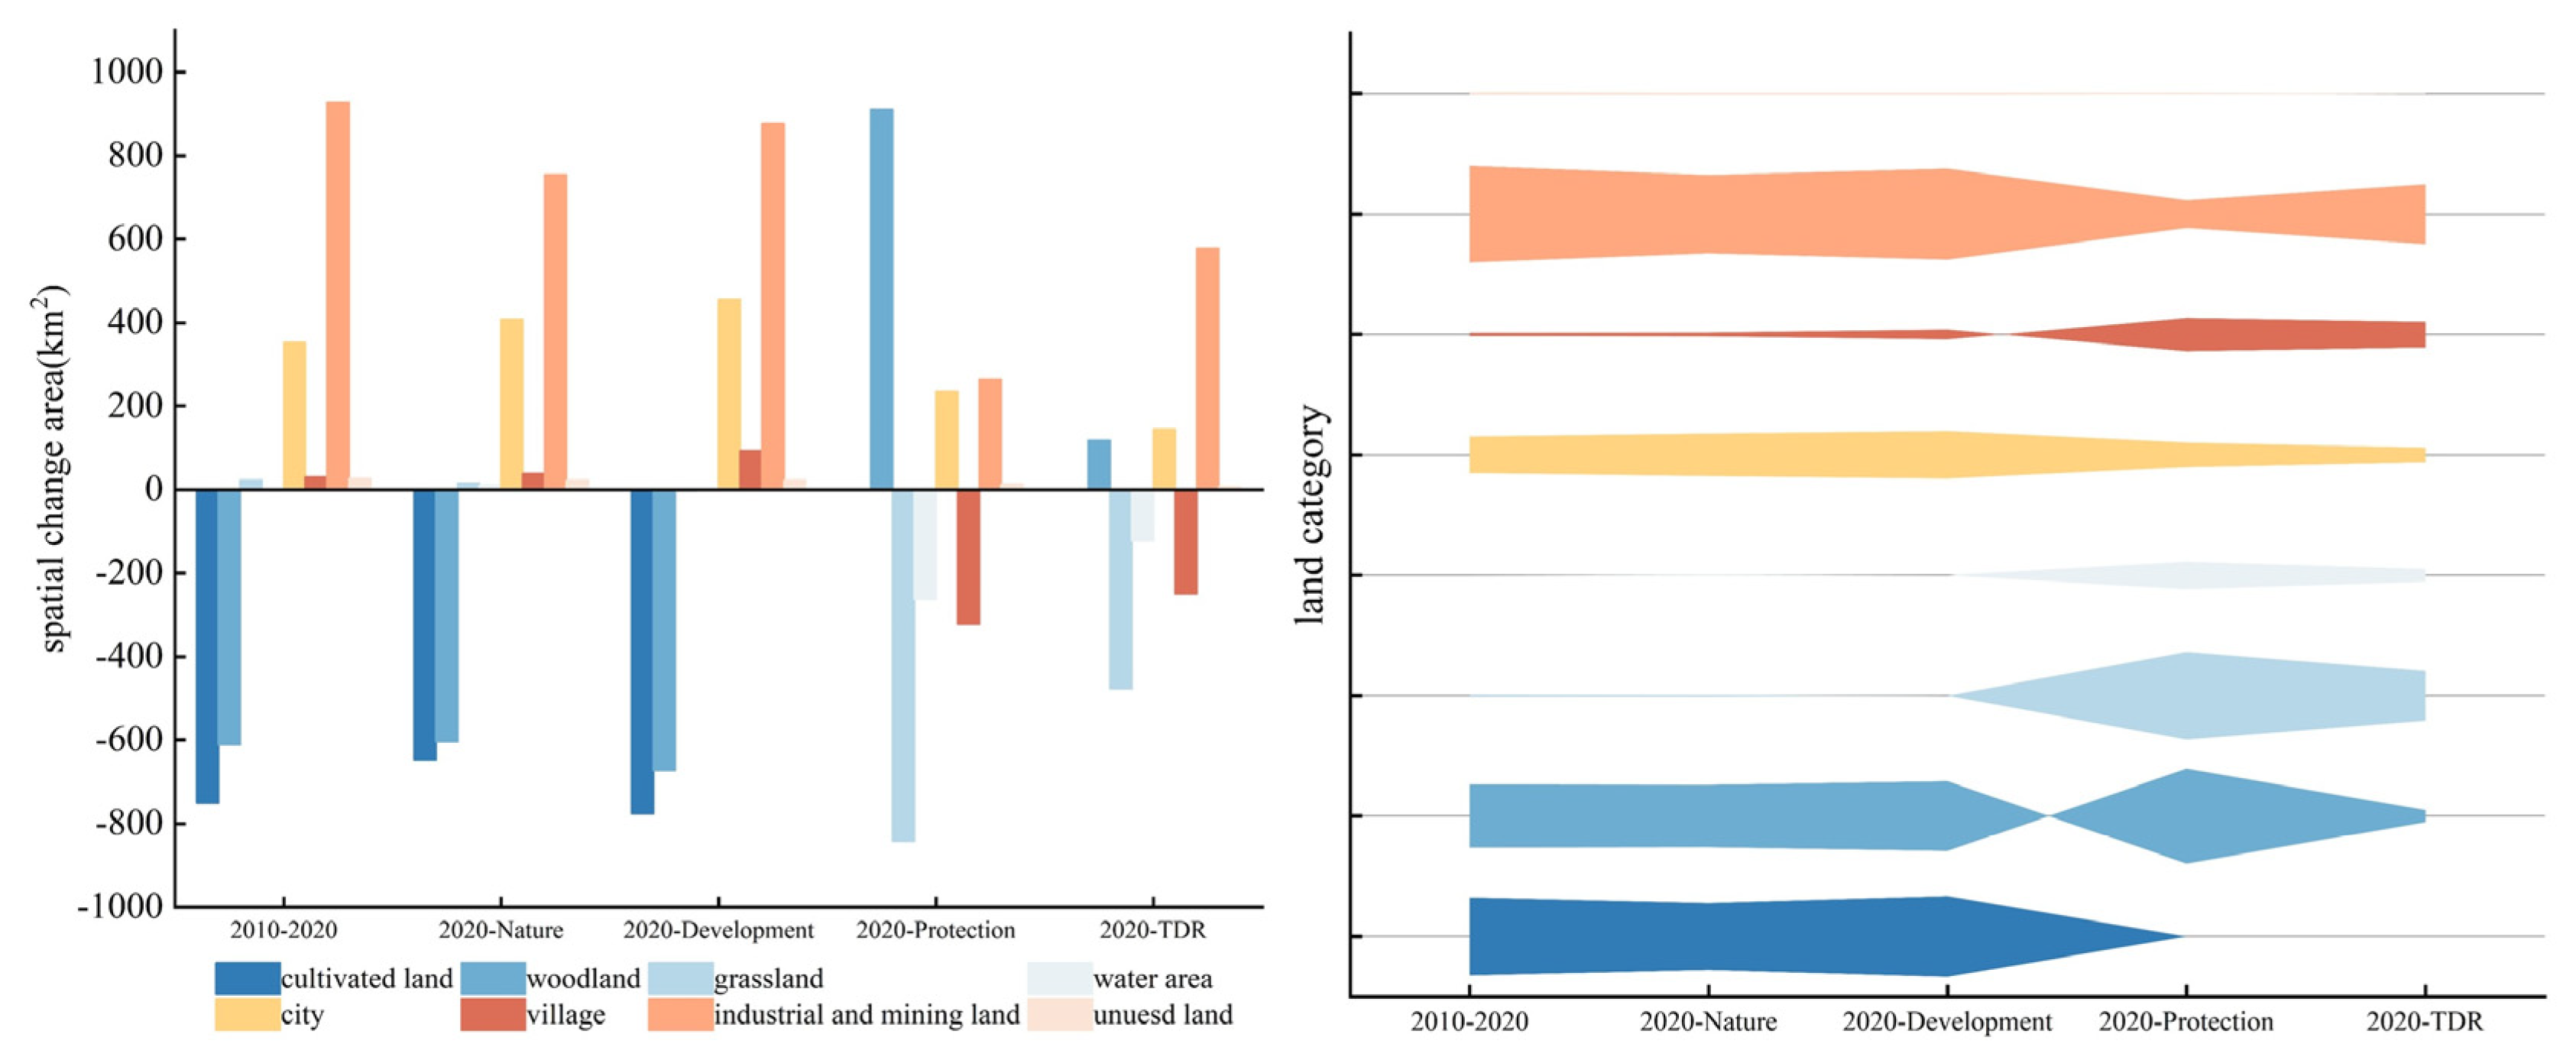
4.1. Analysis of Land-Use Change

First, the core areas of ecological landscape elements in Guangxi were identified through MSPA analysis (Figure 6a). Second, the connectivity significance of all core areas as potential ecological source areas was evaluated, and key ecological source areas were identified (Figure 6b). Then, by integrating the identified ecological source areas with Guangxi’s nature reserves (Figure 6c), the important ecological regions of Guangxi were delineated (Figure 6d). Finally, the delineated important ecological regions of Guangxi were designated as constrained conversion areas in the PLUS model to simulate future land-use changes. A comparison between the 2020 land-use prediction value and the actual data shows the kappa coefficient is 0.89 and the overall accuracy is 0.92, proving that the PLUS model can achieve effective prediction.
The spatial differentiation of land types in Guangxi is obvious (Figure 7). Production and living spaces (cultivated land, towns, villages, industrial and mining areas) are mostly distributed in the plains and river valleys, especially forming a cluster in the Guizhong Plain. Superior natural conditions have laid the foundation for the development of primary and secondary industries in these areas. These regions have convenient infrastructure, a concentrated population, and rapid economic and social development, positioning them as primary growth hubs in Guangxi. The ecological space (forest land, grassland, unutilized land) is distributed in the periphery of the production and living space, mostly located in the northern mountainous areas and part of the southern coastal zone. These areas have complex natural geographic conditions, making them unsuitable for large-scale production and living. They are characterized by a high rate of woodland coverage and a good ecological background. Spatial changes generally show a trend of construction space crowding out cultivated land and forest land. From 2010 to 2020, there was a significant increase in towns, industrial and mining land, etc., and cultivated land and forest land near towns were converted to construction land. From 2020 to 2030, the nature and development scenarios continue the trend of crowding out in the past; the protection scenario curbs the expansion of construction space, and the area of forest land increases, and there is a difference in the zoning of TDR scenarios, with the expansion of construction space and occupancy of cultivated land and forest land in the supply area. For space expansion and occupation of cultivated land and forest land, the protected area construction space is curbed, and the scope of cultivated land and ecological space is expanded.
There is a clear trend of land-use changes in Guangxi (Figure 8). From 2010 to 2020, there is a clear trend of a decrease in the area of cultivated land and forest land, an increase in the area of towns and industrial and mining land, some increases in the amount of grassland and countryside, and insignificant change in the area of water bodies. In the period of 2020–2030, the natural and developmental scenarios show a similar trend to the previous trend, but compared with the natural scenario, the built-up space (towns, industrial and mining, and countryside) in the developmental scenario increases significantly, occupying more cultivated land and forest land. Under the protection scenario, the area of arable land in Guangxi remains dynamically balanced, forest land expands significantly, and the expansion of urban, industrial, and mining land is effectively curbed. The rural land area decreases due to the implementation of the urban–rural land-use adjustment policy. Grassland and water areas shrink, indicating a transition from low-ecological-benefit land (e.g., grassland) to high-ecological-benefit land (e.g., forest land) under the protection scenario, aiming to achieve the dual objectives of arable land protection and ecological conservation. Under the TDR scenario, the total area of arable land remains stable. In the TDR scenario, while the total area of arable land remains stable, the areas of grassland, water bodies, and rural land decrease, whereas urban, industrial, mining, and forest land expand. The TDR scenario not only stabilizes the arable land red line and ensures ecological benefits but also accommodates construction land demand in a reasonable manner. Finally, changes in unused land remain minimal.

4.2. Analysis of the Spatial and Temporal Evolution of Carbon Emissions

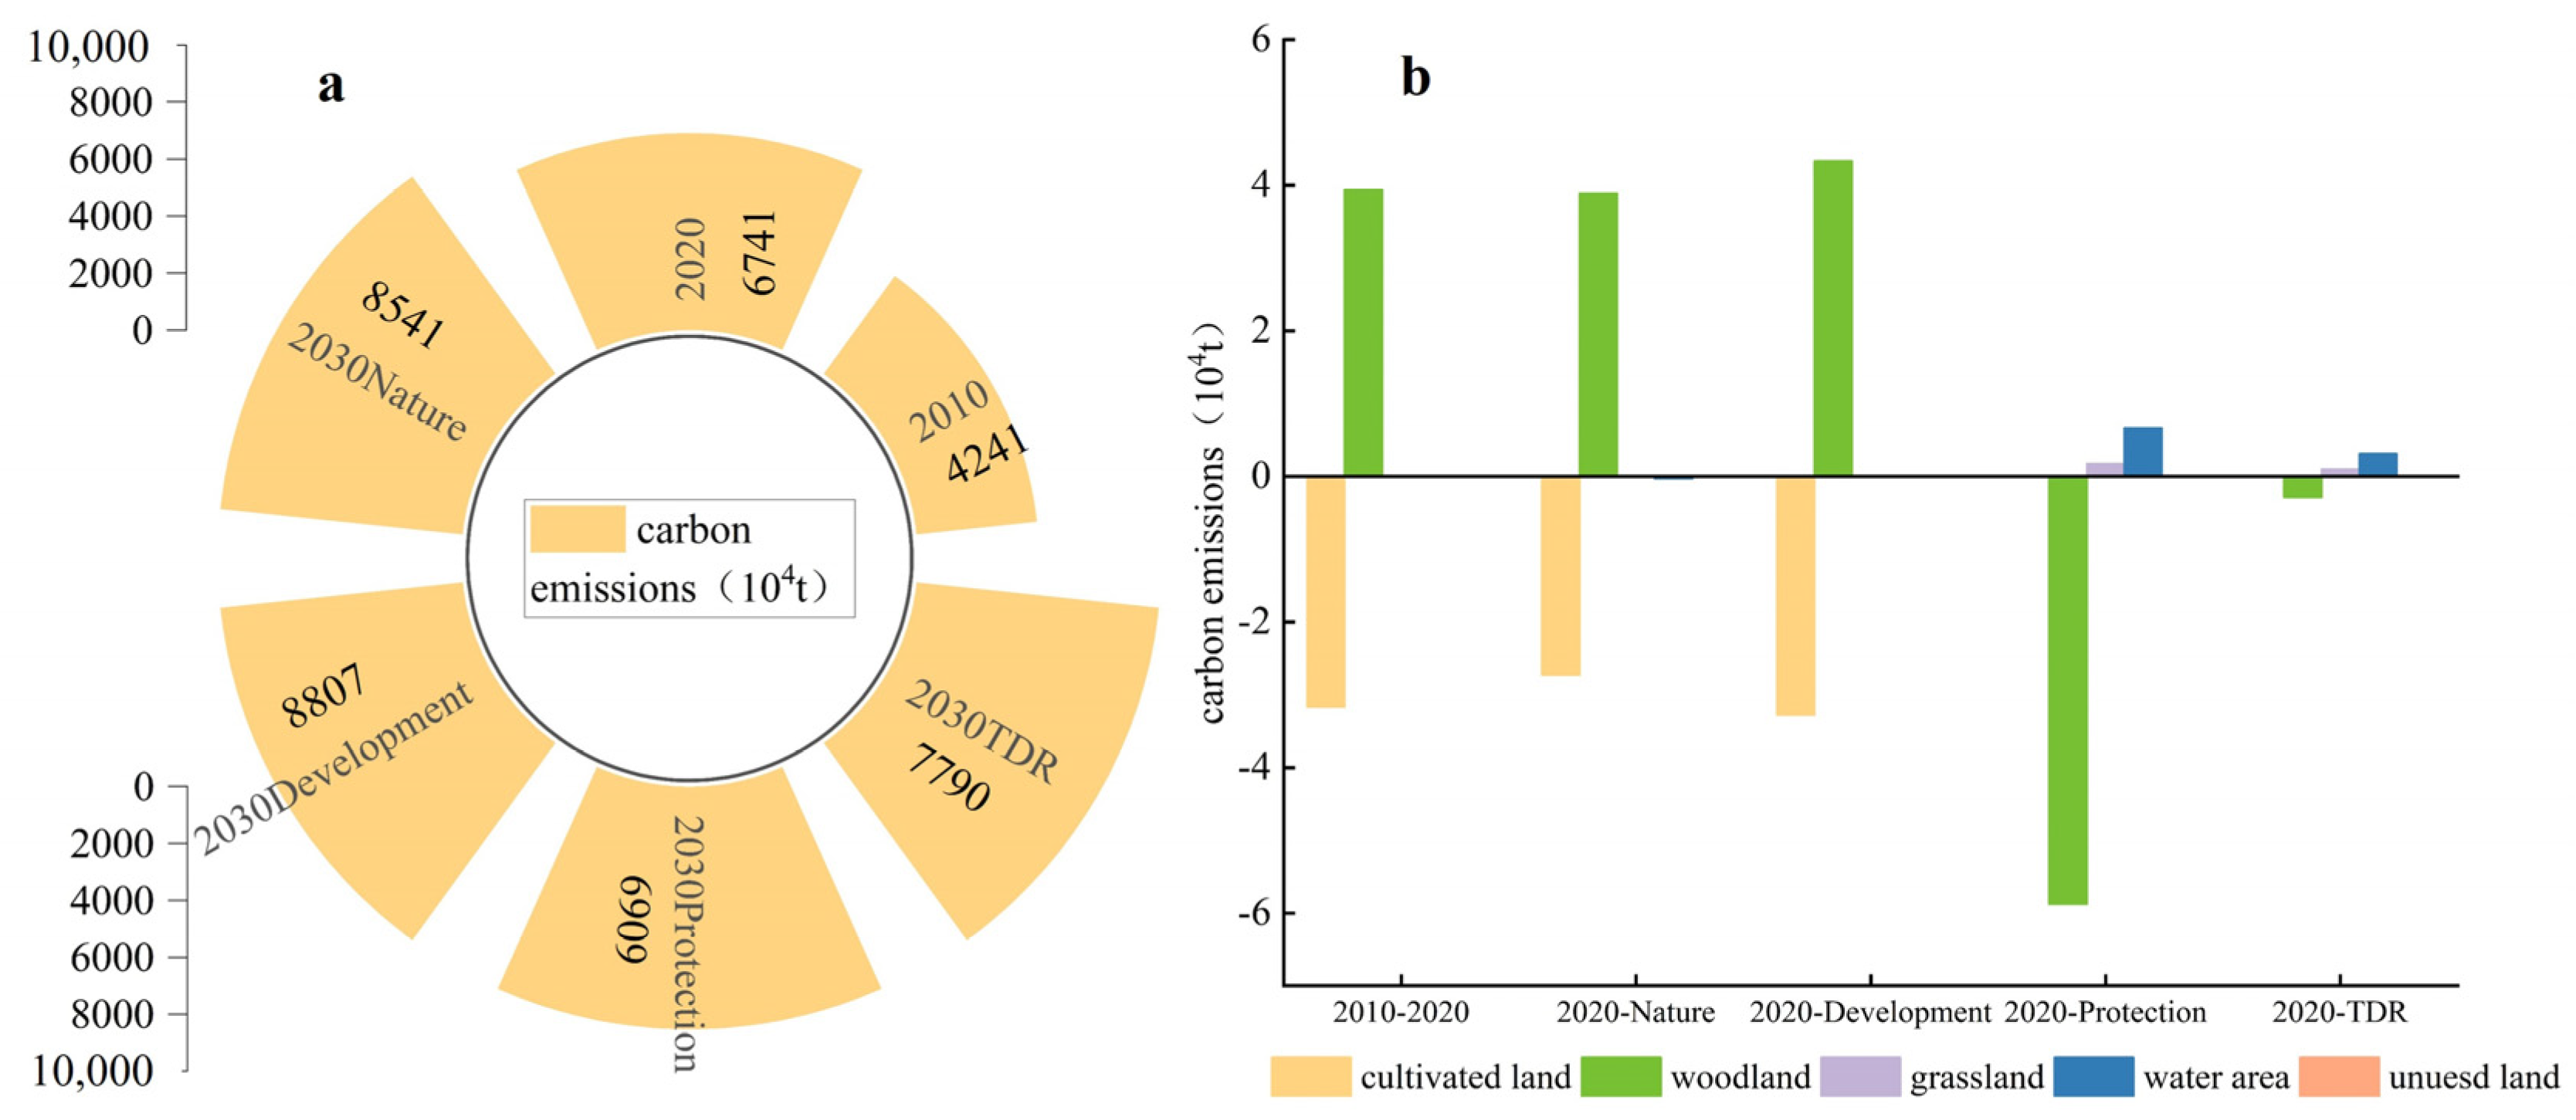
4.2.1. Spatial and Temporal Evolution of Carbon Emissions in Guangxi

Based on the acquired land-use data, we first calculate the direct carbon emissions in Guangxi under four scenarios for the years 2010, 2020, and 2030 using the carbon emission coefficient method. Second, we use the 2010 and 2020 editions of the China Energy Statistics Yearbook and employ an LSTM model to predict Guangxi’s energy consumption in 2030. Then, we calculate Guangxi’s indirect carbon emissions based on the proportions of urban, industrial, mining, and rural areas (Table 3). Finally, we integrate the results to determine the total carbon emissions in Guangxi (Figure 9).
Carbon emissions in Guangxi exhibit an increasing trend. Between 2010 and 2020, carbon emissions in Guangxi increased by 25 million tonnes, with indirect carbon emissions rising by 24.99 million tonnes, making them the primary source of growth. This is due to population growth and increasing urbanization, which have significantly altered the land-use structure. To meet the demands of economic and social development, a substantial amount of arable and ecological land has been converted into construction land. The expansion of construction land is positively correlated with fossil energy consumption, which increases accordingly. The expansion of construction land results in a decline in arable and forest land. The reduction in arable land leads to lower carbon emissions from cropland. Meanwhile, the decline in forest land reduces carbon sequestration and increases carbon emissions. As shown in Figure 9b, the decline in forest land contributed more to the increase in carbon emissions than the reduction in cropland. In contrast, grassland, water bodies, and unused land had a relatively minor impact on mitigating carbon emissions (Figure 9, Table 4). Therefore, both direct and indirect carbon emissions show an increasing trend, and the overall carbon emissions in Guangxi have increased.
Under the natural scenario, Guangxi’s carbon emissions continue to rise, increasing from 67.41 million tonnes to 85.41 million tonnes, a rise of 17.99 million tonnes. Indirect carbon emissions remain the primary driver of growth, although the rate of increase is slowing. This is attributed to the deceleration of population growth, the urbanization rate gradually approaching its inflection point, and a concurrent slowdown in growth. Additionally, energy consumption has declined compared to the past decade. Similar to the 2010–2020 period, the areas of cropland and forest land continue to decline in terms of direct carbon emissions. The reduction in cropland results in a smaller decrease in carbon emissions compared to the increase caused by the loss of forest land. Consequently, direct carbon emissions in Guangxi continue to rise.
Under the development scenario, Guangxi’s carbon emissions reach 88.07 million tonnes, exceeding those in the natural scenario. In this scenario, we assume that the population growth rate becomes higher and the demand for construction land increases. A large amount of construction land will crowd out the arable land and forest land. The difference in carbon emissions caused by changes in the area of arable land and forest land increases. In the development scenario, the increase in carbon emissions due to forest land loss outweighs the reduction in carbon emissions resulting from the decline in arable land. Therefore, direct carbon emissions increase in Guangxi. In terms of indirect carbon emissions, the increase in construction land means an increase in energy consumption. Therefore, indirect carbon emissions also increase.
Under the protection scenario, Guangxi’s carbon emissions amount to 69.09 million tonnes, significantly lower than those in both the natural and development scenarios. Under the protection scenario, the overall area of arable land remains dynamically balanced, with carbon emissions from arable land remaining largely unchanged. Notably, to maintain the dynamic balance of arable land, we adopt the policy of linking urban and rural construction land expansion and reduction, converting rural construction land into arable land. This behavior leads to a reduction in indirect carbon emissions from rural construction land. In addition, the transformation of low eco-efficiency space to high eco-efficiency space, especially the significant increase in the amount of forest land, the carbon sink capacity of terrestrial ecosystems is enhanced, and the effect of carbon emission reduction is obvious. The protection scenario is achieved at the cost of restricting the demand for construction land. In this scenario, the amount of construction land in Guangxi decreases while the amount of arable land and ecological land increases. As a crucial driver of economic and social development, restricting construction space may pose a risk of slowing down economic growth.
Under the TDR scenario, Guangxi’s carbon emissions amount to 77.9 million tonnes, representing the optimal solution for reducing carbon emissions related to land use. Under the guidance of the TDR framework, Guangxi protects arable and ecological land while fostering economic and social development. Through zoning transfers, Guangxi dynamically adjusts the allocation of construction land to meet the growing demand of population increase, ensuring protection scenarios whereby the area of arable land remains constant and ecological benefits are maintained. Through structural adjustments in land use, Guangxi has facilitated the partial conversion of rural construction land into arable land, the transformation of low eco-efficiency spaces (such as grasslands) into high eco-efficiency spaces (such as forest land), and the optimal allocation of construction land based on the needs of different cities. The dynamic balance of arable land and the increase in forest land have significantly reduced direct carbon emissions from land use. Through optimal allocation, the increase in construction land is reduced, energy consumption increases less, and indirect carbon emissions are minimized. Therefore, TDR has effectively achieved a balance between development and conservation under the ‘dual-carbon’ objective.

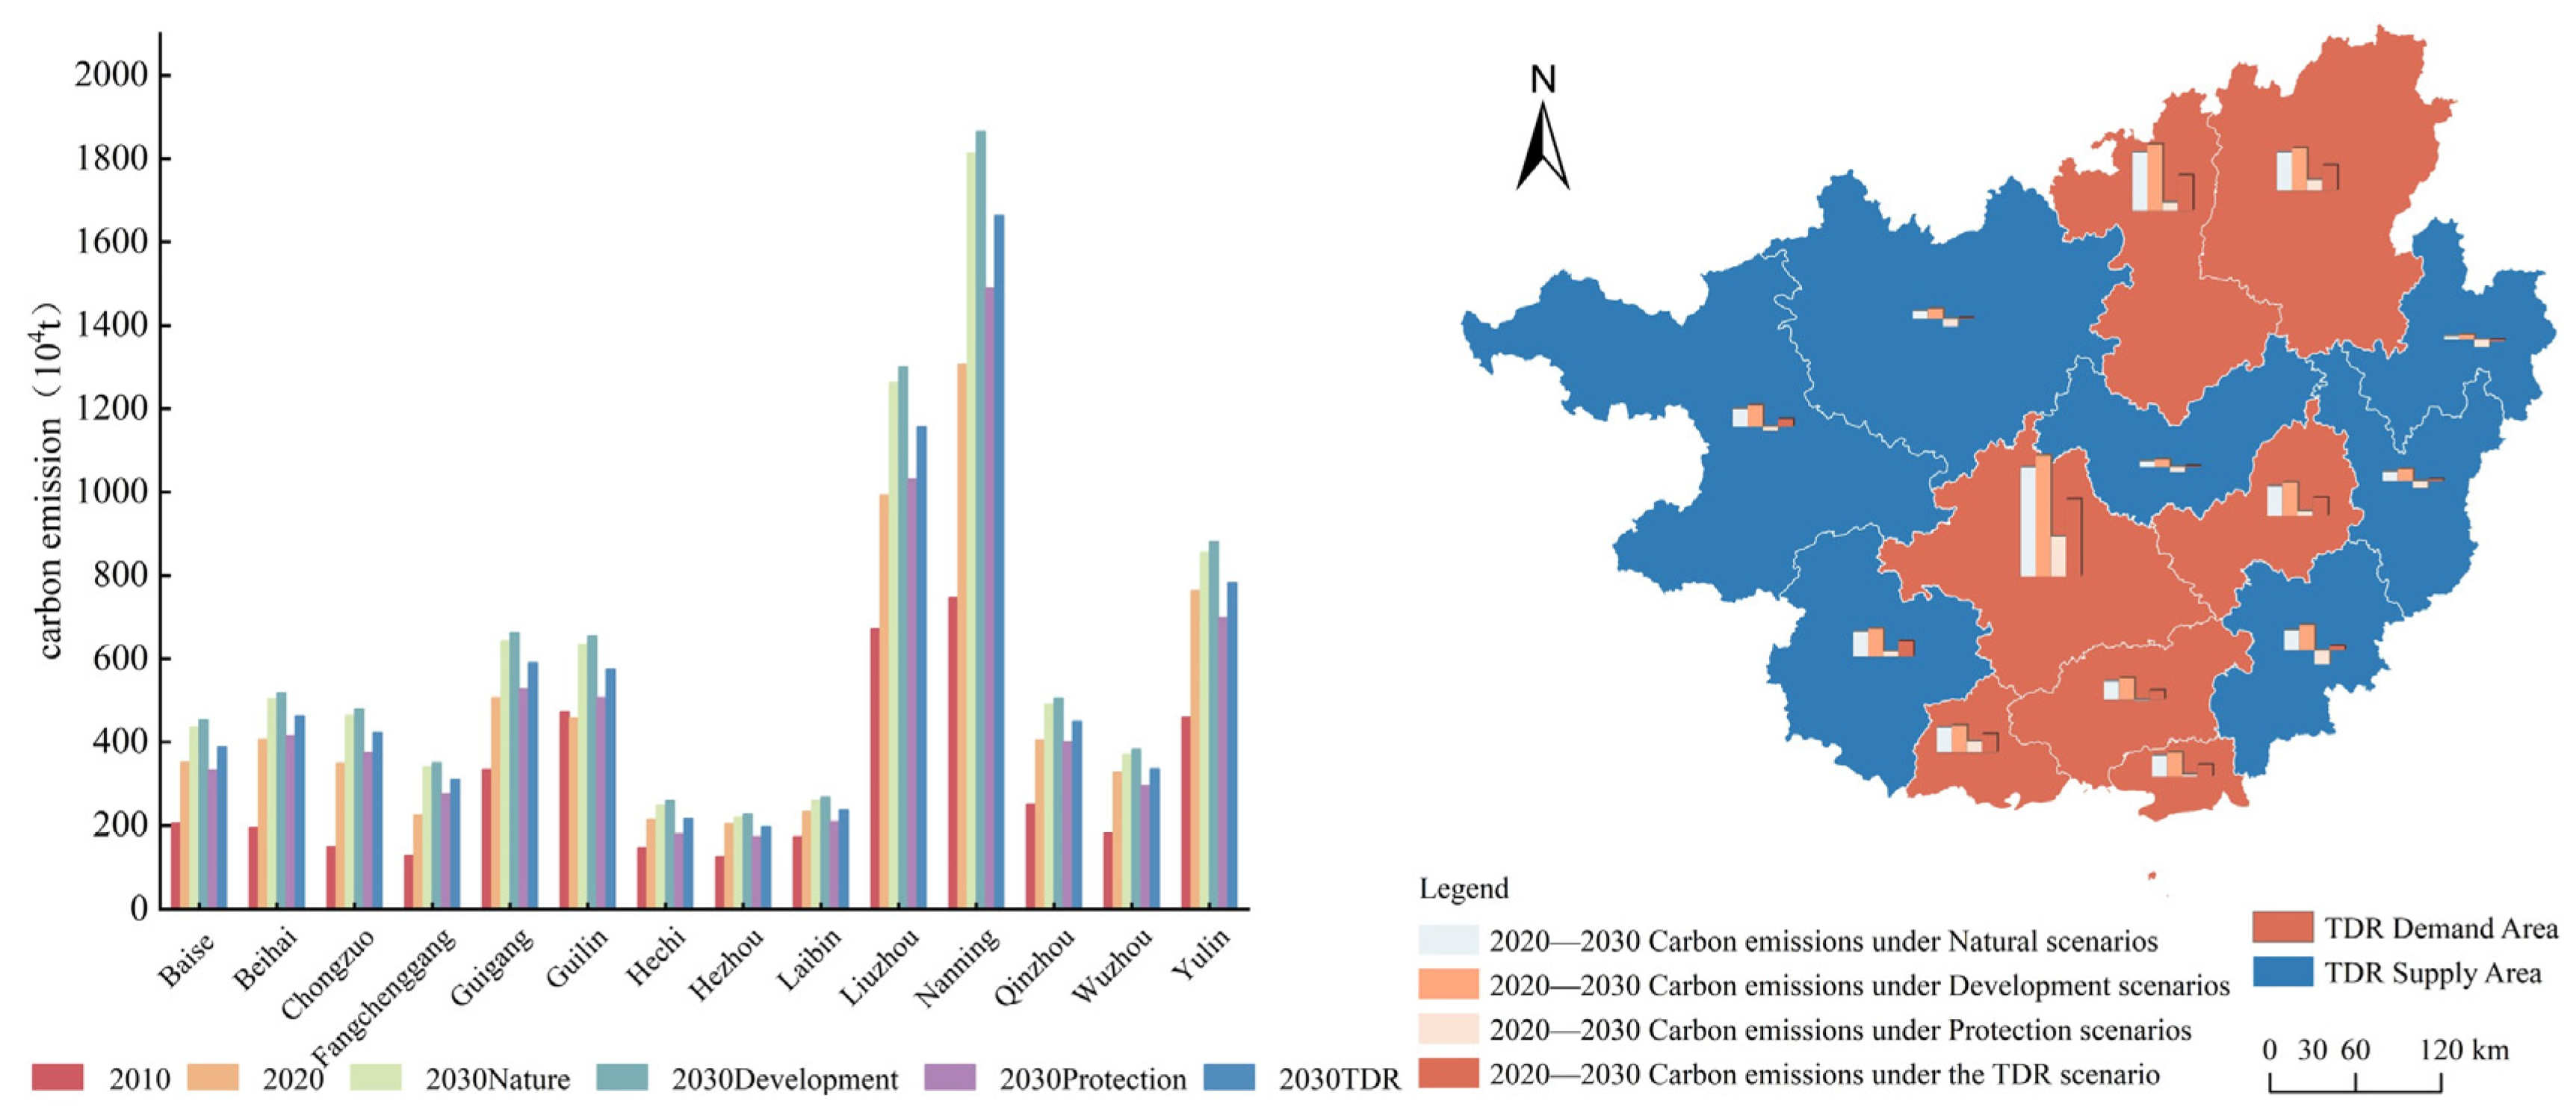
4.2.2. Spatial and Temporal Evolution of Carbon Emissions in Guangxi Cities

This paper calculates the carbon emissions for each city in Guangxi (Figure 10). Direct carbon emissions are measured according to the land-use types of each city, while indirect carbon emissions are calculated based on the population, GDP, and industrial development ratio of each city. The results, shown in Figure 7, indicate that carbon emissions in all cities of Guangxi are on an upward trajectory. However, compared to 2010–2020, the growth rate of carbon emissions in each city slows down in 2020–2030, carbon emissions will be controlled under both scenarios, but a more effective control strategy needs to be selected.
Under the natural scenario, each city continues its previous land-use patterns. No spatial conversion of land use occurs between cities, and each city exhibits a clear upward trend in carbon emissions under this scenario. Under the development scenario, each city expands its construction land use. The area of urban, industrial, and mining construction land increases significantly, while the area of rural construction land does not decrease, with no spatial conversion of built-up land. The expansion of construction land results in higher carbon emissions. Under the protection scenario, each city maintains a dynamic balance in the total area of arable land, with a significant shift from low to high eco-efficiency space, while the amount of urban, industrial, and mining construction land is strictly controlled. Carbon emissions decrease in all cities. Under the TDR scenario, construction land transfer between cities is permitted. In supply-zone cities, the increase in carbon emissions is lower, while demand-zone cities experience a larger increase in emissions. Furthermore, carbon emissions in both supply-zone and demand-zone cities are lower than those under the natural and development scenarios, indicating that TDR can effectively reduce urban carbon emissions.

5. Conclusions and Discussion

5.1. Discussion

In this paper, we use the PLUS model to construct a TDR scenario and compare it with three other scenarios—natural, development, and conservation—to clarify the impact of TDR on regional carbon emissions. We provide a new perspective for achieving the ‘dual-carbon’ goal under economic and social development, food security, and ecological protection.

5.1.1. Impact of Policies on the Transfer of Land Development Rights

TDR provides an exchange market between supply and demand zones [48]. Currently, 239 communities in the United States have used TDR to promote economic development and ecological conservation [30]. Our study demonstrates that China’s TDR policy has played a similar role. TDR helps protect arable land and ecosystems, thereby reducing regional carbon emissions. At the same time, TDR facilitates the optimal allocation of spatial resources and promotes the intensification of construction land. In summary, we believe that TDR has improved both regional efficiency and equity. TDR in China is not based on market mechanisms but is primarily driven by the government. The government’s goal is to optimize the allocation of construction land and alleviate the rigidity of territorial spatial planning [19]. TDR can have a positive impact in the short term. However, the long-term implementation of TDR may lead to the government’s dependence on land finance, causing the continuous expansion of construction land, which is not conducive to low-carbon land use. At the same time, a large number of TDR projects will lead to the shrinking of the regional transfer space and the contraction of the TDR market [49], making TDR unsustainable. To continue implementing TDR projects, the government will occupy ecological land, destroy surface vegetation, and increase regional carbon emissions. Therefore, TDR needs to be integrated with systems such as comprehensive land improvement, land conservation and intensive use, reform of the residential land system, and differentiated performance appraisal to ensure its sustainability. Territorial comprehensive land improvement involves the integrated enhancement of farmland, rivers, roads, forests, and rural construction land [50]. This policy aims to intensively utilize inefficient rural construction land, which can increase the area of arable land and enhance its quality. Furthermore, this policy can restore and maintain the ecological foundation, improve rural ecology and the environment, and reduce carbon emissions. Economical and intensive land use can effectively guide the demand for urban, industrial, and mining construction land, strictly controlling inefficient land use and preventing the occupation of arable and ecological land. The reform of the homestead system is akin to the systematic integration of comprehensive land improvement and the economical, intensive use of land across the region. The homestead system reform requires the rational layout of homesteads in line with planning, improving conservation and intensive use, thereby assisting in the implementation of the TDR policy. Finally, a differentiated administrative performance appraisal system should be implemented, with each city setting performance targets based on its comparative advantages, to ensure that the sustainability of TDR is maintained.

5.1.2. Trade-Offs in Low-Carbon Land Use in China

This paper identifies several key trade-offs in the process of reducing carbon emissions. The first is the trade-off between direct and indirect carbon emissions. Compared to indirect carbon emissions, direct carbon emissions have a relatively smaller impact on overall emissions. Therefore, the achievement of the ‘dual-carbon’ goal depends more heavily on the substantial reduction in fossil fuel consumption, which must be achieved through technological progress, industrial upgrading, restructuring, and improvements in energy efficiency [51]. Secondly, the trade-off between development and conservation must be considered in relation to its impact on carbon emissions; the TDR scenario, with its 77.9 million tonnes of carbon emissions, is lower than both the nature and development scenarios. Although the carbon emissions of the TDR scenario are higher than those of the protection scenario, it meets the construction space needs of economic and social development, making it the optimal land-use choice. Finally, attention must be given to the trade-off between carbon emissions from cropland and forest land. Although arable land has some carbon sequestration potential, it becomes a source of carbon due to excessive human intervention in the cultivation process. Forest land is less affected by human intervention and has a strong carbon sequestration capacity, making it a significant carbon sink. The quantitative relationship between the two must be carefully considered in the process of low-carbon land use. Currently, China enforces a strict arable land protection policy. The total area of arable land can only increase, not decrease, and the addition of arable land will encroach upon forest land [52]. In the future, a rational forest policy should be developed to intensively manage forest land and enhance its carbon sink function. Specific measures include improving site conditions, clarifying forest land use, optimizing tree species and age structure, preventing forest fragmentation, and mitigating the edge effect [53].

5.1.3. Research Limitations and Prospects

This paper explores the optimization of future territorial spatial patterns and low-carbon sink-enhancing development through the TDR approach. However, this paper has the following limitations: first, it overlooks the impact of arable land displacement on carbon emissions when constructing the TDR scenario. In the process of maintaining a dynamic balance of total arable land, urbanization triggers the conversion of natural ecological land to supplementary arable land. After peri-urban arable land is transformed into construction space, new arable land is developed elsewhere to supplement food production, with forest land, grasslands, and waters being converted into arable land. As urban expansion typically occupies arable land with superior ecological conditions and high productivity, compensating for the loss in arable land quality requires the conversion of larger areas of natural ecological land to meet the arable land occupation and replenishment balance. This leads to changes in the regional ecological landscape structure and a decline in ecosystem services, including impacts on carbon emissions. Secondly, due to limitations in data acquisition, our findings may be subject to temporal lag. Finally, we did not fully account for the impact of the driving factors. In the future, we will take into account the displacement of cropland, seek updated data sources, and investigate the impact of carbon emission drivers in greater depth.

5.2. Conclusions

This study provides a reference for low-carbon land use in China. China’s ‘dual-carbon’ target sets forth the requirement for low-carbon spatial utilization of land. This paper draws the following conclusions by comparing the carbon emissions across different scenarios for 2010, 2020, and 2030. There was a significant increase in carbon emissions from land use between 2010 and 2020. The increase in carbon emissions slowed down from 2020 to 2030. Compared to the nature, development, and Protection scenarios, the TDR scenario achieves a ‘win-win’ outcome for economic and social development, as well as ecological protection, by transferring construction land zones. It effectively reduces regional carbon emissions, with a reduction of 77.9 million tonnes.

Author Contributions

Conceptualization, Q.K. and Z.C.; methodology, Y.T. and Q.K.; software, Q.K.; validation, Q.K., Y.T. and J.L.; formal analysis, Y.T. and Q.K.; investigation, M.Z. and J.L.; resources, Q.K.; data curation, Z.C.; writing—original draft preparation, Y.T., Q.K. and M.Z.; writing—review and editing, M.Z. and J.L.; visualization, M.Z.; supervision, Q.K.; project administration, Z.C.; funding acquisition, Z.C. All authors have read and agreed to the published version of the manuscript.

Funding

This research was funded by [Humanities and Social Science Fund of Ministry of Education of China] grant number [24YJC630024]; [Guangxi Annual Research Projects in Philosophy and Social Sciences] grant number [24SHC003]; [The Open Fund Project of the Guangxi Industrial High-Quality Development Research Center] grant number [23GXGY31].

Institutional Review Board Statement

Not applicable.

Informed Consent Statement

Not applicable.

Data Availability Statement

The data presented in this study are available on request from the corresponding author.

Conflicts of Interest

The authors declare no conflict of interest.

References

  1. Nguyen, D.K.; Huynh, T.L.D.; Nasir, M.A. Carbon emissions determinants and forecasting: Evidence from G6 countries. J. Environ. Manag. 2021, 285, 11198. [Google Scholar] [CrossRef]
  2. Wang, R.; Xie, S.; Zhang, C.; Xu, Q.; Tian, X. Emission drivers of cities at different industrialization phases in China. J. Environ. Manag. 2019, 250, 109494. [Google Scholar] [CrossRef]
  3. Searchinger, T.D.; Edwards, R.; Mulligan, D.; Heimlich, R.; Plevin, R.; Wendell, D.; Malins, C.; Halvorson, L. Assessing the efficiency of changes in land use for mitigating climate change. Nature 2018, 564, 249–253. [Google Scholar] [CrossRef] [PubMed]
  4. Houghton, R.A.; Nassikas, A.A. Global and regional fluxes of carbon from land use and land cover change 1850–2015. Glob. Biogeochem. Cycles 2017, 31, 456–472. [Google Scholar] [CrossRef]
  5. Meng, Q.; Zheng, Y.; Liu, Q.; Li, B.; Wei, H. Analysis of spatiotemporal variation and influencing factors of land-use carbon emissions in nine provinces of the yellow river basin based on the LMDI model. Land 2023, 12, 437. [Google Scholar] [CrossRef]
  6. Zhu, W.; Lan, T.; Tang, L. Impacts of Future Climate Change and Xamen’s Territorial Spatial Planning on Carbon Storage and Sequestration. Remote Sens. 2025, 17, 273. [Google Scholar] [CrossRef]
  7. Fryer, J.; Williams, I.D. Regional carbon stock assessment and the potential effects of land cover change. Sci. Total Environ. 2021, 775, 145815. [Google Scholar] [CrossRef]
  8. Shan, W.; Yang, X.; Gu, Z.; Xiao, X. A framework for assessing carbon effect of land consolidation with life cycle assessment: A case study in China. J. Environ. Manag. 2020, 266, 110557. [Google Scholar] [CrossRef]
  9. Tang, X.; Woodcock, C.E.; Olofsson, P.; Hutyra, L.R. Spatio-temporal assessment of land use/land cover change and associated carbon emissions and uptake in the Mekong River Basin. Remote Sens. Environ. 2021, 256, 112336. [Google Scholar] [CrossRef]
  10. Ke, Y.; Xia, L.; Huang, Y.; Li, S.; Zhang, Y.; Liang, S.; Yang, Z. The carbon emissions related to the land-use changes from 2000 to 2015 in Shenzhen, China: Implication for exploring low-carbon development in megacities. J. Environ. Manag. 2022, 319, 115660. [Google Scholar] [CrossRef]
  11. Wang, G.; Han, Q. The multi-objective spatial optimization of urban land use based on low-carbon city planning. Ecol. Indic. 2021, 125, 107540. [Google Scholar] [CrossRef]
  12. Li, L.; Huang, X.; Yang, H. Optimizing land use patterns to improve the contribution of land use planning to carbon neutrality target. Land Use Policy 2023, 135, 106959. [Google Scholar] [CrossRef]
  13. Xia, C.; Zhang, J.; Zhao, J.; Xue, F.; Li, Q.; Fang, K.; Shao, Z.; Li, S.; Zhou, J. Exploring potential of urban land-use management on carbon emissions—A case of Hangzhou, China. Ecol. Indic. 2023, 146, 109902. [Google Scholar] [CrossRef]
  14. Zhang, W.; Xu, H. Effects of land urbanization and land finance on carbon emissions: A panel data analysis for Chinese provinces. Land Use Policy 2017, 63, 493–500. [Google Scholar] [CrossRef]
  15. Zheng, B.; Liang, H.; Wan, W.; Liu, Z.; Zhu, J.; Wu, Z. Spatial-temporal patterns and influencing factors of agricultural carbon emissions in Jiangxi Province. Trans. Chin. Soc. Agric. Eng. 2022, 38, 70–80. [Google Scholar] [CrossRef]
  16. Li, X.; Li, Z.; Xie, X.; Liu, X.; Chen, J.; Li, Y. Interactive mechanisms of urbanization, carbon emissions, and “three living spaces” in Henan Province. Trans. Chin. Soc. Agric. Eng. 2023, 39, 256–265. [Google Scholar] [CrossRef]
  17. Kais, S.; Hammami, S. An econometric study of the impact of economic growth and energy use on carbon emissions: Panel data evidence from fifty-eight countries. Renew. Sustain. Energy Rev. 2016, 59, 1101–1110. [Google Scholar] [CrossRef]
  18. Zhou, Y.; Chen, M.; Tang, Z.; Mei, Z. Urbanization, land use change, and carbon emissions: Quantitative assessments for city-level carbon emissions in Beijing-Tianjin-Hebei region. Sustain. Cities Soc. 2021, 66, 102701. [Google Scholar] [CrossRef]
  19. Wang, H.; Lu, S.; Lu, B.; Nie, X. Overt and covert: The relationship between the transfer of land development rights and carbon emissions. Land Use Policy 2021, 108, 105665. [Google Scholar] [CrossRef]
  20. Marques-Carvalho, R.; Almeida, C.M.d.; Escobar-Silva, E.V.; Oliveira Alves, R.B.d.; Anjos Lacerda, C.S.d. Simulation and Prediction of Urban Land Use Change Considering Multiple Classes and Transitions by Means of Random Change Allocation Algorithms. Remote Sens. 2023, 15, 90. [Google Scholar] [CrossRef]
  21. Chen, Y.; Zhang, F.; Lin, J. Projecting Future Land Use Evolution and Its Effect on Spatiotemporal Patterns of Habitat Quality in China. Appl. Sci. 2025, 15, 1042. [Google Scholar] [CrossRef]
  22. Liu, X.; Guan, Q.; Clarke, K. Understanding the drivers of sustainable land expansion using a patch-generating land use simulation (PLUS) model: A case study in Wuhan, China. Comput. Environ. Urban Syst. 2021, 85, 101569. [Google Scholar] [CrossRef]
  23. Zhang, Z.; Hu, B.; Jiang, W. Spatial and temporal variation and prediction of ecological carrying capacity based on machine learning and PLUS model. Ecol. Indic. 2023, 154, 110611. [Google Scholar] [CrossRef]
  24. Peng, L.; Wang, L.; Xia, D.; Gao, Q. Effective energy consumption forecasting using empirical wavelet transform and long short-term memory. Energy 2022, 238, 121756. [Google Scholar] [CrossRef]
  25. Wang, M.; Wang, W.; Wu, L. Application of a new grey multivariate forecasting model in the forecasting of energy consumption in 7 regions of China. Energy 2022, 243, 123024. [Google Scholar] [CrossRef]
  26. Wang, J.; Du, Y.; Wang, J. LSTM based long-term energy consumption prediction with periodicity. Energy 2020, 197, 117197. [Google Scholar] [CrossRef]
  27. Liu, Z.; Huang, Y.; Zhang, S.; Luo, X.; Chen, X.; Lin, J.; Tang, Y.; Guo, L.; Li, J. A collaborative interaction gate-based deep learning model with optimal bandwidth adjustment strategies for lithium-ion battery capacity point-interval forecasting. Appl. Energy 2025, 377, 124741. [Google Scholar] [CrossRef]
  28. Xu, Q.; Yang, R.; Dong, Y.-X.; Liu, Y.-X.; Qiu, L.-R. The influence of rapid urbanization and land use changes on terrestrial carbon sources/sinks in Guangzhou, China. Ecol. Indic. 2016, 70, 304–316. [Google Scholar] [CrossRef]
  29. Wang, H.; He, C.; Li, W.; Nie, X.; Zhong, H.; Wen, L. Will transferable development rights (TDR) increase regional economic imbalance?—A quota transaction case of cultivated land conversion and reclamation in Guangxi, China. Habitat Int. 2020, 104, 102254. [Google Scholar] [CrossRef]
  30. Chapin, T. Introduction: From growth controls, to comprehensive planning, to smart growth: Planning’s emerging fourth wave. J. Am. Plan. Assoc. 2012, 78, 5–15. [Google Scholar] [CrossRef]
  31. Chen, C.; Li, Y.; Charles, L.; Wang, X. “Dipiao,” Chinese approach to transfer of land development rights: The experiences of Chongqing. Land Use Policy 2020, 99, 104870. [Google Scholar] [CrossRef]
  32. Nie, X.; Li, X.; Lyu, C.; Su, Y.; Wang, H. Can ecological compensation based on the transfer of development rights (TDR) improve ecosystem service value? A multi-scenario simulation. Land Use Policy 2024, 138, 107024. [Google Scholar] [CrossRef]
  33. Wang, B.; Li, F.; Feng, S.; Shen, T. Transfer of development rights, farmland preservation, and economic growth: A case study of Chongqing’s land quotas trading program. Land Use Policy 2020, 95, 104611. [Google Scholar]
  34. Tan, R.; Beckmann, V.; Qu, F.; Wu, C. Governing farmland conversion for urban development from the perspective of transaction cost economics. Urban Stud. 2012, 49, 2265–2283. [Google Scholar] [CrossRef]
  35. Yu, J.; Shen, K. The allocation logic of urban construction land quotas and its impact on the housing market. Econ. Res. J. 2019, 54, 116–132. [Google Scholar]
  36. Ma, B.; Tian, G.; Kong, L.; Liu, X. How China’s linked urban–rural construction land policy impacts rural landscape patterns: A simulation study in Tian, China. Landsc. Ecol. 2018, 33, 1417–1434. [Google Scholar] [CrossRef]
  37. Lin, J.; Huang, C.; Wen, Y.; Liu, X. An assessment framework for improving protected areas based on morphological spatial pattern analysis and graph-based indicators. Ecol. Indic. 2021, 130, 108138. [Google Scholar] [CrossRef]
  38. Yang, X.; Chen, X.; Che, L.; Qiao, F.; Pu, L. Functional optimization of land use in the Lanzhou-Xining urban agglomeration integrating ecological security. Acta Ecol. Sin. 2023, 43, 2583–2593. [Google Scholar] [CrossRef]
  39. Yang, Y.; Wang, H.; Li, X.; Huang, X.; Lyu, X.; Tian, H.; Qu, T. How will ecosystem carbon sequestration contribute to the reduction of regional carbon emissions in the future? Analysis based on the MOP-PLUS model framework. Ecol. Indic. 2023, 156, 111156. [Google Scholar] [CrossRef]
  40. Men, D.; Pan, J. Ecological network identification and connectivity robustness evaluation in the Yellow River Basin under a multi-scenario simulation. Ecol. Model. 2023, 482, 110384. [Google Scholar] [CrossRef]
  41. Song, M.; Yi, L.; Zhang, A. Multi-scenario measurement of the restricted development rights of land under planning regulation: Quantity and value. Chin. Popul. Resour. Environ. 2022, 32, 107–115. [Google Scholar]
  42. Liu, S.; Xiao, W.; Ye, Y.; He, T.; Luo, H. Rural residential land expansion and its impacts on cultivated land in China between 1990 and 2020. Land Use Policy 2023, 132, 106816. [Google Scholar] [CrossRef]
  43. Sun, H.; Liang, H.; Chang, X.; Cui, Q.; Tao, Y. Carbon emissions and spatial correlations of land use in China. Econ. Geogr. 2015, 35, 154–162. [Google Scholar] [CrossRef]
  44. Lai, L. Research on the Carbon Emission Effects of Land Use in China. Ph.D. Dissertation, Nanjing University, Nanjing, China, 2011. [Google Scholar]
  45. Piao, S.; Fang, J.; Huang, Y. Carbon balance of terrestrial ecosystems in China. Basic Sci. China 2010, 12, 20–22+65. [Google Scholar] [CrossRef]
  46. Su, J.; Li, G.; Zhang, X. GCN-LSTM model integrating spatiotemporal features for dust weather prediction in Northwest China. J. Arid Land Resour. Environ. 2024, 38, 111–120. [Google Scholar] [CrossRef]
  47. Shen, Y.; Guo, Q.; Liu, Z.; Shen, Y.; Jia, Y.; Wei, Y. Prediction of drought-flood prone zones in inland mountainous regions under climate change with assessment and enhancement strategies for disaster resilience in high-standard farmland. Agric. Water Manag. 2025, 309, 109349. [Google Scholar] [CrossRef]
  48. Pruetz, R.; Standridge, N. What makes transfer of development rights work?: Success factors from research and practice. J. Am. Plan. Assoc. 2008, 75, 78–87. [Google Scholar] [CrossRef]
  49. Kan, K. Creating land markets for rural revitalization: Land transfer, property rights and gentrification in China. J. Rural Stud. 2021, 81, 68–77. [Google Scholar] [CrossRef]
  50. Jin, X.; Ying, S. Adaptation and path optimization of comprehensive land remediation for regional high-quality development. Chin. Land Sci. 2023, 37, 1–11. [Google Scholar]
  51. Lebel, L.; Garden, P.; Banaticla, M.R.N.; Lasco, R.D.; Contreras, A.; Mitra, A.P.; Sharma, C.; Nguyen, H.T.; Ooi, G.L.; Sari, A. Integrating carbon management into the development strategies of urbanizing regions in Asia. J. Ind. Ecol. 2007, 2, 61–81. [Google Scholar] [CrossRef]
  52. Pei, J.; Niu, Z.; Wang, L.; Song, X.-P.; Huang, N.; Geng, J.; Wu, Y.-B.; Jiang, H.-H. Spatial-temporal dynamics of carbon emissions and carbon sinks in economically developed areas of China: A case study of Guangdong Province. Sci. Rep. 2018, 13383. [Google Scholar] [CrossRef]
  53. Brinck, K.; Fischer, R.; Groeneveld, J.; Lehmann, S.; De Paula, M.D.; Pütz, S.; Sexton, J.O.; Song, D.; Huth, A. High resolution analysis of tropical forest fragmentation and its impact on the global carbon cycle. Nat. Commun. 2017, 8, 14855. [Google Scholar] [CrossRef]
Figure 1. TDR mechanism and its relationship with carbon emissions.
Sustainability 17 03072 g001
Figure 2. Research Processes.
Sustainability 17 03072 g002
Figure 3. Overview of the study area.
Sustainability 17 03072 g003
Figure 4. Four land-use scenarios for 2030.
Sustainability 17 03072 g004
Figure 5. Schematic diagram of the regional division of supply and demand in Guangxi under the TDR scenario.
Sustainability 17 03072 g005
Figure 6. Important ecological regions in Guangxi. (a) is Ecological Landscape Elements Core Area in Guangxi; (b) is Ecologically significant source area in Guangxi; (c) is Guangxi Nature Reserve; (d) is Ecologically Important Area in Guangxi).
Sustainability 17 03072 g006
Figure 7. Changes in land-use patterns in Guangxi, 2010–2030.
Sustainability 17 03072 g007
Figure 8. Changes in the quantity of land use in Guangxi, 2010–2030.
Sustainability 17 03072 g008
Figure 9. Changes in the volume of carbon emissions. (a) is the amount of carbon emissions in Guangxi; (b) is the change in the amount of carbon emissions from different land types in Guangxi).
Sustainability 17 03072 g009
Figure 10. Changes in the quantity of carbon emissions by city in Guangxi.
Sustainability 17 03072 g010
Table 1. Data sources and processing.
TypeDataTypeSource and Processing
Land-use dataLUCCGrid 30 mCenter for Resource and Environmental Sciences and Data, Chinese Academy of Sciences
DriversPopulation, GDP, precipitation, temperature, soilGrid 1 kmCenter for Resource and Environmental Sciences and Data, Chinese Academy of Sciences
DEM, SlopeGrid 30 mGeospatial Data Cloud, generated from DEM data
Distance from cityGrid 1 kmOpen Street Map
Distance to roads (classified as primary, secondary, tertiary, quaternary, highway), distance to railroads, distance to riversVectorNational Geographic Information Resources Inventory Service System, obtained after ArcGIS Euclidean distance analysis processing
Other dataGuangxi Nature ReservesVectorCenter for Resource and Environmental Sciences and Data, Chinese Academy of Sciences
Energy Consumption Data/«China Energy Statistics Yearbook»
GDP, Industry, Population Data/«Guangxi Zhuang Autonomous Region Statistical Yearbook»
Table 2. Carbon emission factors.
ItemCategoryNumerical Value
Direct carbon emissionCultivated land (t·hm−2)0.422
Forest land (t·hm−2)−0.644
Grassland (t·hm−2)−0.021
Water area (t·hm−2)−0.253
Unutilized land (t·hm−2)−0.005
Indirect carbon emissionsRaw coal (t·t−1)0.7559
Washed coal (t·t−1)0.7559
Coke (t·t−1)0.855
Crude oil (t·t−1)0.5857
Gasoline (t·t−1)0.5538
Kerosene (t·t−1)0.5714
Diesel oil (t·t−1)0.5921
Fuel oil (t·t−1)0.6185
Liquefied petroleum gas (t·t−1)0.5042
Natural gas (t·t−1)0.4483
Table 3. Energy consumption in Guangxi in 2010, 2020 and 2030 (106 t/106 m3).
YearRaw CoalWashed CoalCokeCrude OilGasolineKeroseneDiesel OilFuel OilLiquefied Petroleum GasNatural Gas
201056.335.766.823.962.480.034.220.351.050.02
202077.887.6814.1212.762.860.204.350.200.950.32
203084.508.4022.2517.642.930.494.930.251.051.08
Table 4. Carbon emissions in Guangxi in 2010, 2020, and 2030 (106 t).
YearDirect Carbon EmissionsDirect Carbon EmissionsIndirect Carbon EmissionsCarbon Emissions
Cultivated LandWoodlandGrasslandWatersUnutilized Land
20102.17−10.02−0.04−0.09−0.01−7.9950.3942.41
20202.14−9.98−0.04−0.09−0.01−7.9775.3967.42
2030
Nature
2.11−9.94−0.04−0.09−0.01−7.9693.3785.41
2030 Development2.10−9.93−0.04−0.09−0.01−7.9696.0488.08
2030 Protection2.14−10.04−0.04−0.09−0.01−8.0277.1269.09
2030
TDR
2.14−9.98−0.04−0.09−0.01−7.9785.8777.90
Disclaimer/Publisher’s Note: The statements, opinions and data contained in all publications are solely those of the individual author(s) and contributor(s) and not of MDPI and/or the editor(s). MDPI and/or the editor(s) disclaim responsibility for any injury to people or property resulting from any ideas, methods, instructions or products referred to in the content.

