Abstract
As climate challenges intensify, architectural design must reconcile energy efficiency with environmental adaptation. This study investigates how two skywell geometries in Kunming’s traditional One-Seal dwellings (Yikeyin) optimize seasonal thermal and ventilation performance. Combining field analysis and simulations, a comparative analysis of skywell depth-to-width ratios reveals that larger proportions enhance summer airflow but exacerbate winter heat loss, while smaller ratios stabilize winter conditions. Vertical thermal stratification highlights distinct microclimates across floors, with skywells exhibiting pronounced seasonal fluctuations. The findings affirm the climate-responsive intelligence embedded in vernacular architecture, demonstrating its relevance for contemporary sustainable design. By bridging traditional wisdom and modern green building practices, this work advances strategies for climate-resilient architecture and rural habitat enhancement, prioritizing both ecological balance and human comfort.
1. Introduction
1.1. Background
Vernacular architecture represents a profound manifestation of human ingenuity in adapting to natural environments [1], with its distinctive regional characteristics and climatic adaptability forming the fundamental basis of architectural existence. Over centuries of evolutionary development, vernacular architecture has cultivated a rich repertoire of eco-climatic strategies worldwide [2], which not only optimize natural resource utilization but also offer invaluable references for contemporary climate-responsive design. In contrast to mechanically regulated environments dependent on fossil fuels or electricity, vernacular architecture exhibits significantly lower energy consumption and environmental impact, thereby embodying the sustainable principle of architectural symbiosis with nature [3].
In various climatic regions, vernacular architecture responds to diverse environmental challenges through unique design strategies. For example, in the hot and humid regions of Southeast Asia, stilt houses are designed to promote natural ventilation by elevating the living space, thereby reducing the impact of ground moisture [4]. In the Mediterranean region, the combination of white exterior walls and thick walls is effective in reflecting sunlight and regulating indoor temperatures [5]. In cold northern regions, compact building forms and double-glazed windows are employed to minimize heat loss [6]. These geographically-anchored design solutions establish environmentally stabilized habitats while simultaneously cultivating culturally distinct architectural identities, forming indispensable elements in the global architectural ecosystem [7].
Natural ventilation is one of the core technologies employed for environmental regulation in vernacular architecture [8]. It is utilized to regulate indoor temperature and humidity by harnessing air flow to remove both sensible and latent heat, thereby enhancing living comfort [9]. Ventilation strategies vary significantly across different climatic conditions [10]. In tropical regions, buildings employ tall roofs and permeable facades to facilitate air movement and reduce indoor temperatures [11], while in cold regions, the control of wind speed and airflow direction is prioritized to retain warmth and ensure the influx of fresh air [12]. This precise regulation of natural ventilation reflects the profound understanding and adaptive intelligence of vernacular architecture in relation to climatic conditions.
Against the backdrop of global climate change and the energy crisis, the regional wisdom inherent in vernacular architecture holds significant international relevance [13]. By synthesizing the experiences of vernacular architecture across different regions, a deeper understanding of the interaction between architecture and the climatic environment can be achieved, resulting in the extraction of universal ecological building strategies [14,15]. These strategies can guide the innovative design of regional architecture and offer valuable insights for sustainable architectural practices worldwide [16].
Courtyards, or skywells, serve as essential architectural elements in vernacular design. These spaces provide effective climate regulation through multiple functions, including ventilation [17], solar shading [18], daylight optimization [19], and thermal regulation. By integrating thermal buoyancy and wind-driven airflow [20], they establish natural ventilation systems that reduce energy consumption while enhancing indoor comfort. This environmentally adaptive approach exemplifies vernacular architectural intelligence and offers valuable principles for contemporary passive design strategies.
The traditional dwellings in Kunming, located in southwestern China, are collectively known as “One-Seal” dwellings (Chinese pinyin as Yikeyin or Yi-Ke-Yin, a type of traditional residential structure). As a prevalent vernacular typology in central Yunnan’s rural areas, these compact square compounds characterized by high parapet walls with minimal fenestration feature a central skywell with axial symmetry. The nomenclature derives from its resemblance to ancient official seals, exhibiting enclosed exteriors with adaptive internal spatial configurations suitable for diverse topographies, ethnic groups, and familial structures. The most archetypal manifestation is the “Three-Bay-Four-Chamber Structure with Inverted Octoscale Roof System” (San-Jian-Si-Er-Dao-Ba-Chi configuration) [21]. It is formed from a multi-layered climate buffering system centered around a skywell, which adapts to the subtropical, low-latitude, plateau monsoon climate. This design enables the passive ventilation technologies of vernacular dwellings to exhibit extensive application potential in modern architecture [22]. These technologies possess profound cultural significance and should be considered subjects deserving scientific examination, redefinition, and in-depth research. Through a systematic understanding and reinterpretation of these traditional technologies, valuable insights can be offered for modern architectural design, thereby facilitating the realization of sustainable development practices.
However, current research on “Yikeyin” architecture primarily focuses on architectural history and sociology, with insufficient in-depth examination of its architectural performance [23]. For instance, studies on its natural ventilation system, thermal performance, and energy efficiency are relatively scarce. Therefore, to address this research gap, a systematic investigation of “Yikeyin” architecture’s performance is essential. This study contributes significantly to advancing the contemporary application of traditional building technologies while promoting sustainable architectural design principles.
1.2. Literature Review: From Tradition to Frontier
1.2.1. Scientific Evolution of Ventilation Strategies in Vernacular Architecture
Many studies on vernacular ventilation strategies provide essential insights for applying traditional ecological knowledge to modern sustainable architecture [24]. Since Bernard Rudofsky introduced vernacular architecture into the modern architectural discourse in his seminal work Architecture Without Architects, studies in this field have evolved from experiential observations to quantitative investigations [25]. In the 1960s, the systematization of mapping technologies and the emergence of scientific publications marked the standardization of field measurement methods, thereby laying the methodological foundation for subsequent research [26]. Subsequently, scholars such as Dusgupta et al. systematically defined methods for climate analysis and graphical representation [27], further advancing the scientific development of the field. Since the 1990s, the introduction of numerical simulation techniques, such as Computational Fluid Dynamics (CFD) [28], has enabled high-resolution predictions and analyses of airflow and thermal environments within complex building forms, providing substantial technical support for the multidimensional study of vernacular architectural ventilation strategies.
As a core climatic regulation space in vernacular architecture, the study of courtyard ventilation performance has evolved from relatively early small-scale model experiments and field measurements [29] to a composite research methodology focused on CFD simulations [30]. Studies have demonstrated that the natural ventilation performance of courtyards is significantly influenced by solar radiation [31], wind direction [32], microclimatic conditions [33], and the geometric parameters of the courtyard [34]. The ventilation modes can be classified as buoyancy-driven ventilation, wind-driven ventilation, solar-assisted ventilation, and nighttime ventilation [35]. In specific case studies, Prakash employed Computational Fluid Dynamics (CFD) simulations to investigate the impact of spatial configuration and roof design on the ventilation performance of low-rise courtyard dwellings [36]. Building upon this research, Micallef conducted a comparative analysis of three courtyard building models with varying heights, examining their ventilation performance under both isolated and urban contexts. This study provided critical empirical data for optimizing courtyard building design [37]. Furthermore, a separate investigation utilized CFD simulations to quantitatively assess the influence of opening position, size, and wind angle on the microclimate of enclosed campus courtyards. This research offered theoretical support for optimizing campus wind environments and also significantly contributed to the body of knowledge regarding outdoor microclimate studies [38]. Together, these investigations confirmed CFD simulation as a reliable methodology for analyzing courtyard ventilation performance.
In recent years, scholars have integrated CFD simulations with experimental validation to confirm the reliability of the RNG k-ε model in predicting courtyard ventilation performance [39]. These studies have proposed low-energy design strategies and climate adaptation mechanisms, providing essential theoretical and practical guidance for optimizing natural ventilation in modern buildings [40].
1.2.2. Current Status and Challenges in Vernacular Architecture Research
The climatic regulation performance of courtyard (or skywell) spaces in vernacular architecture has emerged as a significant research focus at the intersection of architectural studies and environmental science. Through comparative analysis of cases across diverse climatic zones, scholars have elucidated the multifaceted mechanisms of microclimate regulation and regional adaptability characteristics inherent in these spaces.
In arid and hot regions (Aw in Table 1), exemplified by traditional courtyard buildings in the Middle East, courtyards employ shading devices and thermal mass materials to moderate diurnal temperature fluctuations, thereby providing stable thermal buffering for indoor environments [41]. In temperate climates (Csa and Csb in Table 1), such as those found in Spanish vernacular dwellings, courtyards utilize arcades, overhangs, and vegetation cover to effectively control solar radiation, adapting to the region’s characteristic hot, dry summers and mild, wet winters [42]. In cold climates (e.g., Dfc in Table 1), as seen in Nordic traditional courtyard architecture, courtyards are often designed as sunspaces or conservatories, incorporating glazed facades to capture solar radiation while employing enclosed layouts and insulation materials to minimize heat loss, thus addressing low-temperature conditions [43].

Table 1.
Spatial characteristics of building courtyards in different climate regions.
The Beijing “Siheyuan” (Courtyard House) adapts effectively to the temperate monsoon climate (Dwa in Table 1). Its quadrangle layout and thick walls reduce winter cold and sandstorms, while the courtyard optimizes ventilation and daylight across seasons [44]. Furthermore, the courtyard dwellings in Dali and Lijiang, located in northwest Yunnan, typically feature expansive courtyard spaces to accommodate the region’s mild and sun-abundant climate [45]. In contrast, the “One-Seal” dwellings in central Yunnan employ smaller courtyard dimensions and thermal mass materials to address the region’s significant diurnal temperature variations in Cwb climate type, see Table 1 [21].
The correlation between diverse climate types and courtyard configurations in architectural forms reveals the ecological wisdom and technological innovation embedded in traditional architecture’s response to varied climatic challenges. Among numerous climate classification systems, the widely accepted Köppen–Geiger classification provides a scientific framework for analysis [46]. The case studies discussed above can be summarized in Table 1, demonstrating the adaptive relationship between architectural typologies and climatic conditions.
In recent years, studies on vernacular architecture have increasingly intersected with cultural heritage conservation [47], with the influence of the World Heritage Conference fostering widespread attention to regional architectural wisdom. In China, research has expanded to encompass a wide range of types, including cold and temperate northern regions [48], inland areas [49], the middle and lower reaches of the Yangtze River [50], southeastern coastal humid and hot regions [51], and ethnic minority architecture [52], gradually creating a diversified research landscape. However, rapid urbanization and increasing market demands have given rise to a critical research focus: how to design livable and prosperous rural settlements by integrating traditional architectural wisdom into contemporary planning strategies [53]. While traditional architectural forms persist in economically underdeveloped regions, current research predominantly emphasizes architectural history and settlement patterns, creating significant opportunities for expanded investigations into construction methodologies and occupant comfort optimization [54]. Future research should integrate modern technological methods to further explore the ecological wisdom embedded in vernacular architecture, providing theoretical support and practical guidance for sustainable architectural design.
Despite significant progress in vernacular architectural ventilation research, quantitative studies on courtyards or skywells in vernacular residential architecture remain insufficient, particularly with respect to specific climatic zones and building typologies, which require further exploration [55]. Existing studies often lack regionally representative case studies, leading to limited generalizability and typical significance of ventilation mechanisms and parameter outcomes. Furthermore, the integrated performance of courtyard buildings, especially under light breeze conditions with imperceptible wind speeds, remains insufficiently explored, presenting new research challenges in this field.
Notably, there is a noticeable gap in research and attention in the Yunnan region, particularly in performance-based vernacular architecture studies, which impedes the development of practical guidelines. For instance, rural green building and comfort standards remain underdeveloped, and the absence of model standards and demonstration projects further restricts the progress of related fields [56]—this constitutes one of the key motivations for this study. This research seeks to investigate the traditional “Yikeyin” skywell dwellings in Kunming, Yunnan, with the goal of elucidating the profound impact of natural wind fields on the microenvironment and the thermal-humid environment of traditional architecture. In doing so, it will elucidate the traditional architectural climate adaptability and the scientific principles underlying comfort, highlighting and promoting the climate-responsive wisdom embedded in vernacular architecture to offer guidelines for courtyard optimization design. This study not only provides scientific evidence for the preservation of cultural heritage but also offers robust support and guidance for the green development of rural architecture.
1.3. Content of This Study
In summary, the primary aim of this study is to demonstrate the comfort mechanisms induced by natural ventilation in the skywells of traditional Kunming dwellings (Yikeyin) through a combination of field measurements and numerical simulations. The study employs both qualitative and quantitative analysis methods, focusing on the skywell space of a typical traditional dwelling in the Guanyin Mountain Community of Xishan District, Kunming. Field monitoring was conducted to gather representative architectural geometric parameters, which were then used to construct two typical skywell scale models at 1:1 and 1:1.2 scales. PHOENICS 2023 software was used to simulate the wind environment of these typical traditional skywell dwellings and their variants. This study analyzes and extracts the regional adaptive characteristics of the “Yikeyin” skywell in central Yunnan using the “standard k-ε model” for a series of numerical simulations to identify the ventilation mechanisms, airflow patterns, and thermal environment both inside and around the building. This study aims to quantitatively identify and validate the effectiveness of natural ventilation strategies in skywells under seasonal rhythms with the goal of providing comprehensive knowledge for designing modern climate-responsive buildings with optimal ventilation functions.
The field measurement period was chosen during the warmest period in Kunming, July, which typically experiences continuous cloud cover and rainy weather. The measurements were conducted from 12 July to 26 July 2024, during which overcast and rainy weather occurred. The monitoring locations encompassed the external environment of the building, the skywell, the first-floor room, and the second-floor room. For the numerical simulations, temperature and humidity data for the coldest and hottest months in Kunming were used, with the average annual wind speed and prevailing wind direction considered for the wind speed and direction. Simulations were carried out by adjusting the dimensions of the skywell.
This study is structured as follows: First, Section 2 provides an overview of the typical “Yikeyin” dwelling in Kunming, including its climate, geographical context, architectural characteristics, and typologies. Section 3 presents a comprehensive field survey and case study database, followed by onsite monitoring and data compilation. Section 4 focuses on numerical studies of airflow patterns and thermal environments under seasonal conditions for two typical skywell proportions using the architectural forms as simulation models. A comparative cross-sectional analysis of the simulation results is presented, along with a temporal analysis of one of the typical forms. The details of the numerical simulations and method validation are also provided. Section 5 discusses the simulation results, and Section 6 presents the conclusions of the study, along with a discussion of its limitations and future prospects (for the structure, see Figure 1).
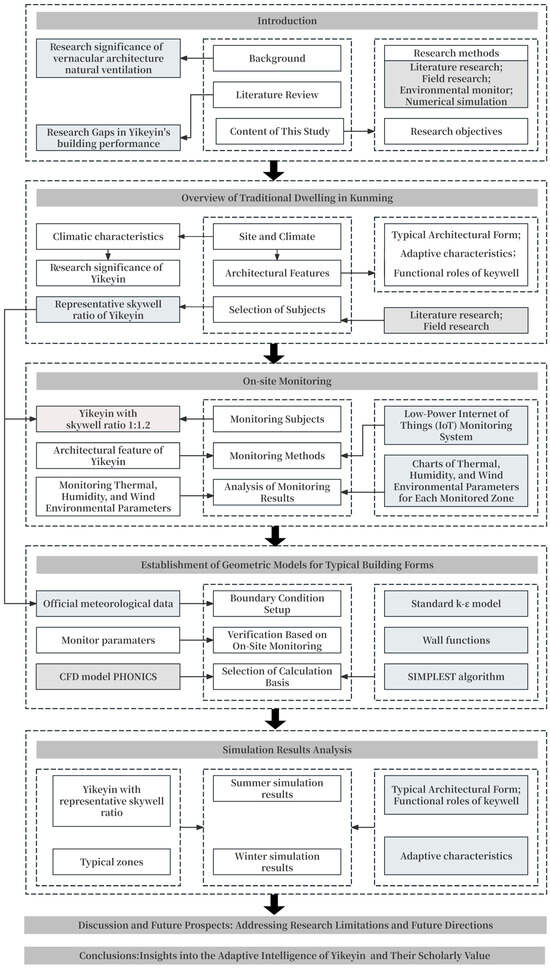
Figure 1.
Research frame diagram.
2. Overview of Traditional Dwellings in Kunming
2.1. Site and Climate
The Dianzhong region (Central Yunnan), where Kunming is located, is typically defined based on cultural geography rather than administrative boundaries. It specifically refers to the basin area in the central part, located between 102° and 104° east longitude and 24° and 26° north latitude, with an average elevation ranging from 1500 to 2000 m [57]. This region includes cities such as Kunming, Qujing, Chuxiong, and Yuxi. It is a mixed-settlement area, predominantly inhabited by the Han ethnic group, with the Han-style courtyard serving as the typical architectural form [58].
In contrast to the rest of Yunnan Province, which is home to the largest number of ethnic minorities in China, this region acts as a bridge between local traditions and central influences. Studying Yunnan and Southwest China necessitates an in-depth examination of the central Yunnan region, with Kunming serving as the quintessential city representing this area [59]. As the core city of central Yunnan, Kunming, situated at an elevation of approximately 1891 m, enjoys a mild climate with spring-like conditions year round [60]. Accordingly, the traditional “Yikeyin” dwelling in Kunming stands as the most representative architectural form, offering significant research value in understanding the local architectural style (see Figure 2).
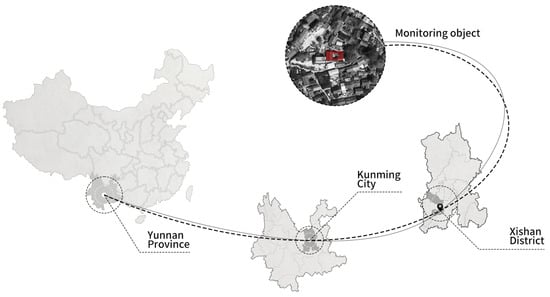
Figure 2.
Location map of the monitoring object.
This region combines temperate, seasonal climate features with the dry and wet seasonal characteristics typical of subtropical climates. The climate is mild throughout the year, with distinct dry and wet seasons. Based on an analysis of meteorological data from the past decade in Kunming, the climatic characteristics of the region can be summarized as follows: The annual average temperature ranges between 15 °C and 17 °C, with January and February averaging 6 °C to 10 °C and July and August between 19 °C and 23 °C. Extreme low temperatures typically stay above 0 °C, making winters relatively mild (shown in Figure 3). Precipitation is moderate, with an annual rainfall of approximately 1000 mm and humidity ranging from 50% to 80%. The annual solar radiation is between 1200 and 1500 KJ/cm2, with around 2500 h of sunshine, and a typical clear-sky index between 0.6 and 0.8. The average annual wind speed is approximately 2–3 m/s, with northeast winds predominating in winter and southwest winds prevailing in summer. The meteorological data utilized in this study were sourced from the National Meteorological Science Data Center to ensure the reliability and accuracy of the climatic analysis (see Figure 3).
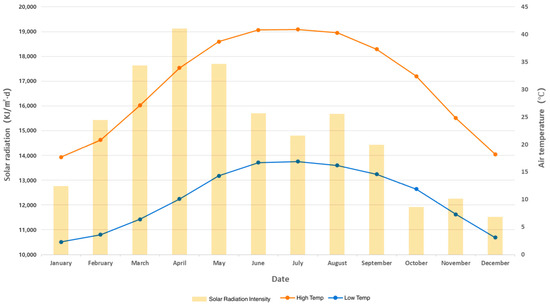
Figure 3.
Annual temperature map of Kunming (average high temperature, average low temperature, and solar radiation for statistical period of 1992–2022).
According to the Chinese national architectural standards [61,62], and the industry standards [63,64], Kunming is classified as a mild climate region, with local buildings required to meet specific demands for heat protection, shading, ventilation, and rain protection during the summer.
According to the global Köppen–Geiger (KG) climate classification [65], Kunming is classified under the subtropical low-latitude plateau monsoon climate zone (Cwb in KG), with its building climate adaptability similar to cities like Guiyang and Nanning. Cities like Chengdu and Guangzhou, which are geographically proximate, are also frequently compared (as illustrated in the figures). Through a comparative analysis of these five cities in Southwest China, this study provides a theoretical basis for selecting climatic parameters in the research (as shown in Figure 4, Figure 5, Figure 6 and Figure 7). Kunming’s precipitation levels rank average among these five cities, with notable differences when compared to Chengdu in the summer and Guangzhou in the spring. However, during the first half of the year, Kunming’s solar radiation, humidity, and wind speed significantly differ from those of the other comparison cities, illustrating the typical dry–wet seasonal tropical climate characteristics. This makes using only a mild climate region as a standard for building thermal performance insufficiently accurate, which is why local standards have made specific provisions [66,67].
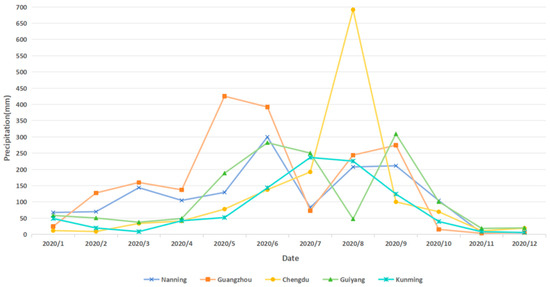
Figure 4.
Rainfall in five cities in Southwest China.
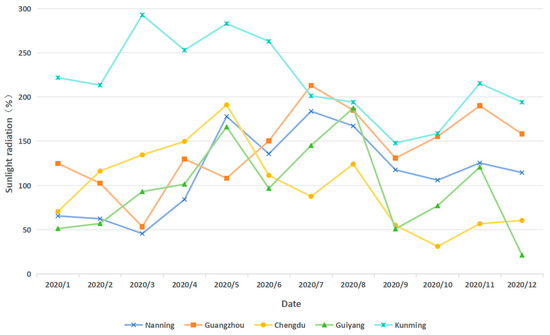
Figure 5.
Solar radiation in five cities in Southwestern China.
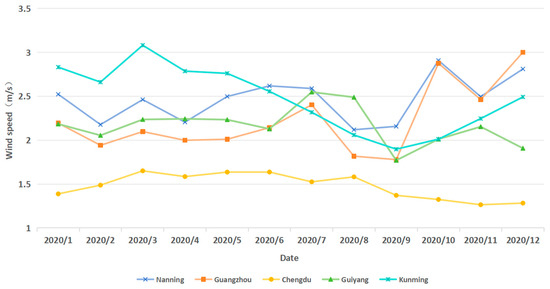
Figure 6.
Wind speed in five cities in Southwest China.
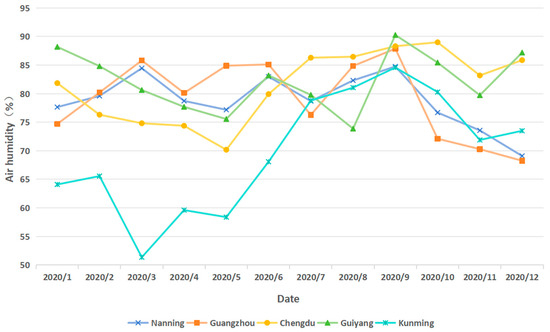
Figure 7.
Relative air humidity in five cities in Southwest China.
Kunming’s distinctive climatic characteristics [68], shaped by its low-latitude monsoon climate and high-altitude location, exhibit minimal seasonal temperature variation, pronounced diurnal temperature fluctuations, and intense solar radiation. These conditions challenge conventional thermal design approaches that primarily rely on winter–summer temperature differentials. This research addresses the need for a refined theoretical framework to optimize architectural design in response to Kunming’s unique environmental conditions.
2.2. Architectural Features
2.2.1. Typical Skywell Architectural Form
Over the course of China’s long history and through regional cultural exchanges, a spatial organization centered around courtyards has developed in residential architecture across the country [69]. However, this courtyard organization exhibits distinct geometric differences depending on climatic conditions or climate zones. In the colder regions of northern China, courtyards are larger and more spacious, designed to capture sunlight and store heat [70]. In contrast, southern regions, which are hotter, tend to have narrower and deeper courtyards, focusing on shading, heat dissipation, ventilation, and dehumidification [71]. Preliminary analysis of residential samples across various regions suggests that as the climate transitions from cold in the north to hot and humid in the south, the architectural form shifts from loose and spacious to compact, with courtyard dimensions shrinking accordingly.
Yunnan, straddling multiple climate zones, is home to a diverse range of residential architectural forms shaped by its unique geography and climate. In addition to Kunming’s “Yikeyin” skywells, other typical forms in the region include the Bai ethnic “Three Courtyards and One Screen Wall” in Dali and the “Four Courtyards and Five skywells” in traditional courtyard-style homes. Yunnan also features other distinctive architectural types, such as raised bamboo houses and Qionglong-style earthen houses. Among these, the “Yikeyin” dwelling, found primarily in the central Yunnan region, is one of China’s five major traditional residential types and is an exemplary form of architecture centered around a skywell.
The “Yikeyin” dwelling is a representative form of Yunnan’s traditional courtyard architecture, named after its square plan, which resembles a seal. It originated from the Yi ethnic group’s earth-packing houses and, influenced by a variety of natural, economic, social, and cultural factors, evolved through continuous development into its current form. This dwelling type also features remarkable flexibility, capable of adapting to practical needs through vertical progression, horizontal linking, and bi-directional expansion, thus forming composite courtyard architecture clusters (shown in Figure 8).
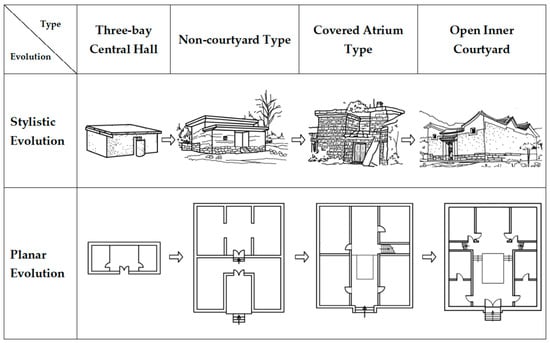
Figure 8.
Evolutionary process of the development of the “Yikeyin” traditional dwelling [22].
Today, the layout of the “Yikeyin” dwelling typically consists of three main rooms, with symmetrical side rooms on either side. These are closely connected to the main house via a front porch and staircase and linked to the entrance structure called the “Ba Chi Dao Zuo” (eight-foot reverse seat), forming a small skywell. This typical arrangement is referred to as the characteristic “San-Jian-Si-Er-Dao-Ba-Chi configuration, as Three-Bay-Four-Chamber Structure with Inverted Octoscale Roof System” in Kunming.
Beyond its square, easily identifiable shape, the true essence of the “Yikeyin” dwelling lies in the clever handling of its internal spaces. The interwoven arrangement of the main house, side rooms, and reverse seat across multiple levels of the roof maximizes the use of available space. This design fully embodies both economy and flexibility, making the most of every inch of space while ensuring functional adaptability.
“Yikeyin” currently does not have an official English name. It is sometimes translated as “One-Seal House” or “Single-Stamp House” [23]. These names capture the essence of the form’s design, resembling a seal or stamp in its compact, square shape. Here, we prefer to use “One-Seal” dwellings, which might also symbolize a unique or distinctive mark, echoing the significance of the building’s structure.
2.2.2. Functional Characteristics of the “Yikeyin” Skywell
In courtyard residences, the concepts of a “courtyard” and “skywell” are closely related and are often used interchangeably in Chinese architecture. Their forms and functions exhibit significant differentiation due to variations in building typology and regional cultural contexts (shown in Table 2).
Table 2.
Differences between a courtyard and skywell.
From a functional perspective, the skywell in “Yikeyin” dwellings is a compact, small-scale space tightly enclosed by two-story structures, contrasting sharply with the expansive courtyards found in northern Chinese Siheyuan. This compact layout, necessitated by mountainous terrain constraints, enables the skywell to efficiently fulfill environmental regulation functions such as daylighting, ventilation, and drainage within a limited area, highlighting its practicality and environmental performance. In contrast, the central courtyard of northern Siheyuan is characterized by its spaciousness, primarily serving as a multifunctional space for family activities, social gatherings, and gardening, reflecting a different functional emphasis and cultural significance.
These differences in form and function profoundly illustrate the precise adaptation of traditional Chinese dwellings to regional climatic and cultural conditions. The “Yikeyin” skywell, through its compact layout and efficient environmental regulation mechanisms, not only addresses the functional demands of high-density construction but also demonstrates the ecological wisdom of traditional architecture in responding to complex topographical and climatic challenges.
2.2.3. Adaptive Characteristics
The “Yikeyin” dwelling in Yunnan, a representative architectural form in Southwest China, demonstrates effective adaptation to natural conditions, climate, and daily life needs. This traditional housing type reflects ecological wisdom and functional integration.
Site Adaptation: Compact Layout and Terrain Integration
High-Density Spatial Organization: The “Yikeyin” dwelling is centered on a compact, square floor plan. The building typically consists of two stories, with four sides of the structure tightly enclosing the central skywell, forming an inward-facing courtyard. This compact spatial organization effectively adapts to the land scarcity characteristic of Yunnan’s mountainous and hilly regions, reducing the footprint while achieving functional integration through vertical zoning (e.g., lower floor for production, upper floor for living).
Terrain Conformity Strategy: Given Yunnan’s characteristic sloping terrain, the “Yikeyin” dwelling is often constructed using a terraced approach. Partial excavation and infilling techniques achieve soil equilibrium, enabling seamless integration between the building and its natural topography. For instance, steps or ramps are employed at the entrance to bridge elevation differences, and the backyard extends in accordance with the slope, ensuring terrain stability and reducing construction costs.
Defensive and Private: The tightly enclosed structure (few windows on the exterior walls, high walls, and narrow alleys) reduces external disturbances and meets the security needs of family-based communities in traditional society, creating an inward-facing defensive space. Simultaneously, the skywell and the exterior corridor help maintain the permeability of the internal space.
Climate Adaptation: Microclimate Regulation and Ecological Techniques
Passive Ventilation Design of the Skywell: The central skywell serves as the core climate regulator, with a height-to-width ratio typically exceeding 1:3, creating a vertical micro-environment known as the “chimney effect”. During the summer, humid air flows through open windows at the base, rises due to heating, and exits through the top, achieving natural ventilation and cooling. In winter, partial windows are closed to reduce the infiltration of cold air, while the thermal mass of the thick rammed earth walls helps maintain a stable indoor temperature.
Humidity and Drainage Control: The skywell employs a “Four Waters Returning to the Hall” drainage system, with the roof sloping inward, guiding rainwater along the eaves into an open drain within the skylight, which ultimately drains outside the building. This design not only addresses drainage issues in rainy climates but also leverages water evaporation to assist in cooling. Additionally, deep eaves and exterior corridors form a shading system that reduces direct sunlight exposure during the summer, while providing a semi-outdoor space for activities during the rainy season.
Climate-Responsive Materials and Construction: The main building incorporates local materials (e.g., rammed earth walls, wooden frames, small blue tiles). The high thermal mass of rammed earth helps delay heat exchange between the interior and exterior, making it suitable for Yunnan’s “spring-like” climate, characterized by significant day–night temperature variations. The lightweight and breathable wood frame complements the thick walls, thereby enhancing the overall comfort of the space.
Adaptation to Production and Living Needs: Functional Integration and Spatial Efficiency
Vertical Layering and Functional Zoning: The “Yikeyin” dwelling achieves an organic integration of production and living spaces through vertical layering. The ground floor houses the main hall, kitchen, livestock pens, and storage, fulfilling the daily work and family activity needs. The second floor primarily serves as bedrooms, while also accommodating grain drying and storage, with an exterior corridor connecting rooms to enhance traffic efficiency. This zoning pattern ensures privacy in living spaces while facilitating agricultural production.
Utilization of Multi-Functional Grey Spaces: The skywell and exterior corridor serve as “grey spaces”, providing both practicality and cultural symbolism. The skywell functions as a space for family handicrafts (e.g., weaving, drying crops) and also serves as the core space for festive ceremonies. The exterior corridor serves as a transitional area between indoors and outdoors, adapting to Yunnan’s mild climate by providing space for daily rest, socialization, and semi-open activities.
Spatial Reflection of Family Structure and Social Ethics: The layout of the building, with the main hall as the axis, arranges rooms according to the age and social status hierarchy, reflecting Confucian ethical order. The compact layout fosters interaction among family members, thereby maintaining the cohesion of the traditional extended family. Simultaneously, the shared nature of the skywell reinforces the cultural identity of “family and home as one”.
This section highlights the multifunctional nature and adaptability of the “Yikeyin” dwelling, emphasizing its integration with natural, climatic, and social factors and showcasing the building’s role in reflecting both ecological wisdom and family values.
2.2.4. Characteristics of Materials and Vernacular Technologies
The central Yunnan region is predominantly mountainous and rich in natural resources, providing the foundation for constructing “Yikeyin” traditional dwellings using locally sourced materials such as earth, stone, and wood. The exterior walls of the “Yikeyin” dwellings in Kunming are primarily built using rammed earth or adobe, providing excellent thermal insulation, wind resistance, and security. During construction, bamboo, wood, straw, or fragments of stone tiles are often incorporated into the earth walls to enhance cohesion and binding strength. Dwellings near lakes incorporate small snail shells into the earth walls for similar effects.
To mitigate the impact of ground moisture on earth walls, a foundation of hard, pressure-resistant stone is commonly used, often roughly processed to enhance durability. The extensive karst landscape of the central Yunnan Plateau provides abundant stone resources, making this locally available material both economically viable and structurally essential for “Yikeyin” construction. Wood, easy to harvest and process, serves as the primary building material for traditional dwellings. Yunnan pine, abundant, fast-growing, strong, and cost-effective, is widely used in the spatial framework, room partitions, floors, and staircases of “Yikeyin” dwellings, often being a decisive factor in the overall cost.
From the perspective of vernacular construction techniques, the “Yikeyin” dwelling exhibits the following features:
- (1).
- Adaptation to Building Materials: The construction methods are aligned with the properties of local materials. These methods, easily mastered and widely promoted by local artisans, include rammed earth construction, adobe masonry, stone walls, and comprehensive techniques for timber framing.
- (2).
- Collective Construction Model: The construction of “Yikeyin” dwellings generally follows a communal approach, where “one family builds and everyone helps”. This spontaneous and cost-efficient collective construction model reflects how individual housing adapts to the limited economic resources of rural societies.
- (3).
- Economical and Efficient Design: The “Yikeyin” dwellings embody the vernacular architectural principle of maximizing utility and minimizing costs. Over time, this approach results in compact square layouts and efficient spatial forms, including small building volumes, minimal window and door openings, and reduced skywell sizes.
Through its efficient spatial organization, passive climate regulation technologies, and organic integration of living and production functions, the Yunnan “Yikeyin” dwelling achieves a dynamic balance between people, architecture, and the environment. Its adaptive features not only respond to specific natural and cultural conditions but also encapsulate the philosophy of “local adaptation” and “use-oriented construction”, offering valuable insights for contemporary regional architecture and sustainable living models (shown in Figure 9).
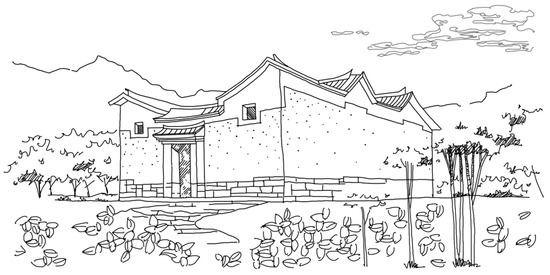
Figure 9.
Typical view of a “Yikeyin” [22].
2.3. Selection of Subjects
The skywell, as the core element of the “Yikeyin”, plays a pivotal role in shaping its functional layout, architectural form, spatial organization, and cultural context. Based on morphological characteristics, the skywells can be categorized into three primary types: longitudinal rectangular, transverse rectangular, and quasi-square. To investigate the relationship between skywell scale and climate adaptability in this traditional residential typology, this study conducted field surveys in the Guanyinshan community of Xishan District (located approximately 20 km from downtown), Kunming City, collecting data from well-preserved “Yikeyin” dwellings in the region. By integrating historical records (Kunming Local Chronicles and Xishan County Gazetteers) on the dimensional logic of local dwellings with field-measured data, representative ratios of skywell depth to width were analyzed.
As shown in Figure 10, the skywell dimensions in the sample data can be categorized into three types based on the depth-to-width ratio: 1:1.2, 1:1, and others. Of these, dwelling samples with a depth-to-width ratio of 1:1.2 are the most common, accounting for 54%. The second most frequent are those with a 1:1 ratio, comprising 38%. Samples with other depth-to-width ratios are the least common, making up only 8%, and these are primarily interstitial spaces between two skywells, lacking independence (shown in Table 3). The results indicate that the existing “Yikeyin” dwellings predominantly feature quasi-square skywells. Therefore, the first two types were selected as the main subjects for the study. These findings provide a robust foundation for selecting monitoring subjects and enable the accurate reconstruction of standard dwelling units and their skywell scales in computational simulations.
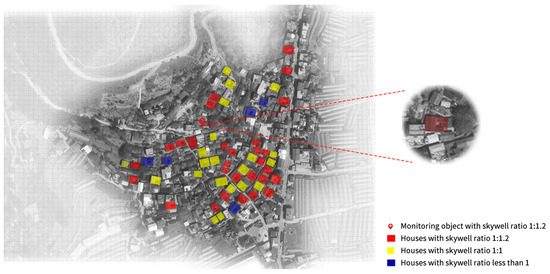
Figure 10.
Generalization of the sample of skywell ratios in the monitoring area.
Table 3.
Sample data on skywell ratios in the monitoring area.
3. On-Site Monitoring
3.1. Monitoring Subjects
This study selected a “Yikeyin” dwelling located in the Guanyin Mountain community as the subject for environmental measurements. The dwelling’s floor plan adheres to the typical “Three-Bay-Four-Chamber Structure with Inverted Octoscale Roof System” layout of the “Yikeyin” style, comprising a main house with three rooms, two side rooms on each side, a main entrance, door walls, and an enclosed skywell. The building faces approximately 95° (roughly eastward) (shown in Figure 11). The dwelling is well-preserved and remains in regular use.
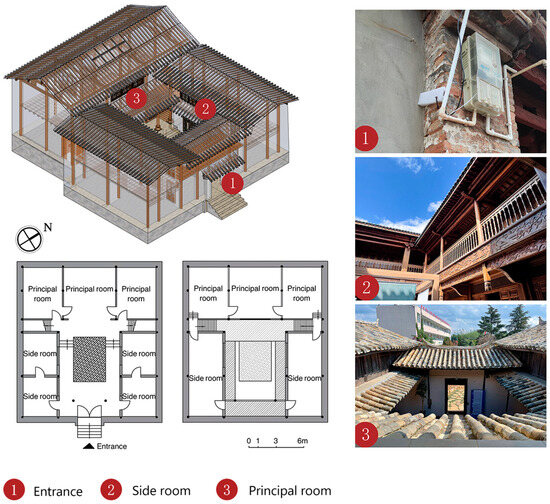
Figure 11.
Diagram of monitoring objects.
3.2. Monitoring Methods
The plan was to collect continuous environmental data to accurately obtain the “heat-humidity-wind” operational data of both the interior and exterior of the monitoring subject while integrating the data into a database for clear comparison. By using low-power sensors and IoT technology, the goal was to establish a system that integrates data sensing, transmission, storage, and analysis for future on-site environmental measurements of dwellings [24].
3.2.1. Monitoring System Setup
The monitoring system consisted of four main modules: the energy supply module, the sensor module, the networking module, and the monitoring module. The energy supply module powered the sensors and networking module via a low-voltage mobile power source, ensuring low energy consumption and environmental sustainability. The sensor module wirelessly transmitted data to the networking module via Bluetooth and Wi-Fi, ensuring effective data collection and transmission even in areas with poor signal reception. The networking module facilitated the wireless upload of monitoring data and cloud storage via a wireless data gateway. The monitoring module processed and visually displayed the data on the cloud platform, supporting real-time monitoring and scientific management of the building environment (shown in Figure 12).
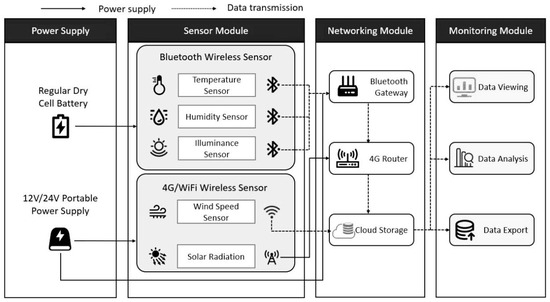
Figure 12.
Low-power internet of things monitoring system for building micro-environments.
3.2.2. Selection of Monitoring Equipment
The equipment used for the on-site measurements was custom designed by Shanghai Hangding Electronics Technology Co., Ltd. (Shanghai, China) and can be categorized into four functional types:
- (1).
- Integrated Temperature and Humidity Sensors (RYWS301): These sensors were used to measure the air temperature and relative humidity both inside and outside the building. A total of 13 units were used.
- (2).
- Integrated Wind Speed and Direction Sensors (RY-FSX): These sensors were used to collect wind field data inside and outside the building. A total of four units were used.
- (3).
- Solar Radiation Sensors (RY-CEBN): These sensors were used to obtain solar radiation data outside the building environment.
- (4).
- Wireless Data Gateway (AZ289): This device integrated power supply, data collection, and transmission functions. It was used to aggregate and store monitoring data, which were then uploaded to the cloud platform for visualization processing. A total of four units were used.
The specific parameters of the equipment are shown in Table 4 below:
Table 4.
Parameters of the monitoring equipment.
3.2.3. Monitoring Schedule
The selected monitoring period was July, the month with the highest average temperatures and extended cloudy or rainy conditions (as indicated in the annual temperature chart). The monitoring period ran from 12 July to 26 July 2024. The weather conditions were as follows: from 12 to 14 July, the weather was rainy; from 15 to 17 July, it was cloudy; from 18 to 23 July, it was rainy again; and from 24 to 26 July, it was cloudy.
In accordance with the architectural features of the “Yikeyin” dwellings, the monitoring zones were selected to include the external environment (a), the skywell (b), a room on the first floor (c), and a room on the second floor (d). The monitored parameters included air temperature, relative humidity, wind speed, and wind direction, in addition to solar radiation intensity in the external environment.
The integrated temperature and humidity sensors were placed at the following locations: the outdoor environment area (a), the center of the skywell (b), the center of a room on the first floor (c), and rooms on the second floor at distances of 2.6 m and 2.3 m from the walls (d). Integrated wind speed and direction sensors were placed in the outdoor environment area (a) and the skywell area (b). The solar radiation sensor was placed in the outdoor environment area (a) (shown in Figure 13).
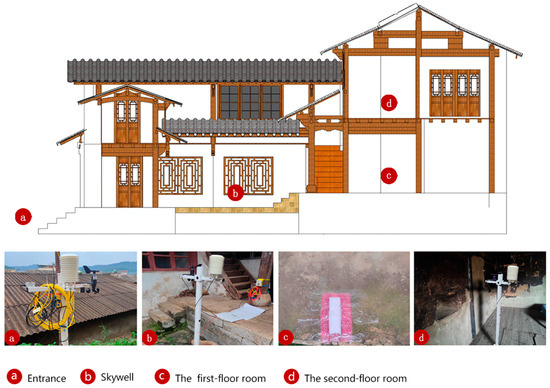
Figure 13.
Layout of monitoring equipment.
To prevent rain damage to the sensors, those placed on the ground for monitoring the temperature and relative humidity of the skywell floor were covered with custom breathable membranes. The other sensors were installed on custom white stands, fixed at a height of 1.5 m from the ground. Considering the accuracy of the monitoring and the power consumption of the devices, the data collection frequency for each sensor was set to once every 2 min.
During the monitoring period, the dwelling was unoccupied, with no active cooling or ventilation measures in place, and the building was in a naturally ventilated state. The first-floor room had no windows, whereas the second-floor room had only one window facing the skywell, which remained open throughout the monitoring period. The monitoring equipment arrangement is shown in the figure below.
3.3. Analysis of Monitoring Results
3.3.1. Regional Heat and Humidity Environment
During the monitoring period, the following environmental parameters were recorded in each monitored area: solar radiation, air temperature, and relative humidity, as illustrated in the Figure 14, Figure 15 and Figure 16:
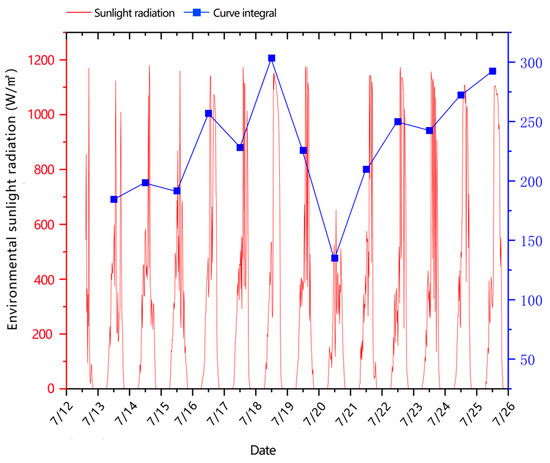
Figure 14.
Environmental sunlight radiation.
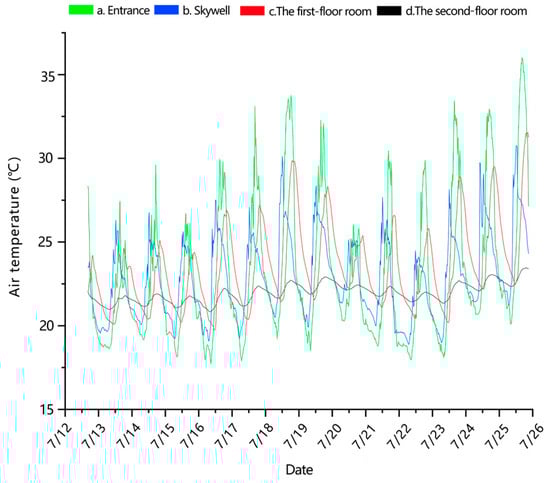
Figure 15.
Air temperature of four areas.
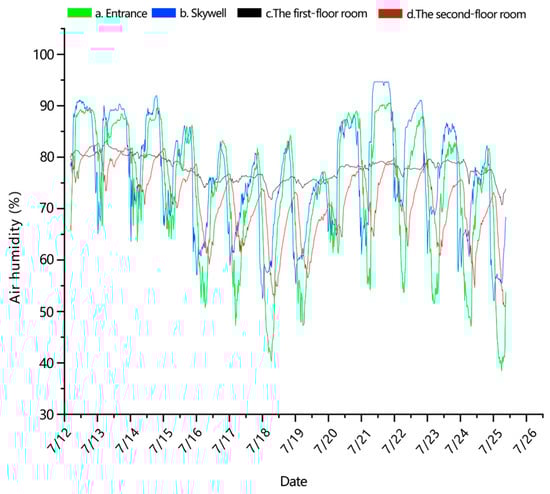
Figure 16.
Air humidity of four areas.
The variation in environmental sunlight radiation suggests that, influenced by weather conditions, sunlight radiation was relatively low from 12 July to 15 July. From 16 July to 19 July, sunlight radiation was abundant. On 20 July, it reached its lowest point, and from 21 July to 26 July, sunlight radiation increased again.
Analyzing the temperature and humidity changes in each monitored area reveals the following trends: After sunrise, as sunlight radiation intensity and air temperature rose, the temperature in each monitored area also began to increase. The skywell (b) was the first to experience a temperature increase, with a rapid rise, reaching its peak temperature the soonest. The temperature in the first-floor room (c) started increasing before the second-floor room (d), but at a slower rate, which resulted in a growing temperature differential between the areas. In the afternoon, when outdoor temperatures peaked, the temperatures in both the first- and second-floor rooms also reached their peaks, at which point the temperature difference across the areas was maximized. Following this, temperatures in all areas began to decrease gradually, with the skywell cooling the fastest, followed by the second-floor room, and the first-floor room cooling the slowest.
In terms of air humidity, as the intensity of environmental sunlight radiation increased, the relative humidity in the skywell area began to decrease earlier than in the external environment, followed by the first- and second-floor rooms. Overall, the relative humidity in all monitored areas showed an inverse trend to that of air temperature, with similar fluctuation amplitudes.
The thermal and humidity environment of the first-floor room was the most stable, with the temperature and humidity curves displaying the slowest fluctuations. During the monitoring period, the temperature in the first-floor room fluctuated between 20 °C and 25 °C, while the relative humidity was maintained between 70% and 85%. As shown in Figure 16 and Figure 17, compared to other areas, the first-floor room, with no ventilation measures, had the highest humidity. When environmental sunlight radiation changed, the temperature curve in the first-floor room fluctuated the least, suggesting that the increased humidity enhanced the thermal stability of the first-floor room.
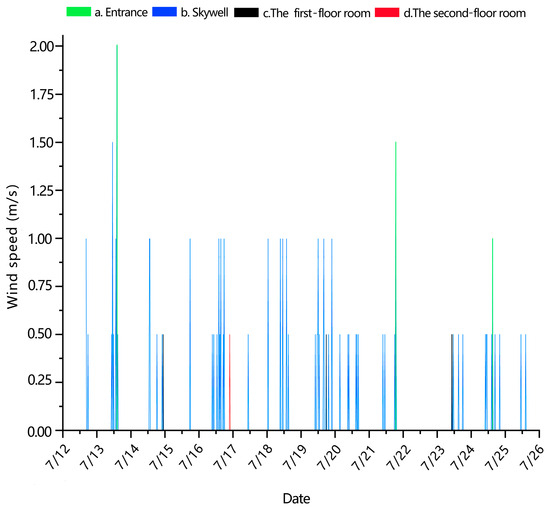
Figure 17.
Wind speed of four areas.
The temperature in the second-floor room was generally higher than in the first-floor room, fluctuating between 15 °C and 35 °C, with relative humidity generally lower than that of the first-floor room, ranging from 50% to 85%. The fluctuation amplitude of its temperature and humidity curve was larger. As seen in Figure 14, Figure 15 and Figure 16, the second-floor room was more significantly affected by sunlight radiation than the first-floor room. When sunlight radiation increased, the average temperature in the second-floor room rose significantly, and relative humidity decreased noticeably. From Figure 15 and Figure 16, it can be observed that when relative humidity was higher, the amplitude of temperature fluctuations in the second-floor room decreased, indicating that increased humidity plays a role in moderating the thermal stability of the second-floor room.
The thermal and humidity environment in the skywell area was most significantly influenced by external environmental factors. During the monitoring period, the temperature in the skywell fluctuated between 20 °C and 30 °C, with relative humidity maintained between 50% and 90%. As shown in the above figures, under identical external environmental conditions, the skywell area exhibited higher maximum and average temperatures compared to other monitored areas, with greater fluctuations in both temperature and humidity. This indicates that the skywell area was more sensitive to sunlight radiation. When sunlight radiation intensity was high, the temperature and humidity curves in the skywell fluctuated more significantly, reflecting that increased sunlight radiation reduced the thermal and humidity stability in the skywell area.
In summary, the air temperature and humidity in the various monitored areas within the building were significantly affected by external environmental factors, with strong interrelationships between the parameters. During the monitoring period, the temperature followed a diurnal pattern of rising during the day and decreasing at night, while humidity showed an inverse trend, decreasing during the day and increasing at night. This suggests that sunlight radiation plays a key role in regulating the thermal and humidity environment within the building. Analyzing the amplitude of temperature and humidity changes in four typical areas of the building reveals that an increase in air humidity helped to reduce the amplitude of temperature fluctuations, thereby maintaining the building’s thermal stability. With changes in elevation, from the first-floor room to the second-floor room, and then to the skywell and external environment, the fluctuation amplitude of air temperature and humidity gradually increased.
These phenomena suggest that natural meteorological conditions are crucial factors influencing the thermal and humidity comfort of traditional “Yikeyin” architecture. Moreover, differences in the building’s enclosure system and envelope structure resulted in variations in thermal stability and climate perception across different areas. Overall, environmental fluctuations were most pronounced in the external environment, followed by the skywell, with the second floor exhibiting a certain lag compared to the skywell, and the first floor remaining the most stable. Therefore, under varying meteorological conditions, different areas of the building may require distinct thermal and humidity regulation strategies to ensure the comfort and health of its occupants.
3.3.2. Natural Ventilation Monitoring
During the monitoring period, the wind direction and wind speed in each monitored area are shown in the Figure 17 and Figure 18:
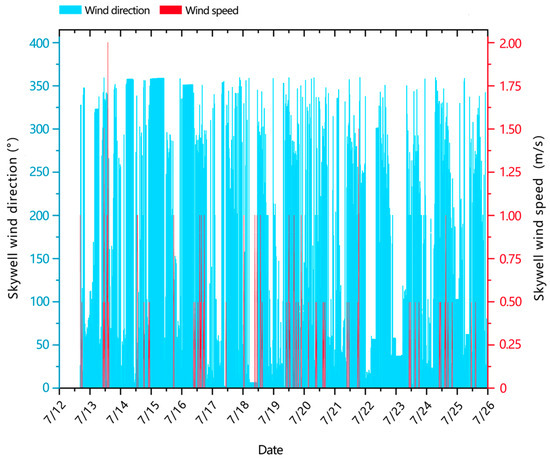
Figure 18.
Wind speed and direction of skywell area.
As shown in Figure 17, the monitoring results indicate that the overall environmental wind speed was relatively low, with the wind field predominantly concentrated during the daytime, while wind strength decreased at night. The wind speed in the skywell area was weaker than the environmental wind, with significant wind speeds recorded mostly around 1 m/s, and the wind direction primarily concentrated in the southwest and south (between 180° and 270°). Only on 13 July, at a certain time, did the wind speed reach a maximum of 2 m/s. The wind speed in both the first-floor and second-floor rooms was very weak throughout the monitoring period, remaining below 0.25 m/s. When the environmental wind direction was from the southwest or south (i.e., not aligned with the building’s main orientation), strong winds were effectively blocked and weakened by the surrounding walls and envelope structure. The perception of the external wind field in the skywell area was influenced by the combined effects of environmental wind speed and direction, with the building’s ventilation performance closely related to the characteristics of the external wind field and the building’s orientation.
From Figure 17 and Figure 18, it can be seen that, compared to the environmental climate, the temperature and humidity fluctuations in the skywell area were smaller; however, compared to the interior areas of the building, the temperature and humidity fluctuations in the skywell area were larger. The presence of the natural wind field in the skywell area partially regulated the microclimate inside and outside the building, significantly influencing temperature and humidity. Therefore, for buildings with natural ventilation, thermal and humidity regulation strategies can be focused on optimizing the design of the skywell to better control the indoor environment.
The analysis of this phenomenon suggests that the enclosed layout of the “Yikeyin” residence may be the primary reason for the formation of building practices that ensure thermal and humidity suitability in natural wind fields. The enclosed structure effectively blocks the ingress of external winds, with outdoor air entering the interior mainly through the main door or through the relatively higher roof, which leads to a significant reduction in airflow velocity. Simultaneously, the eaves of the residence, while providing shade to the walls and windows of the rooms, also greatly increase the airflow resistance near the windows. When weak outdoor air flows reach the vicinity of the windows, their velocity is further reduced, ultimately resulting in very low indoor wind speeds, typically below the range of human perception. This characteristic aligns with the local proverb “ventilation without wind”. Particularly in winter, this design greatly reduces the infiltration of cold winds, serving as an effective passive insulation measure.
4. Establishment of Geometric Models for Typical Building Forms
This study integrates photogrammetry with parametric skywell reconstruction and multiphysics simulations to decode conjugated heat transfer mechanisms in traditional vernacular dwellings’ thermal environments.
Using the CFD software PHOENICS, which has sufficient resolution to assess airflow and temperature fields, natural ventilation within the residential buildings was simulated. Additionally, the effects of heat conduction and sunlight radiation on the thermal curvature of the building envelope were calculated. The numerical simulation process is illustrated in Figure 19.
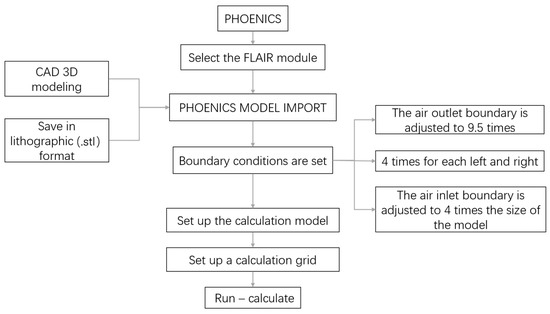
Figure 19.
Flowchart of model calculation simulation.
4.1. Boundary Condition Setup
This part investigates the relationship between skywell dimensions and indoor climate regulation by analyzing typical depth-to-width ratios and climatic conditions through computer simulations. The research aims to (1) examine how different skywell scales influence indoor environments under identical climate conditions and (2) evaluate the effectiveness of “Yikeyin” skywells in regulating thermal and humidity conditions across varying climates.
The specific parameter settings were as follows:
- (1).
- Based on the monitoring model, two typical skywell scales were selected as variables: a depth-to-width ratio of 1:1 (Condition 1) and 1:1.2 (Condition 2). Natural ventilation environment simulations were carried out under both summer and winter climate conditions (shown in Figure 20).
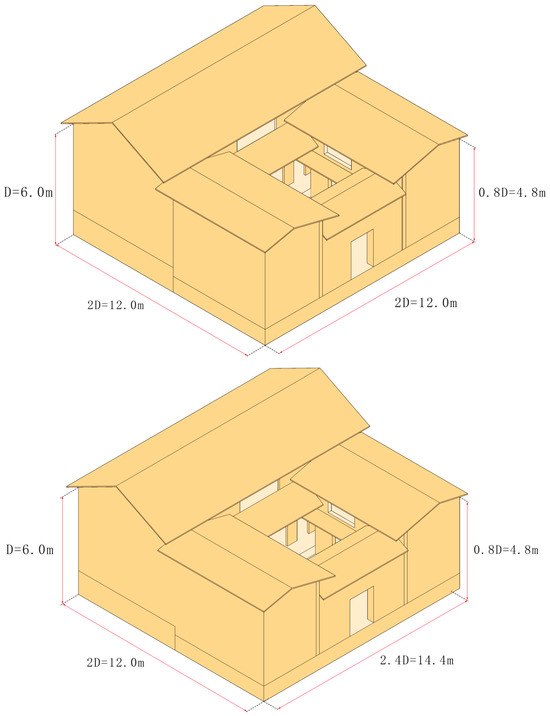 Figure 20. Modeling of skywell dimensions for Condition 1 (1:1) and Condition 2 (1:1.2).
 - (2).
- Environmental parameters were established by consulting data from meteorological stations such as the Kunming station in Yunnan Province on the China Weather Network as well as referencing relevant literature [60]. The average values for July and January were used as initial values. In July, the average dry bulb temperature is 20.03 °C (with a wet bulb temperature of 17 °C), humidity is 81.02%, the outdoor average wind speed is 2 m/s, and the wind direction is 238.53° (approximately southwest, with true north as 0°). In January, the average dry bulb temperature is 8.93 °C (with a wet bulb temperature of 6 °C), humidity is 64.60%, the outdoor average wind speed is 2.5 m/s, and the wind direction is 235.54°. The wind direction did not align with the building’s primary orientation, so the initial wind field was set as a gradient wind field. Temperature values were established using the highest and lowest values for summer and winter as boundary conditions. Humidity was set based on the highest and lowest daily extremes (with an average of approximately 25% in summer and 15% in winter; data sourced from the Kunming National Benchmark Meteorological Station, Station ID: 56778). Relatively, the sunlight radiation values were based on statistical data from 1993 to 2016 [72].
- (3).
- Environmental Calculation Domain: The height of the average building within the simulation radius was set as d. The distance from the inlet surface to the simulation object was 5d, and the distance from the outlet surface to the simulation object was 10d. For the selection of the calculation domain width, the diameter d was used as the reference scale, and the width was set as 9d (shown in Figure 21) [73].
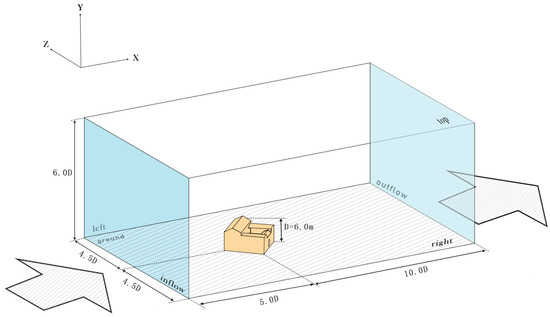 Figure 21. Diagram of the environmental calculation domain.
 - (4).
- Mesh Division Setup: The maximum grid size in each dimension followed the principle that it should not exceed 1/20 of the basic area length in that dimension. Since the simulation background environment and the simulation model were of different scale levels, the grid for the background environment was set to a coarser scale. By reducing the number of grids, the computational efficiency of the simulation was effectively improved. Meanwhile, for the simulation object, local refinement of the mesh was applied to enhance simulation accuracy.
4.2. Discussion on Model Uncertainty
However, when conducting CFD simulations, it is crucial to note that due to various factors, the simulation results may be distorted to some extent. This section discusses the uncertainties of the model.
(1) Boundary Conditions
The uncertainty of boundary conditions plays a key role in CFD simulations. Regarding the inlet boundary conditions, the form of wind speed distribution and the setting of turbulence parameters have a significant impact on the simulation results. When relying solely on empirical formulas or simplified assumptions, it is easy to underestimate the local turbulence characteristics. To address this issue, our team adjusted the inlet boundary to 1.5 times the size of the model, the outlet boundary to 2 times, and the left and right boundaries to 1 to 1.5 times. The boundary height was adjusted to 3 to 5 times the highest height of the physical model, and the free-stream turbulence intensity was set to 0.5%. The outlet boundary condition was applied as zero static pressure, and the ground, walls, and roof were modeled as no-slip boundaries with a fixed temperature.
(2) Grid Sensitivity
The grid sensitivity analysis is an important factor contributing to the uncertainty of simulation results. The standard k-ε model has specific requirements for grid resolution. When the global grid is too coarse, it is difficult to capture key details such as separation vortices and wake flows, significantly reducing the accuracy of calculations in complex flow regions. For example, in the simulation of flow around building corners, a coarse grid cannot accurately resolve separation vortices, resulting in significant differences in vorticity and velocity distributions compared to the actual situation. Our team ensured that the maximum grid size in each dimension did not exceed 1/20 of the basic area length of that dimension, with at least one grid line passing through each block. The grids were uniformly distributed, with a denser grid setting in the most concerned courtyard area, gradually diffusing to the surrounding areas. The grid gradient ratio (RATIO) was controlled in both directions, with a maximum change coefficient of 0.8.
The choice of grid type is also crucial. Structured grids have high computational efficiency but are difficult to conform to complex building geometries due to their regularity, affecting simulation accuracy, such as in the case of uniquely shaped curved buildings. Unstructured grids offer good flexibility and can adapt to complex geometries, but the aspect ratio and orthogonality must be strictly controlled; otherwise, additional errors may be introduced due to grid quality issues. Our team adopted a hybrid grid technique using structured grids for simple and regular flow regions (such as the external environment of the building) and unstructured grids for complex shapes and regions with significant flow changes (such as the first-floor room area), fully leveraging the advantages of both grid types. Additionally, we utilized grid quality checking tools to strictly control the aspect ratio and orthogonality of unstructured grids.
4.3. Verification Based on On-Site Monitoring
To precisely validate the applicability and accuracy of the CFD simulation method for the “Yikeyin” building’s geometric shape and boundary conditions, the research team compared and analyzed the monitored values with the simulated values. As the external environment monitoring point of the building was located on the windward side (measurement point a), the thermal environment at this position was influenced by multiple factors such as solar radiation and ventilation. Compared with the indoor microclimate, this external environment was more convenient to compare with the simulation parameters used in the CFD model and thus became the primary basis for verification. For the on-site monitoring results, considering the limited data samples, the monitoring values were taken as the benchmark, and the 97.5% confidence interval was considered [74]. The calculation was as follows:
where X represents the random variable of temperature or wind speed, and represent the upper and lower limits of the confidence interval, N represents the number of monitoring values in a day, is the standard deviation of X, and (N − 1) represents the 97.5th percentile of the t-distribution with N − 1 degrees of freedom.
The results show that during the monitoring period, the temperature fluctuated between 20 °C and 27 °C, and the wind speed mostly remained around 1.0 m/s. The CFD simulated temperature ranged from 22.85 °C to 26.34 °C, and the wind speed was around 1.0 m/s. The temperature difference was 6%, and the wind speed difference was 15%, both within a reasonable range. This indicates that the simulation method is applicable to this specific space (for specific results, see Table 5 and Table 6; Figure 22 and Figure 23).
Table 5.
Comparison of ambient point temperatures.
Table 6.
Comparison of ambient wind speeds.
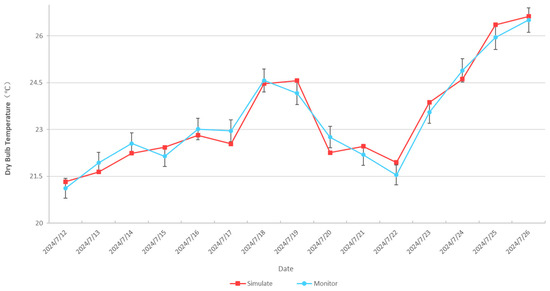
Figure 22.
Comparison of ambient point temperatures.
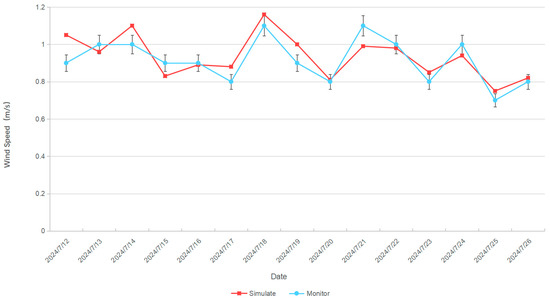
Figure 23.
Comparison of ambient wind speeds.
Based on the above results, the research team judged that in summer, the error between the monitoring values and the simulated values at a courtyard ratio of 1.2 was within a reasonable range, proving the reliability of the simulation method. Based on this, the team adopted the above simulation method to simulate and analyze buildings with courtyard ratios of 1:1 and 1:1.2 under the climatic conditions of summer and winter, respectively.
4.4. Selection of Calculation Basis
In the simulation, a two-equation turbulence model was used, specifically the standard k-ε model with wall functions [75]. Wall functions are typically empirical equations used to capture the physical characteristics of flow near wall surfaces, avoiding the direct resolution of high-gradient boundary layers. This approach reduces the number of grids and turbulent regions. In the standard k-ε model, k and ε are determined by the modeled turbulence kinetic energy and turbulent dissipation rate.
The wall functions implemented in the software were nutkWallFunction v12 and alphatJayatillekeWallFunction v12 [76], which represent velocity and temperature resolution, respectively. The calculation method employed in the program was the SIMPLEST algorithm (which is based on the traditional SIMPLE algorithm, with certain specifications made for the discretization of the convection-diffusion terms).
The governing equations were as follows:
where:
u is the velocity field;
P is the pressure field;
ρ is the density field;
g is the gravitational acceleration;
is the effective dynamic viscosity, which is the sum of molecular dynamic viscosity and turbulent dynamic viscosity;
is the effective thermal conductivity, which is the sum of thermal conductivity and turbulent thermal conductivity.
5. Simulation Results Analysis
5.1. Summer Simulation Results Analysis
The summer wind environment simulations were conducted for the two-story “Yikeyin” building under two different conditions in the PHOENICS software. The wind speed, humidity, and temperature result contours for the first floor (left) and the second floor (right) are shown below. As per Section 3.2.3, observation points are: a (outdoor entrance), b (courtyard center), c (first-floor room), d (second-floor room).
- (1).
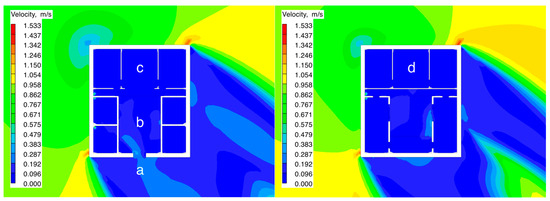 Figure 24. Graph of wind speed results for Condition 1 (summer).
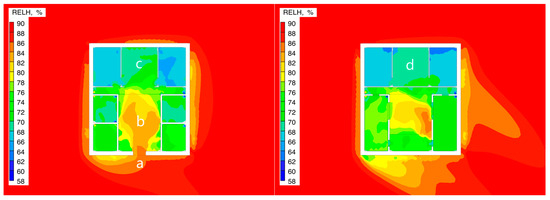 Figure 25. Graph of humidity results for Condition 1 (summer).
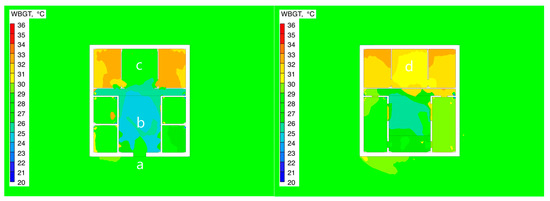 Figure 26. Graph of temperature results for Condition 1 (summer).
- (2).
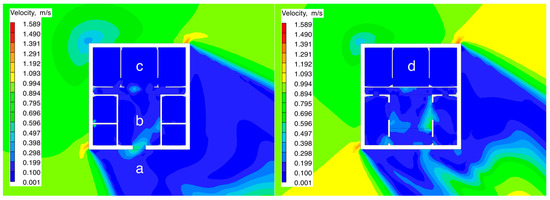 Figure 27. Graph of wind speed results for Condition 2 (summer).
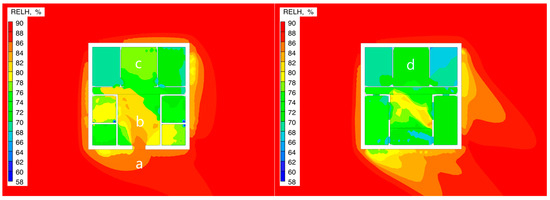 Figure 28. Graph of humidity results for Condition 2 (summer).
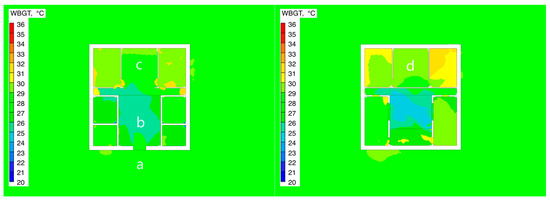 Figure 29. Graph of temperature results for Condition 2 (summer).
The analysis of the results revealed that in different areas of the building environment:
- (1).
- Smaller wind speeds were associated with higher relative humidity and higher temperatures.
- (2).
- Larger skywell dimensions led to higher wind speeds inside the building, resulting in lower temperatures and lower humidity levels.
However, due to the relatively mild wind conditions (breeze environment), the effect of skywell size on the internal temperature and humidity was limited. This indicates that while the size of the skywell does influence the temperature and humidity levels, its impact is not as significant in the context of the building’s overall ventilation capacity.
Therefore, adequate ventilation is essential during the summer months to prevent stuffiness and ensure a more comfortable indoor environment. Enhancing airflow can help mitigate the effects of high humidity and temperature, which are more pronounced in areas with reduced ventilation.
5.1.1. Evaluation of the First-Floor Room
Based on the data analysis from Table 4, the environmental parameters of the first-floor room showed variations under different conditions.
Under Condition 1, the average wind speed was 0.015 m/s, with a fluctuation range of 0.005 m/s to 0.030 m/s. The average relative humidity was 79.96%, fluctuating between 69.41% and 87.63%. The average temperature was 28.28 °C, with a fluctuation range of 24.74 °C to 30.62 °C. In Condition 2, the average wind speed increased to 0.030 m/s, with a fluctuation range of 0.010 m/s to 0.040 m/s. The average relative humidity decreased slightly to 78.56%, fluctuating between 68.03% and 87.02%. The average temperature slightly decreased to 27.83 °C, with a fluctuation range of 25.54 °C to 31.95 °C.
From the data, it can be observed that under Condition 2, compared to Condition 1, the wind speed significantly increased in the mild breeze environment, while relative humidity decreased, which is consistent with the principle that higher wind speeds reduce relative humidity when air humidity is high during the summer. Additionally, the larger the size of the natural ventilation space (e.g., the skywell), the more pronounced this trend of wind speed and humidity change became. In terms of temperature, the average temperature under Condition 2 was slightly lower than under Condition 1, but its fluctuation range was smaller, indicating that the temperature distribution was more concentrated in Condition 1.
Based on the wind speed, humidity, and temperature result cloud maps, the wind speed distribution across the building’s first floor was relatively uniform, suggesting high spatial homogeneity in the wind environment. However, the humidity and temperature showed significant spatial variation, indicating that humidity and temperature are not only influenced by wind speed but also closely related to the geometric characteristics of the room (e.g., size, location) and the layout of doors and windows (e.g., position, size). Specifically, the air speed fluctuation in the first-floor room was the slowest, indicating a higher stability in the wind environment of this area. In contrast, the fluctuation of humidity and temperature was significantly greater than that of the wind speed, reflecting the greater instability in the humidity and temperature environment. This phenomenon further suggests that the spatial distribution of humidity and temperature is influenced by multiple factors, and their dynamic characteristics are more complex than those of wind speed. Therefore, in building environment control, it is necessary to consider the combined effects of wind speed, humidity, temperature, and their interactions to achieve more precise environmental optimization (shown in Table 7).
Table 7.
Wind speed, humidity, and temperature in first-floor rooms in summer.
5.1.2. Evaluation of the Second-Floor Room
According to the comparative analysis of the data in Table 5, the second-floor room showed differences in environmental parameters compared to the first floor. Under both test conditions, the average wind speed of the second-floor room was 0.055 m/s (Condition 1) and 0.070 m/s (Condition 2), which represents an increase of 26.8–27.3% compared to the first-floor room. The average relative humidity was 76.56% and 75.06%, showing a decrease of 2.1–3.8% compared to the first floor. Specifically, in Condition 1, the wind speed range for the second-floor room was 0.005–0.055 m/s, and the humidity fluctuation range was 67.27–83.97%; while in Condition 2, the wind speed range expanded to 0.010–0.180 m/s, and the humidity distribution range adjusted to 65.17–82.93%.
Regarding temperature parameters, the average temperature on the second floor in both cases was 31.04 °C (Condition 1) and 30.53 °C (Condition 2), an increase of 2.76–2.70 °C compared to the first floor. The temperature fluctuation range was 29.17–32.75 °C in Condition 1 and narrowed to 28.18–31.75 °C in Condition 2, showing the optimization effect of the case adjustment on temperature stability.
The data suggest that the vertical spatial distribution affects the indoor microenvironment parameters, with the second-floor area showing characteristics of increased wind speed, lower relative humidity, and a slightly higher temperature gradient, indicating a warmer thermal environment.
In this building, although the wind speed difference between the first and second floors was not significant, the temperature on the second floor was markedly higher than that on the first floor. This phenomenon is primarily attributed to the combined effects of thermodynamic principles and the thermal characteristics of the building. First, according to the principle of natural convection, warm air tends to accumulate in the second-floor area as it rises vertically within the building. Secondly, the thermal conductivity of the building’s envelope further exacerbates the temperature stratification. The second floor, being closer to the roof, is more strongly affected by thermal radiation. The roof absorbs solar radiation, raising its temperature, and through heat conduction, transfers this heat downward, resulting in a significant increase in the temperature gradient on the second floor.
This temperature distribution pattern provides valuable insights into the spatial heterogeneity of the building’s internal thermal environment. This physical phenomenon aligns with the traditional use of the second floor for storage and drying purposes, capitalizing on the high temperature and low humidity characteristics of the space.
In building design and indoor environmental control, it is crucial to consider the coupling effects of thermal convection and heat transfer through the envelope structure. Measures such as optimizing the spatial layout, improving the thermal insulation of the envelope, or adopting zoning control strategies should be implemented to enhance overall indoor thermal comfort (shown in Table 8).
Table 8.
Wind speed, humidity, and temperature in second-floor rooms in summer.
5.1.3. Evaluation of the Skywell
The simulation data analysis indicates that, due to its expansive spatial characteristics, the skywell exhibits significantly higher wind speeds than the indoor areas. According to Table 5, the average wind speeds in the skywell under the two operating conditions were 0.70 m/s (Condition 1) and 0.75 m/s (Condition 2), which are approximately 10 to 12 times higher than those in the indoor areas. The average relative humidity was 84.01% (Condition 1) and 82.70% (Condition 2), which is about 5% to 8% lower than that in the indoor regions. Specifically, under Condition 1, the wind speed in the skywell ranged from 0.62 to 1.05 m/s, and the humidity fluctuated between 78.16% and 94.86%. Under Condition 2, the wind speed range extended to 0.7 to 1.10 m/s, and the humidity range narrowed to 82.45% to 89.95%.
Regarding temperature, the average temperature in the skywell was 26.1 °C (Condition 1) and 25.04 °C (Condition 2), which is approximately 3 °C to 5 °C lower than that in the indoor areas, indicating a significant cooling effect. The temperature fluctuation ranged from 25.85 °C to 26.34 °C under Condition 1, and narrowed further to 24.98 °C to 26.09 °C under Condition 2, demonstrating the skywell’s excellent temperature stability.
In summary, under the summer wind conditions, the distribution of wind speed and humidity in the three typical areas of the two-story “Yikeyin” building exhibited notable spatial variability. The results showed a positive correlation between the size of the skywell and wind speed, where larger skywell dimensions lead to higher wind speeds and lower humidity. This finding further supports the idea that increasing the size of the skywell significantly improves the moisture control effect during the summer, offering a crucial theoretical foundation for the spatial optimization of traditional buildings (shown in Table 9).
Table 9.
Wind speed, humidity, and temperature in skywell in summer.
In conclusion, during summer wind conditions, the three typical regions of the two-story “Yikeyin” building exhibit different wind and temperature stability characteristics. In terms of wind stability, the interior of the first floor demonstrates the highest stability, likely due to its relatively enclosed spatial structure, which minimizes the impact of wind. The skywell area, on the other hand, shows the lowest stability, as its open space facilitates greater wind movement. The second-floor interior is situated in between, offering moderate stability.
Similarly, temperature stability follows the same pattern. The skywell region, due to its effective ventilation, facilitates the dissipation of warm air, while the temperature in smaller rooms tends to be higher, likely due to limited space, poor air circulation, and the accumulation of heat.
These differences underscore the importance of taking corresponding measures in the design and use of such buildings to optimize the wind and temperature environments, thereby improving the comfort of the indoor living space.
5.2. Winter Simulation Results Analysis
In the winter, numerical simulations were conducted for the traditional two-story “Yikeyin” building under two skywell ratio conditions, 1:1 (Condition 1) and 1:1.2 (Condition 2), to analyze the wind, humidity, and thermal environment. The simulation results revealed a significant correlation between air humidity and wind speed within the building. A comparative analysis of Figure 18, Figure 19, Figure 20 and Figure 21 indicated that as the skywell ratio decreased from 1:1.2 to 1:1, the variation in wind speed within the building became more gradual, and both humidity and temperature parameters exhibited some spatial differences. Notably, the second-floor room showed the most significant response, with humidity variations reaching 15% and temperature fluctuations exceeding 2 °C, suggesting that changes in the skywell size have a significant impact on the humidity environment on the second floor.
Further spatial analyses revealed a gradient of increasing air humidity from the skywell to the first-floor room and then to the second-floor room, with increases of 20–25%. Similarly, the temperature gradient showed significant spatial differentiation, with temperature differences ranging from 1.5 °C to 2.5 °C. This vertical gradient in thermal and humidity parameters highlights the substantial disparities in thermal and humidity stability, as well as climate perception, across different regions of the building. The skywell area demonstrated strong environmental fluctuations, whereas the interior spaces exhibited relatively stable thermal and humidity characteristics, with the second-floor room being the most sensitive to changes in environmental parameters. As per Section 3.2.3, observation points are: a (outdoor entrance), b (courtyard center), c (first-floor room), d (second-floor room).
- (1).
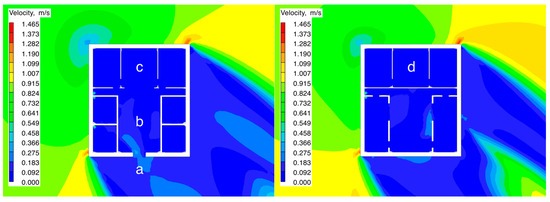 Figure 30. Graph of wind speed results for Condition 1 (winter).
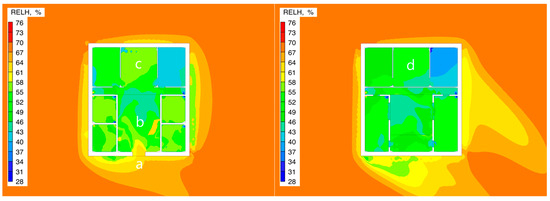 Figure 31. Graph of humidity results for Condition 1 (winter).
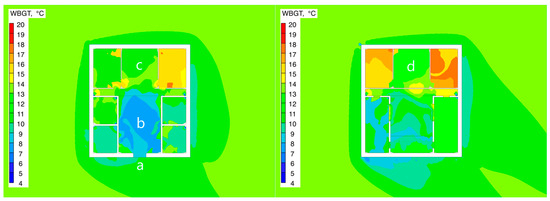 Figure 32. Graph of temperature results for Condition 1 (winter).
- (2).
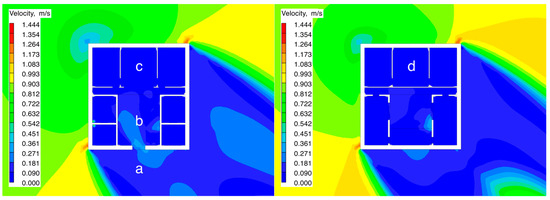 Figure 33. Graph of wind speed results for Condition 2 (winter).
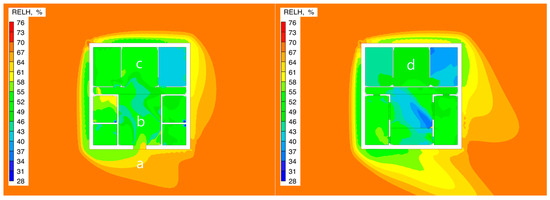 Figure 34. Graph of humidity results for Condition 2 (winter).
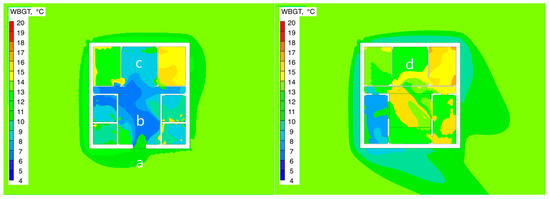 Figure 35. Graph of temperature results for Condition 2 (winter).
Based on the analysis of the data in Table 10, the air velocity in the first-floor room exhibited the slowest fluctuations, indicating a relatively high stability of the wind environment in this area. However, the temperature and humidity variations were relatively significant. Under the two different skywell ratios, the average wind speeds for the first-floor room were 0.015 m/s and 0.017 m/s, and the average humidity values were 53.95% and 52.23%, respectively.
Table 10.
Wind speed, humidity, and temperature in first-floor rooms in winter.
Specifically, under Condition 1 (skywell ratio 1:1), the wind speed fluctuated between 0.003 m/s and 0.032 m/s, with a variation range of 0.029 m/s, while the humidity remained between 39.83% and 57.61%. In Condition 2 (skywell ratio 1:1.2), the wind speed fluctuated between 0.005 m/s and 0.032 m/s, with a variation range of 0.031 m/s, and the humidity remained between 38.59% and 56.32%.
Additionally, the temperature exhibited relatively large fluctuations in both conditions. The average temperature was 10.91 °C under Condition 1 and 9.81 °C under Condition 2. The temperature fluctuations ranged from 7.81 °C to 15.30 °C in Condition 1 and from 6.98 °C to 14.44 °C in Condition 2.
Notably, the results indicate that the expansion of the skywell space in winter significantly contributed to a reduction in both temperature and humidity. The larger the space, the more pronounced the decrease in temperature and humidity, highlighting the importance of spatial design in optimizing the indoor thermal and humidity environment in cold weather.
This analysis further emphasizes the need for careful consideration of spatial configurations and skywell dimensions in the design of winter conditions to ensure better thermal comfort and humidity control within the building.
According to the data in Table 11, the environmental parameters in the second-floor room showed significant differences under different skywell ratios. In Condition 1, the average wind speed in the room was 0.040 m/s (range: 0.010–0.180 m/s, with a range of 0.170 m/s), and the average humidity was 48.42% (range: 38.80–53.21%). In Condition 2, the average wind speed increased to 0.060 m/s (range: 0.004–0.018 m/s, with a range of 0.014 m/s), and the average humidity decreased to 46.47% (range: 37.60–51.15%).
Table 11.
Wind speed, humidity, and temperature in second-floor rooms in winter.
In terms of temperature, the average temperature in Condition 1 was 12.86 °C (range: 6.66–16.10 °C), which is 1.18 °C higher than the average temperature of 11.68 °C (range: 5.49–15.10 °C) in Condition 2.
Compared to the first-floor space, the second-floor room showed a significantly different humidity distribution, specifically a decrease of 2.5–3.0 percentage points in average humidity, with an expanded fluctuation range (humidity range reaching 10.41%). Additionally, the temperature extremes were notably different: the minimum temperature was 2.17 °C lower than the first floor, and the minimum humidity difference was 8.35%.
This phenomenon indicates that, under the influence of solar radiation and the coupling effect of the skywell ventilation structure, a significant temperature and humidity gradient forms in the second-floor space. The extreme low temperature (≤5.49 °C) and low humidity (≤37.60%) values fell below the lower threshold of the ASHRAE comfort zone, requiring targeted adjustments in the building’s thermal design.
Based on the experimental data, as presented in the table below, the environmental parameters under Condition 1 (skywell ratio 1:1) and Condition 2 (skywell ratio 1:1.2) demonstrated significant differences. In terms of wind speed, the average wind speed in Condition 1 was 0.065 m/s, with maximum and minimum values of 0.076 m/s and 0.054 m/s, respectively. In Condition 2, the average wind speed was slightly higher at 0.070 m/s, with maximum and minimum values of 0.130 m/s and 0.030 m/s, respectively.
In terms of humidity, the average humidity in Condition 1 was 43.94%, with maximum and minimum values of 44.86% and 43.01%, respectively. In Condition 2, the average humidity was lower at 41.61%, with maximum and minimum values of 43.85% and 40.39%, respectively.
In terms of temperature, the average temperature in Condition 1 was 11.49 °C, with maximum and minimum values of 16.55 °C and 6.43 °C, respectively. In Condition 2, the average temperature was 10.41 °C, with maximum and minimum values of 15.60 °C and 5.19 °C, respectively.
Overall, a larger skywell space resulted in a greater fluctuation range in wind speed and humidity, while the temperature was generally lower in Condition 2, indicating that the increase in skywell ratio had a significant impact on the indoor microclimate (shown in Table 12).
Table 12.
Wind speed, humidity, and temperature in skywell in winter.
This study demonstrates that significant regional differences exist in the response to environmental climate conditions within traditional skywell dwellings. The skywell area, benefiting from superior ventilation, facilitates air exchange, but this characteristic may be disadvantageous for maintaining warmth during the winter months.
In contrast, the wind, humidity, and thermal stability of rooms across different floors exhibited a clear gradient, with the wind environment becoming increasingly unstable from the first floor to the second floor and to the skywell, while the humidity environment showed an opposite trend. Moreover, the thermal environment of the second-floor room was particularly sensitive to variations in wind speed.
Additionally, the dimensions and proportions of the skywell play a critical role in maintaining overall wind and thermal stability. Skywells with proportions closer to square shapes help reduce fluctuations in wind speed and temperature, aligning with the actual configuration of skywells in most traditional dwellings, thus highlighting the intricate design of traditional skywells in optimizing both indoor and outdoor climate conditions.
6. Discussion and Conclusions
6.1. Discussion and Outlook
This study highlights the importance of the skywell in natural ventilation and indoor climate control in “Yikeyin” dwellings through field monitoring and simulations. However, it has some limitations. First, the study only focuses on “Yikeyin” dwellings in Kunming and does not include other climates or types of traditional houses. This limits how widely the findings can be applied. Future research should expand to study more types of traditional houses in different climates. Advanced models and simulations should also be used to study how factors like outdoor environments, building materials, and wall structures affect traditional houses, helping to improve current models.
Second, the numerical simulations in this study relied on field measurements for boundary conditions and parameters, but some physical processes and environmental factors were simplified. The urban setting of these traditional dwellings was not considered, which means urban airflow and wind speed could affect the buildings’ wind behavior, possibly leading to differences between simulations and real-world conditions. Future research should use more detailed models and multi-scale simulations to refine boundary conditions and improve accuracy.
Also, the current discussion on how natural ventilation affects thermal-humidity regulation in low wind conditions is still preliminary. There is a lack of enough evidence to show if the mechanisms are the same as those in higher wind speeds. Future work should include more experiments and simulations in low-wind scenarios to better understand how light winds impact indoor thermal-humidity environments.
Lastly, this study mainly explored how skywell size and geometry affect the wind-thermal environment. The skywell dimensions, based on actual measurements and cultural significance, cannot be directly linked to a cause-and-effect relationship with building scale and environment. Other factors, like building materials and external landscaping, which also influence overall thermal-humidity regulation, were not systematically analyzed. Future research should combine the effects of building envelopes and local landscape design to better understand how traditional architecture adapts to extreme climate conditions.
In conclusion, this study uses quantitative analysis and simulations to show the benefits of “Yikeyin” dwellings in natural ventilation and climate control. It supports the protection and restoration of traditional houses and provides useful ideas for passive ventilation, energy saving, and green development in modern architecture.
6.2. Conclusions
This study investigated the intrinsic mechanisms of skywell natural ventilation in regulating indoor thermal and humidity environments within the traditional “Yikeyin” (One-Seal) dwellings of Kunming, employing a combined approach of field monitoring and numerical simulation. A representative sample from the Guanyinshan community in Xishan District, Kunming, was selected for analysis. Utilizing PHOENICS software, simulations were conducted for two skywell geometry ratios (1:1 and 1:1.2) across both summer and winter seasons. This study focused on analyzing the temporal and spatial distribution of key parameters, including wind speed, temperature, and humidity.
Both simulations and measurements showed that the skywell, as a key element for natural ventilation, significantly controls indoor wind and thermal conditions through its unique shape and layout. A larger skywell ratio (1:1.2) improves air flow in summer, effectively removing indoor heat and lowering temperatures. However, in winter, higher wind speeds increase heat loss, which is not ideal for insulation. To address this, additional insulation can be added in winter to reduce heat loss and removed in summer to ensure proper ventilation.
A smaller skywell ratio (1:1) helps maintain indoor thermal stability in winter and reduces heat loss. However, it is less effective for cooling in summer. Shading devices can be installed in summer to reduce heat input and improve comfort. These devices should be removed in winter to allow the building to absorb solar radiation and use thermal stability for winter comfort (see Table 13).
Table 13.
Seasonal performance of courtyards with different proportions.
This study also highlights thermal and humidity differences across the building’s functional areas. The first floor, with a higher enclosure and lower wind speed, shows more stable temperature and humidity levels, while the second floor, more exposed to sunlight, experiences greater fluctuations. The skywell area, despite larger temperature and humidity changes, improves summer comfort through efficient ventilation. Simulations confirm that wind speed significantly regulates indoor temperature reductions and humidity increases, with varying sensitivity across floors.
In conclusion, the “Yikeyin” dwelling dynamically adapts to extreme climates by optimizing skywell geometry and internal space division, enhancing summer cooling through ventilation and winter insulation by controlling wind speed. This design reflects traditional skywell architecture’s adaptive wisdom and offers theoretical and practical insights for modern climate-responsive building design.
Author Contributions
Conceptualization, Y.Y., L.W., G.X. and W.X.; Methodology, X.W. (Xinping Wang), Y.W., X.W. (Xun Wen), W.J., G.X., B.H. and W.X.; Software, Y.W., X.W. (Xun Wen) and W.J.; Validation, S.L. and X.W. (Xun Wen); Formal analysis, Y.W., X.W. (Xun Wen) and J.Y.; Investigation, Y.Y. and N.N.; Resources, L.W., W.J. and J.Y.; Data curation, Y.W.; Writing—original draft, Y.Y., X.W. (Xinping Wang), S.L. and N.N.; Writing—review & editing, Y.Y. and J.C.; Visualization, X.W. (Xinping Wang), S.L. and N.N.; Supervision, L.W., G.X. and W.X.; Project administration, L.W., W.J., B.H. and W.X.; Funding acquisition, W.X. All authors have read and agreed to the published version of the manuscript.
Funding
This research was funded by Key Laboratory of New Technology for Construction of Cities in Mountain Area LNTCCMA-20230103; Natural Science Foundation Youth Project of Hubei 2023AFB510; Guiding Project of Scientific Research Program of the Hubei Provincial Department of Education B2023254; Yunnan Provincial Basic Research Program 202501AT070217, 202401CF070194; Scientific Research Fund of Yunnan Provincial Department of Education 2025J0017; Yunnan University Education and Teaching Reform Research 2023Y43; Yunnan Province Xingdian Talent Support Program—Young Talent Special Project.
Institutional Review Board Statement
Not applicable.
Informed Consent Statement
Not applicable.
Data Availability Statement
The data presented in this study are available on request from the corresponding author.
Acknowledgments
We would like to express our gratitude to the “Buran” Tea House monitoring site for their support as well as to the local community and government for their assistance. We are deeply thankful to the team from Yunnan University for their contributions and to the team from Tongji University for providing equipment and preliminary monitoring support. The authors anknowledge the Experimental Center of Materials Science and Engineering in Tongji University. Additionally, we would like to extend our special thanks to Tang Shichao, a scholar and publisher specializing in Yunnan traditional culture, for his invaluable assistance. Finally, we extend our appreciation to all the participants and students who were involved in the research and fieldwork but could not be individually acknowledged due to space limitations.
Conflicts of Interest
The authors declare no conflicts of interest.
References
- Bridgewater, P.; Rotherham, I.D. A critical perspective on the concept of biocultural diversity and its emerging role in nature and heritage conservation. People Nat. 2019, 1, 291–304. [Google Scholar] [CrossRef]
- Omer, A.M. Renewable building energy systems and passive human comfort solutions. Renew. Sustain. Energy Rev. 2008, 12, 1562–1587. [Google Scholar]
- Askar, R.; Bragança, L.; Gervásio, H. Adaptability of buildings: A critical review on the concept evolution. Appl. Sci. 2021, 11, 4483. [Google Scholar] [CrossRef]
- Zhang, N.; Cai, Y.; Jin, Y.; Cai, H.; Qin, Y.; Li, W.; Ren, Y.; He, J.; Liu, Z. Research on the Green Construction Technology of Stilt Houses Based on the Climate Adaptation of Transitional Seasons. Buildings 2024, 14, 3415. [Google Scholar] [CrossRef]
- Corticos, N.D. Improving residential building efficiency with membranes over façades: The Mediterranean context. J. Build. Eng. 2020, 32, 101421. [Google Scholar]
- Cheng, Y.; Gao, M.; Jia, J.; Sun, Y.; Fan, Y.; Yu, M. An optimal and comparison study on daylight and overall energy performance of double-glazed photovoltaics windows in cold region of China. Energy 2019, 170, 356–366. [Google Scholar] [CrossRef]
- Lazar, N.; Chithra, K. Role of culture in sustainable development and sustainable built environment: A review. Environ. Dev. Sustain. 2022, 24, 5991–6031. [Google Scholar] [CrossRef]
- Chandel, S.S.; Sharma, V.; Marwah, B.M. Review of energy efficient features in vernacular architecture for improving indoor thermal comfort conditions. Renew. Sustain. Energy Rev. 2016, 65, 459–477. [Google Scholar]
- Murakami, S.; Kato, S.; Zeng, J. Combined simulation of airflow, radiation and moisture transport for heat release from a human body. Build. Environ. 2000, 35, 489–500. [Google Scholar] [CrossRef]
- Yang, J.; Jin, S.; Xiao, X.; Jin, C.; Xia, J.C.; Li, X.; Wang, S. Local climate zone ventilation and urban land surface temperatures: Towards a performance-based and wind-sensitive planning proposal in megacities. Sustain. Cities Soc. 2019, 47, 101487. [Google Scholar]
- Tong, S.; Wen, J.; Wong, N.H.; Tan, E. Impact of façade design on indoor air temperatures and cooling loads in residential buildings in the tropical climate. Energy Build. 2021, 243, 110972. [Google Scholar]
- Li, Y.; Arulnathan, V.; Heidari, M.D.; Pelletier, N. Design considerations for net zero energy buildings for intensive, confined poultry production: A review of current insights, knowledge gaps, and future directions. Renew. Sustain. Energy Rev. 2022, 154, 111874. [Google Scholar]
- Hu, Z.; Josef, S.; Min, Q.; Tan, M.; Cheng, F. Visualizing the cultural landscape gene of traditional settlements in China: A semiotic perspective. Herit. Sci. 2021, 9, 1–19. [Google Scholar]
- Nguyen, A.T.; Truong NS, H.; Rockwood, D.; Le AD, T. Studies on sustainable features of vernacular architecture in different regions across the world: A comprehensive synthesis and evaluation. Front. Archit. Res. 2019, 8, 535–548. [Google Scholar]
- Liu, S.; Kwok, Y.T.; Lau KK, L.; Ouyang, W.; Ng, E. Effectiveness of passive design strategies in responding to future climate change for residential buildings in hot and humid Hong Kong. Energy Build. 2020, 228, 110469. [Google Scholar] [CrossRef]
- Xu, G.; Zhao, H.; Li, J.; Shi, Y.; Feng, X.; Zhang, Y. Multivariate thermal environment data extraction and evaluation: A neighborhood scale case in Guangzhou, China. Build. Environ. 2023, 234, 110190. [Google Scholar]
- Li, M.; Jin, Y.; Guo, J. Dynamic characteristics and adaptive design methods of enclosed courtyard: A case study of a single-story courtyard dwelling in China. Build. Environ. 2022, 223, 109445. [Google Scholar]
- Elgheznawy, D.; Eltarabily, S. The impact of sun sail-shading strategy on the thermal comfort in school courtyards. Build. Environ. 2021, 202, 108046. [Google Scholar]
- Asfour, O.S. A comparison between the daylighting and energy performance of courtyard and courtyard buildings considering the hot climate of Saudi Arabia. J. Build. Eng. 2020, 30, 101299. [Google Scholar]
- Tien, P.W.; Calautit, J.K. Numerical analysis of the wind and thermal comfort in courtyards “skycourts” in high rise buildings. J. Build. Eng. 2019, 24, 100735. [Google Scholar]
- Yang, D.; Wang, L. Tracing the origin and evolution of the Yikeyin house in central Yunnan. Int. J. Archit. Herit. 2022, 2, 1–15. [Google Scholar]
- Yang, Z.; Liao, K.; Jiang, W.; Yang, Y.; Zhou, J. The influence of natural wind patterns on the thermal and humidity comfort of the “one seal” building in Yunnan, China. J. Asian Archit. Build. Eng. 2024, 1–23. [Google Scholar] [CrossRef]
- Yu, S.; Pan, W.; Su, H.; Ye, L.; Wang, D. Experimental study on tenon and mortise joints of wood-structure houses reinforced by innovative metal dampers. Forests 2022, 13, 1177. [Google Scholar] [CrossRef]
- Pan, Y.; Zhong, W.; Zheng, X.; Xu, H.; Zhang, T. Natural ventilation in vernacular architecture: A systematic review of bioclimatic ventilation design and its performance evaluation. Build. Environ. 2024, 253, 111317. [Google Scholar]
- Yang, N.; Chen, B.; Xi, J. A Theoretical Design Framework of Contemporary Vernacular Architecture Based on a Scoping Review of the Best Practices Worldwide. Buildings 2024, 14, 3525. [Google Scholar] [CrossRef]
- Punj, N.; Ahmi, A.; Tanwar, A.; Rahim, S.A. Mapping the field of green manufacturing: A bibliometric review of the literature and research frontiers. J. Clean. Prod. 2023, 423, 138729. [Google Scholar]
- Dasgupta, A.; Poco, J.; Wei, Y.; Cook, R.; Bertini, E.; Silva, C.T. Bridging theory with practice: An exploratory study of visualization use and design for climate model comparison. IEEE Trans. Vis. Comput. Graph. 2015, 21, 996–1014. [Google Scholar]
- Norton, T.; Sun, D.W. Computational fluid dynamics (CFD)–an effective and efficient design and analysis tool for the food industry: A review. Trends Food Sci. Technol. 2006, 17, 600–620. [Google Scholar] [CrossRef]
- Lirola, J.M.; Castañeda, E.; Lauret, B.; Khayet, M. A review on experimental research using scale models for buildings: Application and methodologies. Energy Build. 2017, 142, 72–110. [Google Scholar]
- Hussain, S.; Oosthuizen, P.H. Validation of numerical modeling of conditions in an courtyard space with a hybrid ventilation system. Build. Environ. 2012, 52, 152–161. [Google Scholar]
- Moosavi, L.; Mahyuddin, N.; Ab Ghafar, N.; Ismail, M.A. Thermal performance of atria: An overview of natural ventilation effective designs. Renew. Sustain. Energy Rev. 2014, 34, 654–670. [Google Scholar]
- Van Hooff, T.; Blocken, B. On the effect of wind direction and urban surroundings on natural ventilation of a large semi-enclosed stadium. Comput. Fluids 2010, 39, 1146–1155. [Google Scholar]
- He, M.; Li, L.; Tao, S. Sustainable Design Methods Translated from the Thermodynamic Theory of Vernacular Architecture: Courtyard Prototypes. Buildings 2024, 14, 3142. [Google Scholar]
- Zhu, J.; Feng, J.; Lu, J.; Chen, Y.; Li, W.; Lian, P.; Zhao, X. A review of the influence of courtyard geometry and orientation on microclimate. Build. Environ. 2023, 236, 110269. [Google Scholar]
- Sakiyama NR, M.; Carlo, J.C.; Frick, J.; Garrecht, H. Perspectives of naturally ventilated buildings: A review. Renew. Sustain. Energy Rev. 2020, 130, 109933. [Google Scholar] [CrossRef]
- Prakash, D. Ventilation performance analysis on low-rise courtyard building for various courtyard shape factors and roof topology. Int. J. Vent. 2023, 22, 56–76. [Google Scholar]
- Micallef, D.; Buhagiar, V.; Borg, S.P. Cross-ventilation of a room in a courtyard building. Energy Build. 2016, 133, 658–669. [Google Scholar]
- Jiang, Z.; Gao, W.; Yao, W. Research on the wind environment in an enclosed courtyard: Effect of the opening position, size and wind angle. Urban Clim. 2023, 52, 101737. [Google Scholar]
- Serra, N. Revisiting RANS turbulence modelling used in built-environment CFD simulations. Build. Environ. 2023, 237, 110333. [Google Scholar]
- Chenari, B.; Carrilho, J.D.; Da Silva, M.G. Towards sustainable, energy-efficient and healthy ventilation strategies in buildings: A review. Renew. Sustain. Energy Rev. 2016, 59, 1426–1447. [Google Scholar] [CrossRef]
- Hasehzadeh Haseh, R.; Khakzand, M.; Ojaghlou, M. Optimal thermal characteristics of the courtyard in the hot and arid climate of Isfahan. Buildings 2018, 8, 166. [Google Scholar] [CrossRef]
- López, C.; Sierra, D.F. Condicionantes bioclimáticos en la arquitectura colonial de Colombia la casa-patio en Cartagena de Indias y Bogotá. Estoa Rev. Fac. Arquit. Urban Univ. Cuenca 2018, 7, 7–26. [Google Scholar]
- Lee, H. A Study on the Roles and Meaning of Courtyards of Alvar Aalto’s Residences. J. Korean Inst. Tradit. Landsc. Archit. 2018, 16, 58–65. [Google Scholar]
- Guo, P.; Ding, C.; Guo, Z.; Liu, T.; Lyu, T. Coupling CFD simulation and field experiments in summer to prove Feng Shui optimizes courtyard wind environments: A case study of Prince Kung’s mansion in Beijing. Buildings 2022, 12, 629. [Google Scholar] [CrossRef]
- Li, Z.; Diao, J.; Lu, S.; Tao, C.; Krauth, J. Exploring a sustainable approach to Vernacular Dwelling spaces with a multiple evidence base method: A case study of the Bai People’s courtyard houses in China. Sustainability 2022, 14, 3856. [Google Scholar] [CrossRef]
- Andrade, C.; Fonseca, A.; Santos, J.A.; Bois, B.; Jones, G.V. Historic changes and future projections in Köppen–Geiger climate classifications in major wine regions worldwide. Climate 2024, 12, 94. [Google Scholar] [CrossRef]
- Philokyprou, M.; Michael, A. Environmental sustainability in the conservation of vernacular architecture. The case of rural and urban traditional settlements in Cyprus. Int. J. Archit. Herit. 2021, 15, 1741–1763. [Google Scholar]
- Liu, Q.; Liao, Z.; Wu, Y.; Mulugeta Degefu, D.; Zhang, Y. Cultural sustainability and vitality of Chinese vernacular architecture: A pedigree for the spatial art of traditional villages in Jiangnan region. Sustainability 2019, 11, 6898. [Google Scholar] [CrossRef]
- Wen, B.; Yang, Q.; Peng, F.; Liang, L.; Wu, S.; Xu, F. Evolutionary mechanism of vernacular architecture in the context of urbanization: Evidence from southern Hebei, China. Habitat Int. 2023, 137, 102814. [Google Scholar]
- Zhong, W.; Xiao, W.; Zhang, T. Numerical investigations on natural ventilation in atria of China’s Southern Yangtze vernacular dwellings. Sustain. Cities Soc. 2023, 89, 104341. [Google Scholar]
- Huang, H.; Xie, Y.Q.; Chen, J.J.; Liang, S.; Chen, Z.J. Bioclimatic design strategy of vernacular architecture in the south-east of China: A case study in Fujian, China. Int. J. Low-Carbon Technol. 2024, 19, 1–17. [Google Scholar] [CrossRef]
- Rawiwan Oranratmanee. Cultural geography of vernacular architecture in a cross-cultural context: Houses of the Dai ethnic minority in South China. J. Cult. Geogr. 2020, 37, 67–87. [Google Scholar] [CrossRef]
- Cao, K.; Liu, Y.; Cao, Y.; Wang, J.; Tian, Y. Construction and characteristic analysis of landscape gene maps of traditional villages along ancient Qin-Shu roads, Western China. Herit. Sci. 2024, 12, 37. [Google Scholar]
- Liu, P.; Zeng, C.; Liu, R. Environmental adaptation of traditional Chinese settlement patterns and its landscape gene mapping. Habitat Int. 2023, 135, 102808. [Google Scholar]
- Sun, Q.; Luo, Z.; Bai, L. The impact of internal courtyard configuration on thermal performance of long strip houses. Buildings 2023, 13, 371. [Google Scholar] [CrossRef]
- Li, J.; Peng, X.; Li, C.; Luo, Q.; Peng, S.; Tang, H.; Tang, R. Renovation of Traditional Residential Buildings in Lijiang Based on AHP-QFD Methodology: A Case Study of the Wenzhi Village. Buildings 2023, 13, 2055. [Google Scholar] [CrossRef]
- Yang, Y.-N.; Zhou, J.; Song, J.-R.; Wang, X.-P.; Xu, X.-H.; Li, Y.-X.; Zeng, J.-C.; Sa, Y.; Jiang, W. Architectural Physical Acoustic Environmental Design Transformation of Academic Lecture Halls in the Universities—Taking the Hall of School of Architecture and Urban Planning of Yunnan University as an Example. Buildings 2024, 14, 1583. [Google Scholar] [CrossRef]
- Wu, Q.; Cheng, J.; Young, C. Social differentiation and spatial mixture in a transitional city-Kunming in southwest China. Habitat Int. 2017, 64, 11–21. [Google Scholar]
- Gao, Y.; Pitts, A.; Jiang, W. Peri-urban villages in Kunming, Southwest China: History of change with dual urban–rural characteristics. J. Archit. 2022, 27, 1063–1089. [Google Scholar] [CrossRef]
- Wu, Y.; Yan, H.; Shi, Z.; Shu, K. Research on the response of heavy precipitation in Kunming to urbanization and thermal environment changes. Adv. Clim. Chang. Res. 2023, 19, 723. [Google Scholar]
- Zhang, T.; Li, M.; Wang, Y.; Zhou, J.; Li, Y.; Zhang, F.; Cao, J.; Chen, X.; He, B.J. Refined building thermal climate zoning scheme in regions with mountainous terrain for accurate building energy-saving potential estimation. Energy Build. 2024, 313, 114228. [Google Scholar]
- GB 50176-2016; Code for Thermal Design of Civil Building. China Architecture & Building Press: Beijing, China, 2016.
- Yan, B.; Hao, F.; Meng, X. When artificial intelligence meets building energy efficiency, a review focusing on zero energy building. Artif. Intell. Rev. 2021, 54, 2193–2220. [Google Scholar]
- JGJ/T 346-2014; Standard for Weather Data of Building Energy Efficiency. China Architecture & Building Press: Beijing, China, 2014.
- Duan, H.; Li, Q.; He, L.; Zhang, J.; An, H.; Ali, R.; Vazifedoust, M. Climate Classification for Major Cities in China Using Cluster Analysis. Atmosphere 2024, 15, 741. [Google Scholar] [CrossRef]
- Liu, H.; Zhang, Z.; Zhang, T.; Wang, L. Revisiting China’s provincial energy efficiency and its influencing factors. Energy 2020, 208, 118361. [Google Scholar]
- DBJ53/T-39-2020; Design Standard for Energy Efficiency of Civil Buildings. Yunnan Science and Technology Press: Kunming, China, 2020.
- Vandamme, S.; Demuzere, M.; Verdonck, M.L.; Zhang, Z.; Van Coillie, F. Revealing kunming’s (china) historical urban planning policies through local climate zones. Remote Sens. 2019, 11, 1731. [Google Scholar] [CrossRef]
- Wang, X.; Fang, K.; Chen, L.; Furuya, N. The influence of courtyard types on the consciousness of shared space in amalgamated traditional dwellings-a case study on traditional dwellings in Quanzhou City, Fujian Province, China. J. Asian Archit. Build. Eng. 2019, 18, 335–350. [Google Scholar]
- Wang, L.; Huang, Q.; Zhang, Q.; Xu, H.; Yuen, R.K. Role of courtyard geometry in building energy consumption: The case of a fully air-conditioned enclosed courtyard in cold climates, China. Energy Build. 2017, 151, 228–241. [Google Scholar]
- Lu, Y.; Xiang, Y.; Chen, G.; Wu, Y.; Sun, C.; Liu, J. Summer dynamic thermal environment for isolated courtyard in the severe cold region: On-site measurement and numerical simulation. Appl. Therm. Eng. 2019, 160, 114108. [Google Scholar]
- Chen, X.; Zhang, Y. Impacts of urban surface characteristics on spatiotemporal pattern of land surface temperature in Kunming of China. Sustain. Cities Soc. 2017, 32, 87–99. [Google Scholar] [CrossRef]
- Abu-Zidan, Y.; Mendis, P.; Gunawardena, T. Optimising the computational domain size in CFD simulations of tall buildings. Heliyon 2021, 7, e06723. [Google Scholar]
- Kauppinen, A.; Kiviste, M.; Pirhonen, J.; Tuominen, E.; Laukkarinen, A.; Huttunen, P.; Vinha, J. Air pressure differences over external walls in new and retrofitted schools and daycare centers. Buildings 2022, 12, 1629. [Google Scholar] [CrossRef]
- Khaled, M.F.; Aly, A.M.; Elshaer, A. Computational efficiency of CFD modeling for building engineering: An empty domain study. J. Build. Eng. 2021, 42, 102792. [Google Scholar]
- López-Cabeza, V.P.; Rivera-Gómez, C.; Roa-Fernández, J.; Hernandez-Valencia, M.; Herrera-Limones, R. Effect of thermal inertia and natural ventilation on user comfort in courtyards under warm summer conditions. Build. Environ. 2023, 228, 109812. [Google Scholar]
Disclaimer/Publisher’s Note: The statements, opinions and data contained in all publications are solely those of the individual author(s) and contributor(s) and not of MDPI and/or the editor(s). MDPI and/or the editor(s) disclaim responsibility for any injury to people or property resulting from any ideas, methods, instructions or products referred to in the content. |
© 2025 by the authors. Licensee MDPI, Basel, Switzerland. This article is an open access article distributed under the terms and conditions of the Creative Commons Attribution (CC BY) license (https://creativecommons.org/licenses/by/4.0/).