

Towards Sustainable Cities: A KPI-Based Method to Compare Cities’ Performance and Encourage the Spread of Electric Cars

 ,
,  ,
, 
 ,
,
Abstract
1. Introduction
2. Literature Review
2.1. Business Models and Economic Considerations
2.2. Charging Infrastructure Planning and Optimization
2.3. Policy and Planning for EV Market Growth
2.4. Barriers to EV Deployment
2.5. Charging Infrastructure and Spatial Distribution
2.6. Urban Decarbonization Strategies
2.7. Motivation and Contributions
- Regarding the use of electric cars, are there common elements that can be identified among different cities?
- Is it possible to identify certain cities that represent benchmarks in electric car mobility?
- Is it possible to identify aspects to be improved with the aim of promoting electric car mobility in cities to improve sustainable urban mobility?
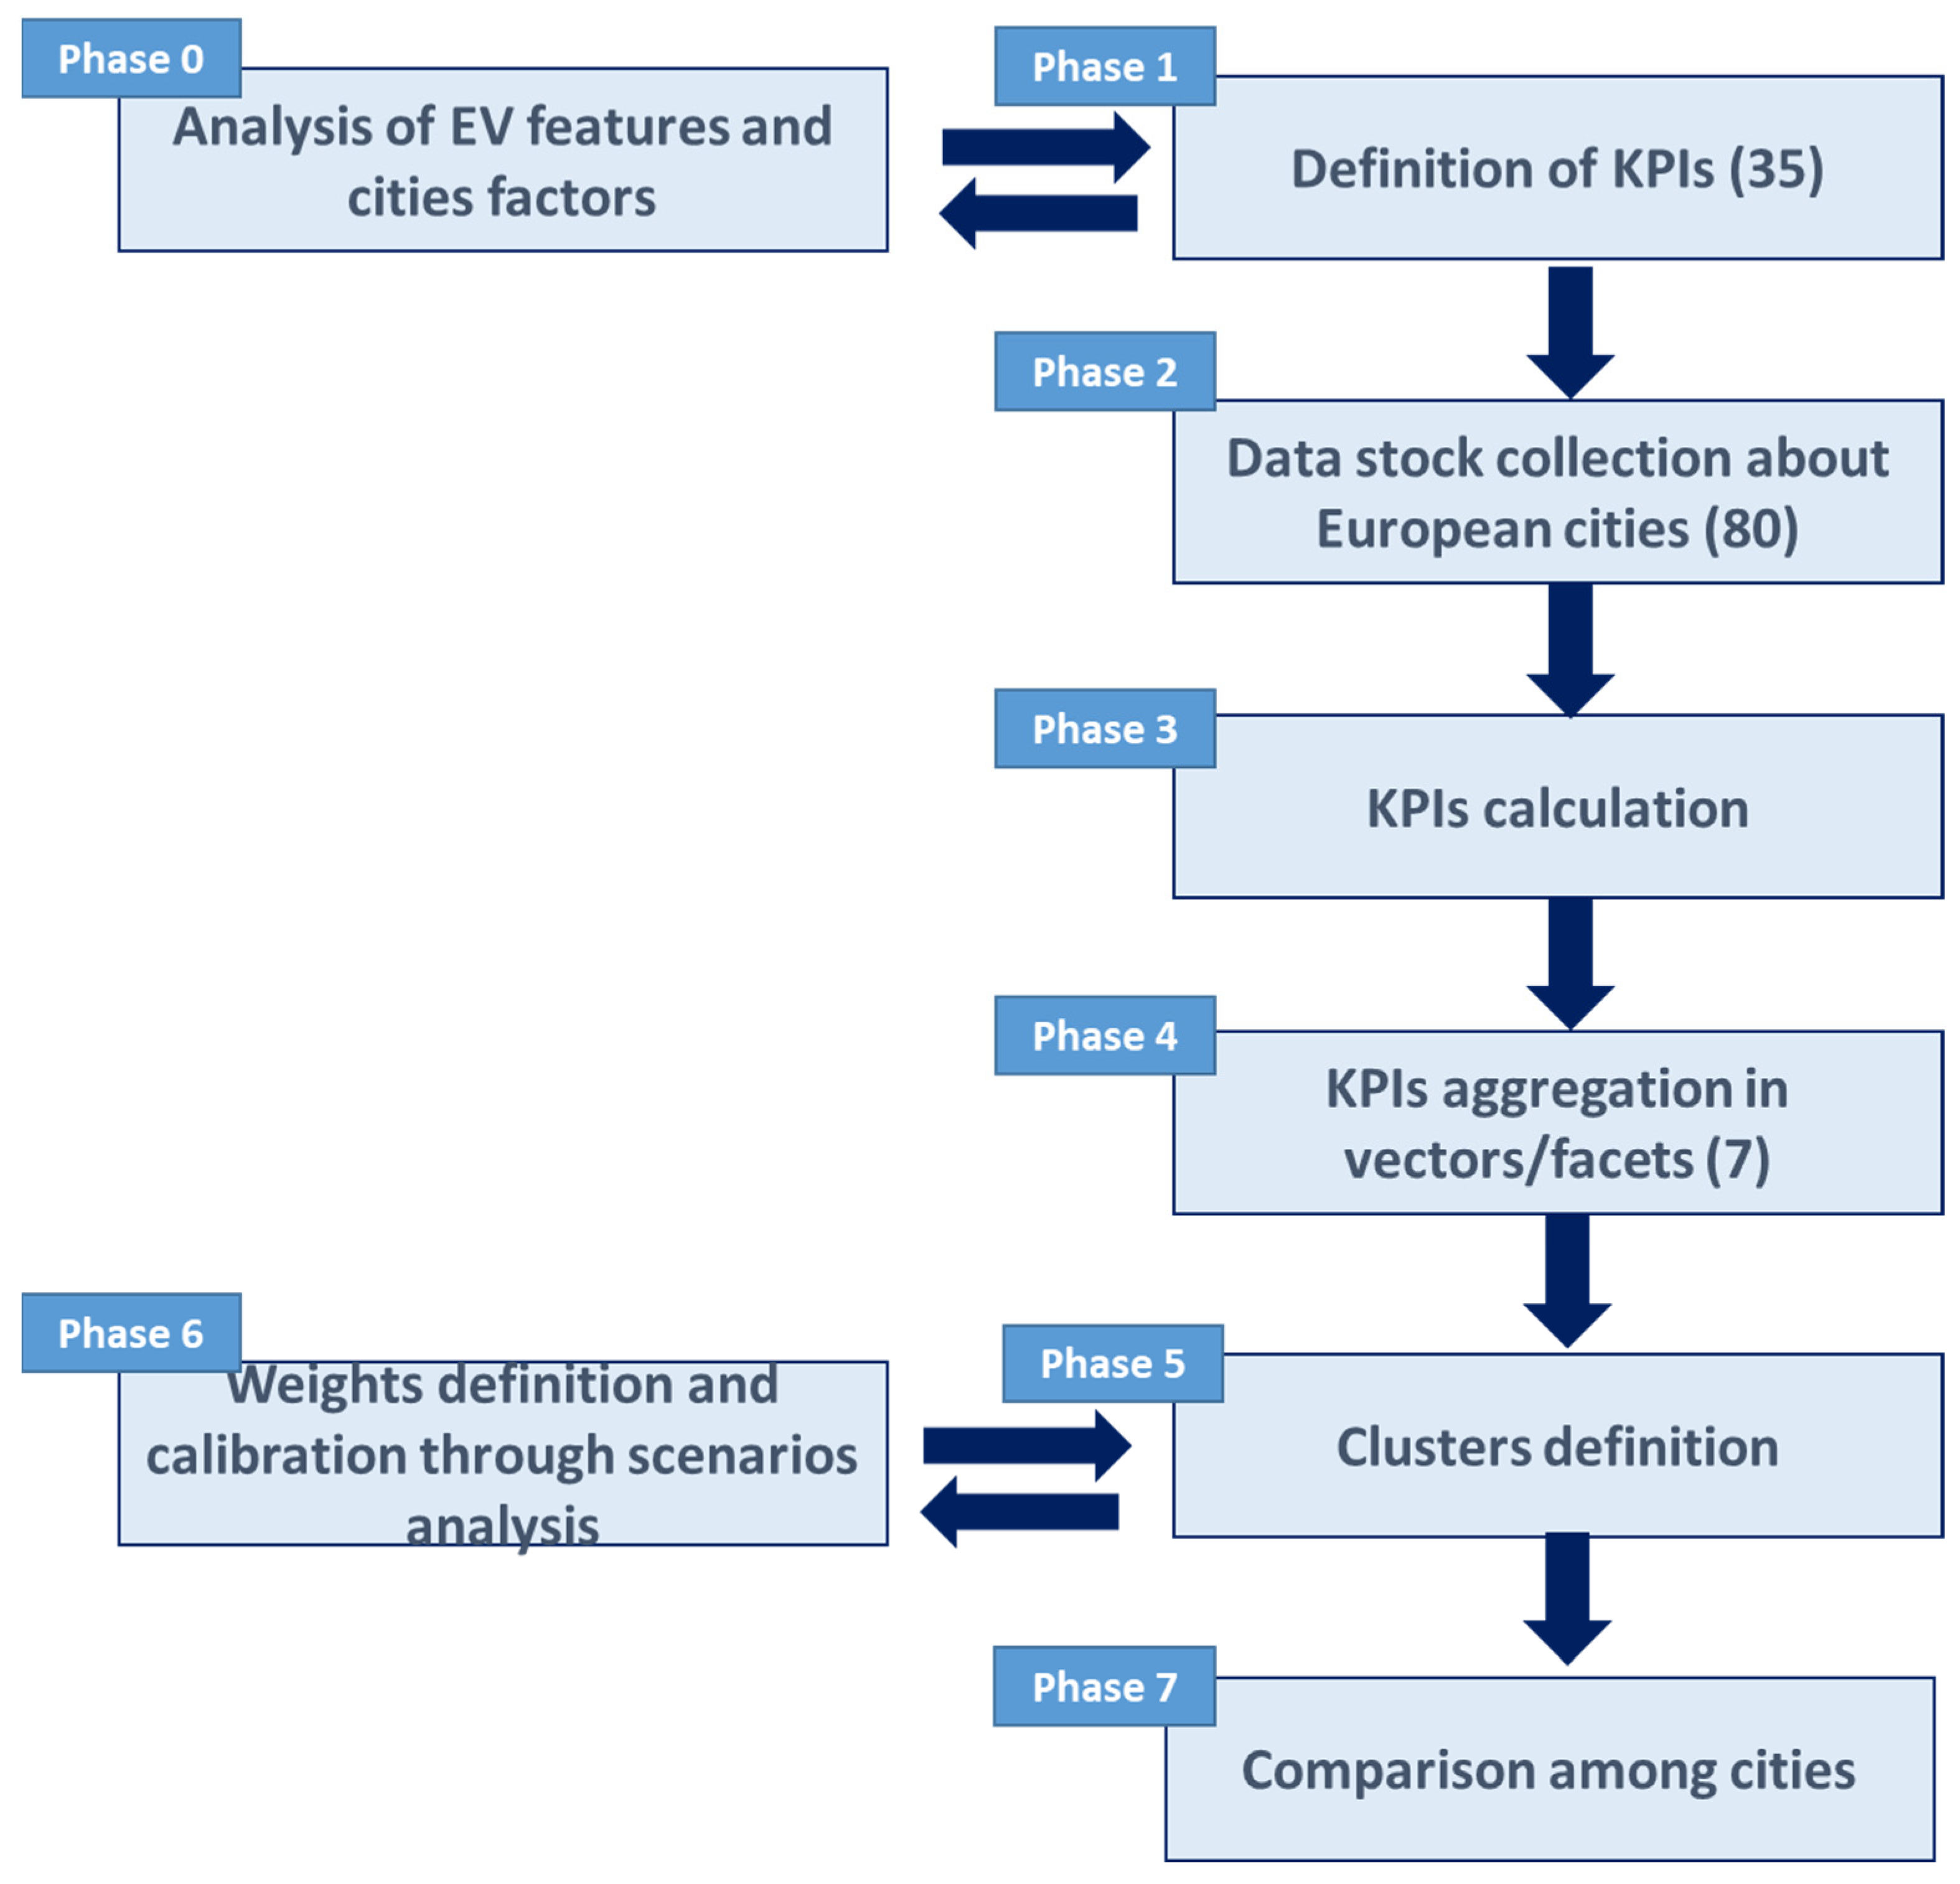
3. Methodology and Data Sources
3.1. City Parametrization Methodology
- Normalization # 1: This method is used when the higher the value, the better the result. In this case, the highest value is normalized to 100 and the rest are set proportionally. For example, in the percentage of renewable energies in the energy mix , Equation (1) is used to calculate this normalized KPI:
- Normalization # 2: This method is used when the lower the value, the better the result. In this case, the highest value is normalized to 0 and the rest are set proportionally. For example, in the country’s carbon intensity , the normalization calculation is given by:
- is the i-th vector;
- a, b, and c are the weights related to KPIs values for each city, respectively, and ; ; .
3.2. Selected Clustering Methodology
4. Results
5. Robustness of the Solution
6. Discussion
7. Conclusions
Author Contributions
Funding
Institutional Review Board Statement
Informed Consent Statement
Data Availability Statement
Acknowledgments
Conflicts of Interest
Abbreviations
| KPI | Key Performance Indicator |
| EV | Electric Vehicle |
| CO2 | Carbon Dioxide |
| GDP | Gross Domestic Product |
| DC and AC charging | Direct Current and Alternating Current charging |
| RMSE | Root Mean Square Error |
| INE | National Institute of Statistics of Spain |
| CBS | National Institute of Statistics of the Netherlands |
| UK | United Kingdom |
| EU | European Union |
| GHG | Greenhouse Gases |
| ICT | Information and Communication Technology |
| CPO | Charge Point Operator |
| EMP | E-Mobility Provider |
Appendix A. KPIs’ Formulas Summary

| Vector | KPI Identifier | KPI Name | Used Parameters per KPI | Formula | Units | Description |
|---|---|---|---|---|---|---|
| Civil and Social | C&S_KPI_01 | Habitants density | City population and area | city population/city area | Habitants/km2 | This KPI provides information about the city habitants density and can be related to parking availability at home for example |
| Civil and Social | C&S_KPI_02 | City GDP per capita | City GDP per capita | - | €/habitant | This KPI provides information about the differences in the cost of living and inflation rates on a city and can be related to the amount of EV in the city |
| Civil and Social | C&S_KPI_03 | Unemployment rate | Unemployment rate | - | % | This KPI provides information about the unemployed percentage of city inhabitants and can be related to the amount of EV in the city |
| Civil and Social | C&S_KPI_04 | City habitants average age | City habitants average age | - | years | This KPI provides information about the average age of city inhabitants and can be related to the predisposition to change and acquire a new technology such as an electric vehicle |
| Transport | T_KPI_01 | City vehicles for public and private use per inhabitant | Total amount of vehicles (car, bus, truck, …) in the city and total population | city vehicles/city population | Vehicles/Habitants | This KPI provides information about the city vehicles amount and the potential for EV |
| Transport | T_KPI_02 | City cars for public and private use per inhabitant | Total amount of cars in the city and total population | city cars/city population | City cars/Habitants | This KPI provides information about the city cars amount and the potential for EV |
| Transport | T_KPI_03 | Use of public transport | Total amount of cars in the city and total population | Average daily trips in public transport | Trips/day | This KPI provides information about the use of public transport in the city and can be related to the expansion possibilities of EVs |
| Transport | T_KPI_04 | Daily average trip distance (for cars) | Daily average trip distance (for cars) | Daily average trip distance (for cars) | km/day&car | This KPI provides information about the use of cars in the city and can be related to the expansion possibilities of EVs |
| EV census | EVC_KPI_01 | City EV for public and private use per inhabitant | Total amount of EV (car, bus, truck, …) in the city and total population | city EV/city population | EVs/Habitants | This KPI provides information about the city EV amount and the potential for EV |
| EV census | EVC_KPI_02 | City electric cars for public and private use per inhabitant | Total amount of electric cars in the city and total population | city electric cars/city population | City electric cars/Habitants | This KPI provides information about the city electric cars amount and the potential for EV |
| EV census | Proposed | Achieved EV % related to 2030 estimations | Total EV in 2020 Expected total EV in 2030 | (Total EV in the whole country in 2020/Expected total EV in 2030)*100 | % | This KPI provides information about how close the city is in 2020 to reach the expected levels in EV in 2030. |
| EV charging infrastructure | EVCI_KPI_01 | CS per inhabitant | Total amount of EV CSs the city and total population | EV CSs/city population | CSs/Habitant | This KPI provides information about the amount of charging stations related to the city population |
| EV charging infrastructure | EVCI_KPI_02 | CS per EV | Total amount of EV CSs the city and total EV amount | EV CSs/EV amount | CSs/EV | This KPI provides information about the amount of charging stations related to the city EV amount |
| EV charging infrastructure | EVCI_KPI_03 | CP per inhabitant | Total amount of EV CPs the city and total population | EV CPs/city population | CPs/Habitant | This KPI provides information about the amount of charging points related to the city population |
| EV charging infrastructure | EVCI_KPI_04 | CP per EV | Total amount of EV CPs the city and total EV amount | EV CPs/EV amount | CPs/EV | This KPI provides information about the amount of charging points related to the city EV amount |
| EV charging infrastructure | EVCI_KPI_05 | High power or DC CPs per VE | Total amount of EV high power DC CP and total EV amount | DC CPs/EV | CPs/EV | This KPI provides information about the amount of fast charging points related to the city EV amount |
| EV charging infrastructure | EVCI_KPI_06 | AC CPs per VE | Total amount of EV AC charging points and EV amount | AC CPs/EV | CPs/EV | This KPI provides information about the amount of AC charging points related to the city EV amount |
| EV charging infrastructure | EVCI_KPI_07 | CS vs city surface | Total amount of EV CSs in the city and city surface | EV CSs/city area | CSs/km2 | This KPI provides information about the distance to be travelled to find a CS |
| EV charging infrastructure | Proposed | Achieved CS% related to 2030 estimations | Number of CS in the whole country in 2020 Expected number of CS in the whole country in 2030 | (Number of CS in the whole country in 2020/Expected number of CS in the whole country in 2030)*100 | % | This KPI provides information about how close the city is in 2020 to reach the expected number of CS in 2030. |
| EV charging services economics | EVCSE_KPI_01 | Average electric energy price (home) | Average electric energy price (home) | Average electric energy price (home) | €/kWh | This KPI provides information about the energy costs for home use |
| EV charging services economics | EVCSE_KPI_02 | Average electric energy price (non-residential) | Average electric energy price (non-residential) | Average electric energy price (non-residential) | €/kWh | This KPI provides information about the energy costs for non-residential use |
| EV charging services economics | EVCSE_KPI_03 | Average price for charging at (semi)public charging station | Average price for charging at (semi)public charging station | Average price for charging at (semi)public charging station | €/kWh | This KPI provides information about the average charging cost an EV driver has to face in the city |
| EV charging services economics | EVCSE_KPI_04 | % savings per km | Average price per fuel (kwh or fuel) and average fuel consumption per 100kms | (Av price per km fuel vehicle/Av price per km EV)-1 | % | This KPI provides information about the average savings per km driving an EV |
| EV charging services economics | EVCSE_KPI_05 | % of electric vehicle overcharge | Average priece per EV and fuel vehicle | (EV price/Fuel Vehicle price)-1 | % | This KPI provides information about the average overcharge when buying an EV |
| EV charging services economics | Proposed | Distance to make the investment profitable (kms) | Average saving per km driving an EV and Average overcharge per EV | (EV price-Fuel Vehicle price)/(Av price per km fuel vehicle-Av price per km EV) | kms | This KPI provides information about the average distance in kms an EV has to drive to make the investment profitable |
| Smart charge/ICT system | SCIS_KPI_01 | Wired and wireless communication network coverage | Wired and wireless communication network coverage | % Wired and wireless communication network coverage area | % | This KPI provides information about the area (%) of the city covered by wireless and/or wired communications networks, needed for remote management of CS |
| Smart charge/ICT system | SCIS_KPI_02 | CPO/EMP control centre for monitoring and control of EV charging points | Wired and wireless communication network coverage | % Wired and wireless communication network coverage area | 0 or 1 | This KPI provides information about the possibilities of remote management/monitoring of EV CP in the city |
| Smart charge/ICT system | SCIS_KPI_03 | Time of use tariff | - | - | 0 or 1 | This KPI provides information about the existence of time of use tariffs in the city. ToU tariff can enable, night charge through lower prices and reducing EV charge grid impact through indirect demand management of the charger. |
| Smart charge/ICT system | SCIS_KPI_04 | Smart charging aimed at optimising grid stability and renewables use active? | - | - | 0 or 1 | This KPI provides information about the existence of regulations that promote the use of distributed RES in CS (or other consumption points). The integration of RES in CS is a good method to reduce EV charge grid impact |
| Environmental impact of the EV | EIEV_KPI_01 | Country carbon intensity | For every city characterised, Country carbon intensity | Country carbon intensity | tCO2-eq/MWh or gCO2-eq/kWh | This KPI provides information about the grid impact of the energy provided to EVs |
| Environmental impact of the EV | EIEV_KPI_02 | % of renewables in the energy mix of the country | For every city characterised, % of renewables in the energy mix of the country | % of renewables in the energy mix of the country | %-eq/kWh | This KPI provides information about the grid impact of the energy provided to EVs |
| Environmental impact of the EV | EIEV_KPI_03 | Air Quality | City emisions of PM2,5; PM10; O3; NO2 and SO2 | For each pollutant a number from 0 to 5 will be asigned depending on the quantity emitted, being 0 extremely poor air quality and 5 good air quality. The lowest number from all pollutants will be asigned as KPI. | From 0 to 5 | This KPI provides information about the air quality in the city. |
| Environmental impact of the EV | Proposed | % of CO2 Emission Reduction | Fuel Vehicle CO2 Emissions per km and EV CO2 Emissions per km | (Fuel Vehicle CO2 Emissions/EV CO2 Emissions)-1 | % | This KPI provides information about the % of reduccion in the CO2 emissions by driving an EV taking into consideration the carbon intensity of the country in the electricity generation. |
Appendix B. Data References and Gathering Process
Appendix B.1. Civil and Social Data
- Data for City Population. These data were used as a reference if city limits were not clear to identify them. Data from this source were not used, but instead we used data from the most reliable source and the nearest year we were able to find.
- Population (region Eurostat)
- ○
- For example: Berlin and Brussels have almost the same population in both references as the regions consist of almost the whole city exclusively. But for other cities, such as Zaragoza, the city population is 675,000 while the region, Aragón, has 1,330,300 habitants, and 973 km2 for Zaragoza while the whole region is 47,720 km2. As only city data are selected for the task, use the most reliable and similar data to the first reference, as they give data for the city and not the region.
- ○
- These examples show that in some cases data must be taken from the region, and in others from the city. In the case of Zaragoza/Aragon, it is necessary to look for specific data for Zaragoza (population and/or surface area) since the EUROSTAT population data are limited to the region.
- ○
- In the case of Berlin or Brussels, it is correct to take the region to calculate the KPIs and use the data available in EUROSTAT.
- For City Area (km2) it was not possible to find a data source with city area data for all the selected cities. City population data from the reference before were used as a guide to find city area if city limits were uncertain.
- Eurostat data for GDP, Unemployment and Average Age are provided by region (if city data can be found please use those, if not, use region data from EUROSTAT).
- ○
- GDP per capita (country)
- ○
- GDP (region)
- ○
- GDP per capita (region 2019)
- ○
- Unemployment (region)
- ○
- Data for City habitant’s average age
Appendix B.2. Transport and EV Census
- Average daily passengers transported in public transport: These data were one of the hardest to find. A lot of times the data were found in the annual total in the region. With those data and population in the region/city, it is possible to find the data needed, as done before with the EV in Madrid example.
Appendix B.3. Electric Vehicles Charging Infrastructure
- Four reference links are provided for this vector. If more reliable data were found in other sources, they were used, and these references were only used in the case of no reliable data being found. Depending on the city, the best data could be found on different pages. We used the higher data for the amount of city charging stations. Some references only show charging stations, not charging points, or how these are (fast charging in DC or slow charging in AC). If this happened, we used the same ratio shown on the other webpage.
- ○
- For example: If some page had 100 Charging Stations (CS) and 250 Charging Points (CP), we might see 300 CS on other pages but no data for CP available. The data used will be 300 CS and 300 CS*250 CP/100 CS to maintain the ratio and make the CP data as reliable and consistent as possible.
Appendix B.4. EV Charging Services Economics
- Average electric energy price (home) (€/kWh)
- Average electric energy price (non-residential) (€/kWh)
Appendix B.5. Smart Charge ICT System
- % Wired and wireless communication network coverage area. This represents the % of the city area that is covered by at least one communication network (wired or wireless). If the whole city is covered, the data should be 100%.
- CPO/EMP control centre for monitoring and control of EV charging points; time of use tariff and smart charging aimed at optimizing grid stability and renewables use active vectors will consist of “1” if there is at least one Monitoring Control Centre, Time Tariff or Smart Charging regulations that meets the proposed conditions. That is, if there is not one control centre for monitoring and control EV charging points “0” is selected, if there is at least one control centre “1” is selected.
Appendix B.6. Environmental Impact of the EV
- Country carbon intensity: These data referred to the electricity generation only. Data of the whole country were selected.
- % Of renewables in the energy mix of the country. Data from the whole country.
- Air Quality: If one city had more than one measurement for the average, we used the higher value of them all. If the data were segregated daily, we used the average data for the last year available.
References
- Zhang, Q.; Li, H.; Zhu, L.; Campana, P.E.; Lu, H.; Wallin, F.; Sun, Q. Factors influencing the economics of public charging infrastructures for EV—A review. Renew. Sustain. Energy Rev. 2018, 94, 500–509. [Google Scholar] [CrossRef]
- Serradilla, J.; Wardle, J.; Blythe, P.; Gibbon, J. An evidence-based approach for investment in rapid-charging infrastructure. Energy Policy 2017, 106, 514–524. [Google Scholar] [CrossRef]
- Helmus, J.R.; Lees, M.H.; Van Den Hoed, R. A data driven typology of electric vehicle user types and charging sessions. Transp. Res. Part C Emerg. Technol. 2020, 115, 102637. [Google Scholar] [CrossRef]
- Yang, Y.; Yao, E.; Yang, Z.; Zhang, R. Modeling the charging and route choice behavior of BEV drivers. Transp. Res. Part C Emerg. Technol. 2016, 65, 190–204. [Google Scholar] [CrossRef]
- Gönül, Ö.; Duman, A.C.; Güler, Ö. Electric vehicles and charging infrastructure in Turkey: An overview. Renew. Sustain. Energy Rev. 2021, 143, 110913. [Google Scholar] [CrossRef]
- Kontou, E.; Liu, C.; Xie, F.; Wu, X.; Lin, Z. Understanding the linkage between electric vehicle charging network coverage and charging opportunity using GPS travel data. Transp. Res. Part C Emerg. Technol. 2019, 98, 1–13. [Google Scholar] [CrossRef]
- Sachan, S.; Deb, S.; Singh, S.N. Different charging infrastructures along with smart charging strategies for electric vehicles. Sustain. Cities Soc. 2020, 60, 102238. [Google Scholar] [CrossRef]
- Morrissey, P.; Weldon, P.; O’Mahony, M. Future standard and fast charging infrastructure planning: An analysis of electric vehicle charging behaviour. Energy Policy 2016, 89, 257–270. [Google Scholar] [CrossRef]
- Orsi, F. On the sustainability of electric vehicles: What about their impacts on land use? Sustain. Cities Soc. 2021, 66, 102680. [Google Scholar] [CrossRef]
- Nelder, C.; Rogers, E. Reducing EV Charging Infrastructure Costs; Rocky Mountain Institute: Boulder, CO, USA, 2020. [Google Scholar] [CrossRef]
- Yang, M.; Zhang, L.; Dong, W. Economic Benefit Analysis of Charging Models Based on Differential Electric Vehicle Charging Infrastructure Subsidy Policy in China. Sustain. Cities Soc. 2020, 59, 102206. [Google Scholar] [CrossRef]
- Zhou, G.; Zhu, Z.; Luo, S. Location optimization of electric vehicle charging stations: Based on cost model and genetic algorithm. Energy 2022, 247, 123437. [Google Scholar] [CrossRef]
- Pardo-Bosch, F.; Pujadas, P.; Morton, C.; Cervera, C. Sustainable deployment of an electric vehicle public charging infra-structure network from a city business model perspective. Sustain. Cities Soc. 2021, 71, 102957. [Google Scholar] [CrossRef]
- Helmus, J.; Van Den Hoed, R. Key Performance Indicators of Charging infrastructure. World Electr. Veh. J. 2016, 8, 733–741. [Google Scholar] [CrossRef]
- Kang, J.; Kong, H.; Lin, Z.; Dang, A. Mapping the dynamics of electric vehicle charging demand within Beijing’s spatial structure. Sustain. Cities Soc. 2022, 76, 103507. [Google Scholar] [CrossRef]
- Lucas, A.; Prettico, G.; Flammini, M.G.; Kotsakis, E.; Fulli, G.; Masera, M. Indicator-Based Methodology for Assessing EV Charging Infrastructure Using Exploratory Data Analysis. Energies 2018, 11, 1869. [Google Scholar] [CrossRef]
- Schücking, M.; Jochem, P.; Fichtner, W.; Wollersheim, O.; Stella, K. Charging strategies for economic operations of electric vehicles in commercial applications. Transp. Res. Part D Transp. Environ. 2017, 51, 173–189. [Google Scholar] [CrossRef]
- Chen, W.; Lu, X.; Yan, H.; Du, X. Decision tree of indicator benchmark: A hybrid method for assessing cities’ performance through urban indicators and benchmark. Ecol. Indic. 2023, 154, 110804. [Google Scholar]
- Boyko, C.T.; Gaterell, M.R.; Barber, A.R.G.; Brown, J.; Bryson, J.R.; Butler, D.; Caputo, S.; Caserio, M.; Coles, R.; Cooper, R.; et al. Benchmarking sustainability in cities: The role of indicators and future scenarios. Glob. Environ. Change 2012, 22, 245–254. [Google Scholar] [CrossRef]
- Yigitcanlar, T.; Lönnqvist, A. Benchmarking knowledge-based urban development performance: Results from the international comparison of Helsinki. Cities 2013, 31, 357–369. [Google Scholar] [CrossRef]
- Kitchin, R.; Lauriault, T.P.; McArdle, G. Knowing and governing cities through urban indicators, city benchmarking and re-al-time dashboards. Reg. Stud. Reg. Sci. 2015, 2, 6–28. [Google Scholar] [CrossRef]
- Giles-Corti, B.; Lowe, M.; Arundel, J. Achieving the SDGs: Evaluating indicators to be used to benchmark and monitor progress towards creating healthy and sustainable cities. Health Policy 2020, 124, 581–590. [Google Scholar] [CrossRef] [PubMed]
- Lo-Iacono-Ferreira, V.G.; Garcia-Bernabeu, A.; Hilario-Caballero, A.; Torregrosa-López, J. Measuring urban sustainability performance through composite indicators for Spanish cities. J. Clean. Prod. 2022, 359, 131982. [Google Scholar] [CrossRef]
- Xydas, E.; Marmaras, C.; Cipcigan, L.M.; Jenkins, N.; Carroll, S.; Barker, M. A data-driven approach for characterising the charging demand of electric vehicles: A UK case study. Appl. Energy 2016, 162, 763–771. [Google Scholar] [CrossRef]
- Yang, L.; Zhang, Z.; Song, Y.; Hong, S.; Xu, R.; Zhao, Y.; Zhang, W.; Cui, B.; Yang, M.Y. Diffusion Models: A Comprehensive Survey of Methods and Applications. Assoc. Comput. Mach. 2023, 56, 1–39. [Google Scholar] [CrossRef]
- Shi, L.; Hao, Y.; Lv, S.; Cipcigan, L.; Liang, J. A comprehensive charging network planning scheme for promoting EV charging infrastructure considering the Chicken-Eggs dilemma. Res. Transp. Econ. 2021, 88, 100837. [Google Scholar] [CrossRef]
- He, S.Y.; Kuo, Y.-H.; Sun, K.K. The spatial planning of public electric vehicle charging infrastructure in a high-density city using a contextualised location-allocation model. Transp. Res. Part A Policy Pract. 2022, 160, 21–44. [Google Scholar] [CrossRef]
- Chandra, M. Investigating the impact of policies, socio-demography and national commitments on electric-vehicle demand: Cross-country study. J. Transp. Geogr. 2022, 103, 103410. [Google Scholar] [CrossRef]
- Pemberton, S.; Nobajas, A.; Waller, R. Rapid charging provision, multiplicity and battery electric vehicle (BEV) mobility in the UK. J. Transp. Geogr. 2021, 95, 103137. [Google Scholar] [CrossRef]
- Goel, P.; Kumar, A.; Parayitam, S.; Luthra, S. Understanding transport users’ preferences for adopting electric vehicle based mobility for sustainable city: A moderated moderated-mediation model. J. Transp. Geogr. 2023, 106, 103520. [Google Scholar] [CrossRef]
- Vance, F. Clustering and the Continuous k-Means Algorithm. Los Alamos Sci. 1994, 22, 67. [Google Scholar]
- Wu, B. K-means clustering algorithm and Python implementation. In Proceedings of the 2021 IEEE International Conference on Computer Science, Artificial Intelligence and Electronic Engineering (CSAIEE), Virtual, 20–22 August 2021; IEEE: Myrtle Beach, SC, USA, 2021; pp. 55–59. [Google Scholar]
- Scikit-Learn: Machine Learning in Python—Scikit-Learn 1.2.0 Documentation. Available online: https://scikit-learn.org/stable/ (accessed on 17 January 2023).
- Cui, M. Introduction to the K-Means Clustering Algorithm Based on the Elbow Method. Account. Audit. Financ. 2020, 1, 5–8. [Google Scholar]
- Rousseeuw, P.J. Silhouettes: A graphical aid to the interpretation and validation of cluster analysis. J. Comput. Appl. Math. 1987, 20, 53–65. [Google Scholar] [CrossRef]


| Vector | Description | Reasons for the Vector Selection/Impact on EV Diffusion |
|---|---|---|
| 1. Civil and Social | Human aspects, including the quality of life and other social aspects. | Higher income and quality of life are usually associated with higher EV penetration. |
| 2. Transport | Transport and mobility features, including the use of public transport and total fleet dimension. | Low use of public transport encourages private mobility, including EV. |
| 3. Electric vehicles census | Number of electric vehicles by public and private use. | Monitoring the current state of EV diffusion. |
| 4. Electric vehicle charging infrastructure | EV charging infrastructure, including the number of charging stations by power. | Higher levels of charging infrastructure can support EV implementation. |
| 5. Electric vehicle charging services economics | EV charging prices, for residential and not, including fast charging. | Cost comparison for EVs and traditional vehicles. |
| 6. Smart Charge/ICT system | Smart charge services and ICT systems, including wired and wireless communications, control and monitoring of EV charging points. | Smarter charging technologies can promote energy optimization and grid stability. |
| 7. Environmental impact | Use of renewable energies, air quality in cities. | A direct measure of the GHG emission reduction. |
| Vectors | KPIs | KPIs’ Weights |
|---|---|---|
| 1. Civil and Social | Habitants density | 0.375 |
| City GDP per capita | 0.225 | |
| Unemployment rate | 0.2 | |
| City habitants average age | 0.2 | |
| 2. Transport | City vehicles for public and private use per inhabitant | 0.3 |
| City cars for public and private use per inhabitant | 0.3 | |
| Use of public transport | 0.2 | |
| Daily average trip distance (for cars) | 0.2 | |
| 3. Electric vehicles census | City EV for public and private use per inhabitant (EVs/Habitants) | 0.3333 |
| City electric cars for public and private use per inhabitant (City electric cars/Habitants) | 0.3333 | |
| Achieved number of EV related to 2030 estimations | 0.3333 | |
| 4. Electric vehicle charging services economics | Average electric energy price (home) | 0.2 |
| Average electric energy price (non-residential) | 0.2 | |
| Average price for charging at (semi)public charging station | 0.2 | |
| % savings per km | 0.2 | |
| % of vehicle overcharge | 0.2 | |
| 5. Electric vehicle charging infrastructure | CS per EV | 0.15 |
| CP per EV | 0.225 | |
| High power or DC CPs per EV | 0.225 | |
| AC CPs per EV | 0.15 | |
| CS vs city surface | 0.1 | |
| Achieved CS% related to 2030 estimations | 0.15 | |
| 6. Smart Charge/ICT system | Wired and wireless communication network coverage | 0.3 |
| CPO/EMP control centre for monitoring and control of EV charging points | 0.1 | |
| Time of use tariff | 0.3 | |
| Smart charging aimed at optimising grid stability and renewables use active? | 0.3 | |
| 7. Environmental impact | Country carbon intensity | 0.25 |
| % of renewables in the energy mix of the country | 0.25 | |
| Air Quality | 0.25 | |
| % of CO2 emission reduction | 0.25 |
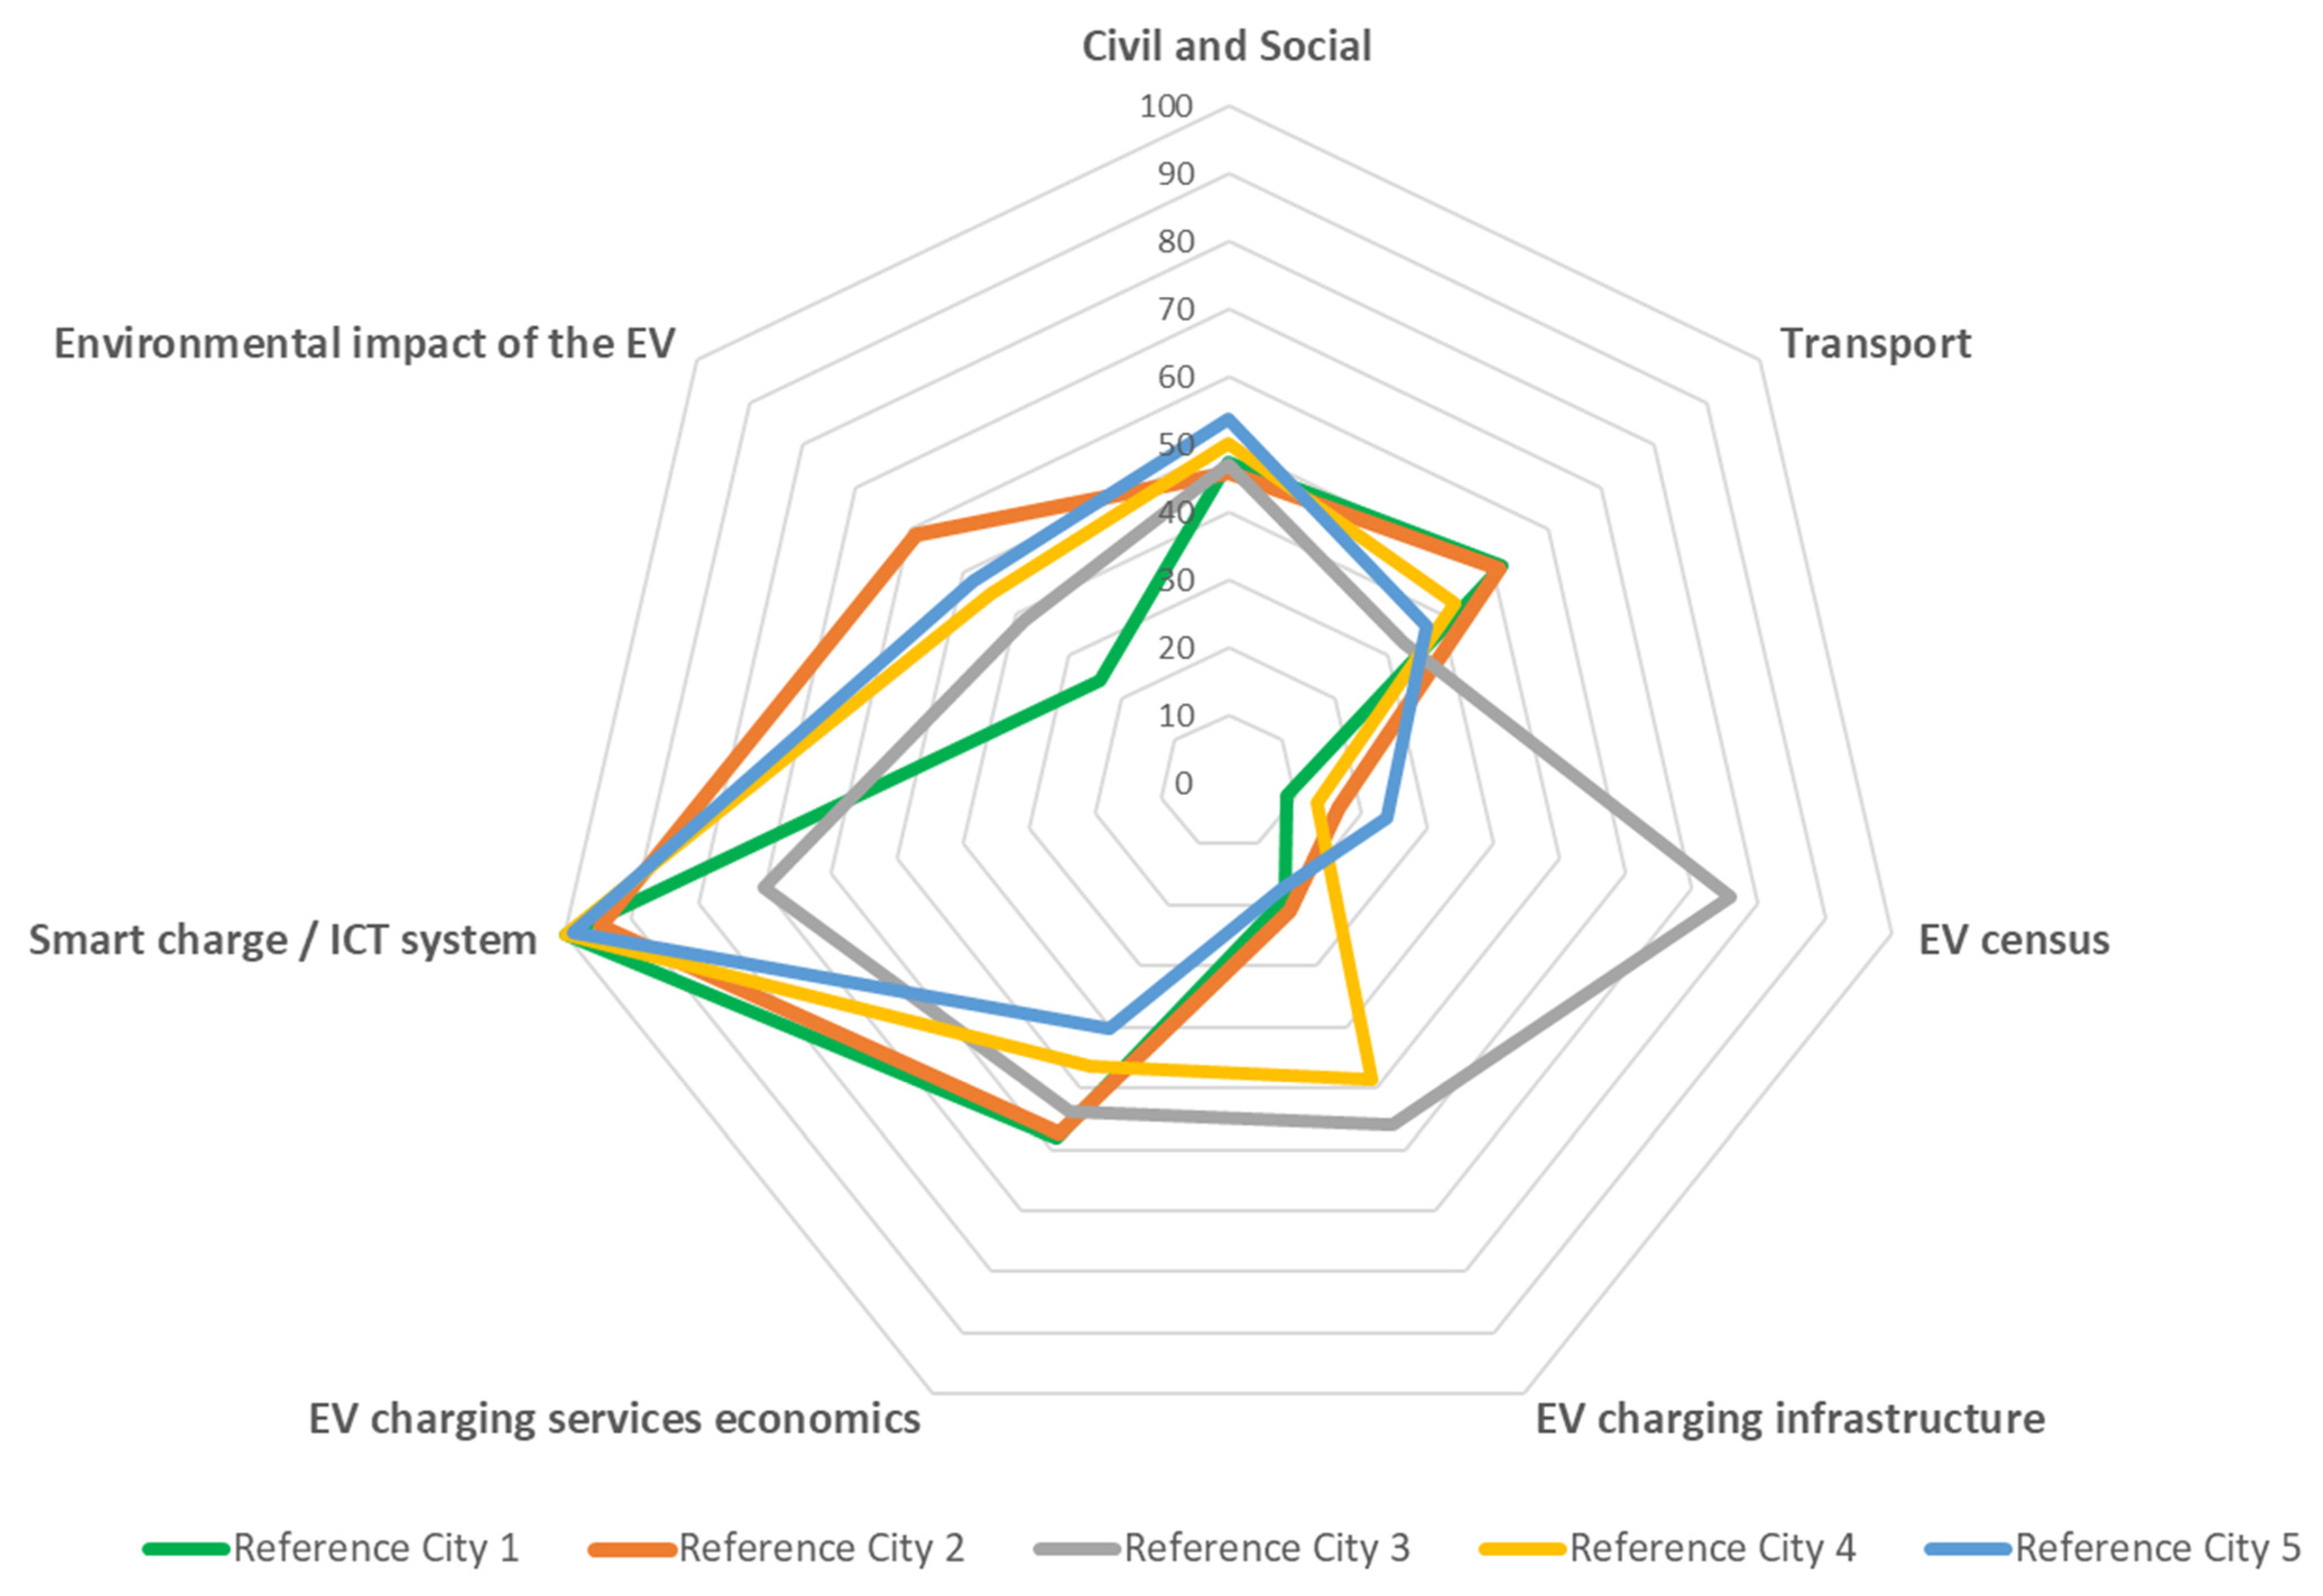
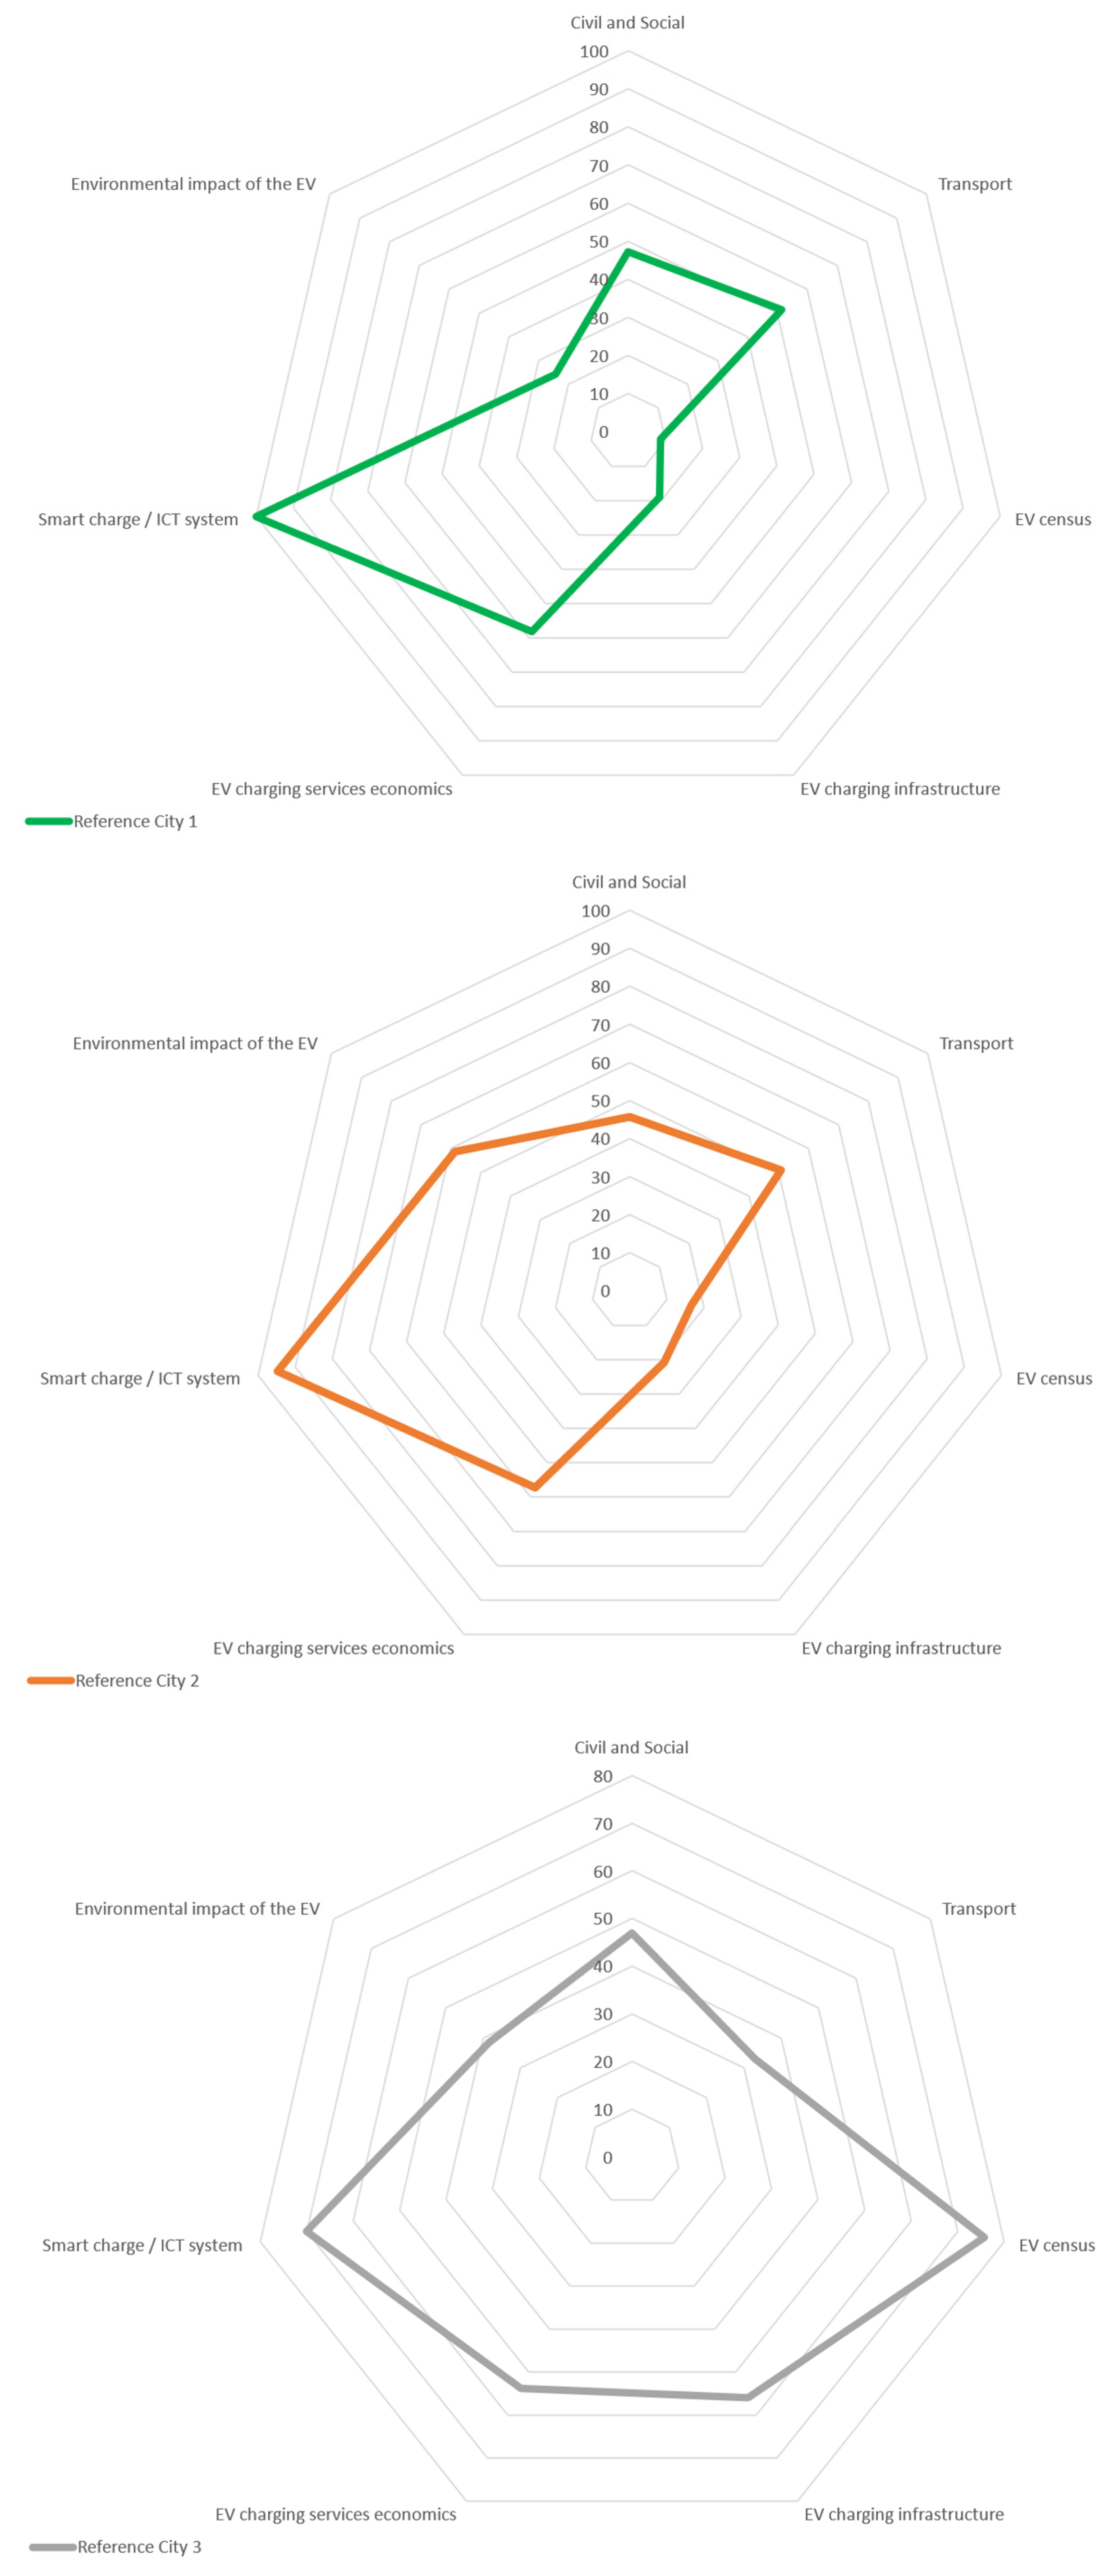
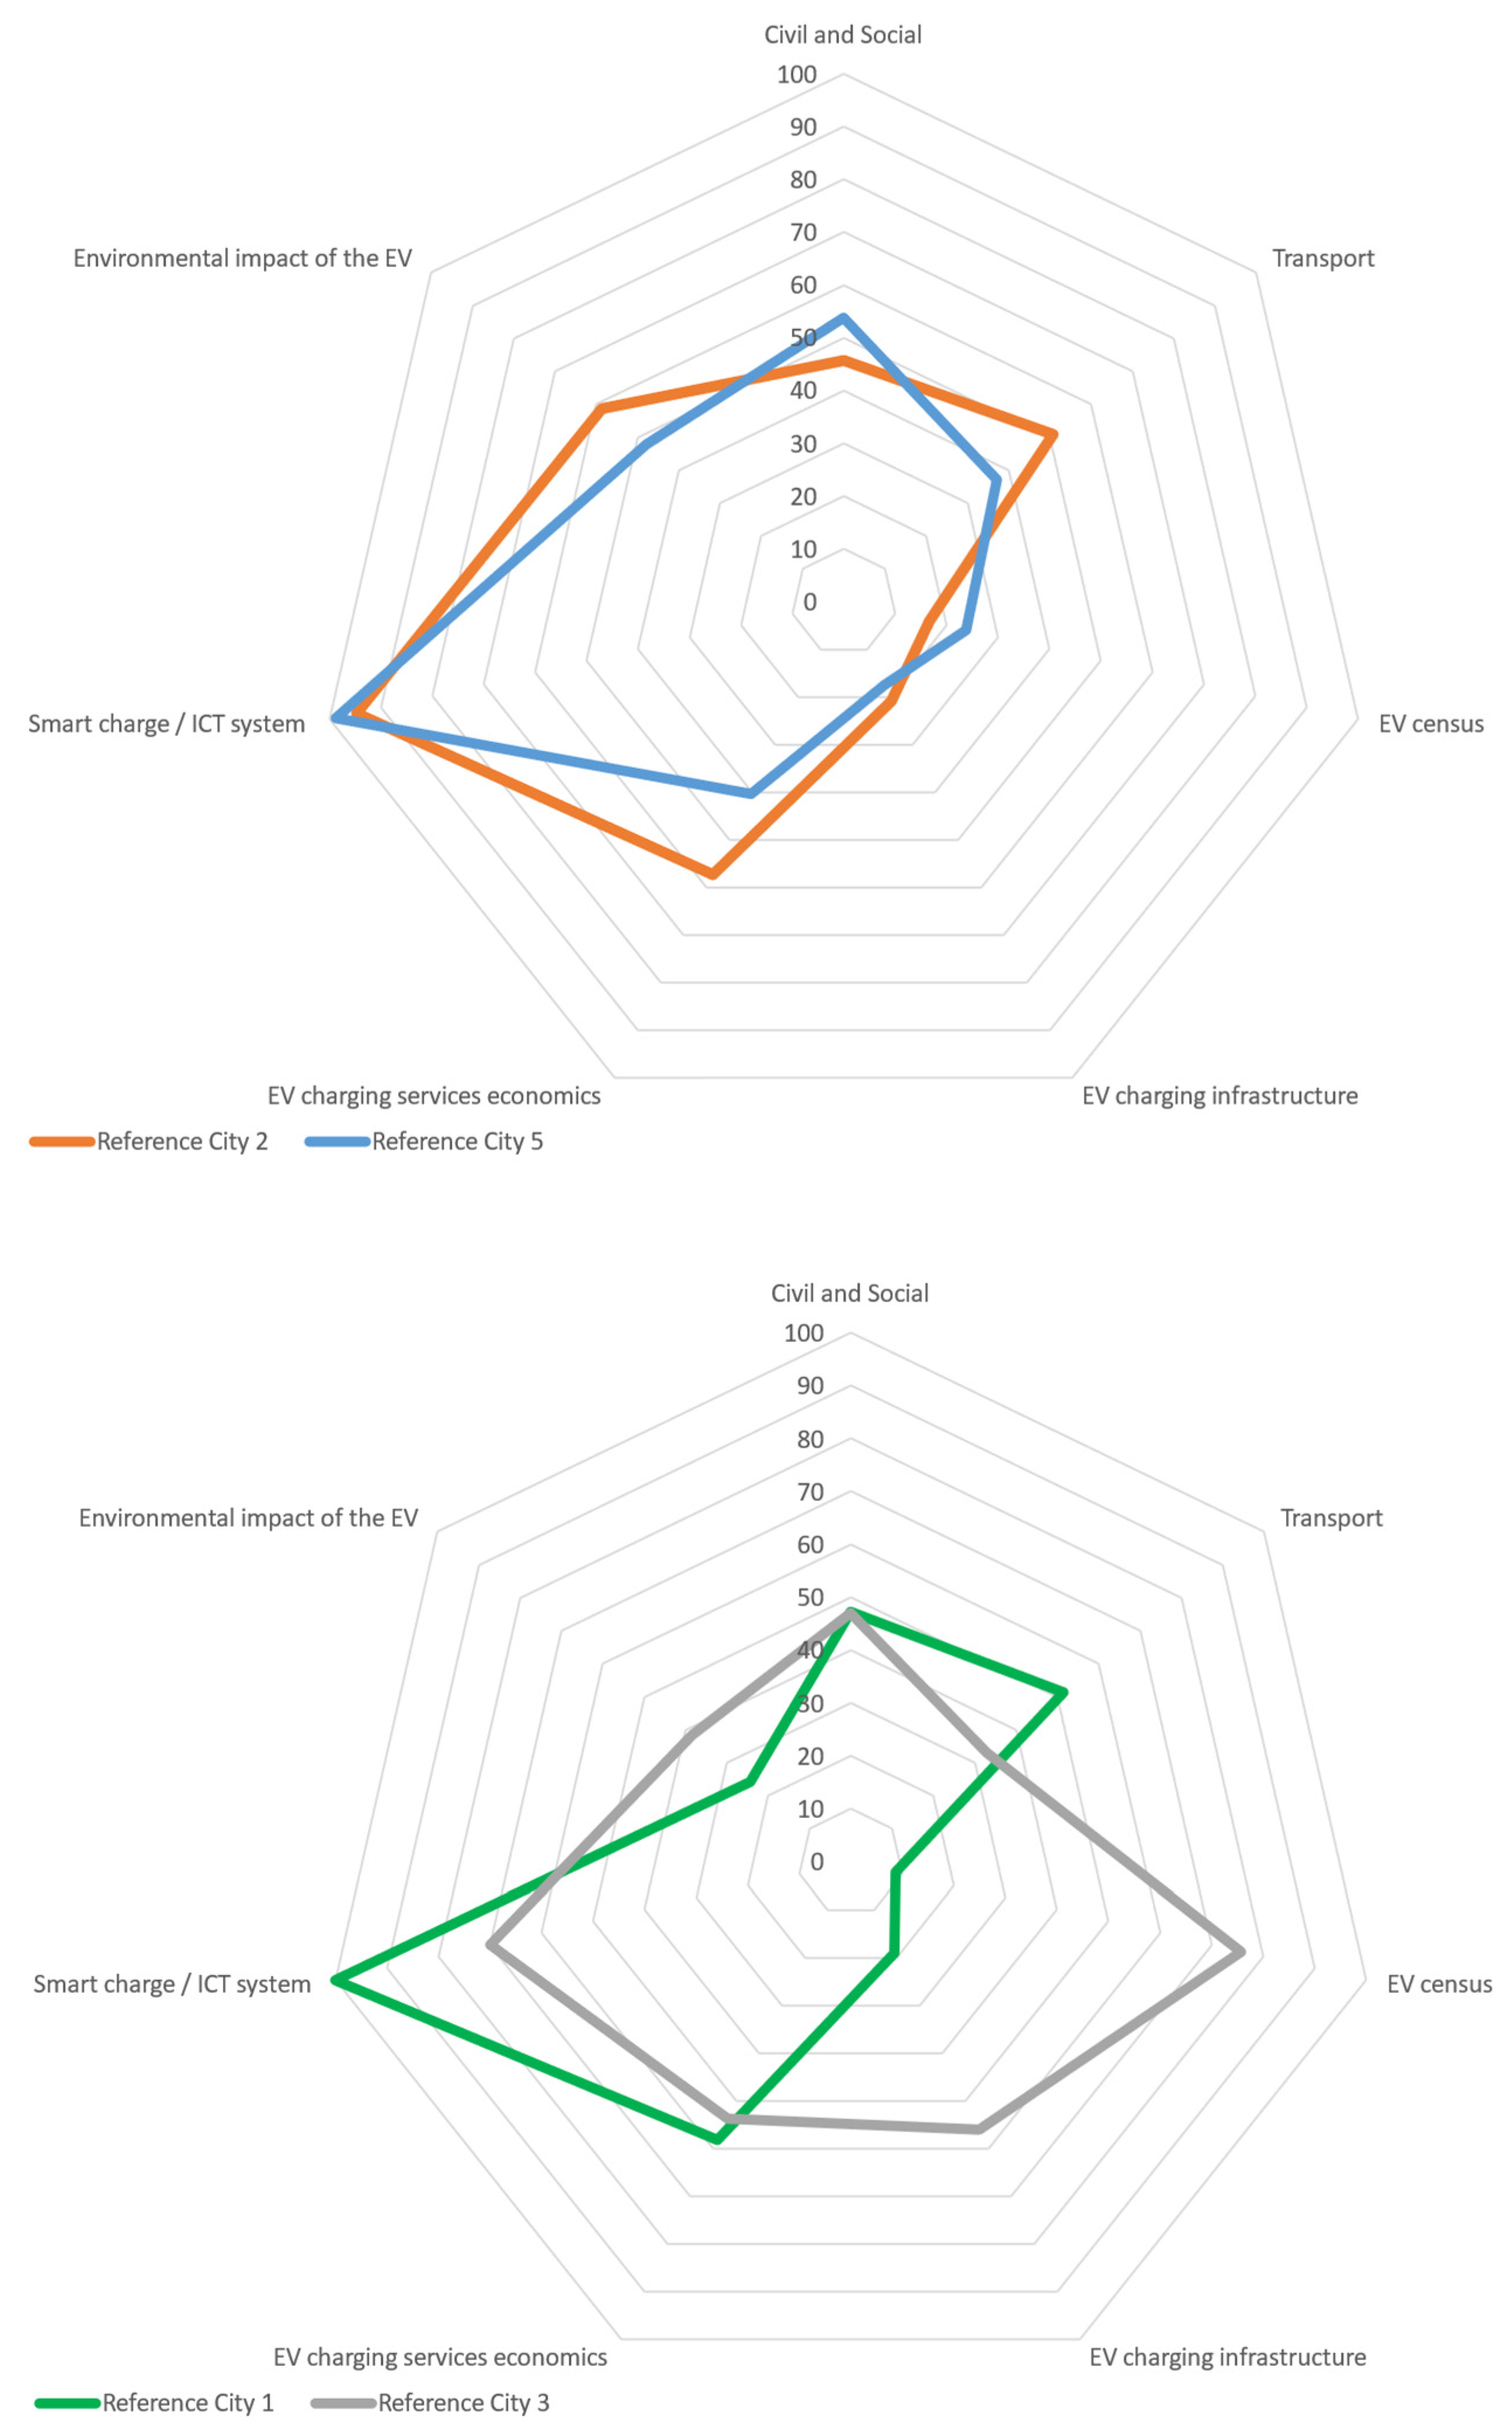
| City | No. of Cities Included | Civil and Social | Transport | EV Census | EV Charging Infrastructure | EV Charging Services Economics | Smart Charge/ICT System | Environmental Impact of the EV | Label |
|---|---|---|---|---|---|---|---|---|---|
| Reference City 1 | 18 | 47.25 | 51.46 | 8.73 | 18.98 | 58.15 | 100 | 24.27 | Low EV fleet and high environmental impact |
| Reference City 2 | 24 | 45.75 | 50.83 | 16.6 | 20.91 | 57.31 | 94.75 | 58.61 | Balanced case with low environmental impact |
| Reference City 3 | 4 | 46.94 | 32.94 | 75.72 | 55.98 | 53.78 | 70 | 38.41 | High EV fleet and good charging infrastructure quality |
| Reference City 4 | 8 | 50.06 | 42.44 | 13.24 | 48.5 | 46.49 | 100 | 44.60 | Low EV fleet but good charging infrastructure quality |
| Reference City 5 | 26 | 53.76 | 37.18 | 23.81 | 17.59 | 40.38 | 98.85 | 47.77 | Balanced case with high charging prices and higher EV fleet |
| Scenarios | Weights | |||
|---|---|---|---|---|
| Habitants’ Density | City GDP per Capita | Unemployment Rate | City Habitants Average Age | |
| Original | 0.375 | 0.225 | 0.2 | 0.2 |
| Scenario 1 | 0.7 | 0.1 | 0.1 | 0.1 |
| Scenario 2 | 0.1 | 0.7 | 0.1 | 0.1 |
| Scenario 3 | 0.1 | 0.1 | 0.7 | 0.1 |
| Scenario 4 | 0.1 | 0.1 | 0.1 | 0.7 |
| # of Scenarios | Feature |
|---|---|
| 7 | Highest RMSE value (one from each vector) |
| 7 | Lowest RMSE value (one from each vector) |
| 1 | Combination of the 7 highest RMSE scenarios |
| 1 | Combination of the 7 lowest RMSE scenarios |
| all | Fewer than 21 changes between clusters |
| 6 | More than 10 changes between clusters |
| 4 | Fewer than 5 changes between clusters |
Disclaimer/Publisher’s Note: The statements, opinions and data contained in all publications are solely those of the individual author(s) and contributor(s) and not of MDPI and/or the editor(s). MDPI and/or the editor(s) disclaim responsibility for any injury to people or property resulting from any ideas, methods, instructions or products referred to in the content. |
© 2025 by the authors. Licensee MDPI, Basel, Switzerland. This article is an open access article distributed under the terms and conditions of the Creative Commons Attribution (CC BY) license (https://creativecommons.org/licenses/by/4.0/).
Share and Cite
Menendez Agudin, A.; Caballini, C.; Deflorio, F.P.; Fernandez Aznar, G.; Herman, L.; Knez, K. Towards Sustainable Cities: A KPI-Based Method to Compare Cities’ Performance and Encourage the Spread of Electric Cars. Sustainability 2025, 17, 3052. https://doi.org/10.3390/su17073052
Menendez Agudin A, Caballini C, Deflorio FP, Fernandez Aznar G, Herman L, Knez K. Towards Sustainable Cities: A KPI-Based Method to Compare Cities’ Performance and Encourage the Spread of Electric Cars. Sustainability. 2025; 17(7):3052. https://doi.org/10.3390/su17073052
Chicago/Turabian StyleMenendez Agudin, Alvaro, Claudia Caballini, Francesco Paolo Deflorio, Gregorio Fernandez Aznar, Leopold Herman, and Klemen Knez. 2025. "Towards Sustainable Cities: A KPI-Based Method to Compare Cities’ Performance and Encourage the Spread of Electric Cars" Sustainability 17, no. 7: 3052. https://doi.org/10.3390/su17073052
APA StyleMenendez Agudin, A., Caballini, C., Deflorio, F. P., Fernandez Aznar, G., Herman, L., & Knez, K. (2025). Towards Sustainable Cities: A KPI-Based Method to Compare Cities’ Performance and Encourage the Spread of Electric Cars. Sustainability, 17(7), 3052. https://doi.org/10.3390/su17073052