Article

Quantification of GHG Emissions Using Different Methodologies in Tropical Conventional Cashew Cultivation

by
Jonnathan Richeds da Silva Sales
1,2,
Viviane da Silva Barros
3,
Claudivan Feitosa de Lacerda
1,
Maria Cléa Brito de Figueirêdo
4,
Antonio Fabio da Silva Lima
5 and
Adriana Correa-Guimaraes
2,*
1
Department of Agricultural Engineering, Federal University of Ceará, Fortaleza 60020-181, Brazil
2
Department of Agricultural and Forestry Engineering, University of Valladolid, 34004 Palencia, Spain
3
Embrapa Environment, Jaguariúna 13918-110, Brazil
4
Embrapa Tropical Agroindustry, Fortaleza 60511-110, Brazil
5
Department of Plant Science, Federal University of Ceará, Fortaleza 60020-181, Brazil
*
Author to whom correspondence should be addressed.
Sustainability 2025, 17(7), 3042; https://doi.org/10.3390/su17073042
Submission received: 27 February 2025 / Revised: 23 March 2025 / Accepted: 25 March 2025 / Published: 29 March 2025

Abstract

Quantifying GHG emissions from cashew cultivation, especially in Brazil, is essential to assess the environmental impact and promote the sustainable development of this activity. The objective of this study is to evaluate and compare methods for quantifying GHG emissions based on empirical equations for life cycle inventories, using the conventional cashew production system in Brazil as a case study. The scope of the study encompasses, from gate to gate in a dwarf cashew production system, considering the production of one ton of cashew as a functional unit. GHG emissions were assessed and compared using the following methodologies: Nemecek-Calc, WFLDB, IPCC-Calc, BR-Calc, and Agri-footprint. The environmental assessment followed ISO standards (14040, 14044, and 14067). The results showed that the carbon footprint varied among the evaluated methodologies, with a difference of 24.5% between the highest value (129.5 kg CO2 eq-IPCC-Calc and BR-Calc) and the lowest (104 kg CO2 eq-Nemecek-Calc) per ton of cashew. N2O was the main contributor to emissions, accounting for up to 75.9%, while CO2 represented up to 25.8%. Based on the analysis criteria, WFLDB, IPCC-Calc, and BR-Calc are the most recommended methodologies, balancing clarity, scientific robustness, and regional adaptation. The choice of methodology is fundamental, as it directly influences the results and interpretation of the carbon footprint in cashew farming, impacting the sustainability of this agricultural activity.

1. Introduction

Given climate change and attention to environmental issues observed in recent years, international food supply chains are increasingly focused on sustainability and reducing environmental impact. In this context, calculating greenhouse gas (GHG) emissions in agricultural production systems and determining possible mitigation points for these gases is paramount [1].
Therefore, there is a need to mitigate the environmental impact of products and make food production more sustainable [2]. Studies on the environmental footprints of agricultural products have become essential tools to assess and improve the efficiency of these chains, as they encompass important environmental impact indicators such as the carbon footprint (CF) [3].
The reduction of CF is attributed to agriculture, which facilitates reaching internationally established targets to combat climate change by reducing GHG emissions, especially when these studies follow international standards established by the International Standard Organization (ISO), the Intergovernmental Panel on Climate Change (IPCC) and sustainable development goals (SDGs).
Several methodologies have been developed and can be used to calculate GHG emissions related to agricultural production chains. Life cycle assessment (LCA) studies focused on CF cover impact categories of global interest, such as climate change [4,5].
LCA is a methodology used to investigate the potential environmental impacts of producing a product or service according to ISO 14040, 14044 [6,7]. ISO 14067 [8] details the methodological procedures for conducting CF studies. These studies allow identifying the origin of a product’s main impacts, thus enabling the development of agricultural activities with greater environmental sustainability.
Thus, it is essential to use methodologies for quantifying direct GHG emissions from agricultural production. To improve the efficiency of calculating the emissions mentioned above and consequently, the evaluation of the CF of agricultural products, operational tools based on different methodological procedures, and/or characterization models are being developed worldwide.
Recently, in Brazil, Embrapa Environment released ICVCalc, a tool designed for building agricultural inventories for LCA studies [9]. This tool consists of a set of spreadsheets that estimate emissions using various methodological protocols, thereby generating comprehensive process inventories. The methodologies used are internationally recognized, such as Nemecek-Calc [10], World Food LCA Database (WFLDB) [11], IPCC-Calc [12], BR-Calc [9], and Agri-footprint [13].
Thus, the BR-Calc methodology is an initiative aimed at addressing the need to develop tools that use characterization factors adapted to the reality of tropical climate countries, enabling more accurate estimates of GHG emissions under these conditions. Comparison with international methods can help identify areas for improvement in BR-Calc, such as incorporating best practices from other methodologies or adjusting to better reflect Brazilian conditions. Since concerns about climate change and sustainability are global, emission estimation methodologies must be internationally comparable.
However, studies evaluating and comparing the estimation of GHG emissions and the impact on the CF of agricultural products are incipient in the literature, especially when it comes to studies conducted for tropical climate regions and crops, such as Brazil and the cashew crop.
Additionally, while various methodologies are available, few studies provide a systematic comparison of their applicability to tropical conditions [14]. As a result, there is still a limited understanding of how different empirical equation-based methods perform in estimating GHG emissions for cashew production in Brazil, considering regional data availability, scientific robustness, and methodological transparency. This gap in the literature justifies the need for a comprehensive assessment of different GHG quantification methods applied to cashew production, ensuring that the chosen approach accurately represents the environmental impacts in this specific context.
The novelty of this manuscript lies in its focus on providing a comprehensive comparison of different methodologies for GHG emissions estimation, specifically applied to a tropical agricultural system. By considering regionally adapted approaches and a crop that has great economic importance in Brazil, this study fills a crucial gap in the literature, offering insights that are directly relevant to decision-making for sustainable agricultural practices.
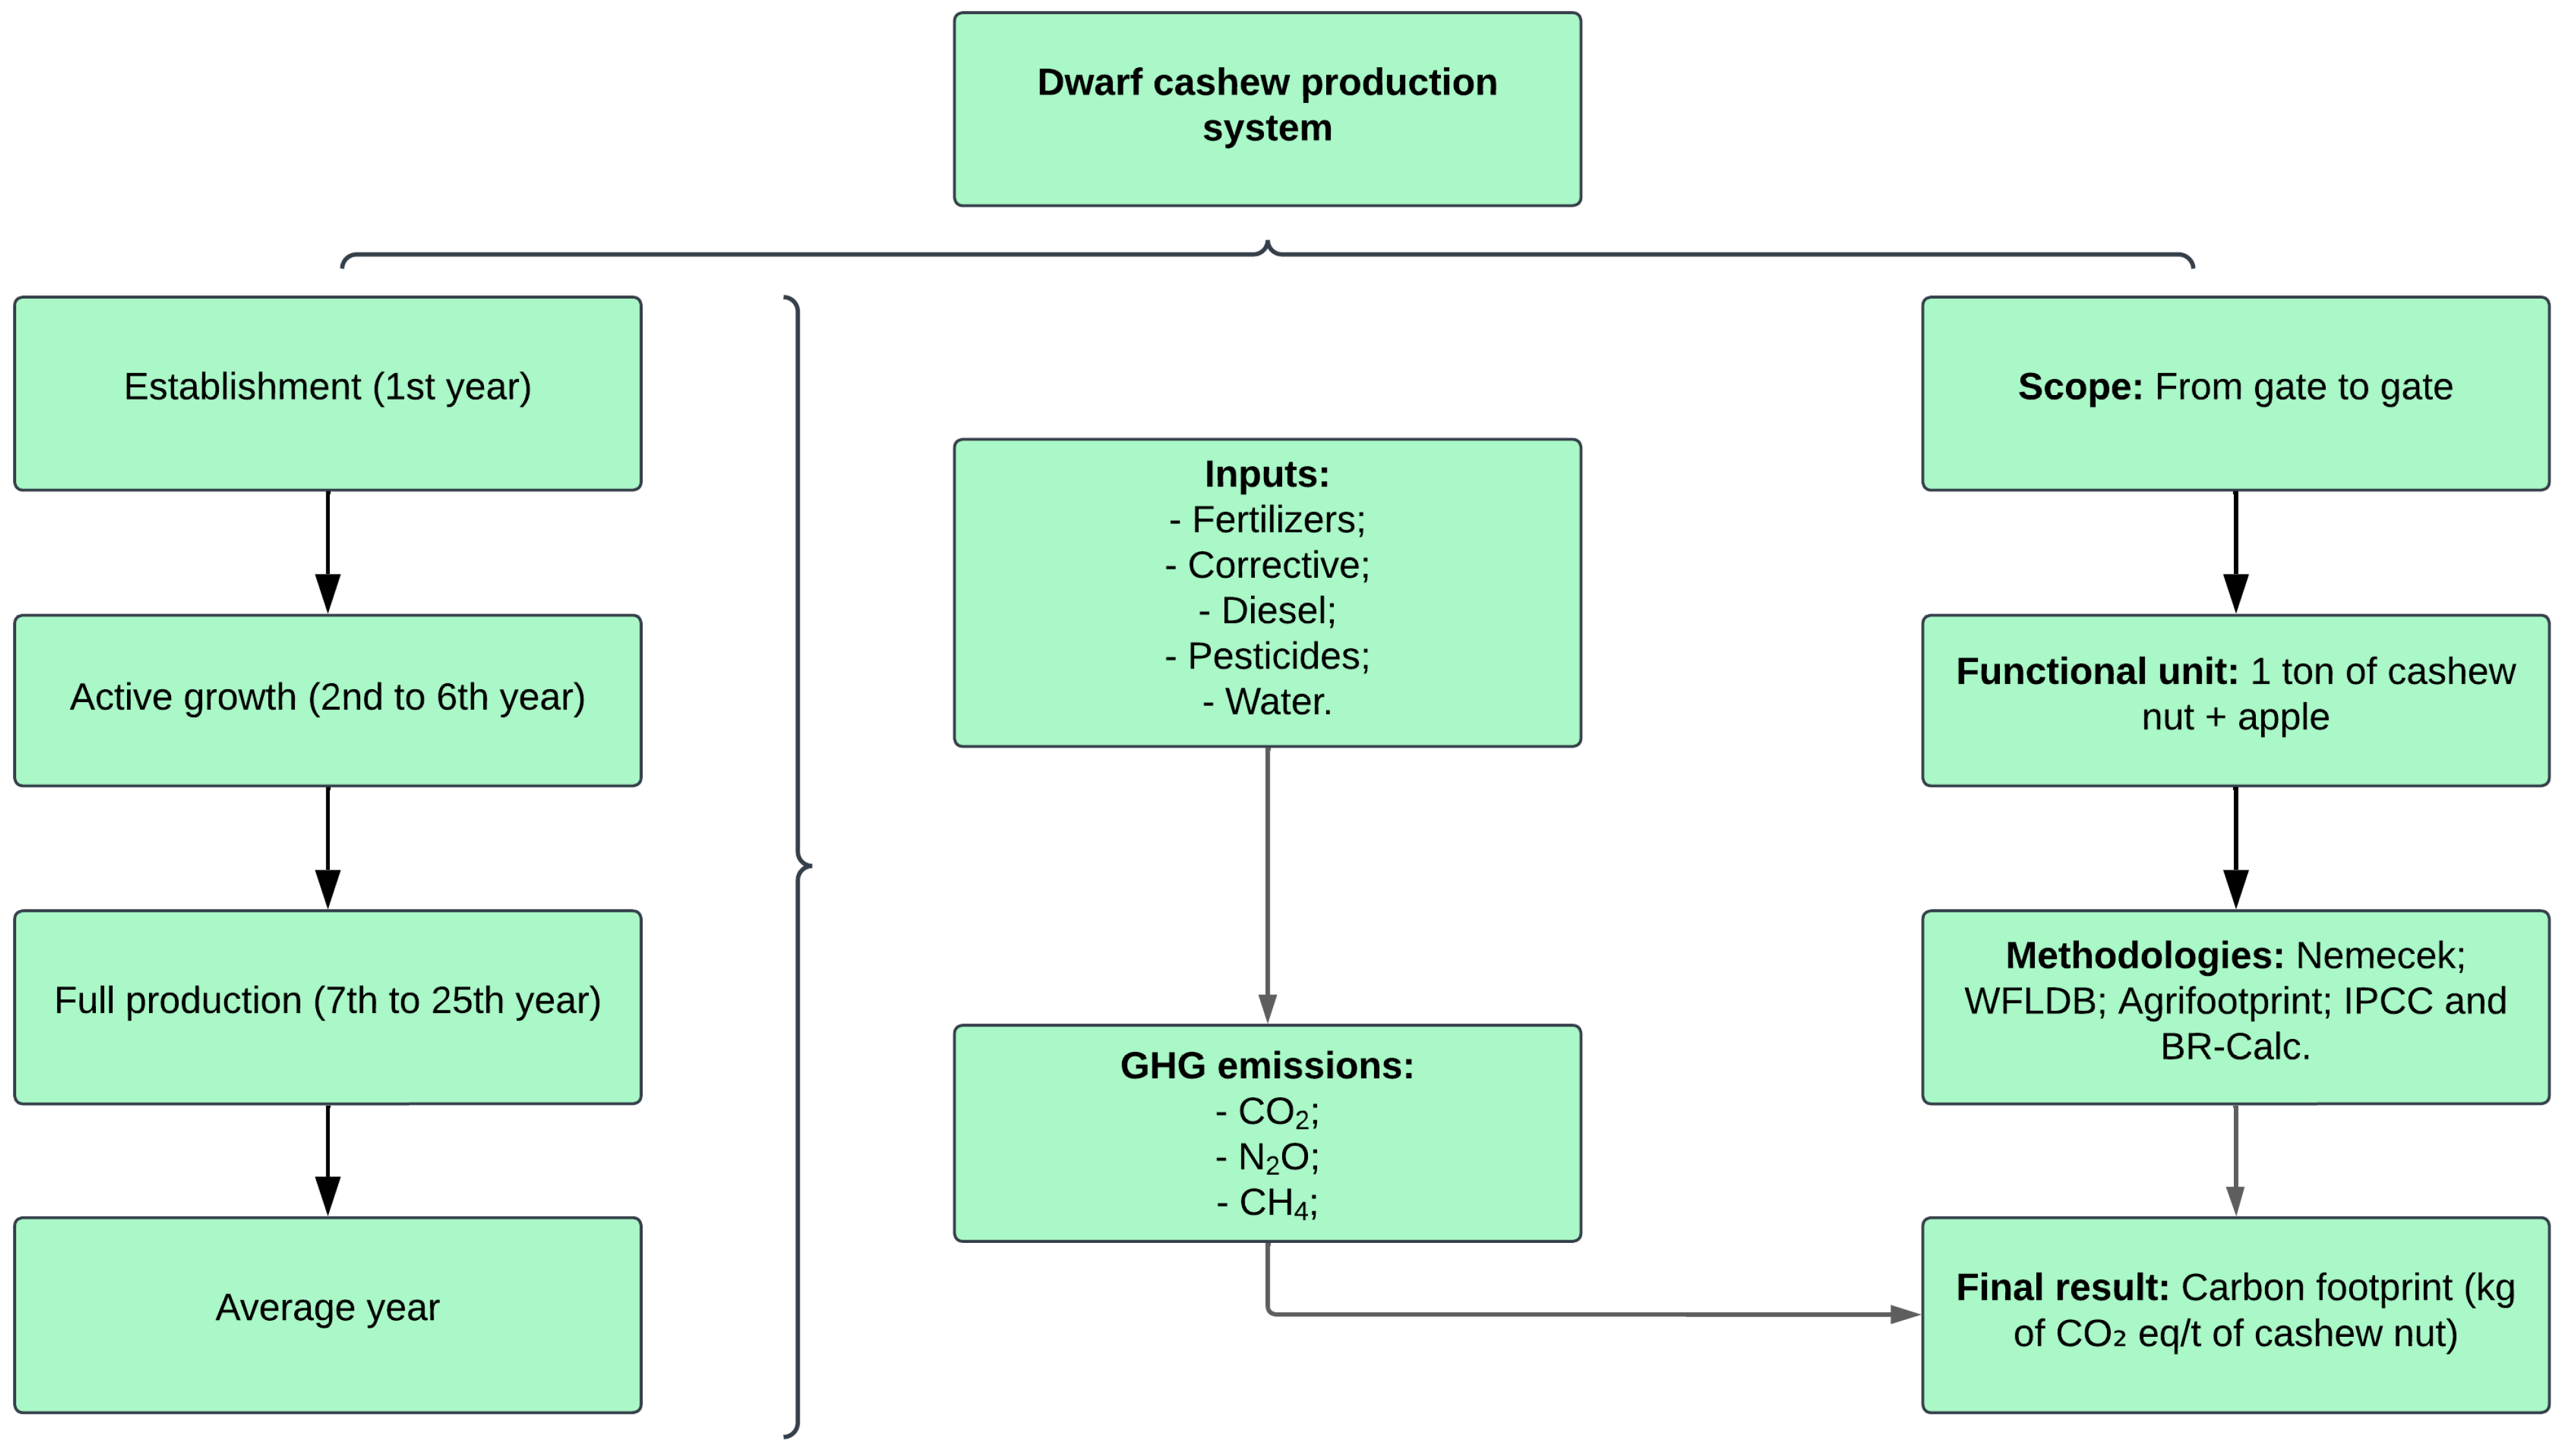
Thus, the objective of this study was to evaluate and compare methods for quantifying GHG emissions based on empirical equations for life cycle inventories, using the conventional cashew production system in Brazil as a case study.

2. Literature Review

2.1. Socio-Economic Importance of Cashew Crop

Cashew crop in Brazil has its greatest concentration in the Northeast region, where it plays an important socio-economic role; being a source of employment and income, especially during the dry period, cashew cultivation adapts well to local conditions, characterized by soils of low fertility and periods of water scarcity [15]. This scenario contributes to the expansion of cashew cultivation and the increased commercialization of cashew-derived products, which offer diverse uses and efficient utilization of raw materials [16].
However, improving cashew production systems is a key challenge to ensure the prosperity of the production chain by improving resource efficiency and the sustainability of the activity. The introduction of the dwarf cashew tree, which includes the use of improved clones, dense cultivation, fertilizer application, irrigation, and phytosanitary control, has driven the evolution of the production system [17,18].
Nevertheless, the excessive use of technologies such as synthetic fertilizers and phytosanitary products may conflict with the United Nations’ sustainable development goals (SDGs). Therefore, the adoption of practices that promote sustainable agriculture ensures responsible consumption and production, and contributes to the fight against climate change (SDGs 2, 12, and 13); this is necessary to ensure that the modernization of cashew farming advances in harmony with the principles of sustainability [19].
In addition to modernizing production systems, assessing GHG and the CF of cashews becomes increasingly essential, especially to meet the requirements of the international market. Analyzing these emissions allows us to identify opportunities to reduce the environmental impact of cashew production, adding value to the product and increasing its competitiveness in the global scenario.

2.2. Methodologies for the Quantification of GHG Emissions in Agricultural Systems

In agricultural production systems, GHGs, mainly carbon dioxide (CO2), methane (CH4), and nitrous oxide (N2O), play a significant role in intensifying global climate change, exerting transnational impacts, changing the climate, and affecting ecosystems and agricultural activities in various regions [20,21].
In this way, quantifying GHG emissions in agriculture is crucial to understanding and mitigating its climate impact. This quantification makes it possible to identify the main sources of emissions and assess the effectiveness of sustainable agricultural practices. It also makes it possible to develop targeted mitigation strategies and contribute to global policies that promote more sustainable agriculture, such as the SDGs [19].
The choice of model for life cycle inventory assessment impacts the accuracy of results, especially in tropical regions where models developed for temperate climates may not accurately reflect local conditions [14]. Comparing methodologies is essential to identify the most suitable one, considering the level of detail, data availability, and regional characteristics, ensuring more precise results for decisions on sustainability and environmental impact mitigation.
The comparative assessment of diverse methodologies for greenhouse gas emission estimation, particularly with reference to specialized approaches such as BR-Calc [9], is imperative for several critical reasons. Foremost among these is the validation of emission quantification. When multiple analytical frameworks yield convergent results for a specific agricultural product, this concordance substantially enhances the reliability and credibility of the derived estimations.
Moreover, this work contributes to advancing literature by comparing different methodologies for estimating GHG emissions specifically in the context of cashew production. The novelty lies in the detailed application of BR-Calc, a methodology widely used in other contexts but still underexplored for tropical crops like cashews. This study provides an in-depth analysis of the advantages and limitations of this methodology in the specific context of Brazil, offering valuable data to improve sustainable agricultural practices and public policies for emission mitigation, especially in tropical regions with unique agronomic characteristics.

3. Materials and Methods

3.1. Quantification of GHG from Crop Production

The following methodologies were applied for estimating direct emissions of CO2, N2O, and CH4: Nemecek-Calc [10], WFLDB [11], IPCC-Calc [12], BR-Calc [9], and Agri-footprint [13]. The ICVCalc tool v1.1 [9] was used to calculate GHG emissions by the chosen methods. It is emphasized that the indirect emissions of NOx, NH3, and NO3, which contribute to N2O emissions, were considered for calculation purposes following the methods suggested by each GHG methodology. However, these emissions are not a focus of evaluation in the present study.
For the evaluation of the carbon footprint of cashew production years, the global warming potentials of GHGs in the horizon of 100 years were used, according to [22], for evaluation. Each methodology’s input data and emissions were evaluated using the software Simapro® version 9.5.0.0.

3.2. Criteria for Evaluating Methodologies

To systematically evaluate GHG emission quantification methods used in this study, five key criteria were defined: clarity, scientific robustness, consideration of regional data, calculation transparency, and data accessibility. These criteria ensure a comprehensive assessment of each method, considering both its scientific credibility and practical applicability. Each criterion was scored on a scale from 1 (Low) to 3 (High), where a higher score indicates better performance in that category. Clarity criterion evaluates how well-documented and understandable the methodology is. Scientific robustness considers the method’s foundation in scientific literature and whether it has undergone peer review. Consideration of regional data assesses the extent to which the method incorporates Brazilian-specific emission factors and agricultural conditions. Calculation transparency examines the level of detail provided in the equations and emission factor sources. Lastly, data accessibility measures how easily the necessary data can be obtained.
The scoring process was conducted based on a critical analysis of each methodology, leading to a consensus among all authors. This approach ensured a balanced and well-founded evaluation, considering both methodological documentation and its applicability to the study context. The scoring system applied to each criterion is detailed in Table 1.

3.3. Emissions from Cashew Production

Primary and experimental data were used to develop an inventory of GHG emissions for the conventional dwarf cashew crop production in Brazil (Figure 1), made available by Embrapa Tropical Agroindustry, in Fortaleza, Ceará, Brazil, and complemented by [23].
The production of one ton of cashew nut + apple was considered a functional unit, corresponding to the cultivation of one hectare of the Embrapa dwarf cashew production system, and evaluated over 25 years of cultivation. This period represents the typical lifespan of a dwarf cashew orchard, including the following production stages: establishment (including soil preparation and seedling transplantation during the 1st year), active growth (from the 2nd to the 6th year), and full production (from the 7th to the 25th year). The seedling production stage was not considered due to its insignificant contribution to the results, as noted by [4].

Description of the Conventional Production System of the Dwarf Cashew Tree

The information taken into consideration for the preparation of the inventory of the Embrapa dwarf cashew production system was based on experimental data (considering a field experiment, 15 years old) and documents from [4,23]. The BRS 226 clone, recommended for dryland cultivation in environments with hot climate conditions, low rainfall, and deep, sandy soils, was considered as the genetic material evaluated [18]. The study covers the following steps:
Establishment (Year 1): After cleaning the area, soil preparation begins by harrowing, correcting soil acidity with limestone, and digging planting holes measuring 40 × 40 × 40 cm. At this time, fertilization is carried out with fertilizers containing macro- and micronutrients. Thirty days after preparing the holes, the grafted cashew seedlings are transplanted, spaced 8 × 6 m apart, corresponding to a stand of 208 plants per ha. Irrigation is only used at this stage and is intended to save the seedlings during the dry season (6 months).
Active growth (Years 2–6): Dwarf cashew plants grow actively until the sixth year, with slow development in the rainy season and intense development in the dry season. At this stage, formation fertilization begins, fertilizing with nitrogen (urea), phosphate (simple superphosphate), potassium fertilizers (potassium chloride), and micronutrients (FTE BR-12). During this period begins formation pruning, aiming to form a compact, well-lit, and airy crown. Pest, disease, and weed management is carried out simultaneously.
Full production (Years 7–25): In full production, the cashew tree cultivated in the Embrapa system reaches up to 4 m in height, with an estimated average productivity of 2500 kg/ha/year of nuts. At this stage, the use of mineral fertilization with macro and micronutrients is carried out intensively. Similarly, annual cleaning and maintenance pruning, as well as the application of phytosanitary products and mechanized weddings, are carried out.

4. Results

4.1. Comparison of Methodologies

The results presented in Table 2, calculated from the scores established in Table 1 indicate that the WFLDB, IPCC-Calc, and BR-Calc methods achieved the highest overall scores (14 points each), suggesting superior performance across the evaluated criteria. Agri-footprint obtained an intermediate score (12 points), while Nemecek-Calc had the lowest overall performance (10 points), primarily due to lower transparency in the calculations.
Among the evaluated criteria (Table 2), clarity was rated highest for WFLDB, IPCC-Calc, and BR-Calc, indicating well-documented methodologies that are easy to interpret, whereas Nemecek-Calc and Agri-footprint had lower scores, suggesting greater complexity. Scientific robustness, assessed based on peer-reviewed validation, was strongest for WFLDB and IPCC-Calc, while BR-Calc scored slightly lower, likely due to a smaller number of studies applying its approach. Consideration of regional data was best addressed by BR-Calc, reflecting its adaptation to specific conditions such as those in Brazil, whereas the other methods demonstrated more generalized applicability. Calculation transparency was a limiting factor for Nemecek-Calc, which had the lowest rating in this category, whereas the remaining methods scored highly, ensuring better traceability of calculations. Data accessibility was consistently high across all methodologies, highlighting the availability of input data for researchers and practitioners. These findings reinforce the need to balance clarity, scientific robustness, and regional adaptation when selecting an appropriate methodology for GHG emission assessments.

4.2. Inventory by Cashew Production Stage

From the inventory of input of the Embrapa system of production of dwarf cashew (Table 3), the phases of full production and active growth were the ones that most used inputs (fertilizers, pesticides, and fuel) per hectare of cashew cultivation. In these phases, macronutrients, agricultural pesticides, and agricultural operations are used more intensively than in the stage of crop establishment.
In absolute terms, the full production stage presents the highest production of cashews, contributing 95.7% of the total production estimated for 25 years of orchard life. However, it is also at this stage that the highest amounts of limestone, urea, and diesel are used in field production, which will lead to GHG emissions.
It can be seen from the data corresponding to the average year of the useful life cycle of the cashew orchard that the main inputs used in these production systems that directly contribute to GHG emissions and consequently to the increase in the carbon footprint were as follows: limestone (212 kg per ha) emitting mainly CO2; urea (190.5 kg per ha) emitting CO2 and N2O; and diesel (62.8 L per ha) used in agricultural operations, which through its combustion produces emissions of CO2, N2O, and CH4.
The quantification of carbon dioxide (CO2) emissions assessed by different methodologies presented variable results (Table 4). IPCC-Calc and BR-Calc generated the same and highest results (397 kg of CO2/ha), while the Nemecek-Calc and Agri-footprint methodologies were, respectively, 24.7 and 41.3% lower when comparing both situations.
Table 5 presents the results for nitrous oxide (N2O) emissions, highlighting notable variations among the methodologies. The highest absolute emissions were observed in the IPCC-Calc and BR-Calc methodologies, both yielding 4.17 kg of N2O per ha. In comparison, the Agri-footprint methodology showed a slight decrease of 1.44%, while WFLDB and Nemecek-Calc exhibited more substantial reductions of 9.4% and 17.5%, respectively.
Emissions of methane gas (CH4) (Table 6) were quantified by only two of the five methodologies evaluated. Since only the IPCC-Calc and BR-Calc methodologies account for emissions from diesel combustion, a pattern is noted in the CH4 emissions results, in which both methodologies presented the same result (0.01 kg of CH4/ha).
Figure 2 illustrates the impact of GHG emissions on climate change as calculated using different methodologies. The IPCC-Calc and BR-Calc methodologies presented the highest cumulative values (129.5 kg CO2 eq per t of cashew nut + apple). In contrast, Agri-footprint and Nemecek-Calc presented the lowest, 114 and 104 kg CO2 eq per t of cashew nuts, respectively. The WFLDB methodology presented intermediate results (120 kg CO2 eq per t of cashew nut + apple). It was found that, for all the evaluated methodologies, the largest contributions to climate change resulted from the global warming potential of N2O, reaching up to 75.9%, while CO2 emissions contributed up to 25.8% of the impact on climate change.

5. Discussion

The evaluation of GHG emissions quantification methodologies based on criteria analysis revealed significant differences between the methods analyzed, reflecting variations in clarity, scientific robustness, and consideration of regional data. The IPCC-Calc [12], BR-Calc [9], and WFLDB [11] methods achieved the highest scores due to a balance between these criteria, while Agri-footprint obtained an intermediate score and Nemecek-Calc presented the lowest overall performance.
IPCC-Calc [12] stood out for its high clarity, as its guidelines are well-established and extensively documented. In addition, its scientific robustness is widely recognized, being one of the most widely used methods for national emissions inventories. However, its consideration of regional data is limited, since the emission factors are global and require calibration for local conditions, which may compromise its accuracy for tropical systems such as cashew cultivation in Brazil.
BR-Calc [2,9], presented an equally high score, standing out mainly in the consideration of regional data, as it was developed specifically for edaphyclimatic conditions in Brazil. Its clarity was also well evaluated, being a potentially more accessible model for the national context. In addition, its scientific robustness was considered high, as it is based on local data and specific adaptations for the Brazilian agricultural reality, making it a relevant option for analyses in tropical conditions. In addition, this methodology has been reviewed by experts in the field.
WFLDB [11] also obtained a high score due to its detailed documentation, which ensures satisfactory clarity. Its scientific robustness was evaluated as high since it is widely used in LCA of agri-food production. However, its consideration of regional data is only average, since, although it has broader information than Nemecek-Calc [10], it is not fully adjusted to tropical conditions, requiring additional adaptations.
Agri-footprint obtained an intermediate performance, being a method used in agri-food LCA and with good scientific robustness. However, its clarity was evaluated as average, since the documentation can vary depending on the version used. Furthermore, its consideration of regional data was also intermediate, like the WFLDB [11], indicating the need for adjustments to better represent agricultural conditions in Brazil.
On the other hand, Nemecek-Calc [10] had the lowest overall score, mainly due to its low transparency in calculations. Despite being one of the most reliable databases in LCA and having high scientific robustness, its clarity was considered only average, as its methodologies and emission factors are unclear. Furthermore, its consideration of regional data is limited, as the emission factors are based on temperate conditions, requiring significant adjustments to be applied in tropical regions.
Thus, the results reinforce that the choice of the most appropriate method should consider a balance between clarity, scientific robustness, and regional adaptation. While IPCC-Calc [12], BR-Calc [9], and WFLDB [11] proved to be the most recommended options, Agri-footprint can be useful depending on the context of the analysis, and Nemecek-Calc [10] requires greater caution due to its limitations in transparency and adaptation to tropical conditions.
The comparison highlights substantial variations in emission estimates produced by each methodology. These discrepancies underscore the influence of methodological choices on the results obtained, consequently affecting the projected impact of emissions on climate change. This emphasizes the importance of selecting appropriate methods for accurate assessments.
Furthermore, these limitations may impact the assessment of the carbon footprint of the analyzed system. Methods with less transparency in calculations, such as Nemecek-Calc, may hinder the traceability of estimates, generating uncertainty in the quantification of emissions, and compromising the reliability of the LCA. Although they do not adequately consider regional data in their standard approach and use global emission factors that do not reflect the particularities of the cashew production system in Brazil, IPCC-Calc [12] and WFLDB [11] presented satisfactory results in terms of carbon footprint. These are like those obtained in BR-Calc, which, although it has regionalized factors for Brazil, for this study, there was no significant influence from them.
Thus, the choice of methodology directly influences decision-making, reinforcing the need to select approaches that offer greater data representativeness, transparency in calculations, and adaptation to the context analyzed.
To explain differences in results, we compared equations and emission factors adopted in each methodology (Table 7 and Table 8).
CO2 emissions (Table 4) are related to the use of urea, limestone (CaCO3), and dolomite ((CaMg)CO3). Urea application leads to the release of CO2 previously fixed in the fertilizer molecule. This occurs due to urea hydrolysis, where the carbon in its structure is converted into CO2. Since approximately 20% of urea’s mass consists of carbon, applying the stoichiometric conversion to CO2 (44/12) results in an estimated emission of CO2 per kg of urea. On the other hand, the carbonates in limestone and dolomite decompose in the soil, releasing CO2. In the case of limestone, about 12% of its mass is carbon, while in dolomite, this proportion is approximately 13%.
The IPCC-Calc [12] and BR-Calc [9] methodologies produced identical results as they accounted for urea and limestone emissions, using the same emission factors (0.12 for limestone and 0.20 for urea) and additionally included emissions from fossil fuel (diesel) combustion. The Nemecek-Calc [10] estimated lower emissions because it did not consider limestone and dolomite emissions, whereas the WFLDB [11] reported higher values due to the full accounting of carbon emissions from these inputs. The Agri-footprint methodology [13], despite using the same emission factors for urea and limestone, did not include diesel combustion emissions (Table 7), leading to different results from those of IPCC-Calc and BR-Calc [9,12]. Consequently, the inclusion of diesel emissions in IPCC-Calc and BR-Calc [9,12] significantly increased CO2 emissions and, therefore, the carbon footprint (Figure 2).
N2O emissions were estimated in all methodologies considering direct and indirect emissions, as proposed by based on [24]. Direct N2O emissions are from the use of mineral and organic fertilizers, decomposition of crop residues, and mineralization associated with loss of soil organic matter resulting from changes in land use or management of mineral soils.
Indirect emissions regard the conversion of NH3, NOx, and NO3⁻ into N2O. However, differences were found in the methodologies regarding emission sources and factors. The lowest emission of N2O was obtained using the methodology of Nemecek-Calc [10] due to disregarding the mineralization of soil organic matter (Nsom) and the indirect emission from NOx. WFLDB [11] adopts equations with modifications and factors considering direct emissions from fertilizer applications (mineral and organic), crop residues, and decomposition of soil organic matter, as well as indirect emissions from NH3 volatilization, NO3 leaching, and NOx emissions. On the other hand, the highest N2O values were from IPCC-Calc and BR-Calc [9,12], justified by the greater specificity of the equation (Tier 2) for N2O emissions and by the lack of both considering nitrous oxide emissions from diesel combustion [9,12].
Considering the carbon footprint results obtained from each methodology, IPCC-Calc and BR-Calc [9,12] showed the highest impacts. This is because, in addition to fossil CO2 and N2O emissions, these methodologies account for additional GHG emissions resulting from diesel combustion, a criterion not evaluated by the other methodologies. Even without evaluating emissions from burning diesel, the WFLDB methodology [11] showed a lower level of only 9.8% in relation to the greater impact, justifying the fact that this method uses a greater emission factor for urea, directly contributing to the impact on climate change.
Nitrogen fertilization directly contributes to the increase in the carbon footprint, where urea, the main fertilizer source of N, increases CO2 emissions due to its synthesis from ammonia and CO2, increasing GHG emissions by about 40% due to its high carbon content [25].
BR-Calc [9] is inserted as a regional alternative adapted to Brazilian conditions, seeking to fill gaps left by global methodologies such as the IPCC [12] and more detailed models, such as the WFLDB [11], incorporating emission factors and parameters adjusted to climatic, soil, and agricultural management particularities in Brazil, making it especially relevant for local and regional studies [2]. It is also noteworthy that BR-Calc [9] also calculates emissions other than GHG-related ones, such as heavy metals and phosphate emissions.
When the methodologies of Nemecek-Calc [10] and Agri-footprint [13] were used for the quantification of GHGs, lower values of environmental impact were obtained in the climate change category. This result occurred mainly due to the simplification of calculation present in these methodologies, especially in Nemecek-Calc [10], which presented underestimated results for most of the quantified emissions (Figure 2).
Currently, the most frequently used methodologies for estimating GHG emissions from agricultural systems in LCA studies are those adopted by the IPCC-Calc [12] and the WFLDB [11], especially the joint use of both, according to [26,27].
It is important to stress that more specific models such as BR-Calc [9] and Agri-footprint [13], although they allow the estimation of emissions within a limited time and with a small financial budget, require knowledge of local ecosystems to calibrate specific variables for the correct modeling [4].
Based on the IPCC Guidelines [12], the IPCC-Calc quantifies only greenhouse gas emissions, considering N2O from fertilizers and crop residues and CO2 from limestone and urea application. However, this methodology has limitations that may affect comparisons with other methods, as it does not include the indirect formation of NO2, the radiative forcing of NOx, water vapor, and sulfates, nor the indirect effects proposed by the IPCC, which may underestimate climate impacts. Additionally, it does not account for the conversion of CO-to-CO2, a relevant factor under certain agricultural conditions [28].
The BR-Calc [9] corresponds to a protocol developed by Embrapa Environment, which compiles methods consolidated in the literature for estimating emissions from agricultural activities, selected for better representing tropical conditions. Additionally, the tool includes a climate and soil database specific to Brazil, allowing users to choose the most suitable geographical scale for their study. However, this protocol uses the same equations and emission factors as the IPCC-Calc for GHG emission quantification, resulting in little mathematical differentiation between the methods. Therefore, future studies should focus on developing GHG emission factors adapted to Brazil’s edaphoclimatic conditions to improve estimation accuracy.
In the Nemecek-Calc [10] methodology, a significant underestimation of GHG emissions is observed, mainly due to the absence of accounting for fossil CO2 from limestone use, nitrogen mineralization in mineral soils, and the exclusion of indirect emissions of (NOx) which, according to the authors, correspond to 21% of N2O emissions. Additionally, this methodology features poorly explained equations and factors that are difficult to understand, compromising the clarity and transparency of the calculations.
The WFLDB [11] methodology is an update of the method by Nemecek-Calc [10], correcting most of the issues of its predecessor by providing greater data transparency and enhanced scientific robustness. However, in both methodologies, GHG emissions from fossil fuel combustion are not accounted for, which limits the accuracy of the estimates.
In the literature, it is observed that most of the studies that evaluate GHG emissions resulting from agricultural production in tropical climate conditions use the IPCC-Calc and WFLDB methodologies together, especially when evaluating the emission of gases that indirectly contribute to the greenhouse effect (NOx, NH3, and NO3), as reported in coconut [3], cashew [4], melon [5], macauba [29], and soybean [28] crops.
More recently, in the context of Brazilian agriculture, the integrated use of the BR-Calc methodology with the methods mentioned above has been observed, as evidenced by wheat [2] and banana [26] crops. However, although all these studies use more than one methodology to assess emissions, they do not compare the different results that each method provides.
Table 9 presents summaries of the main advantages and limitations of all methodologies evaluated in this study, providing a direct comparison between the methods and offering insights into their applicability in different contexts.
The results of this study can guide public policies and sustainable agricultural practices in cashew cultivation. Methods such as IPCC-Calc and BR-Calc, which provide more accurate estimates, allow the search for more effective actions to reduce GHG emissions from cashew cultivation in tropical environments.
For farmers, it is recommended to optimize the use of fertilizers [1], adopt organic and green fertilizers [4,30], and implement agroforestry systems [31], reducing N2O emissions and improving the carbon balance in the soil. For policymakers, it is essential to encourage methodologies and emission factors adapted to the Brazilian reality, in addition to promoting research and technologies to strengthen low-carbon agriculture, according to the ABC+ plan [32].
These strategies are aligned with SDGs [19]: 2 (zero hunger and sustainable agriculture); 12 (responsible consumption and production); and 13 (climate change mitigation). Thus, the study not only improves the quantification of GHG emissions but also offers guidelines to make cashew production more sustainable.

6. Conclusions

This study contributes to the advancement of LCA and CF in tropical regions by addressing the gap in methodological comparisons highlighted in the work. By evaluating different approaches to quantifying GHG in a tropical agricultural system, our results highlight the importance of choosing methodologies that can be adapted to different agricultural scenarios.
The choice methodology for estimating GHG emissions is a critical factor, as it directly influences the interpretation of agricultural carbon footprints. In this study, the IPCC-Calc and BR-Calc methodologies yielded the highest emission estimates for cashew production under tropical conditions, leading to the largest carbon footprints. In contrast, the Nemecek-Calc methodology reported the lowest values, highlighting the variability among methods and the need for regionally adapted approaches.
Based on the analysis criteria, the WFLDB, IPCC-Calc, and BR-Calc methodologies were the most recommended, balancing clarity, scientific robustness, and regional adaptation. BR-Calc stood out for its consideration of regional data, while WFLDB and IPCC-Calc demonstrated greater scientific robustness. In contrast, Nemecek-Calc showed limitations in transparency, and Agri-footprint had an intermediate performance, proving useful depending on the analysis objective.
Therefore, it is suggested that BR-Calc be used for evaluations in national contexts, especially in situations where factors such as the use of limestone, urea, and local agricultural practices have a significant impact on GHG emissions. This approach can improve the representativeness of the results and provide more precise support for decision-making aimed at mitigating emissions in Brazilian agricultural production.
Furthermore, future studies should consider the integration of primary data and direct measurements to validate the estimates obtained through different methodologies, reducing uncertainties and enhancing the applicability of models in tropical agricultural systems. The adoption of hybrid approaches, combining empirical equations with process-based modeling, could represent a promising alternative to increase the accuracy of estimates and assist in the development of more effective policies for mitigating GHG emissions in agriculture.

Author Contributions

Conceptualization, J.R.d.S.S., A.C.-G. and A.F.d.S.L.; methodology, J.R.d.S.S. and V.d.S.B.; software, M.C.B.d.F.; validation, C.F.d.L., M.C.B.d.F. and A.C.-G.; formal analysis, V.d.S.B.; investigation, J.R.d.S.S. and A.F.d.S.L.; A.C.-G. resources, M.C.B.d.F.; data curation, J.R.d.S.S. and V.d.S.B.; writing—original draft preparation, J.R.d.S.S. and A.C.-G.; writing—review and editing, J.R.d.S.S., V.d.S.B., C.F.d.L., M.C.B.d.F. and A.C.-G.; visualization, V.d.S.B. and A.C.-G.; supervision, C.F.d.L. and A.C.-G.; project administration, M.C.B.d.F. All authors have read and agreed to the published version of the manuscript.

Funding

This research received no external funding.

Institutional Review Board Statement

Not applicable.

Informed Consent Statement

Not applicable.

Data Availability Statement

The data used for the work are available upon request to the corresponding author.

Acknowledgments

We would like to thank the Coordination for the Improvement of Higher Education Personnel (CAPES), notice 06/2024. Embrapa Tropical Agroindustry. The National Institute of Science and Technology in Sustainable Agriculture in the Tropical Semiarid Region—INCTAgriS (CNPq/FUNCAP/CAPES).

Conflicts of Interest

Author Viviane da Silva Barros was employed by the company Embrapa Environment and author Maria Cléa Brito de Figueirêdo was employes by the company Embrapa Tropical Agroindustry. The remaining authors declare that the research was conducted in the absence of any commercial or financial relationships that could be construed as a potential conflict of interest.

Abbreviations

The following abbreviations are used in this manuscript:
CFCarbon footprint
GHGGreenhouse gas
IPCCIntergovernmental panel on climate change
ISOInternational standard organization
LCALife cycle assessment
SDGsSustainable development goals

References

  1. Poore, J.; Nemecek, T. Reducing food’s environmental impacts through producers and consumers. Science 2018, 360, 987–992. [Google Scholar] [PubMed]
  2. Giongo, V.; da Silva Acosta, A.; Dossa, Á.A.; Santi, A.; do Amaral, A.J.; Caierão, E.; Denardin, J.E.; Vieira, O.V.; de Figueirêdo, M.C.B.; da Silveira Folegatti, M.I.; et al. How can the environmental impacts of wheat cultivation and wheat flour production be reduced? A life cycle assessment of Brazilian wheat. J. Clean. Prod. 2025, 489, 144650. [Google Scholar] [CrossRef]
  3. Sampaio, A.P.C.; Silva, A.K.P.; Amorim, J.R.A.; Santiago, A.D.; Miranda, F.R.; Barros, V.S.; Sales, M.C.L.; Figueirêdo, M.C.B. Reducing the carbon and water footprints of Brazilian green coconut. Int. J. Life Cycle Assess. 2021, 26, 707–723. [Google Scholar]
  4. Figueirêdo, M.C.B.; Potting, J.; Serrano, L.A.L.; Bezerra, M.A.; Barros, V.S.; Gondim, R.S.; Nemecek, T. Environmental assessment of tropical perennial crops: The case of the Brazilian cashew. J. Clean. Prod. 2016, 112, 131–140. [Google Scholar]
  5. Barros, V.S.; Santos, T.L.; Silva, E.O.; Sousa, J.A.; Figueiredo, M.C.B. Agronomic and Environmental Performance of Melon Produced In The Brazilian Semiarid Region. Rev. Caatinga 2019, 32, 877–888. [Google Scholar]
  6. ISO 14040; Environmental Management—Life Cycle Assessment—Principles and Framework. ISO: Geneva, Switzerland, 2006.
  7. ISO 14044; Environmental Management—Life Cycle Assessment—Requirements and Guidelines. ISO: Geneva, Switzerland, 2006.
  8. ISO 14067; Greenhouse Gases—Carbon Footprint of Products—Requirements and Guidelines for Quantification and Communication. ISO: Geneva, Switzerland, 2018.
  9. Matsuura, M.I.S.F.; Cardoso, F.H.; Pighinelli, A.L.M.T.; Ramos, N.P.; Maciel, V.G.; Garofalo, D.T.; Novaes, R.M.L.; Morandi, M. Workbook for Life Cycle Inventories of Agricultural Products, According to Different Methodological Guides; Empresa Brasileira de Pesquisa Agropecuária: Jaguariúna, Brazil, 2022. [Google Scholar]
  10. Nemecek, T.; Schnetzer, J. Zurich Data, v3.0; Methods of Assessment of Direct Field Emissions for LCIs of Agricultural Production Systems; ART: Zurich, Switzerland, 2012. [Google Scholar]
  11. Nemecek, T.; Bengoa, X.; Lanche, J.; Roesch, A.; Faist-Emmenegger, M.; Rossi, V.; Humbert, S. World Food LCA Database (WFLDB), Version 3.5; Methodological Guidelines for the Life Cycle Inventory of Agricultural Products; Quantis and Agroscope: Lausanne, Switzerland; Zurich, Switzerland, 2019. [Google Scholar]
  12. Intergovernmental Panel on Climate Change (IPCC). Refinement to the 2006 IPCC Guidelines for National Greenhouse Gas Inventories; IPCC: Geneva, Switzerland, 2019.
  13. Blonk, H.; Van Paassen, M.; Draijer, N.; Tyszler, M.; Braconi, N.; Van Rijn, J. Agri-Footprint 6 and Agri-Footprint FLAG Methodology Report. Gouda, The Netherlands, 2023. Available online: https://blonksustainability.nl/tools-and-databases/agri-footprint (accessed on 6 January 2025).
  14. Basset-Mens, C.; Avadí, Á.; Bessou, C.; Acosta-Alba, I.; Biard, Y.; Payen, S. State of the art of agri-food LCA. In Life Cycle Assessment of Agri-Food Systems: An Operational Guide Dedicated to Developing and Emerging Economies; Basset-Mens, C., Avadí, Á., Bessou, C., Acosta-Alba, I., Biard, Y., Payen, S., Eds.; Quae: Versailles, France, 2022; Volume 5, pp. 29–41. [Google Scholar]
  15. Brainer, M.S.C.P.; Vidal, M.F. Cajucultura; Banco do Nordeste do Brasil-Escritório Técnico de Estudos Econômicos do Nordeste/ETENE: Fortaleza, Brazil, 2020.
  16. Alencar, N.S.; Gonçalves, J.F.; Oliveira, E.A.F.; Lucena, T.C.; Sousa, R.M. Produção da Castanha de Caju nas microrregiões do Ceará no período de 1993 a 2016. Rev. Electron. Competências Digit. Agric. Fam. 2018, 4, 103–116. [Google Scholar]
  17. Oliveira, V.H. Cajucultura. Rev. Bras. Frutic. 2008, 30, 1–8. [Google Scholar] [CrossRef]
  18. Melo, D.S.; Vidal Neto, F.C.; Barros, L.M. Cultivares recomendadas de cajueiro. In Sistema de Produção do Caju, 2nd ed.; Serrano, L.A.L., Ed.; Embrapa Agroindústria Tropical: Fortaleza, Brasil, 2016; p. 193. [Google Scholar]
  19. Organização das Nações Unidas (ONU). The State of Food and Agriculture: Climate Change, Agriculture, and Food Security. 2016, 16p. Available online: https://www.fao.org/family-farming/detail/en/c/456027/ (accessed on 14 February 2025).
  20. Intergovernmental Panel on Climate Change (IPCC). Summary for Policymakers. In Climate Change 2023: Synthesis Report; IPCC: Geneva, Switzerland, 2023; pp. 1–34. [Google Scholar]
  21. Tsur, Y. The diverse impacts of democracy on greenhouse gas emissions. Ecol. Econ. 2025, 227, 108411. [Google Scholar]
  22. Intergovernmental Panel on Climate Change (IPCC). AR6 Climate Change 2021: Impacts, Adaptation and Vulnerability; IPCC: Geneva, Switzerland, 2021; p. 38.
  23. Serrano, L.A.L. Sistema de Produção do Caju, 2nd ed.; Embrapa Agroindústria Tropical: Fortaleza, Brasil, 2016; p. 193. [Google Scholar]
  24. Intergovernmental Panel on Climate Change (IPCC). Climate Change 2006: The Physical Science Basis. In Contribution of Working Group I to the Fourth Assessment Report of the Intergovernmental Panel on Climate Change; Solomon, S., Qin, D., Manning, M., Chen, Z., Marquis, M., Averyt, K.B., Tignor, M., Miller, H.L., Eds.; Cambridge University Press: Cambridge, UK; New York, NY, USA, 2006; p. 996. [Google Scholar]
  25. Galusnyak, S.C.; Petrescu, L.; Sandu, V.C.; Cormos, C.C. Environmental impact assessment of green ammonia coupled with urea and ammonium nitrate production. J. Environ. Manag. 2023, 343, 118215. [Google Scholar]
  26. Lima, A.F.S.; Barros, V.S.; Silva, A.O.; Gondim, R.S.; Figueirêdo, M.C.B.; Costa, R.N.T.; Lacerda, C.F.; Sales, J.R.S.; Silva, Ê.F.F. Carbon and water scarcity footprints of banana under current and future climate conditions in the Brazilian semiarid region. Environ. Dev. 2024, 51, 101034. [Google Scholar] [CrossRef]
  27. Subedi, S.; Dent, B.; Adhikari, R. The carbon footprint of fruits: A systematic review from a life cycle perspective. Sustain. Prod. Consum. 2024, 52, 12–28. [Google Scholar] [CrossRef]
  28. Lucas, K.R.G.; Ventura, M.U.; Barizon, R.R.M.; Folegatti-Matsuura, M.I.S.; Ralisch, R.; Mrtvi, P.R.; Possamai, E.J. Environmental performance of phytosanitary control techniques on soybean crop estimated by life cycle assessment (LCA). Environ. Sci. Pollut. Res. 2023, 30, 58315–58329. [Google Scholar]
  29. Fernández-Coppel, I.A.; Barbosa-Evaristo, A.; Corrêa-Guimarães, A.; Martín-Gil, J.; Navas-Gracia, L.M.; Martín-Ramos, P. Life cycle analysis of macauba palm cultivation: A promising crop for biofuel production. Ind. Crops Products. 2018, 125, 556–566. [Google Scholar]
  30. Bansal, S.; Yin, X.; Schneider, L.; Sykes, V.; Jagadmma, S.; Lee, J. Carbon footprint and net carbon gain of major long-term cropping systems under no-tillage. J. Environ. Manag. 2022, 307, 114505. [Google Scholar]
  31. M´enard, I.; Thiffault, E.; Kurz, W.A.; Boucher, J.F. Carbon sequestration and emission mitigation potential of afforestation and reforestation of unproductive territories. New For. 2023, 54, 1013–1035. [Google Scholar] [CrossRef]
  32. Brasil. Ministério da Agricultura, Pecuária e Abastecimento. Plano Setorial Para Adaptação à Mudança do Clima e Baixa Emissão de Carbono na Agropecuária com Vistas ao Desenvolvimento Sustentável (2020–2030): Visão Estratégica Para um Novo Ciclo/Secretaria de Inovação, Desenvolvimento Rural e Irrigação—Brasília: MAPA, 2021. Available online: https://www.gov.br/agricultura/pt-br/assuntos/sustentabilidade/plano-abc. (accessed on 19 March 2025).
Figure 1. Flowchart of the system limits for the functional unit under study.
Sustainability 17 03042 g001
Figure 2. Impact of GHG emissions methodologies on climate change.
Sustainability 17 03042 g002
Table 1. Criteria for evaluating GHG emissions quantification methodologies.
CriterionDescriptionScore 1 (Low)Score 2 (Medium)Score 3 (High)
ClarityLevel of understanding of the methodology and available documentationTechnical documentation is complex and difficult to understandClear documentation, but requires specific prior knowledgeWell-documented, easy to interpret for different audiences
Scientific robustnessScientific basis and acceptance of the method in the literature, including peer reviewBased on few studies or poorly referenced; not peer-reviewedBased on recognized references but with some limitations; partially peer-reviewedHighly validated in scientific literature, widely used, and peer-reviewed
Consideration of regional dataUse of specific emission factors and parameters for tropical regionsBased exclusively on global or non-regional dataAllows partial adaptation to the context of tropical regionsUses or has been calibrated with data from tropical regions
Calculation transparencyAvailability and detail of equations and emission factorsEquations are poorly explained or contain difficult-to-access factorsEquations are available but with some limitations in replicabilityWell-described equations, with sources and detailed explanations
Data accessibilityEase of obtaining emission factors and necessary parametersRestricted data or requires a paid subscriptionData are available but scattered or difficult to accessPublicly available data or easily accessible in well-known databases
Table 2. Comparative evaluation of GHG emission quantification methodologies based on key assessment criteria.
CriterionNemecek-CalcWFLDBIPCC-Calc BR-CalcAgri-Footprint
Clarity23332
Scientific robustness23322
Consideration of regional data22232
Calculation transparency13333
Data accessibility33333
Total1014141412
Table 3. Inputs in one ha of dwarf cashew orchard for 25 years in the dwarf cashew production system.
InventoryUnitDwarf Cashew Production System
Establishment
(Year 1)
Active Growth (Years 2–6)Full
Production
(Years 7–25)
Average Year
Products
Cashew nutt02.13147.3121.978
Cashew applet010.655236.569.889
Inputs
Limestonekg1.5008003.000212
Seedlingp2600010.4
Macronutrients
Urea (N)kg20.8395.24347.2190.5
Simple superphosphate (P)kg2081112.84576235.9
Potassium chloride (K)kg18.72239.21497.670.2
Micronutrients
Boronkg0.37441.1237.1140.34
CopperKg0.16440.49923.1620.15
ManganeseKg0.4161.2487.9040.38
ZincKg1.8725.61635.5681.72
Pesticides
Deltamethrinkg0.0150.0750.2850.015
Spinetoramkg00.10.950.042
Acetamipridkg0.4512.2558.5670.42
Etofenproxkg0.814.0515.390.81
Sulfurkg02.37622.5720.99
Glyphosatekg1.447.227.361.44
Other products
WaterL124,800.00004992
DieselL177285110762.8
Table 4. Quantification of CO2 emissions to air in dwarf cashew production system.
CO2 Emissions to AirUnitDwarf Cashew Production System
Total Value for 25 Years
Nemecek-Calckg299
WFLDBkg392
IPCC-Calckg397
BR-Calckg397
Agri-footprintkg233
Table 5. Quantification of N2O emissions to air in dwarf cashew production system.
N2O Emissions to AirUnitDwarf Cashew Production System
Total Value for 25 Years
Nemecek-Calckg3.44
WFLDBkg3.78
IPCC-Calckg4.17
BR-Calckg4.17
Agri-footprintkg4.11
Table 6. Quantification of CH4 emissions to air in dwarf cashew production system.
CH4 Emissions to AirUnitDwarf Cashew Production System
Total Value for 25 Years
Nemecek-CalckgNot applicable
WFLDBkgNot applicable
IPCC-Calckg0.01
BR-Calckg0.01
Agri-footprintkgNot applicable
Table 7. Equations and emission of factors used for GHG emissions calculations by different methodologies.
GHGsMethodologiesEquationsEFEF1EF2EFi
Emissions from the Use of Fertilizers and Correctives
CO2Nemecek-CalcUrea = 44/12 × (Murea × EF)0.43---
WFLDBUrea = 44/12 × ((Murea × EF) + Lime = (Mlimestone × EF1) + (Mdolomite × EF2))0.430.120.13-
IPCC-CalcUrea = 44/12 × ((Murea × EF) + Lime = (Mlimestone × EF1) + (Mdolomite × EF2))0.200.120.13-
BR-CalcUrea = 44/12 × ((Murea × EF) + Lime = (Mlimestone × EF1) + (Mdolomite × EF2))0.200.120.13-
Agri-footprintUrea = 44/12 × ((Murea × EF) + Lime = (Mlimestone × EF1) + (Mdolomite × EF2))0.200.120.13-
Emissions from burning fossil fuels (diesel)
CO2Nemecek-CalcNot applicable----
WFLDBNot applicable----
IPCC-CalcEmission of CO2 = V × d × NCV × Efi---74,100
BR-CalcEmission of CO2 = V × d × NCV × Efi---74,100
Agri-footprintNot applicable----
N2ONemecek-CalcNot applicable----
WFLDBNot applicable----
IPCC-CalcEmission of N2O = V × d × NCV × Efi---28.6
BR-CalcEmission of N2O = V × d × NCV × Efi---28.6
Agri-footprintNot applicable----
CH4Nemecek-CalcNot applicable----
WFLDBNot applicable----
IPCC-CalcEmission of CH4 = V × d × NCV × Efi---4.15
BR-CalcEmission of CH4 = V × d × NCV × Efi---4.15
Agri-footprintNot applicable----
Murea = amount of urea (kg); EF = emission factor; Mlimestone = amount of limestone (kg); EF1 = emission factor; Mdolomite = amount of dolomite (kg); EF2 = emission factor. V = fuel volume (L); D = fuel density (kg L−1); NCV = net calorie value (TJ kg−1); EFi = emission factor to GHG (kg TJ−1).
Table 8. Equations and emission of factors used for N2O emissions calculations by different methodologies.
GHGsMethodologiesEquationsEF1EF4EF5
Emissions from the Use of Fertilizers and the Mineralization of Soil Organic Matter and Crop Residues
N2O totalNemecek-CalcN2O = 44/28 × (EF1 × (Ntot + Ncr) + (EF1 × 14/17 × NH3) + (EF5 × 14/62 × NO3)0.01-0.075
WFLDBN2O = 44/28 × (EF1 × (Ntot + Ncr + Nsom) + (14/17 × NH3) + (14/46 × NOx) + (EF5 × 14/62 × NO3))0.01-0.075
N2O totalIPCC-CalcN2Odirect = 44/28 × ((FSN + FON + FCR + FSOM) × EF1 + N2Oindirect (N2O(ATD) + N2O(L)))0.01--
BR-CalcN2Odirect = 44/28 × ((FSN + FON + FCR + FSOM) × EF1)0.01--
Agri-footprintN2Oindirect = N2O(ATD) = ((FSN × FracGASF) + (FON + FPRP) × FracGASM) × EF4 + N2O(L) = ((FSN + FON + FPRP + FCR + FSOM) × FracLEACH-(H)) × EF5-0.010.011
EF1 = emission factor for N2O emissions from N inputs; EF4 = emission factor from atmospheric deposition of N on soils and water surfaces; EF5 = emission factor for N2O emissions from N leaching and runoff; FracGASF = fraction of synthetic fertilizer N that volatilizes as NH3 and NOx (0.11); FracGASM = fraction of applied organic FON and FPRP that volatilizes as NH3 and NOx (0.21); FracLEACH-(H) = fraction of all N added to/mineralized in managed soils in regions where leaching/runoff occurs (0.24); NH3 = ammonia emission; NO3 = nitrate emission; NOx = nitrogen oxides emission; NTOT = total nitrogen in mineral and organic fertilizers (kg); NCR = FCR: amount of N (kg) in crop residues (above ground and below ground); NSOM = FSOM: amount of N in mineral soils that is mineralized (kg); FSN: amount of synthetic fertilizer N applied to soils (kg); FON = amount of animal manure and organic compost (kg); FPRP = amount of urine and dung N deposited by grazing animals on pasture, range and paddock (kg); N2O(ATD) = amount of N2O produced from atmospheric deposition of N volatilized from managed soils; N2O(L) = from leaching and runoff of N additions to managed soils in regions where leaching/runoff occurs.
Table 9. Summary of the main advantages and limitations of the evaluated methodologies.
SourceMethodologyAdvantagesLimitations
[10]Nemecek-CalcRobust methodology based on ecoinvent data for assessing emissions in agricultural crops.Accuracy may be limited by the generalizability of the data. It does not always reflect regional soil and climate specificities.
[11]WFLDBRepresents agricultural products and food in a global context, useful for eco-design projects and Environmental Product Declarations. Comprehensive globally traded agricultural products.Application at local scale may be limited by the lack of specific regional data. It may not capture detailed local agricultural practices.
[12]IPCC-CalcGlobally accepted methodology for estimating national GHG inventories. Provides a sound scientific basis for national and regional estimates.Less suitable for specific ICVs due to generalization for national use. Not very detailed for local agricultural practices.
[9]BR-CalcAdjusted for Brazilian agricultural conditions, including specific soil and climate parameters for the country’s 137 agricultural mesoregions. Useful for accurate estimates in tropical systems.The methodology may not be recognized internationally. Although there are regionalized parameters for Brazil, these have little direct impact on the calculation of GHGs.
[13]Agri-footprint Comprehensive, industry-specific database for the food and agriculture sector with over 11,000 products. Accepted by the industry and scientific community and useful for LCA.Focuses on global practices, requiring adjustment of data to reflect specific local conditions.
Disclaimer/Publisher’s Note: The statements, opinions and data contained in all publications are solely those of the individual author(s) and contributor(s) and not of MDPI and/or the editor(s). MDPI and/or the editor(s) disclaim responsibility for any injury to people or property resulting from any ideas, methods, instructions or products referred to in the content.

