Article

Multi-Dimensional Gray Relational Comprehensive Evaluation of an AC/DC Hybrid Grid Operation Mode Based on the DEMATEL-CRITIC Method

1
College of Information Science and Engineering, Northeastern University, Shenyang 110819, China
2
Key Laboratory of Integrated Energy Optimization and Secure Operation of Liaoning Province, Northeastern University, Shenyang 110819, China
3
China Electric Power Research Institute, Beijing 100192, China
4
State Grid Shanghai Municipal Electric Power Company, Shanghai 201507, China
*
Author to whom correspondence should be addressed.
Sustainability 2025, 17(7), 3037; https://doi.org/10.3390/su17073037
Submission received: 25 January 2025 / Revised: 6 March 2025 / Accepted: 26 March 2025 / Published: 28 March 2025

Abstract

:
To evaluate the operation modes of AC/DC hybrid power grids, a comprehensive evaluation index system is established based on the principles of index system construction, with a focus on mode development personnel in practical engineering. This system includes four aspects: static security, transient stability, DC security, and economic performance of the operation mode, with detailed explanations of the statistical or computational methods for each index. This index system can objectively and comprehensively reflect the rationality of the operation mode. Then, the Decision-making Trial and Evaluation Laboratory—Criteria Importance Through Intercriteria Correlation (DEMATEL-CRITIC) method is used for combining subjective and objective weights. Considering the scheduling decisions of power grid operators, the method is used to analyze the relationships among indexes, as well as their conflicts and variations. Gray relational analysis is used as the evaluation method to form a comprehensive evaluation model for the operation modes, achieving a scientific and effective comprehensive assessment of AC/DC hybrid power grids. Finally, a case study of an AC/DC hybrid power grid is used to validate the index system and the evaluation model. A comparative analysis demonstrates the effectiveness of the evaluation method and provides a practical tool for the planning, modification, and safe operational management of grids.

1. Introduction

In recent years, wind power and photovoltaic energy have been viewed as representatives of the rapid development of renewable clean energy. However, regions rich in renewable resources are often geographically separated from major load and economic centers, showing an inverse distribution pattern. For example, most of China’s installed wind power and photovoltaic capacity is concentrated in the inland northwestern and northeastern parts of the region, but the load’s center is mainly located in the eastern coastal areas. From the perspective of sustainable development, the construction and operation of AC/DC hybrid grids provide essential technical support for the large-scale utilization of renewable energy, reducing the reliance on fossil fuels and lowering carbon emissions [1]. A well-evaluated and reasonably operated AC/DC hybrid grid can significantly enhance the overall efficiency, flexibility, and resilience of the power system, thus contributing to the realization of long-term energy sustainability goals. Therefore, large-scale integration of renewable energy into the power grid requires the use of ultra-high-voltage direct current (UHVDC) transmission technology to enable effective consumption. The hybrid AC/DC grid realizes long-distance and large-capacity power transmission, but it also brings challenges to the planning and stable and safe operation of the grid. Therefore, there is an urgent need to establish a set of scientific and effective evaluation models for the rationality of AC/DC hybrid grids’ operation modes.
Comprehensive evaluation theory is a methodology that uses mathematical models to evaluate complex systems or things across multiple dimensions and factors. It combines a variety of evaluation indicators and methods to comprehensively and objectively conduct a comprehensive analysis of the evaluation object so as to draw reasonable conclusions. The comprehensive evaluation theory has been applied in the field of electric power systems. For example, ref. [2] evaluated the current status of national power development with regard to four aspects, namely power supply, electricity consumption, electrification level and carbon emissions, and evaluated and analyzed the power development of 11 countries. The research in [3] considered the correlations among indicators and provided a comprehensive evaluation of the quality of power. Another study [4] involved a comprehensive evaluation of the planning and design of a self-sustaining wind power energy system for ports based on the integrated development of clean energy systems, and the practicality of the methodology was confirmed by the results from evaluating a wind power demonstration project in a container port terminal. In [5], a comprehensive evaluation of the coordinated development of regional power grids and renewable energy sources was carried out and an evaluation index system for renewable energy sources and traditional power grids’ development was designed, and examples were used to verify the accuracy of the evaluation model. In [6], a comprehensive method for evaluating distributed energy systems in terms of economic, energy, and environmental criteria was proposed. In [7], a comprehensive evaluation of a combined cooling, heating, and power system coupled with wind and solar energy was carried out, and a multi-objective comprehensive evaluation model based on the fuzzy analytical hierarchy method, anti-entropy power, and game theory was proposed. The study in [8] proposed an evaluation index system for the reliability of a distribution network’s engineering, considering multi-energy synergy and the corresponding comprehensive evaluation method. The effectiveness of the proposed evaluation index system and method in assessing the resilience of the distribution network, considering multi-energy coordination, was verified. In [9], the sustainability of grid construction projects was comprehensively evaluated using a total of 17 indicators in four dimensions: economic, technological, social, and environmental. Another study [10] established an evaluation model for smart grids’ level of development, combining weight correction, transfer mechanisms, and subjective and objective weights from the perspective of the differentiation of development needs to quantitatively examine the development level of regional smart grids and to provide a useful reference for their development. However, there are fewer studies on the comprehensive evaluation of the grids’ operation mode, especially AC/DC hybrid grid operation modes.
The process of preparing a grid’s operation mode includes the generation of a typical mode, a comprehensive evaluation of the mode, optimization and adjustment of the mode, and other steps, in which the evaluation of the grid’s operation mode is an important part. To achieve a scientific and accurate evaluation of the grid, one of the first steps is to build a comprehensive and reasonable index system with physical significance for practical engineering, and the second is to use a scientific method for combining the index data to enhance the observability of the results of evaluating the operation mode. Evaluation index systems for power grids have been partly studied. Considering the source, network, and load level comprehensively, the authors of [11] proposed key indexes from the power-source side, the grid side, and the load side, but the index system did not consider the stability of the system from the transient point of view. In [12], the framework of a multi-dimensional evaluation index system based on time was proposed for the operation of a grid with a high proportion of new energy, and a multi-dimensional analytical model for such systems, including four indexes of multi-temporal volatility, confidence level, multi-temporal complementarity, and characteristics of the peak load, was established. The study in [13] established an index system that extracted calculations based on voltage-reactive DC currents and assessed transient stability from three dimensions, namely safety, stability, and economic performance, but the index system had fewer indexes for transient stability and was unable to comprehensively measure the system’s capacity for transient stability. None of the studies cited above evaluated grids containing DC. For AC/DC hybrid grids, ref. [14] constructed a comprehensive evaluation index for reliability that accounted for the operational safety and operational efficiency of DC equipment, but it did not consider the mutual influence between the AC system and DC transmission nor the impact of faults such as DC block, DC system commutation failure, and DC line-to-ground fault [15] on the AC system’s stability and performance. The study in [16] put forward six evaluation indexes for AC/DC hybrid grids and proposed improvement measures for problems that may be revealed by the comprehensive evaluation, but the proposed index system was not sound enough, and the coupling situation of AC and DC was not explored in depth. Moreover, the index system was not complete enough. In [17], a comprehensive evaluation of AC/DC hybrid systems was established by analyzing the impact of AC/DC faults on the AC/DC hybrid system and the structural characteristics of the system.
Another major research component of comprehensive evaluation is the selection of appropriate evaluation methods, which typically include two categories: methods for determining the indicators’ weights and methods for integrating indicator data. Commonly used weighting methods include Analytic Hierarchy Process (AHP) [18], Entropy Weight Method (EWM) [19], DEMATEL method [20], and CRITIC method [21], etc. The most commonly used methods for combining the indicators are fuzzy comprehensive evaluation methods [22], Multi-criteria Optimization and Compromise Solution Ranking (VIKOR) [23], and Technique for Order of Preference by Similarity to Ideal Solution (TOPSIS) [24]. Most of the existing research combines two or more evaluation methods to deal with multi-objective decision-making problems. For example, ref. [25] combined fuzzy theory with DEMATEL analysis to evaluate the key influencing factors of the transformation of Chinese coal power enterprises. The study in [26] proposed a comprehensive evaluation method for the reliability of renewable energy based on the improved DEMATEL method, hierarchical analysis, and the entropy weight method. In [27], the authors proposed the Fuzzy Best–Worst Method (FBWM)–TOPSIS method for identifying critical feeders in a distribution system. The authors of [28] proposed a model for evaluating black-start scenarios in power systems after an outage combining the Analytical Hierarchy Process, Principal Component Analysis (PCA), CRITIC, EWM for the optimal combination of weights, and an improved VIKOR method. In [29], an evaluation of a thermal management system for a heat pipe-cooling battery based on fuzzy gray relational analysis was carried out. In addition, evaluation methods can be integrated with deep learning methods, such as Long Short-Term Memory (LSTM) [30], Convolutional Neural Network (CNN) [31], and Deep Belief Network (DBN) [32], to extract features from complex power grid operation data and to derive evaluation results. However, these methods demand large volumes of high-quality data and stricter measures for maintaining the confidentiality and security of the information.
From the existing literature on the evaluation of grid operation modes and the use of comprehensive evaluation methods, it can be seen that current comprehensive evaluations of the operation mode of AC/DC hybrid grids are less frequent. Given this background, this study took the AC/DC hybrid grid as the main object of investigation and carried out research on and a comprehensive evaluation of the index system for the grid’s operation mode. This research aims to support the coordinated development of renewable energy and DC transmission technologies by providing a systematic framework for evaluating operation modes. The study is expected to facilitate large-scale renewable energy integration, to contribute to the engineering and planning of new energy projects, and to enhance the long-term sustainability and stability of the power grid. The main contributions of this paper are summarized as follows:
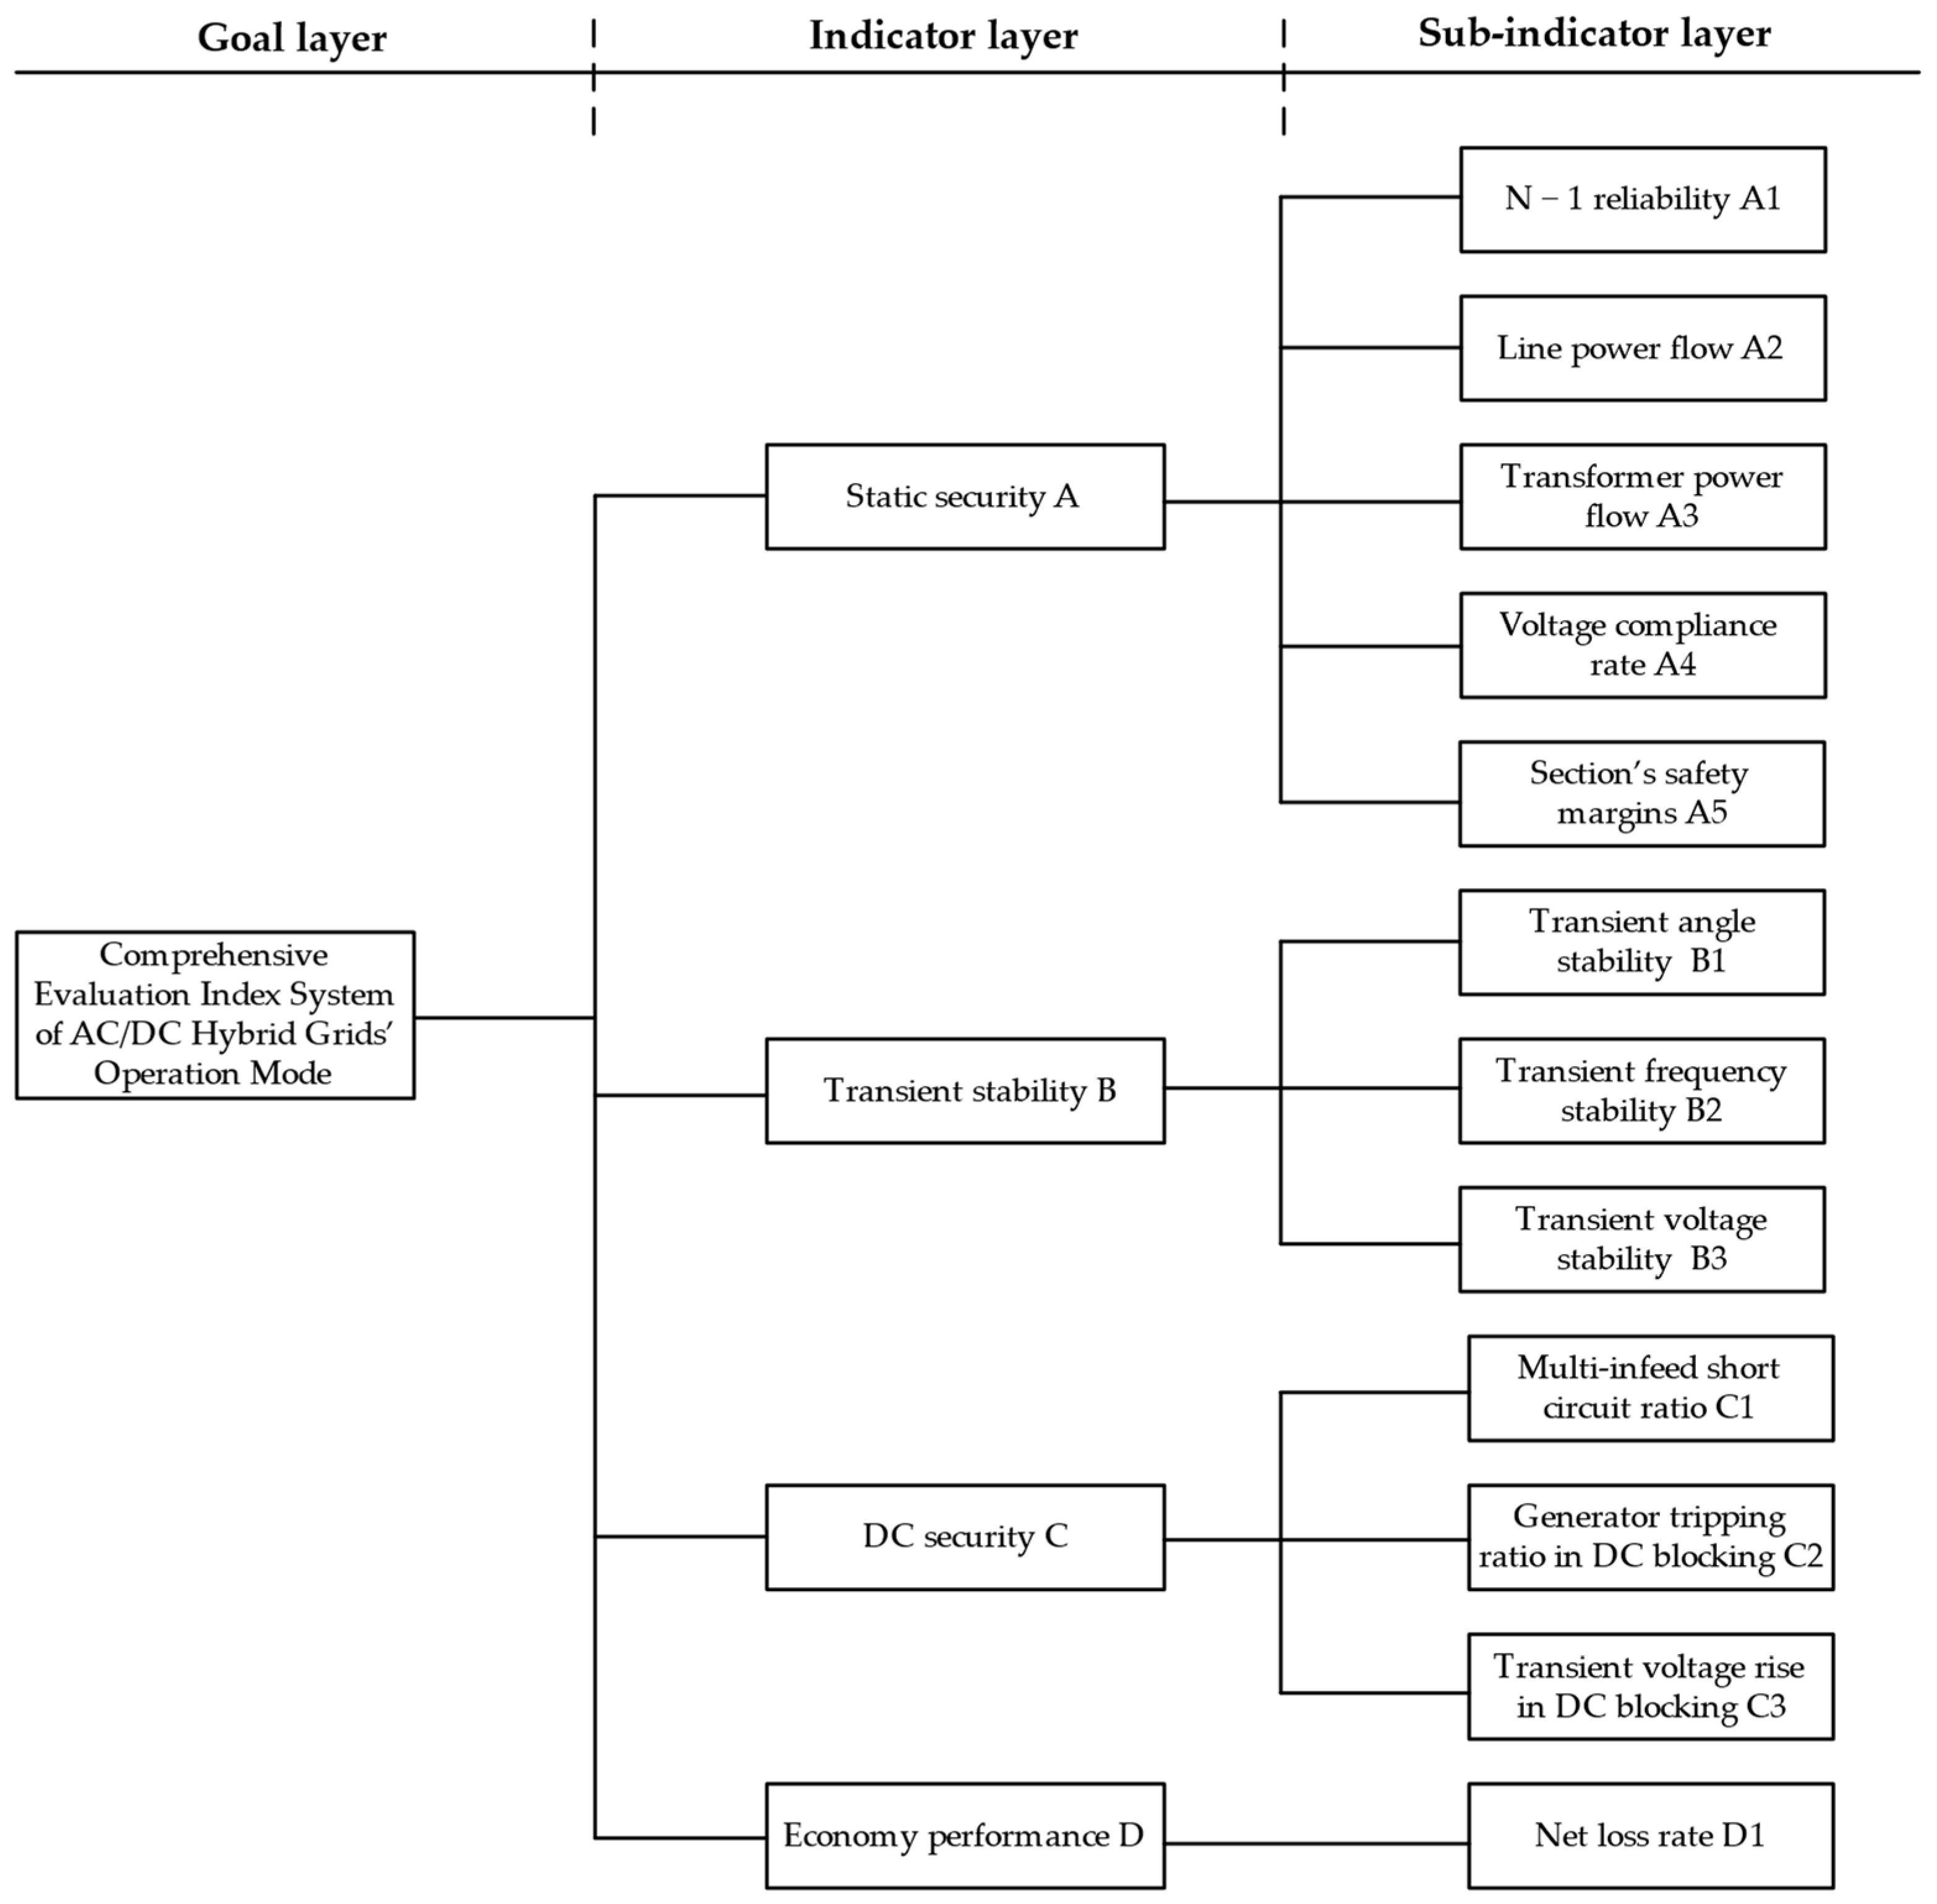
  • A multi-level evaluation index system for AC/DC hybrid grid operation modes, including static security, transient stability, DC security, and economic performance, was established, which accounted for the actual needs of mode developers in power systems’ operation and established calculation formulas or improved the traditional calculation formulas for each evaluation index.
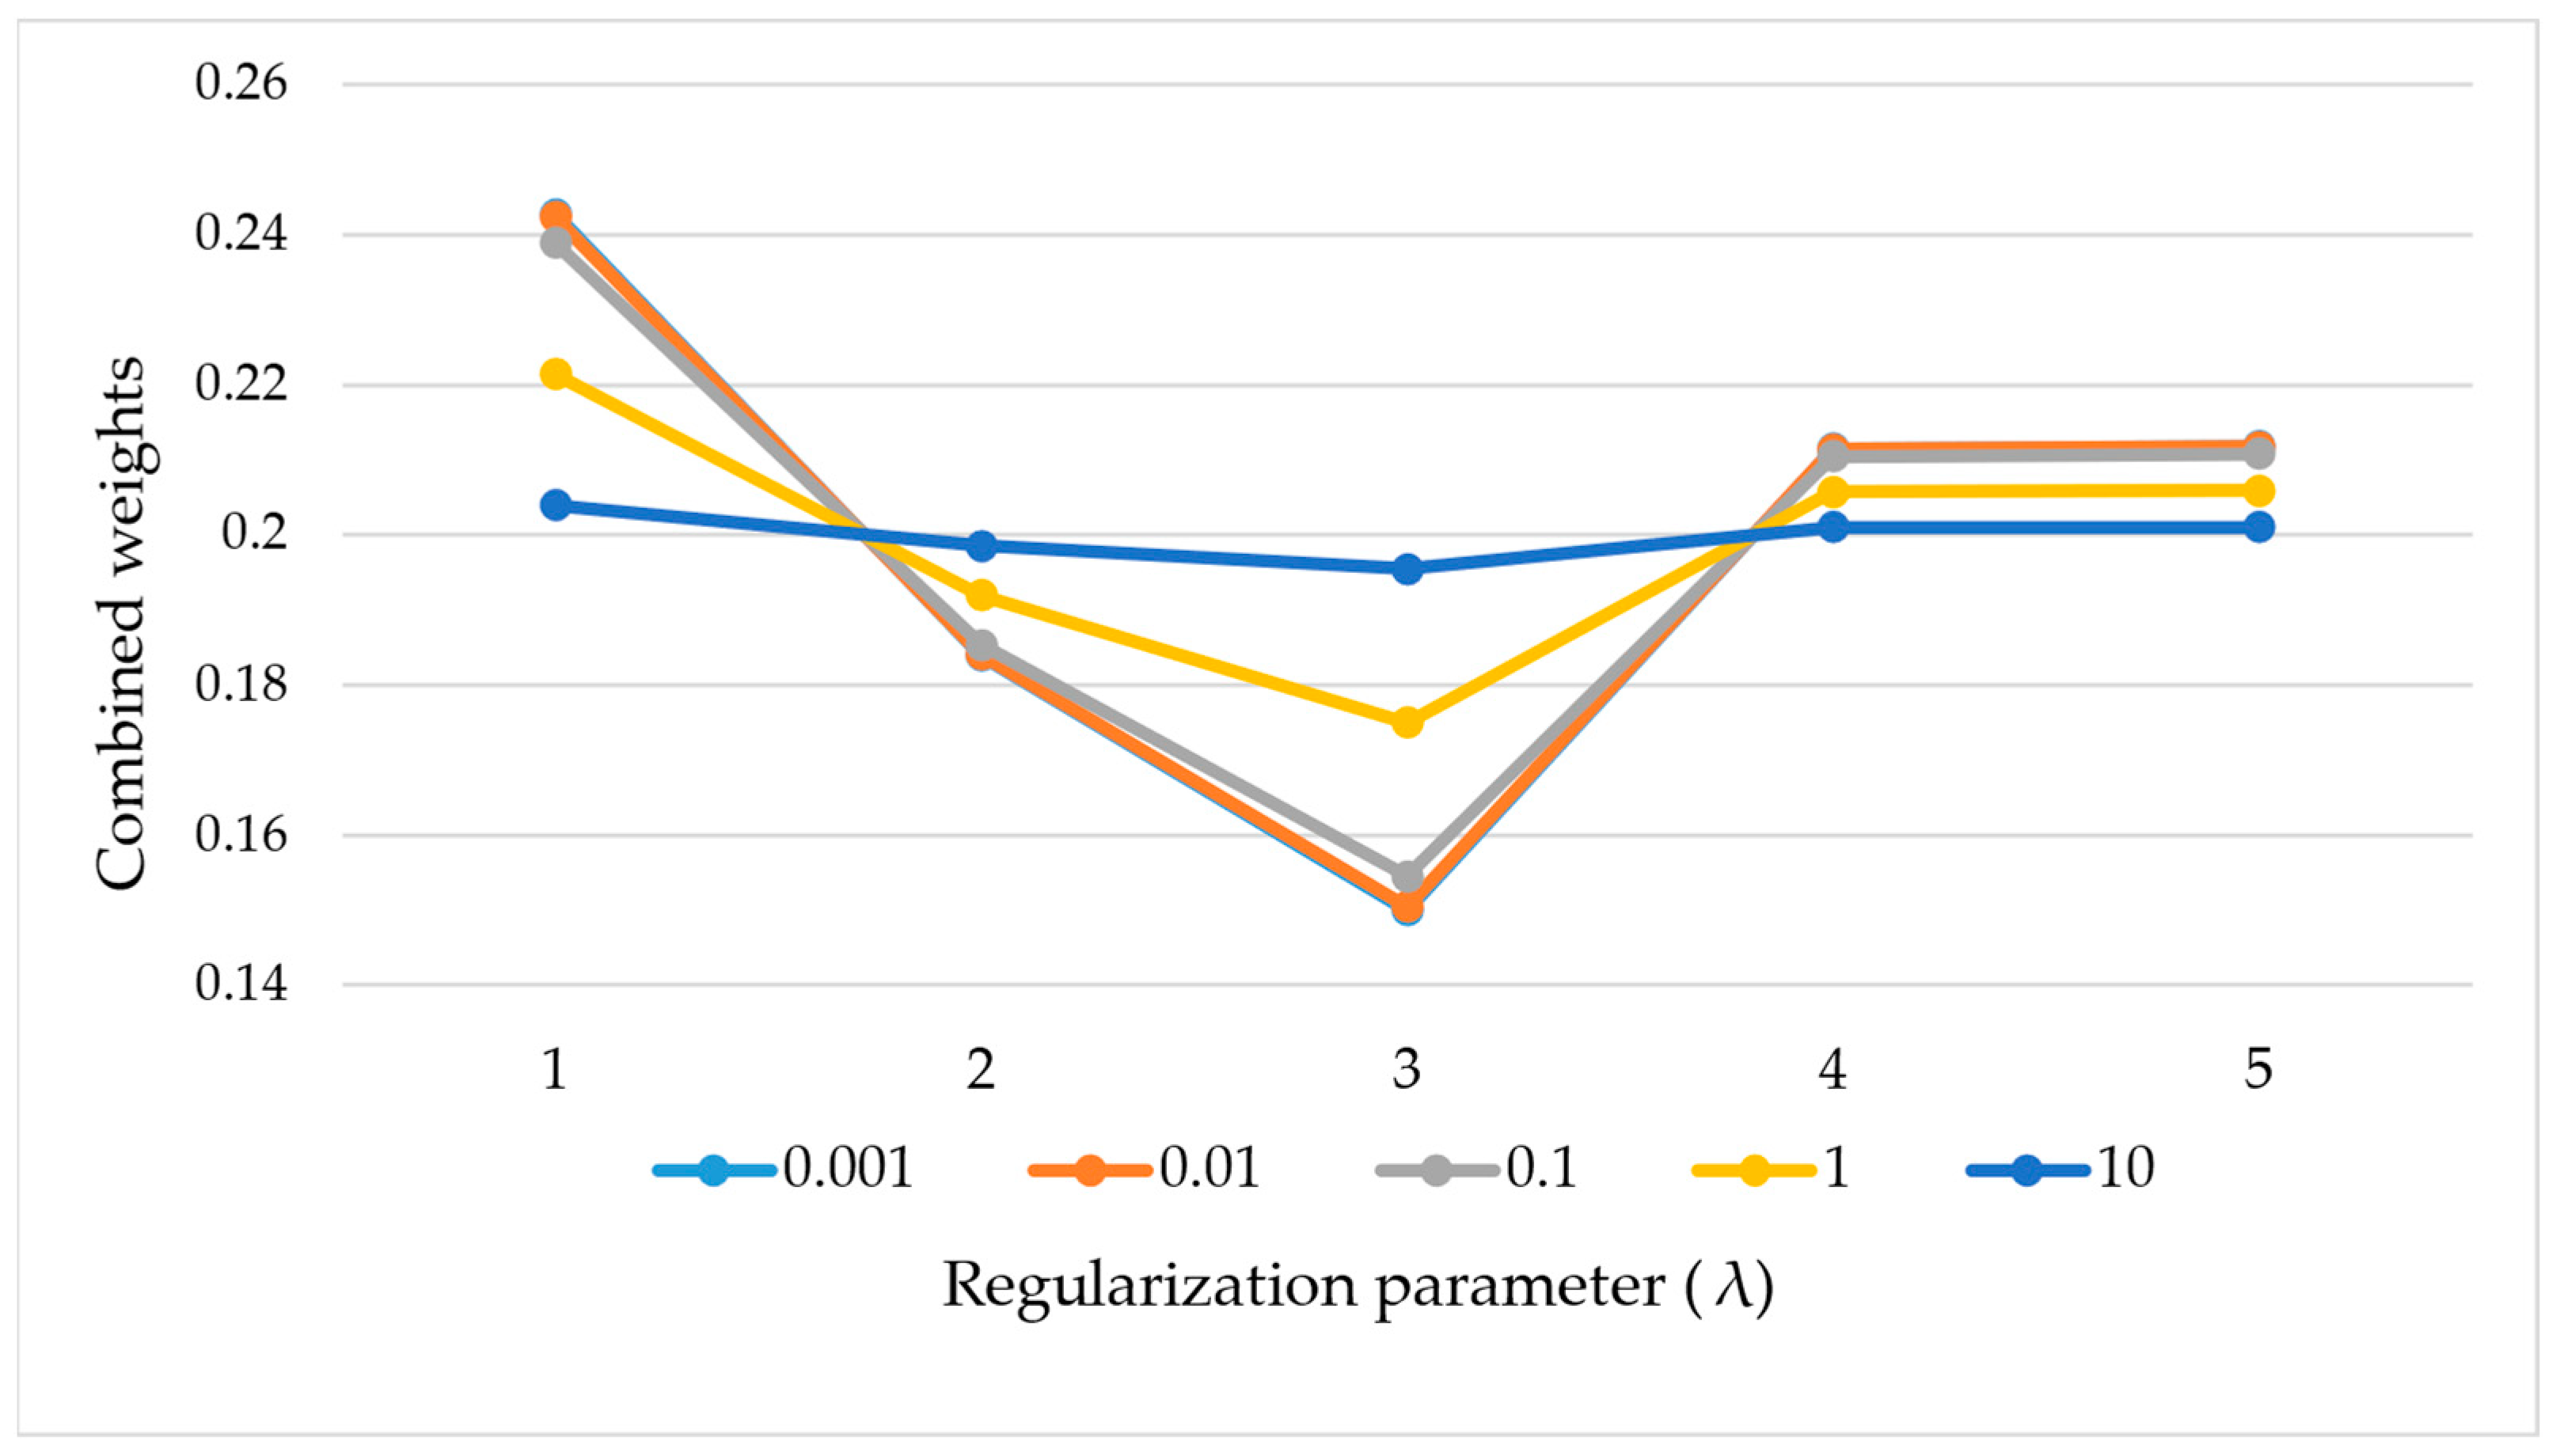
  • An evaluation model of AC/DC hybrid grid operation modes was constructed. Firstly, subjective and objective perspectives were used to calculate the weights of the evaluation indexes at each level by employing the DEMATEL and CRITIC methods, and L2 regularization was introduced to optimize the results of different weighting methods. The calculation of the evaluation indexes not only achieved the purpose of combining the subjective and objective aspects but also successfully avoided the disadvantage of excessive imbalances in the integrated weighting. The multi-level gray relational analysis method was introduced and integrated with the comprehensive weights, and the results of the comprehensive evaluation were obtained layer by layer from the bottom up.
  • This paper analyzed the relationship between the operating modes’ characteristics and the results of the comprehensive evaluation based on the actual operation law of the power grid and the physical meaning of the proposed index system, and then compared the results through the application of the traditional evaluation model using different weighting methods.
The remainder of this paper is organized as follows: Section 2 constructs an evaluation index system for AC/DC hybrid grid operation modes and describes the calculation method of the indexes. Section 3 establishes a hierarchical analysis and evaluation model of power grids’ operation modes. Section 4 uses real grid data to simulate and compare the operation mode evaluation index system and the model established in this paper. Finally, Section 5 concludes the study.

2. Evaluation Index System for AC/DC Hybrid Grid Operation Modes

The construction of an indicator system is the basis for comprehensive evaluation. Whether the indicator system is perfect or not directly determines the credibility of the comprehensive evaluation model, so the establishment of the indicator system should abide by the principles of comprehensiveness, comparability, ease of understanding, and ease of access. Secondly, the indicator system should be able to objectively, scientifically, and reasonably reflect the problems in the study.
In order to ensure that the evaluation of operation modes was practical and feasible and that the conclusion was scientific and reasonable while, at the same time, solving the needs of system stability, safety, and the coupling of AC/DC systems, which were more important to the preparation of the operation mode in the actual engineering, this study divided the planning of and evaluation index system for AC/DC hybrid grid operation modes into four parts: static security, transient stability, DC security, and economic performance. The comprehensive evaluation index system for the AC/DC hybrid grids’ operation mode is shown in Figure 1.
See Appendix A for the formulae for the specific indicators.

2.1. Static Security

1.
N − 1 reliability
The main criterion for an analysis of a power system’s static safety is that the remaining lines and transformers in the whole network are not overloaded after disconnecting any element (usually lines and transformers) and that the system’s bus voltage does not exceed the limit. This is used to check whether the structural strength of the grid and the operation mode meets the requirements for safe operation.
2.
Line power flow
For large-scale power grids, using only the average line load factor cannot reflect the situation of a heavy load or overload in some lines. In order to comprehensively reflect the average level of all lines’ loads and the unevenness of the loads among lines, the mean value μ and the standard deviation σ of the line load factor were used to compare and quantify the calculation of the line power-flow index through the cumulative distribution function.
3.
Transformer power flow
Indicators of the trends of transformers and lines are similar, as both use the cumulative distribution function to quantify the calculation, but in an actual power grid, transformers tend to have a stronger trend, so this study quantified lines and transformers separately.
4.
Voltage compliance rate
The voltage compliance rate mainly reflects the voltage pass level of the operating point and can globally reflect the quality of the operating voltage of the node.
5.
Section safety margin
The safety margin of a transmission section is the difference between the ultimate transmission capacity of the section, accounting for the thermal stability limit and the temporary stability limit, and the active power flow of the section. In this study, in order to comprehensively consider the security margin of multiple sections, each section was assigned a weight according to the section’s ultimate transmission capacity. Usually, the smaller the section’s ultimate transmission capacity, the more likely it is that thermal or temporary instability will occur, so sections with a small ultimate transmission capacity were assigned greater weights.

2.2. Transient Stability

1.
Transient angle stability
The AC stability of the calibration system should be considered in the most unfavorable location of metallic short-circuit faults. For the transient stability of AC-related indicators, this study selected three-phase grounded short-circuits by traversing the entire network of AC faults.
The power-angle stability index reflects the possibility of a swing in a generator’s power angle caused by an accident and the degree of harm caused. The difference in the power angle between generators is the basic index of a power system’s transient stability criterion, taking the maximum power-angle offset in the line. The stability level of this index is negative, as the larger the index, the larger the power-angle’s offset and the greater the harm caused to the safe operation of the system.
2.
Transient frequency stability
The frequency stability indicator reflects the likelihood of the generator undergoing a frequency shift caused by accidents in the power system and the degree of harm caused. After the power system suffers a large disturbance, there is a large imbalance between generation and the load demanded, which causes a frequency shift. The maximum frequency shift in the line is taken.
3.
Transient voltage stability
The criterion of the grid’s voltage stability is that the load bus voltage can be restored to above the specified operating voltage during transient and dynamic processes after the power system is disturbed. Therefore, in this study, the recovery level of the bus voltage near the fault point was selected to quantify the transient voltage stability index.

2.3. DC Security

1.
Multi-Infeed Short-Circuit Ratio (MISCR)
The multi-infeed short-circuit ratio index is an extended concept of the traditional short-circuit ratio, which is used to assess the impact of multiple high-voltage direct current (HVDC) transmission system feeders in the power system on the stability of the system, and it was included in the comprehensive consideration of the coupling effect between the various HVDC transmission systems and their overall impact on the stability of the power grid.
2.
Generator tripping ratio in DC blocking
After DC blocking occurs in a large-capacity DC transmission line in an AC/DC hybrid system, a large amount of unbalanced power accumulates at the sending end, which can cause serious consequences, such as increased frequency at the generator end and differences in the power angle between units, etc. In order to ensure the safe and stable operation of the power grid, safety and stability control measures are used to prevent the destruction of the power system’s stability, eliminate asynchronous operation states, limit the increase in frequency, and limit the overloading of equipment. Emergency cut-off control is one of the commonly used means to ensure the transient stability of the power grid.
The cut-off strategy adopted in this study refers to the principle of formulating a safety and stability control strategy in actual situations, and the cut-off strategy was formulated by first removing hydropower units, then wind power units and, lastly, thermal power units. At the same time, the cutter should be considered according to the principle of proximity as well as of retaining a unit at each cut-off point (except for wind power). On this basis, this study adopted the quantification of the unbalanced power of the DC-blocking cutter to determine the minimum number of cutters needed to make the system stable on the basis of the electrical distance. Based on this principle, this study uses the unbalanced power resulting from DC blocking to quantify the evaluation indicator, and determines the generator shedding sequence according to electrical distance, so as to identify the minimum total generation capacity that needs to be removed to stabilize the system.
3.
Transient voltage rise in DC blocking
When a DC-blocking fault occurs, the converter station stops working, and a large amount of reactive power compensated for by the AC filter at the sending bus accumulates near the DC bus, causing a sudden rise in the nearby bus voltage. There is a high-voltage ride-through problem in wind farms, and this study proposes the maximum transient voltage rise of the DC blocking bus to quantify it.

2.4. Economic Performance

1.
Net loss rate
The ratio of the total network losses of the grid to the overall level of the generator’s output across the grid was defined as the net loss rate.

3. Methods

3.1. Combination Weighting Approach

3.1.1. Data Normalization

Due to the differences in the meaning and magnitude of the indicators in the evaluation system for a grid’s operation mode, these need to be normalized to ensure a reasonable evaluation. In this study, the ideal-point approximation method was used to transform the value of the indicators to the [0, 1] interval, as shown in Equation (1):
x i j = x i j x j x j + x j
where x i j is the normalized value of the data for the j th indicator of Scenario i , and x j + and x j are the positive and negative (usually unachievable) ideal solutions for the j th indicator, respectively.

3.1.2. Determination of Combined Weights

1.
Subjective weights
Decision-making Trial and Evaluation Laboratory (DEMATEL) analysis is a method of applying graph theory to the analysis of a system. By analyzing the logical relationship between elements in the system and the direct influence matrix, each element’s degree of influence on and the degree of being influenced by the other elements can be calculated, so that the degree of importance of each element in the system can be further analyzed. Firstly, based on the relationships among the indicators, the direct influence matrix was constructed and standardized.
A = a i j = 0 a 12 a 1 n a 21 0 a 2 n a n 1 a n 2 0 X = A / max i = 1 n a i j , j = 1 n a i j 1 i , j n
where A represents the direct influence matrix; a i j 0 , 1 , 2 , 3 , 4 represents the degree of influence of Indicator i on Indicator j in the direct influence matrix A , for which the value corresponds to the degree of influence (i.e., “no influence”, “mild influence”, “moderate influence”, “strong influence”, and “very strong influence”, in ascending order); and X is the standardized influence matrix. Next, based on the standardized impact matrix, a comprehensive impact matrix was calculated.
T = X + X 2 + + X k = k = 1 X k T = X 1 X 1 , k = 1 , 2 , , n
The elements could be obtained from the integrated impact matrix
D i = j = 1 n t i j C i = j = 1 n t j i M i = D i + C i
where t i j is the element of the i th row and j th column in the total impact relationship matrix T , and D i and C i are the degree of impact and the degree of being impacted by Indicator i in the indicator system, respectively. The centrality M i integrally reflects the importance of the indicator in the system; the larger the centrality, the more important the indicator.
Finally, the subjective weights assigned by the DEMATEL method w 1 i were determined based on the centrality M i as follows:
w 1 i = M i / i = 1 n M i
2.
Objective weights
The Criteria Importance Through Intercriteria Correlation (CRITIC) method calculates objective weights through the difference in the information contained in the numerical values of the indicators, which can fully express the differences and conflicts among the indicators. The difference in the indicators is expressed by the standard deviation; the larger the standard deviation, the larger the difference in the numerical values of the indicator and the more information it contains, and thus the greater the weight that should be assigned to it. Pearson’s correlation coefficient was used to describe the conflict between indicators; the larger the correlation coefficient, the less the indicator conflicts with other indicators (i.e., the more the information it reflects overlaps with the content of other indicators), and its weight should be reduced.
Each indicator’s variability was calculated by the formula
S i = j = 1 n b i j b ¯ i / n 1
where b i j is the element of the j th column of the i th row of the normalized indicator matrix, and b ¯ i is the average of the i th row of the normalized indicator matrix.
The formula for calculating the conflicting nature of the indicator is
R i j = j = 1 n 1 r i j
where r i j is the Pearson’s correlation coefficient for the i th indicator and the j th indicator.
The amount of information contained in the i th indicator can be calculated as C i :
C i = S i × R i j
Then the objective weight of the i th indicator w 2 i is
w 2 i = C i / i = 1 n C i
3.
Combined weights
In order to balance the subjective and objective differences between the indicators to derive the optimal integrated weights, an integrated weight optimization model based on ridge regression was established. The specific constraint function is shown in Equation (10):
min i = 1 n w i 1 2 w 1 i + w 2 i 2 + λ w i 2
where w i , w 1 i , and w 2 i are the composite, subjective, and objective weights, respectively, and λ is the regularized intensity parameter.

3.2. Multi-Level Gray Relational Integrated Evaluation Methodology

The multi-level gray relational evaluation method [33] is a multi-level decision analytical method based on gray system theory. The core idea of the method is that the degree correlation of the evaluation object can be determined by establishing the similarity between the data sequence of the evaluation objects and the ideal target, thus achieving the ranking and selection of the evaluation objects. In this study, this data-to-data mapping relationship was used to establish the evaluation model of the system containing the operation mode of a DC power network.
The steps used to apply the multi-level gray relational method for the comprehensive evaluation were as follows:
Step 1: Determining the set of reference sequences X . The evaluation index system for the grid’s operation mode defined in the previous section was obtained as a comparison sequence X , and the reference sequence for each index layer X was determined according to actual engineering experience and theoretical guidance, denoted as
X i = x 1 i , x 2 i , , x n i X = x 1 , x 2 , , x n
where x k i k = 1 , 2 , , n is the actual calculated value of the k th indicator in the i th scenario, i is the number of comparison series, and x k k = 1 , 2 , , n is the optimal reference value of the k th indicator.
Step 2: Calculating the gray relational degree. The relational coefficient between the indicator of the program and the reference value of the indicator was calculated as follows:
ξ i , k = min i min k x k x k i + ρ   max i max k x k x k i x k x k i + ρ   max i max k x k x k i
In this formula, min i min k x k x k i and max i max k x k x k i represent the minimum absolute difference and the maximum absolute difference, respectively; ρ is the resolution coefficient, where ρ 0 , 1 , which serves to regulate the sensitivity of the correlation. When ρ = 0 , the formula for the gray relational degree becomes ξ i , k = min i min k x k x k i / x k x k i . At this point, the relational degree depends entirely on the actual gap between the evaluation object and the reference target, but this kind of value may result in the difference between different objects not being obvious. When ρ = 1 , the gray relational degree formula becomes ξ i , k = min i min k x k x k i + max i max k x k x k i / x k x k i + max i max k x k x k i . In this case, the difference between the evaluation objects will be amplified, thus making the small gap reflected in the correlation more obvious. Even if the performance of the two evaluation objects is similar, the final gray relational degree may be significantly different due to the magnification of the differences. Therefore, in order to account for the reasonableness of the differences and the stability of the results, this study used ρ = 0.5 .
The association coefficient matrix R for a single tier can be constructed from ξ i , k , and the aggregation of the weight vectors obtained in Section 3.1 yields a composite evaluation result for a single tier
E = R × W
where W = w 1 , w 2 , , w n T is the combined weight of the n evaluation indicators.
Step 3: Calculating the multi-level gray relational degree. A single-level gray relational degree calculation, as described in Step 2, is carried out for the sub-indicator layer, and the relational degree matrix of the sub-indicator layer is used as the evaluation matrix of the indicator layer, again using Section 3.1 to obtain the combined weights of the indicator layers, which, in turn, can lead to the relational degree matrix of the mode of operation.

4. Results and Discussion

4.1. Introduction to the Power Grid

For this study, we took a regional power grid as an example. By the end of 2023, the region had conventional units with an installed capacity of 107,118.5 MW and new energy with an installed capacity of 54,293.45 MW, of which the wind power’s installed capacity was 45,137.75 MW and the photovoltaic power’s installed capacity was 9155.7 MW. The region’s power grid has 276 units of 500-kilovolt two-winding/three-winding main transformers with a total capacity of 227,235 MVA and 277 500-kilovolt overhead lines; 732 units of 220-kilovolt two-winding/three-winding main transformers with a total capacity of 124,550 MVA and 2285 220-kilovolt overhead lines; three two-terminal DC systems with rated capacities of 720 MW, 2000 MW, and 3000 MW, respectively; one LCC converter station; and one ± 800 kV ultra-high voltage direct current (UHVDC) unit with a rated capacity of 10,000 MW (UHVDC is primarily considered in the context of subsequent DC faults). The peak, flat, and valley loads of the whole network were 68,469 MW, 53,834 MW, and 37,370 MW, respectively.
In this study, three load levels (valley, flat, and peak) as well as three different UHVDC transmission powers with a total of nine modes of operation were selected for evaluation with a view to verifying the reasonableness of the methodology proposed in this study. The data on the operation mode were obtained using the method proposed in [32].

4.2. Engineering Realization of the Indicator System

The steps for implementing the evaluation index system for a grid’s operation mode mainly included two stages: basic data preparation and calculation of the indexes. The basic data included the grid’s structure, static safety data, power-flow data, fault data, disturbance data, and stability data. The calculation of the indexes included six parts, including the power-flow calculation module, the static safety analysis module, the transient stability fault calculation module, the transient stability disturbance calculation module, the single cross-section transmission-limit calculation module, and the generator-tripping scheme generation module. Of these, the first four modules were based on the Power System Analysis Software Package (PSASP, version 7.82), compiled by the China Electric Power Research Institute, and the last two modules were based on Python (version 3.12.3), which realized the calculation function of the main index system. The engineering realization block diagram is shown in Figure 2.

4.3. Simulation Verification

The nine modes selected in this study were 6000 MW, 8000 MW, and 10,000 MW of UHVDC transmission power and the corresponding three load levels. Table 1 shows the raw data of the nine operation modes, calculated according to the indexes defined in this study.
1.
Standardization
According to Equation (1), the normalized data matrix of the operational mode evaluation indicators X can be derived as follows:
X = 0.9821 0.8588 0.6959 0.9714 0.4310 0.7115 0.9836 0.9896 0.4855 0.1853 0.5936 0.9619 0.9891 0.7978 0.6539 0.9334 0.2221 0.6753 0.9843 0.9900 0.5064 0.2938 0.6400 0.9609 0.9901 0.7466 0.6161 0.9313 0.1738 0.7025 0.9835 0.9845 0.5381 0.3470 0.6529 0.9600 0.9940 0.8614 0.7228 0.9725 0.5089 0.7244 0.9878 0.9888 0.8246 0.3316 0.8017 0.9733 0.9970 0.8004 0.6772 0.9535 0.2816 0.6875 0.9881 0.9899 0.8762 0.4883 0.8344 0.9698 0.9881 0.7492 0.6363 0.9329 0.2280 0.7123 0.9864 0.9840 0.9333 0.6416 0.8421 0.9668 0.9940 0.8597 0.7123 0.9867 0.4237 0.7170 0.9849 0.9892 0.6161 0.2366 0.6955 0.9685 0.9970 0.7990 0.6681 0.9614 0.2141 0.6802 0.9846 0.9900 0.6486 0.3553 0.7409 0.9662 0.9881 0.7480 0.6286 0.9345 0.1721 0.7063 0.9834 0.9847 0.6845 0.4778 0.7488 0.9641
2.
Calculation of weights
The static safety indicators were evaluated according to the focus and experience of the developers of the actual project, and the subjective and objective weights of the static safety derived from the DEMATEL method are
w D E M A T E L , S S = 0.0862 0.1998 0.1841 0.2800 0.2499
The objective weights for calculating static security based on evaluation of the grid’s indicator data are
w C R I T I C , S S = 0.3994 0.1680 0.1158 0.1430 0.1738
Regularization pushes the weights toward smaller values, preventing any single weight from dominating the others. This leads to a more evenly distributed set of composite weights, which can improve the overall stability of the model. However, excessive regularization can under-represent key indicators, making it difficult to assess their true significance. To ensure that key indicators remain meaningful, careful tuning of the regularization strength is essential. As shown in Figure 3, this paper selected five regularization parameters. To avoid excessive regularization, the value of the regularization parameter was set to 0.1, and the optimal synthesis of subjective and objective weights through Equation (10) yielded a comprehensive weight vector for static security:
w S S = 0.2389 0.1854 0.1545 0.2104 0.2108
Similarly, the subjective and objective weights of transient stability and the DC security could be obtained with the integrated weight vector, and the weight of each evaluation index is shown in Table 2.
Economic performance had only one sub-indicator; therefore, no weights were calculated for the economic performance sub-indicator.
3.
Evaluation and analysis of operational modalities
On the basis of the results of the weighting calculations above, the results of assessing the nine layers of operational mode indicators could be derived through the gray relational evaluation model, as shown in Table 3.
As can be seen from Table 3, when the load level is certain, the overall performance of the operation mode with low DC power is better than that of the operation mode with high DC power; this was analyzed from the three aspects of the established indicator system in combination with more detailed indicator data. Firstly, regarding static safety, when the DC transmission power is higher, more power will be gathered to the DC sending end, resulting in an unbalanced distribution of the power flow in the whole network, and the scores of the line and transformer power flow will be lower than those for low DC power. At this point, the economic performance will be reduced; at the same time, the sectional load of the whole network will be larger, making the section’s safety margin narrower. From the results of the evaluation of transient stability, there are usually some problems near the converter station when the power of the DC transmission is higher. According to the results of evaluating the transient stability, there are usually more new energy-generating units put into the system near the converter station, which makes the inertia of the system lower; at the same time, due to the change in the power flow’s distribution within the system, some AC transmission lines are overloaded, which increases the risk of line overload and instability. From the DC security point of view, there is a large amount of surplus power in the sending end of the system after DC blocking due to a fault, and a large amount of active power concentrated in the rectifier side will make the frequency of the generating units at the sending end increase; thus, the frequency of the generating units at the sending end will increase due to faults. The frequency of the generator set will increase due to the AC filter and capacitor bank’s casting and cutting strategy not being fast enough. The delay in cutting is more than 100 ms, which will cause a large amount of surplus reactive power to be fed into the AC system at the sending end, causing serious transient over-voltage at the converter bus of the rectifier station, which will further cause a sudden rise in the voltage of the wind turbine at the sending end of the power grid. Therefore, more DC transmission power requires more units to be cut off and results in larger transient voltage rises.
When the delivery of DC power is certain, the operation method with a large load scores lower than the operation method with a small load in terms of static security, transient stability, and economic performance, for reasons similar to those analyzed above. The performance of DC security is completely the opposite; the mode with a large load will perform better, mainly because the large load usually means that more generating units are online. Most of these generators will be thermal power units, and they are evenly distributed in the grid. The more generating units there are online, the greater the overall inertia of the system, and the more the inertia can resist the change in the frequency of the power system, which makes the system more stable when it is disturbed. Therefore, at high loads, a smaller amount of cutover after a DC lockout will restore the system’s frequency to a stable operating range. At the same time, there are more inductive loads in the system (e.g., electric motors and transformers), which have a stronger buffering effect on the rise in voltage, and the inductive loads absorb more reactive power when the voltage rises, which suppresses the transient voltage rise of the system to a certain extent.
In order to better study the indicators in the sub-indicator layers for each of the nine operational modalities, the normalized scores of the operational modalities for each of the indicators in the sub-indicator layers were compared. The results are shown in Figure 4.
We also compared the results of the gray relational analysis to evaluate each mode of operation at each indicator level, and the results are shown in Figure 5.
Subsequently, the weights of the indicator layer were obtained for the four indicators of static safety, transient stability, DC safety and economic performance, and the combined weights were determined to be
w D E M A T E L , B = 0.3361 0.3409 0.3084 0.0146 w C R I T I C , B = 0.1339 0.0241 0.6510 0.1910 w B = 0.2384 0.1880 0.4581 0.1155
The final results of the evaluation for the nine operating modes are shown in Table 4.
From the results of the comprehensive evaluation, it can be seen that the three modes of operation—D, E, and F—were obviously better than the other modes in the comprehensive evaluation, and modes A, B, and C had the worst performance, which corresponded to low DC power and high DC power, respectively. The results of the evaluation are in line with the objective law of small DC modes with high stability, good security, and low loss in the actual project. From the analyses above, it can be seen that the proposed evaluation system was able to evaluate a particular AC/DC hybrid grid’s operation mode in a more systematic and comprehensive way.

4.4. Comparison of Examples

In terms of setting the weights, the method of the traditional evaluation model is generally the entropy weight method, the basic idea of which is to determine the indicators’ weights according to the variability in the degree of orderliness of the information contained in the indicators. This cannot deal with indicators with strong correlations, nor can it account for the interactions between the indicators, and, therefore, it cannot adequately reflect the actual importance of the indicators. The CRITIC method not only considers the influence of the indicators’ variability but also considers the conflict between indicators. The indicators’ variability is reflected by the standard deviation; the larger the standard deviation, the larger the difference in the value between the models. The indicators’ conflict is based on Pearson’s correlation coefficient: if the two indicators have a strong positive correlation, the lower the conflict between the two indicators and the smaller the weights. A power system is a highly interconnected system, so there will be a certain degree of correlation between the indicators. Therefore, the indicators’ weights need to fully consider the conflict between the indicators and the variability, and thus the DEMATEL-CRITIC method is a more suitable subjective and objective weighting method. The weights of the indicator layer and sub-indicator layer in this study using the DEMATEL–entropy weighting method are shown in Table 5, and the final results of the DEMATEL–entropy weighting method are shown in Table 6.

5. Conclusions

In this study, a comprehensive evaluation model for the gray relational analysis of multi-dimensional indicators of AC/DC hybrid grid operation modes based on DEMATEL-CRITIC was proposed. For the complex problem of calculating evaluation indexes that are difficult to implement in engineering, an index calculation framework based on PSASP and Python was constructed, which enabled the evaluation system to effectively account for the complex problem of stability. For the case with many kinds of evaluation indexes of the operation mode and unclear correlations, a DEMATEL-CRITIC method that can weigh subjectivity and objectivity was adopted to account for the differences and correlations of the indexes in a simple way. This was combined with the gray relational analysis model to achieve the integrated evaluation of multi-dimensional indexes. The gray relational analysis model achieved the combination and calibration of multi-dimensional indicators. The results for the example used showed that the proposed method could comprehensively consider the needs of mode compilers and the practical requirements of engineering projects, enabling an objective and well-rounded evaluation of operation modes. This approach effectively improves the efficiency of operation mode compilation, reduces labor costs, and provides strong technical support for real-world power grid operations. Furthermore, by facilitating the scientific selection and evaluation of AC/DC hybrid grid operation modes, the method supports the reliable and efficient integration of renewable energy sources. It contributes to the enhancement of grid stability and operational efficiency, which are critical foundations for accelerating low-carbon energy transition and promoting the long-term sustainability of modern power systems.

Author Contributions

Conceptualization, B.Z.; methodology, B.Z. and H.Y.; writing—review and editing, B.Z. and H.Y.; funding acquisition, B.Z.; data curation, H.Y.; writing—original draft, H.Y.; investigation, C.L., Q.M. and Y.C.; project administration, B.Z. and Y.C. All authors have read and agreed to the published version of the manuscript.

Funding

This research was funded by the Science and Technology Project of State Grid: Research on artificial intelligence analysis technology of the available transmission capacity (ATC) of key sections under multiple power grid operation modes (grant number 5100-202255020A-1-1-ZN).

Institutional Review Board Statement

Not applicable.

Informed Consent Statement

Not applicable.

Data Availability Statement

The data presented in this study are available on request from the corresponding author.

Conflicts of Interest

Authors Chen Lv and Quan Ma were employed by the company China Electric Power Research Institute. Author Yong Cui was employed by the company State Grid Shanghai Municipal Electric Power Company. The remaining authors declare that the research was conducted in the absence of any commercial or financial relationships that could be construed as a potential conflict of interest.

Nomenclature

AcronymDefinition
AC/DCAlternating Current/Direct Current
DEMATELDecision-Making Trial and Evaluation Laboratory
CRITICCriteria Importance Through Intercriteria Correlation
EWMEntropy Weight Method
VIKORMulti-Criteria Optimization and Compromise Solution Ranking
TOPSISTechnique for Order of Preference by Similarity to Ideal Solution
FBWMFuzzy Best–Worst Method
AHPAnalytical Hierarchy Process
PCAPrincipal Component Analysis
LSTMLong Short-Term Memory
CNNConvolutional Neural Network
DBNDeep Belief Network
HVDCHigh-Voltage Direct Current
UHVDCUltra-High-Voltage Direct Current
PSASPPower System Analysis Software Package

Appendix A

1.
N − 1 reliability
In this study, we used the percentage of schemes out of the A (N − 1) calibration schemes, which was defined as the (N − 1) reliability, as shown in Equation (A1).
N R I = A p a s s A × 100 %
where A p a s s is the number of (N − 1) programs adopted, and A is the total number of (N − 1) programs.
2.
Line power flow
The line power flow is shown in Equation (A2)
L F I = ( 1 μ l ) 1 1 σ l 2 π e ( r μ l ) 2 2 σ l 2 d r
where μ l is the mean of the line load factor, σ l is the standard deviation of the line load factor, and r is the independent variable.
3.
Transformer power flow
The calculation formula for the transformer power-flow indicator is shown in Equation (A3).
T F I = ( 1 μ t ) 1 1 σ t 2 π e ( r μ t ) 2 2 σ t 2 d r
where μ t is the mean value of the transformer load factor, σ t is the standard deviation of the line load factor, and r is the independent variable.
4.
Voltage compliance rate
The voltage compliance rate is shown in Equation (A4)
V C R I = N q N
where N is the total number of nodes, and N q is the number of nodes with qualified voltage. According to the Technical Guidelines for Power System Voltage and Reactive Power, the range of qualified voltage was set as [0, +10%] for a range of change in the busbar’s voltage of 220 kV and above in normal operation mode, while for a range of change in the busbar’s voltage of below 220 kV, it was set as [−3%, +7%].
5.
Sections’ safety margins
The index of the key sections’ safety margins defined in this study is shown in Equation (A5):
A T C i = T T C i E T C i W i = T T C i j = 1 m T T C j S S M I = i = 1 m A T C i × W i
where A T C , T T C , and E T C are the available transmission capacity, the total transmission capacity, and the existing transmission capacity of the section, respectively; W i is the weight of Section i .
6.
Transient angle stability
The transient power angle’s stability index is shown in Equation (A6)
T A S I = max e Ω E max i , j Ω G δ i e δ j e
where Ω E is the set of faults; Ω G is the set of generators in the whole network; and δ i e δ j e is the difference in the power angle between generator i and generator j after the occurrence of fault e .
7.
Transient frequency stability
The transient frequency stability indicator is shown in Equation (A7):
T F S I = max e Ω E max n Ω G Δ f n e
where Ω E is the set of faults, Ω G is the set of generators in the whole network, and Δ f n e is the maximum frequency deviation of generator n after the occurrence of fault e .
8.
Transient voltage stability
The transient voltage stability indicator is shown in Equation (A8):
V cov e r , i = V i V i T V S I = min e Ω E ( m e a n V cov e r , 1 e , V cov e r , 2 e , , V cov e r , n e
where V i is the voltage of bus i before the fault, V i is the voltage of bus i 10 s after the fault, Ω E is the fault set, and V cov e r , n e is the voltage recovery level of bus n after the occurrence of fault e .
9.
Multi-Infeed Short-Circuit Ratio (MISCR)
The multi-infeed DC short-circuit ratio is calculated as shown in Equation (A9):
I M I S C R = S S C , i P D C , i + j = 1 , j i n C i j P D C , j
where S S C , i is the short-circuit capacity at the converter bus of the ith HVDC transmission system; P D C , i and P D C , j are the rated capacities of the HVDC transmission lines i and j , respectively; and C i j is the coupling factor between the i th HVDC transmission system and the j th HVDC transmission system, which expresses the influence of the j th DC system on the i th DC system, where C i j = Δ U i / Δ U i .
We also defined the thresholds for determining the strength of AC feedpoints as follows:
(1)
Weak systems: MISCR < 2;
(2)
Moderately strong systems: 2 < MISCR < 3;
(3)
Strong systems: MISCR > 3.
10.
Generator-tripping ratio in DC blocking
The formula for calculating the unbalanced power of the generator-tripping ratio is shown in Equation (A10):
G P R I = P D C P c u t · min / P D C
where P D C is the transmitted power before the DC blocking, and P c u t · min is the minimum cut-off power needed to stabilize the system.
11.
Transient voltage rise in DC blocking
The transient voltage rise in DC blocking is shown in Equation (A11)
T V R I = max b Ω B Δ V 1 , Δ V 2 , , Δ V b
where Ω B is the set of buses near the DC and fan buses, and Δ V b is the maximum voltage rise of bus b .
12.
Net loss rate
The net loss rate is shown in Equation (A12):
N L I = P l o s s i Ω G P G , i
where P l o s s is the total net loss of the whole network, and P G , i is the active output of generator i .

References

  1. Grisales-Noreña, L.F.; Ocampo-Toro, J.A.; Rosales-Muñoz, A.A.; Cortes-Caicedo, B.; Montoya, O.D. An energy management system for PV sources in standalone and connected DC networks considering economic, technical, and environmental indices. Sustainability 2022, 14, 16429. [Google Scholar] [CrossRef]
  2. Zhao, D.; Li, C.; Wang, Q.; Yuan, J. Comprehensive evaluation of national electric power development based on cloud model and entropy method and TOPSIS: A case study in 11 countries. J. Clean Prod. 2020, 277, 123190. [Google Scholar] [CrossRef]
  3. Jiang, Y.; Fang, M.; Liu, Z.; Wang, W. Comprehensive evaluation of power quality based on an improved TOPSIS method considering the correlation between indices. Appl. Sci. 2019, 9, 3603. [Google Scholar] [CrossRef]
  4. Zhao, H.; Zhong, M.; Li, L.; Safdar, M.; Zhang, Z. A comprehensive evaluation method for planning and design of self-sufficient wind power energy systems at ports. Sustainability 2023, 15, 16189. [Google Scholar] [CrossRef]
  5. Xu, X.; Niu, D.; Qiu, J.; Wu, M.; Wang, P.; Qian, W.; Jin, X. Comprehensive evaluation of coordination development for regional power grid and renewable energy power supply based on improved matter element extension and TOPSIS method for sustainability. Sustainability 2016, 8, 143. [Google Scholar] [CrossRef]
  6. Dai, H.; Wang, J.; Li, G.; Chen, W.; Qiu, B.; Yan, J. A multi-criteria comprehensive evaluation method for distributed energy system. Energy Procedia 2019, 158, 3748–3753. [Google Scholar] [CrossRef]
  7. Qian, J.; Wu, J.; Yao, L.; Mahmut, S.; Zhang, Q. Comprehensive performance evaluation of wind-solar-CCHP system based on emergy analysis and multi-objective decision method. Energy 2021, 230, 120779. [Google Scholar] [CrossRef]
  8. Zhao, Q.; Du, Y.; Zhang, T.; Zhang, W. Resilience index system and comprehensive assessment method for distribution network considering multi-energy coordination. Int. J. Electr. Power Energy Syst. 2021, 133, 107211. [Google Scholar] [CrossRef]
  9. Niu, D.; Li, Y.; Dai, S.; Kang, H.; Xue, Z.; Jin, X.; Song, Y. Sustainability evaluation of power grid construction projects using improved TOPSIS and least square support vector machine with modified fly optimization algorithm. Sustainability 2018, 10, 231. [Google Scholar] [CrossRef]
  10. Li, J.; Li, T.; Han, L. Research on the evaluation model of a smart grid development level based on differentiation of development demand. Sustainability 2018, 10, 4047. [Google Scholar] [CrossRef]
  11. Li, X.; Niu, S. Study on Multi-layer Evaluation System of Source-grid-load Under Carbon neutral Goal. Proc. CSEE 2021, 41, 178–184. [Google Scholar] [CrossRef]
  12. Ma, X.; Yang, F.; Li, X.; Ma, Y.; Li, H.; Zhang, L.; Zhang, K. Research on multi-dimensional evaluation index system of high proportion new energy power grid operation. In Proceedings of the 2024 IEEE 7th International Electrical and Energy Conference (CIEEC), Harbin, China, 10–12 May 2024; pp. 1094–1100. [Google Scholar]
  13. Liu, J.; Liu, Y.; Qiu, G.; Wang, J.; Ding, M.; Liu, T. Fast Confidence Evaluation of Operation Mode of Power Grid Based on Gaussian Process Regression. Autom. Electr. Power Syst. 2022, 46, 181–190. [Google Scholar] [CrossRef]
  14. Liu, Z.; Li, J.; Zhang, G.; Li, F. Comprehensive Evaluation and Improvement Suggestion for the Reliability of HVDC System Domestic and Foreign. Power Syst. Technol. 2024, 49, 316–322. [Google Scholar] [CrossRef]
  15. Elgeziry, M.Z.; Elsadd, M.A.; Elkalashy, N.I.; Kawady, T.A.; Taalab, A.I. AC spectrum analysis for detecting DC faults on HVDC systems. In Proceeding of the 2017 Nineteenth International Middle East Power Systems Conference (MEPCON), Cairo, Egypt, 19–21 December 2017; pp. 708–715. [Google Scholar]
  16. Zhang, J.; Wang, G.; Xu, Z.; Zhang, Z. A comprehensive evaluation method and strengthening measures for AC/DC hybrid power grids. Energies 2022, 15, 4432. [Google Scholar] [CrossRef]
  17. Wang, Y.; Zhang, Y.; Liu, M.; Cai, H. Study on comprehensive evaluation system and method of AC-DC hybrid system. IOP Conf. Ser. Earth Environ. Sci. 2020, 510, 22019. [Google Scholar] [CrossRef]
  18. Aydin, F.; Gumus, B. Determining optimal SVC location for voltage stability using multi-criteria decision making based solution: Analytic hierarchy process (AHP) approach. IEEE Access 2021, 9, 143166–143180. [Google Scholar] [CrossRef]
  19. Li, Z.; Luo, Z.; Wang, Y.; Fan, G.; Zhang, J. Suitability evaluation system for the shallow geothermal energy implementation in region by entropy weight method and TOPSIS method. Renew Energy 2022, 184, 564–576. [Google Scholar] [CrossRef]
  20. Liang, Y.; Wang, H.; Zhao, X. Analysis of factors affecting economic operation of electric vehicle charging station based on DEMATEL-ISM. Comput. Ind. Eng. 2022, 163, 107818. [Google Scholar] [CrossRef]
  21. Lai, H.; Liao, H. A multi-criteria decision making method based on DNMA and CRITIC with linguistic d numbers for blockchain platform evaluation. Eng. Appl. Artif. Intell. 2021, 101, 104200. [Google Scholar] [CrossRef]
  22. Mo, X.; Li, H.; Zhang, L.; Qu, Z. A novel air quality evaluation paradigm based on the fuzzy comprehensive theory. Appl. Sci. 2020, 10, 8619. [Google Scholar] [CrossRef]
  23. Abdul, D.; Wenqi, J.; Tanveer, A. Prioritization of renewable energy source for electricity generation through AHP-VIKOR integrated methodology. Renew Energy 2022, 184, 1018–1032. [Google Scholar] [CrossRef]
  24. Leng, Y.; Zhang, H. Comprehensive evaluation of renewable energy development level based on game theory and TOPSIS. Comput. Ind. Eng. 2023, 175, 108873. [Google Scholar] [CrossRef]
  25. Li, Y.; Zhao, K.; Zhang, F. Identification of key influencing factors to chinese coal power enterprises transition in the context of carbon neutrality: A modified fuzzy DEMATEL approach. Energy 2023, 263, 125427. [Google Scholar] [CrossRef]
  26. Bai, X.; Fan, Y.; Hou, J.; Liu, Y. A comprehensive evaluation method for reliability confidence capacity of renewable energy based on improved DEMATEL-AHP-EWM. J. Electr. Eng. Technol. 2024, 19, 1205–1216. [Google Scholar] [CrossRef]
  27. Bahrami, S.; Rastegar, M.; Dehghanian, P. An FBWM-TOPSIS approach to identify critical feeders for reliability centered maintenance in power distribution systems. IEEE Syst. J. 2021, 15, 3893–3901. [Google Scholar] [CrossRef]
  28. Zhang, H.; Lu, M.; Ke, X.; Yu, S.; Zhao, J.; Wu, Y.; Cheng, L.; Li, X. Evaluation model of black-start schemes based on optimal combination weights and improved VIKOR method. Int. J. Electr. Power Energy Syst. 2021, 129, 106762. [Google Scholar] [CrossRef]
  29. He, L.; Tang, X.; Luo, Q.; Liao, Y.; Luo, X.; Liu, J.; Ma, L.; Dong, D.; Gan, Y.; Li, Y. Structure optimization of a heat pipe-cooling battery thermal management system based on fuzzy grey relational analysis. Int. J. Heat Mass Transf. 2022, 182, 121924. [Google Scholar] [CrossRef]
  30. Chen, Y.; Liu, X.; Rao, M.; Qin, Y.; Wang, Z.; Ji, Y. Explicit speed-integrated LSTM network for non-stationary gearbox vibration representation and fault detection under varying speed conditions. Reliab. Eng. Syst. Saf. 2025, 254, 110596. [Google Scholar] [CrossRef]
  31. Ji, Y.; Huang, Y.; Zeng, J.; Ren, L.; Chen, Y. A physical-data-driven combined strategy for load identification of tire type rail transit vehicle. Reliab. Eng. Syst. Saf. 2025, 253, 110493. [Google Scholar] [CrossRef]
  32. Wang, Z.; Zhou, B.; Lv, C.; Yang, H.; Ma, Q.; Yang, Z.; Cui, Y. Typical power grid operation mode generation based on reinforcement learning and deep belief network. Sustainability 2023, 15, 14844. [Google Scholar] [CrossRef]
  33. Cui, M.; Sun, Y.; Yang, J.; Li, Y.; Wu, W. Power Grid Security Comprehensive Assessment Based on Multi-Level Grey Area Relational Analysis. Power Syst. Technol. 2013, 37, 3453–3460. [Google Scholar] [CrossRef]
Figure 1. Evaluation index system for AC/DC hybrid grids’ operation modes.
Sustainability 17 03037 g001
Figure 2. Block diagram of the engineering realization of the evaluation model for the operation mode.
Sustainability 17 03037 g002
Figure 3. Combined weights obtained based on different regularization parameters.
Sustainability 17 03037 g003
Figure 4. Comparison of sub-indicator scores under different operating modes.
Sustainability 17 03037 g004
Figure 5. Comparison of the layers’ scores under different operating modes.
Sustainability 17 03037 g005
Table 1. Raw data on the grid’s operating modes.
Operation
Mode *
Static Security (A)Transient Stability (B)DC Security (C)Economic Performance
(D)
A1A2A3A4A5B1 B2B3C1C2C3 D1
A0.98210.85880.69590.97140.431144.220.01630.98962.427990.81460.40630.0380
B0.98910.79780.65390.93340.222162.300.01560.99002.532140.70610.35990.0390
C0.99010.74660.61610.93130.173148.710.01650.98452.690800.65290.34700.0399
D0.99400.86140.72280.97250.508137.790.01210.98884.123090.66830.19820.0266
E0.99700.80040.67720.95350.281156.210.01190.98994.381190.51160.16560.0301
F0.98810.74920.63630.93290.228143.810.01350.98404.666750.35830.15790.0331
G0.99400.85970.71230.98670.423141.480.01500.98923.080820.76330.30440.0315
H0.99700.79900.66810.96140.214159.890.01530.99003.243450.64460.25900.0337
I0.98810.74800.62860.93450.172146.840.01650.98473.422630.52210.25100.0358
* Modes A, B, and C are the valley, flat, and peak operation modes when the DC transmission power is 10,000 MW; modes D, E, and F are the valley, flat, and peak operation modes when the DC transmission power is 6000 MW; and modes G, H, and I are the valley, flat, and peak operation modes when the DC transmission power is 8000 MW.
Table 2. Indicator weights.
IndicatorsSub-IndicatorsSubjective WeightsObjective WeightsCombined Weights
Static security (A)A10.08620.39940.2389
A20.19980.16800.1854
A30.18410.11580.1545
A40.28000.14300.2104
A50.24990.17380.2108
Transient stability (B)B1 0.30440.32920.3183
B2 0.34780.27120.3117
B3 0.34780.39960.3700
DC security (C)C10.38280.28950.3359
C20.33590.43550.3810
C3 0.28130.27500.2831
Table 3. Evaluation results for each indicator layer of the operational mode.
Operation ModeStatic SecurityTransient
Stability
DC SecurityEconomic
Performance
A0.76260.79580.51320.8038
B0.71780.78880.54080.7905
C0.70160.78100.55800.7781
D0.78200.80480.68161.0000
E0.73770.79790.74520.9315
F0.70670.78750.81930.8776
G0.77860.79840.56990.9064
H0.73540.79040.60710.8686
I0.70300.78240.64160.8359
Table 4. Results of the comprehensive evaluation of operational modes.
Operation ModeOverall RatingRank
A0.54677
B0.54098
C0.53949
D0.61803
E0.62462
F0.65031
G0.57304
H0.56815
I0.56736
Table 5. Weight results based on the DEMATEL–entropy weighting method.
IndicatorsWeighting at the Indicator LayerSub-IndicatorsEntropy Weighting Method for
Objective Weights
Entropy Weighting Method of
Composite Weights
Static security (A)0.3100A10.09480.1004
A20.22950.2133
A30.14920.1697
A40.26160.2644
A50.26490.2522
Transient stability (B)0.2706B10.34190.3241
B20.30510.3271
B30.35300.3488
DC safety (C)0.2826C10.42210.3962
C20.19740.2727
C30.38050.3311
Economic performance (D)0.1368D111
Table 6. Evaluation ranking results based on the DEMATEL–entropy weighting method.
Operation ModeOverall RatingRanking
A0.49538
B0.47976
C0.47439
D0.57432
E0.56173
F0.57481
G0.52484
H0.50715
I0.49807
Disclaimer/Publisher’s Note: The statements, opinions and data contained in all publications are solely those of the individual author(s) and contributor(s) and not of MDPI and/or the editor(s). MDPI and/or the editor(s) disclaim responsibility for any injury to people or property resulting from any ideas, methods, instructions or products referred to in the content.

