Article

Understanding the Relationships Between Co-Working Spaces and Regional Policies in China: An Empirical Study Based on Multiple DID Model

Research Center for China Administrative Division, East China Normal University, Shanghai 200241, China
*
Author to whom correspondence should be addressed.
Sustainability 2025, 17(7), 3017; https://doi.org/10.3390/su17073017
Submission received: 17 February 2025 / Revised: 19 March 2025 / Accepted: 23 March 2025 / Published: 28 March 2025

Abstract

:
The rise of information and communication technologies (ICT) has facilitated flexible working arrangements, giving rise to new workspaces like co-working spaces (CWSs). While existing research has focused on the distribution of CWSs within city, this study explores their location patterns and relationships with regional policies in China. Using data from 2015 to 2022, it employs a quasi-natural experiment at the prefecture level, primarily examining the impact of the National Innovation Demonstration Zone (NIDZ) policy. This pilot policy primarily aims to reform the science and technology innovation mechanism in the pilot cities. Notably, the research innovatively applies the multiple Difference-in-Differences (DID) model to compare CWS distribution pre- and post-policy implementation across diverse cities. The findings include the general promotion of CWS growth in NIDZs, yet with a policy focus leading to regional imbalances. Moreover, the positive effect of establishing demonstration zones on CWS growth is relatively smaller in economically developed cities. These insights shed light on the evolving dynamics and patterns of innovative activities, emphasizing the influence of regional policies on the spatial distribution of CWSs.

1. Introduction

The concept of CWS (CWS) emerged early, driven by individuals in creative and entrepreneurial fields who desired to gather in conveniently located spaces for collaboration. On the one hand, due to the high cost of renting office space, co-renting became a typical sharing economy model. On the other hand, sustainable ways of innovation and entrepreneurship need to be explored. Subsequently, CWS companies, such as “WeWork”, gradually emerged, expanding the functions of CWSs to include entrepreneurial guidance and other features. With the development of information and communication technology, some workers with low dependence on fixed spaces may choose for more flexible workspaces, such as cafés and restaurants [1]. As a result, CWSs that are designed for workers to rent and work together have emerged, giving rise to the concept of the new workspace. New workspaces are typically defined as “flexible, shared, rentable, and community-oriented workspaces occupied by professionals from various industries”. Meanwhile, innovation practices have experienced unprecedented liberation and development [2]. These spaces not only provide entrepreneurs with a low-cost, convenient, and systematic service platform but also host various events, fostering idea exchange, mutual learning, and support among entrepreneurs. Therefore, CWSs have gained favor among innovative entrepreneurs and startups [3]. CWSs, relying on a vast social resource platform, provide information sharing, resource matching, and incubation services for startup teams or companies. They represent an integrated open entrepreneurial space [4].
The economic benefits brought about by CWSs have gradually attracted attention and have become a significant reason for local governments to encourage the establishment of CWSs. In September 2014, during the Summer Davos Forum, then-Chinese Premier Li Keqiang first proposed to foster new practices of “grassroots entrepreneurship” and “mass entrepreneurship”, creating a new situation of “mass innovation”. In January 2015, Premier Li Keqiang visited the “Chaihuo” CWS in Shenzhen. During the same month’s executive meeting of the State Council, policies supporting the development of CWSs to promote mass innovation and entrepreneurship were officially introduced, marking the first time “CWS” appeared in government documents. In February of the same year, the Chinese Ministry of Science and Technology publicized policies that effectively integrate various resources through the creation of “CWSs” to promote economic development. The government work report during the National People’s Congress and the Chinese People’s Political Consultative Conference elevated “mass entrepreneurship and innovation” to a strategic level for China’s economic transformation and growth.
In March 2015, specific guidance for the development of CWSs to promote mass innovation and entrepreneurship was outlined in a policy document by the State Council. The document clearly mentioned that favorable conditions in National Innovation Demonstration Zones, National High-Tech Industrial Development Zones, technology business incubators, small business startup bases, university science parks, research institutes, and higher education institutions could be leveraged, which were expected to play a role in promoting employment and driving economic growth. In response to the policy call, governments at all levels actively encouraged innovators and entrepreneurs, and various companies participated in the construction and cultivation of CWSs through different forms and channels, aimed to develop the CWS model into a sustainable and innovative one, and laying the foundations for the sustainability of innovation.
The promotion of local innovation and entrepreneurship through CWSs has become a development strategy for many cities in China. However, there are significant differences in development models, implementation paths, and economic benefits. Additionally, in recent years, under the influence of digitization, numerous entrepreneurial spaces have emerged in rural or other areas, with mechanisms and development models differentiating from traditional entrepreneurial spaces [5]. Therefore, to better understand the dynamic changes in innovation activities brought about by technological changes and explore the evolution of CWS location patterns, it is crucial to examine the impact of regional policies on CWSs. The primary contributions of this study comprise three areas: First, our research breaks through the limitations of existing studies on the distribution of CWSs within a single city and for the first time explores the distribution of CWSs at a macro level throughout China; second, we have explored for the first time the impact of representative regional policies on the spatial distribution of CWSs, which provides strong support and a useful supplement to the important research topic of the dynamic changes in innovation activities brought about by technological changes; third, we innovatively utilized the multiple DID framework to effectively address endogeneity issues in causal inference and explored the regional heterogeneity in the impact of regional policies on innovation activities in terms of mechanisms, providing empirical evidence for existing literature on industrial policy heterogeneity.

2. Literature Review and Theoretical Hypotheses

The first empirical study discussing the emergence of co-working was conducted by Clay Spinuzzi in 2012. In his article, he primarily focused on defining co-working, understanding the participants, and exploring its emergence background [6]. Subsequently, global research on CWSs has gradually become a focal point of scholarly attention [1].
Building upon Spinuzzi’s work, more research has emerged to delve into the definition and influence factors for the emergence of CWSs. Many researchers have discussed types, functions, and operational performance of CWSs [7,8,9]. Additionally, there has been a spatial turn in this area of research, with proximity and geographical location becoming key concepts. Urban researchers have focused on studying spatial differentiation patterns, temporal evolution processes, regional characteristics, and the role of CWSs in promoting local growth and entrepreneurship [10,11,12].

2.1. Location Patterns of CWSs

CWSs help alleviate the rental challenges faced by startups [7], making creative groups and startup companies the most common tenants in such spaces [13]. The characteristics of the primary tenants influence the clustering of CWSs. While the digital era offers workers a variety of workspaces, industries like creative work tend to concentrate in high-density areas in major cities [14,15]. This is because geographic, organizational, institutional, and cognitive proximity can enhance the innovation performance of collaborative organizations [16,17,18]. Scholars conducting surveys of CWSs in Beijing found that such spaces tend to cluster near creative and knowledge-based businesses in high-density mixed-use areas, relying on underutilized commercial space [8]. Similar findings were also observed in Helsinki, where research revealed that these spaces are primarily located in the most compact or multifunctional areas [19].
The degree of improvement in ICT and infrastructure is closely tied to business innovation and economic activities [20]. Therefore, many planning policies guide the positioning of CWSs relative to other sectors and activities like major employment centers. It can help CWSs access high-quality transportation networks, yielding broader public benefits through enhanced traffic efficiency and reduced commuting times [21].
For entrepreneurs in co-working spaces, terms such as uncertainty and risk are frequently mentioned throughout the startup process. This is particularly true for innovation-driven enterprises, which often require significant resource investment to sustain their innovative capabilities. However, this creates a conflict with the capacity constraints typical of early-stage business growth. Many scholars have recognized this fundamental contradiction and referred to it as the “innovation threshold” or the “valley of death” [22]. For entrepreneurs, although some teams possess industry expertise, their projects are often in the early development stages and have yet to establish stable revenue models. In this context, startups frequently encounter difficulties in securing bank loans or market financing due to their lack of historical performance records, limited revenue scale, and insufficient cash flow. Under such circumstances, government support policies, such as special funding subsidies and tax reductions, undoubtedly play a crucial role in facilitating enterprise growth [23].
It is worth noting that despite numerous studies confirming the clustering of CWSs in cities, large-scale research remains limited. Especially in China, due to the lack of unified standards and statistics and CWSs’ relatively late development, current studies have tended to focus on spatial locations within urban areas. CWSs are not simply synonymous with creative businesses; they involve multiple stakeholders and serve diverse functions. Therefore, it is still a question worthy of exploration whether regional policies influence them and whether there are interconnections in the development of CWSs in different regions.

2.2. Impacts of Regional Policies on CWSs

While the phenomenon of co-working has garnered attention from scholars in various fields, there is still a lack of evidence regarding the relationship between local and regional policies and CWSs. From the perspective of the innovation ecosystem, innovation and entrepreneurship activities within CWSs are closely related to their entrepreneurial environment. Regional policies can provide or enhance the essential elements needed for entrepreneurship, such as capital, technology, talents, and environment. They can also provide supporting factors for the successful development of entrepreneurship, such as institutions, culture, and social capital [14,24].
Many Western countries, including Australia, have adopted neoliberal agendas in public policy [25], leading to increased use of non-regulatory approaches to attract mobile capital and support the development of new modes of employment [26]. Governments around the world also promote the development of new markets and economic productivities through various innovations and “smart city” policies and initiatives, creating an environment for the establishment of CWSs.
The policy background is crucial for understanding the distribution and development of CWSs in China. Under policy guidance, there has been a strengthening of the clustering of entrepreneurial activities. For startup teams, obtaining financing can be challenging due to a lack of accurately assessable assets or experience. In this context, government policies can play a role in providing financial support. For example, in the policies related to Beijing NIDZs, the “Golden Seed” enterprise nurturing fund was established, increasing R&D funding support for small and medium-sized enterprises. Additionally, the policies include measures to improve talents management, residence permits, and streamlined entry and exit procedures, as well as establishing an effective way for professional title evaluations. In Shenzhen, the evaluation policy for CWSs includes a subsidy of 500,000 yuan for nationally recognized CWSs. These policies can effectively establish essential elements for entrepreneurship.
While the emergence of co-working has captured the attention of scholars from various fields, there remains a lack of empirical evidence regarding the relationship between local and regional policies and CWSs. Some researchers suggest that CWSs may promote urban renewal, drive regional vitality, and stimulate economic growth. There are also studies that approach CWS policies from a public policy perspective, quantitatively assessing the scientific validity and rationality of these policies [7,27]. Some researchers used surveys to evaluate the influence of policies on CWSs [28,29]. However, there is a notable lack of empirical research on the relationship between policies and CWSs.

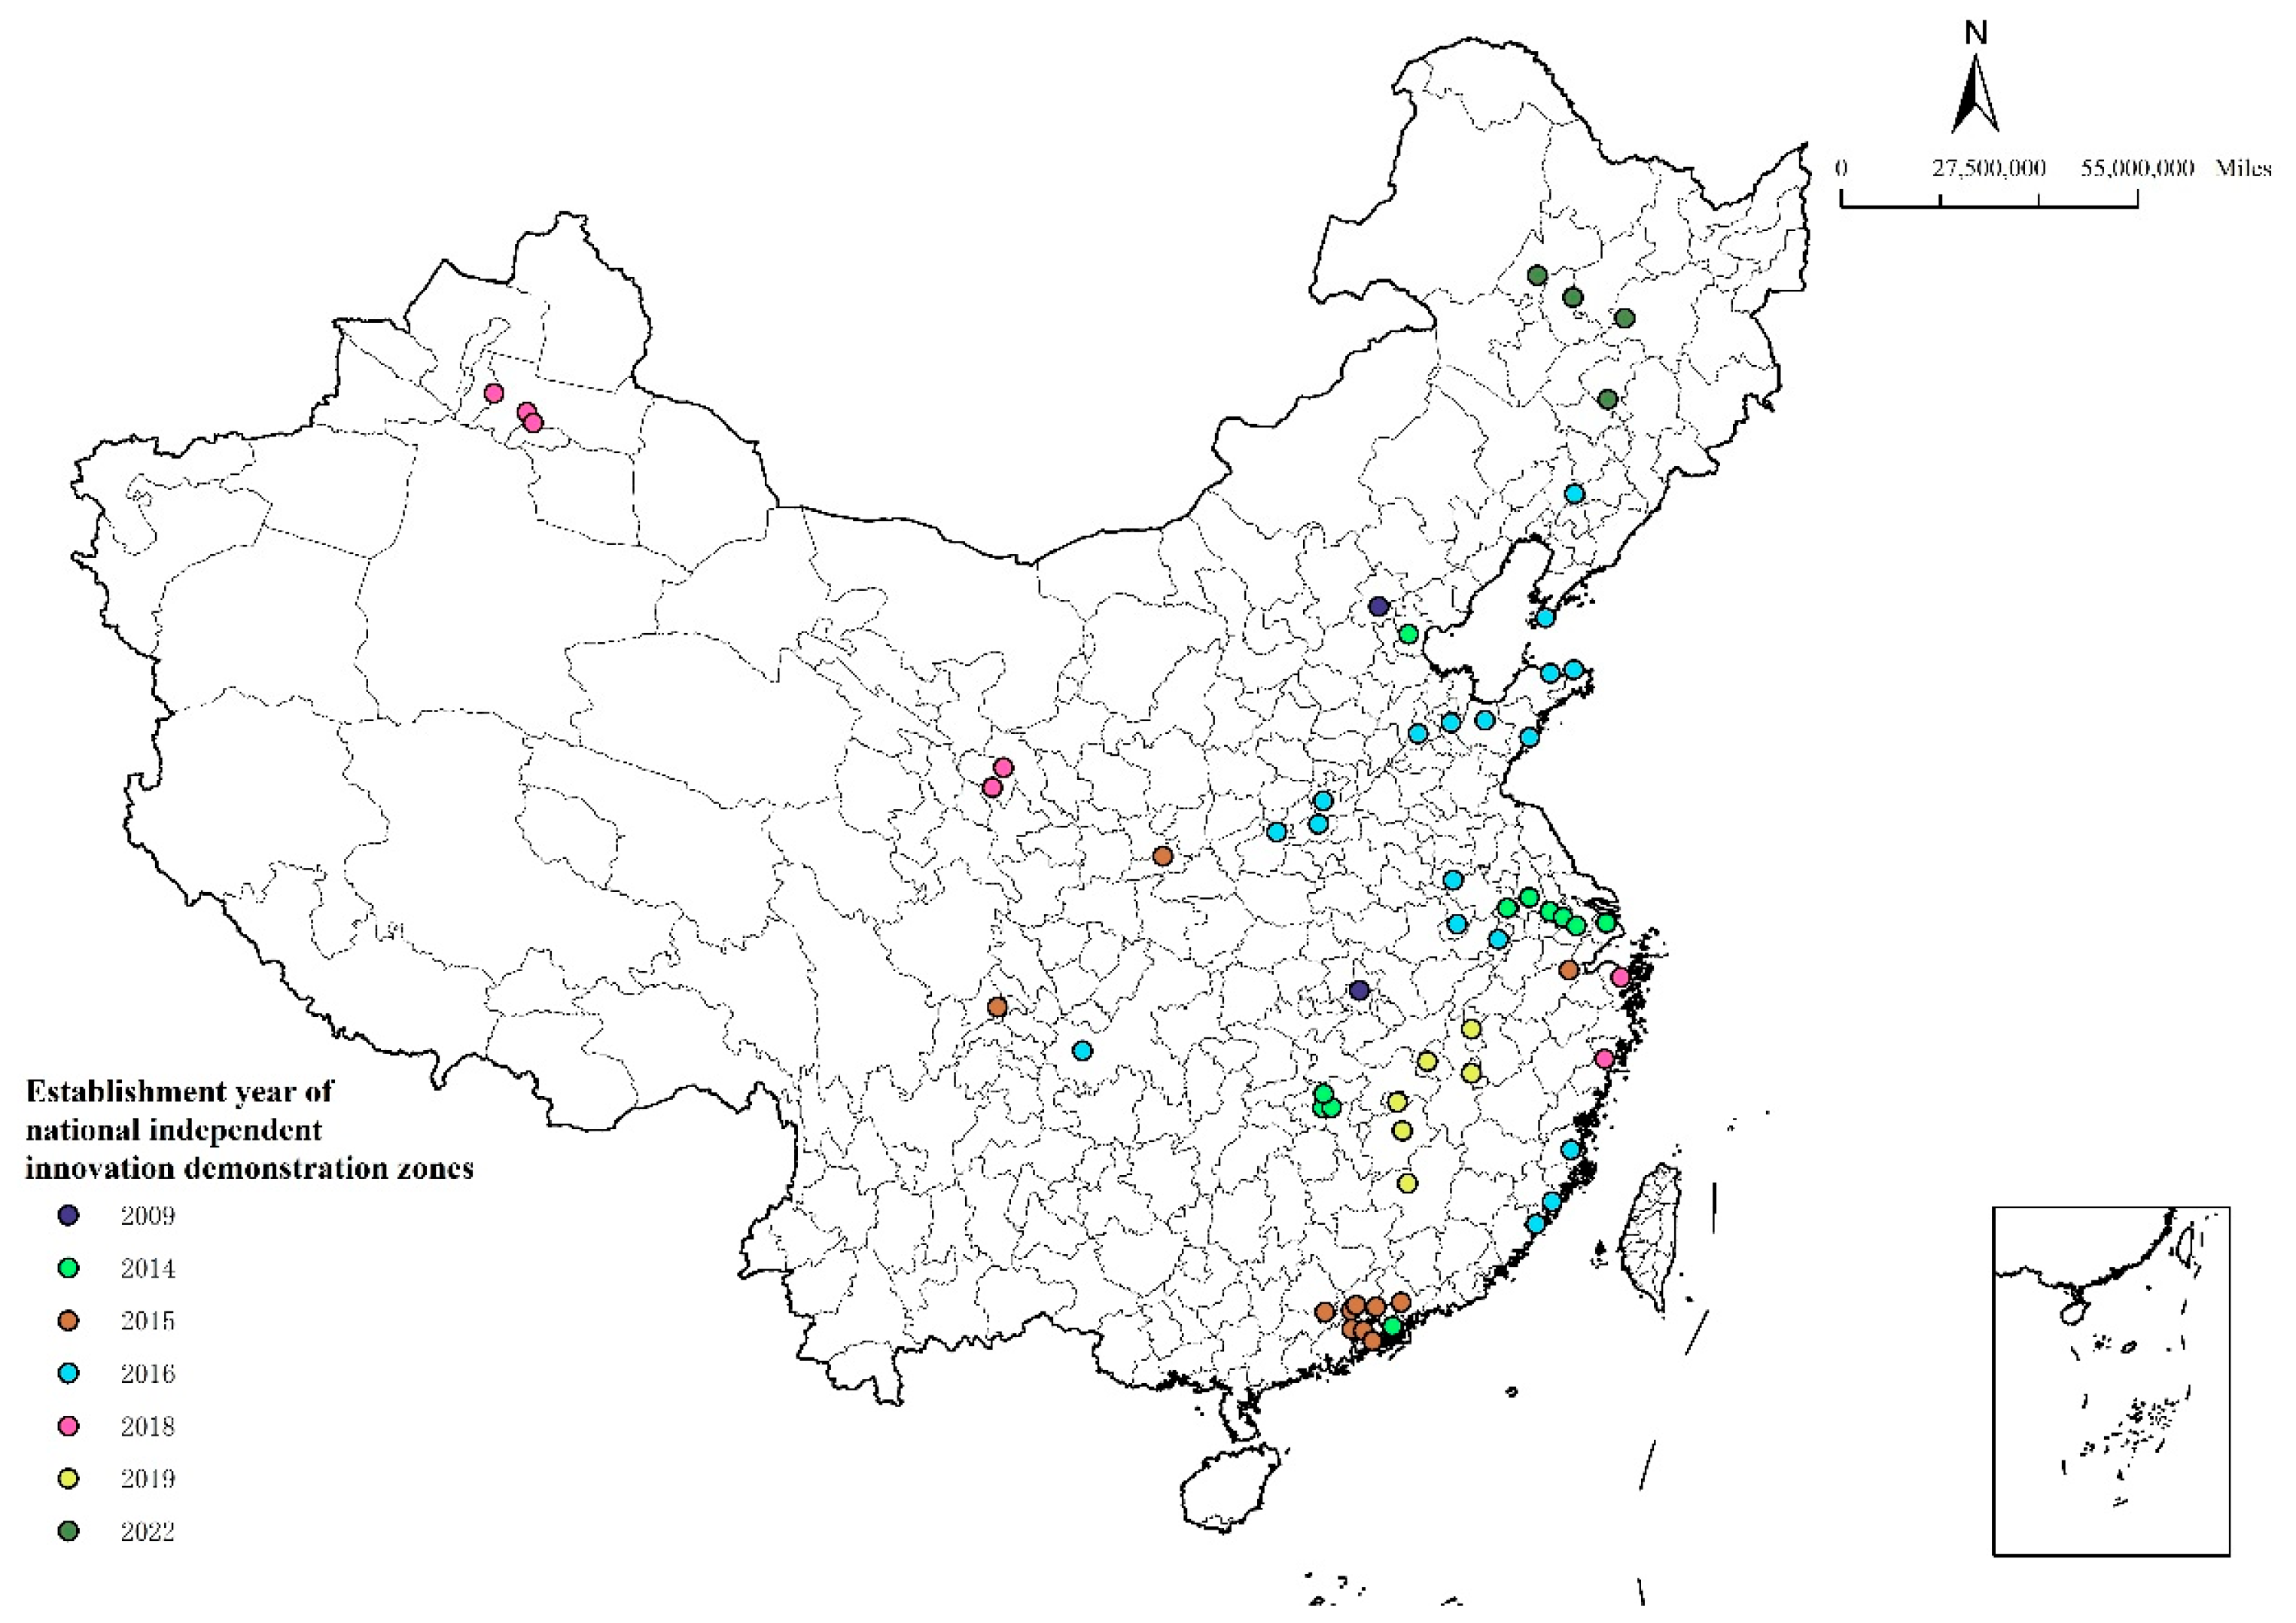
2.3. Impacts of the National Independent Innovation Demonstration Zone Policy

In order to accelerate the implementation of the innovation-driven development strategy and the construction of an innovative country, the Chinese government has introduced a series of innovative pilot industrial policies, of which the NIDZ policy is a representative policy. in March 2009, the State Council of China issued the ‘Reply on the Approval of Supporting the Construction of a National Innovation Demonstration Zone in Zhongguancun Science and Technology Park’, which requires that the city areas designated as NIDZs after screening be fully stimulated to stimulate the innovation vitality of enterprises through the implementation of bold and pragmatic policy initiatives, such as the pilot of equity incentives and fintech. In the designated NIDZs, bold and pragmatic policy initiatives such as equity incentives, fintech pilots, and support for emerging industries to participate in major national scientific research projects are required to fully stimulate the vitality of enterprise innovation. This policy is the first innovative industrial policy that has been implemented for more than ten years since the founding of China to promote early and pilot implementation, explore experience, and make demonstrations in the development of autonomous innovation and high-tech industries in urban areas, and the distribution of NIDZs in China as of 2023 is shown in Figure 1. In terms of the specific operation mechanism, high-tech zones promote and decide independently to provide policy support and tax incentives for innovative enterprises. In 2021 alone, NIDZs and their provinces and cities will have released nearly 5000 innovation policies, and the GDP and total profits created within NIDZs in that year will be as high as RMB 9.6 trillion and RMB 2.4 trillion, respectively. CWSs possess characteristics that enhance organizational innovation performance and drive regional vitality and economic growth. Throughout their development, they have also leveraged government subsidies, financial support, and other welfare policies as part of urban policy planning. As a key vehicle for policy guidance, co-working spaces are highly concentrated within National Independent Innovation Demonstration Zones (NIIDZs), providing entrepreneurial enterprises with resource integration, incubation services, and industry connections. For instance, the Zhongguancun Demonstration Zone has developed a mature incubation system, bringing together over 200 entrepreneurial incubation institutions, including 63 national-level technology business incubators and 118 national-level co-working spaces.
In the Tianjin National Independent Innovation Demonstration Zone, continuous efforts have been made to upgrade and iterate co-working spaces. The region has established 30 co-working spaces and is exploring the construction of “Co-working Space 3.0” models, international co-working spaces, and other new entrepreneurial platforms. Additionally, Tianjin promotes innovative models such as crowdsourcing, crowdfunding, crowd innovation, and virtual dual-innovation communities.
Furthermore, although some co-working spaces are not physically located within NIIDZs, they still benefit from the policy dividends of the innovation-driven urban development strategy, facilitated by local government support. This article assumes that the policies of the NIDZ have an impact on the distribution of CWSs.
As a systemic reform spanning more than a decade, the establishment of the NIDZ represents an approach in key urban areas aimed at attracting talent, promoting the transfer of scientific and technological achievements, and nurturing science and technology enterprises. On the one hand, through the implementation of these supportive policies, the NIDZ strengthens the infrastructure in the region, thereby creating a favorable innovation environment for CWSs. On the other hand, it also increases the amount of funding available for CWSs. Thus, the policies in the NIDZ have an ‘incentive effect’ that encourages the development of CWSs. Although the construction of NIDZs primarily serves market interests and may impose mandatory standards on CWSs in terms of cost increases, as the policy is more fully implemented, the attractiveness of the city to startups and the financial compensation through stable taxation will allow CWSs to flourish with profits exceeding costs. The first hypothesis explored in this study is as follows:
Hypothesis 1. 
As a policy aimed at promoting innovation, the establishment of NIDZs will have a significantly positive impact on the growth of CWS.
The Chinese national government displays a distinct inclination and heightened attention towards cities establishing NIDZs compared to other cities. From providing tax incentives for R&D expense reductions to facilitating domestic listing and financing ways for technology-based enterprises, annual allocations of incentive and subsidy funds are arranged to support the development of these demonstration zones. Various forms of fiscal support and flexible institutional management contribute to enterprises establishment and innovation development. From the perspective of development economics, these changes in economic and social factors will play a reinforcing and accumulating role in subsequent regional development. Due to the preferential policies attracting the concentration of startups, creators, and innovators, it brings economic and social benefits, further enhancing the attractiveness of CWSs. This ultimately results in the sustained and vigorous development of CWSs in specific areas, exhibiting higher growth rates and innovation capabilities compared to surrounding regions. The second hypothesis to be explored in this research is as follows:
Hypothesis 2. 
The policy focus on NIDZs will lead to the clustering of CWSs, creating regional imbalances.
In cities with higher levels of economic development, such as the Yangtze River Delta and the Beijing–Tianjin–Hebei region, the initial innovation and entrepreneurship ecosystem is relatively well-developed. Moreover, in cities with a higher level of urban scale, government management systems are more flexible, allowing for autonomous implementation of innovation policies. Therefore, the impact of NIDZ policies on the growth of CWSs in these cities may not be as significant as in regions with lower levels of development, as various support institutions and resources already exist. Additionally, in cities with higher levels of economic development, the operational costs of CWSs are higher. This makes entrepreneurs more cautious, potentially weakening the effect of policy incentives. The third hypothesis to be explored in this research is as follows:
Hypothesis 3. 
Under other unchanged conditions, in cities with higher levels of economic development, the establishment of NIDZs has a smaller positive impact on the growth of CWSs.

3. Data and Methodology

3.1. Variables and Data Sources

3.1.1. Explained Variables

The data used in this study cover nationally registered CWSs in China from 2015 to 2022. To further promote the development of CWSs, the Torch Center of the Chinese Ministry of Science and Technology screened CWSs recommended by local science and technology management departments according to detailed criteria. Lists were published in 2015 and 2016, with nearly 400 CWSs included in the management and service system of national-level technology business incubators. Starting from 2017, the list is fixed to be published annually, and it undergoes annual statistics. After the announcement, CWSs apply for inclusion themselves, and upon approval, they receive policy support from local governments related to planning, land use, and public finance. At the end of each year, CWSs that do not meet the assessment criteria are removed from the list.
Prior to 2017, the “China Torch Statistical Yearbook” primarily featured data related to incubators and high-tech enterprises and did not include data on CWSs. Specialized statistics for CWSs began in 2017, and according to the statistics, from 2017 to 2019, the number of CWSs in China continued to grow, with an annual growth rate of over 15%. As of the end of 2019, there were a total of 8000 CWSs in China.
Being listed as a nationally registered CWS implies having relatively well-established operational management systems and operating for more than six months. It may also be closely related to the local industry development direction.

3.1.2. Core Explanatory Variables

This article uses the “National Innovation Demonstration Zone” policy as a quasi-natural experiment, considering cities that implemented the policy as the treatment group and cities that did not implement it as the control group. It employs a DID (Difference-in-Differences) framework to analyze the impact of the NIDZ policy on the development of CWSs from 2015 to 2022. After manual review, it was found that among the 293 prefecture-level cities in China, the policy was implemented in six batches before and during the study period. The first batch had 13 cities before 2015, the second batch had 10 cities in 2015, the third batch had 18 cities in 2016, the fourth batch had 7 cities in 2018, the fifth batch had 5 cities in 2019, and the sixth batch had 4 cities in 2022. There were 238 prefecture-level cities that were not affected by the NIDZ policy. This paper investigates whether the policy of the NIDZ has played a pivotal role in affecting the location patterns of new workspaces. Therefore, whether a city has a demonstration zone and when it was established is the dummy variable of this research. The product of these two terms is the core explanatory variable in this paper.

3.1.3. Control Variables

The selection of appropriate control variables is crucial to improve the identification of causal effects. In order to better identify the causal effect of NIDZs on CWSs, on the basis of ensuring data availability, we selected a series of control variables at the regional level that affect CWSs at the same time as NIDZ policy, in order to cut off the association between other factors affecting CWSs and NIDZ policy, and then to more accurately identify the causal effect. Specifically, the selection of control variables is divided into the following four categories: first, the degree of openness to the outside world, which is because the higher the degree of openness, the more likely that a wide range of talent exchanges and technological innovations will be realized, and we chose the proportion of import and export trade to the regional GDP as a proxy indicator [17,30]. The second category is human capital, because the higher the level of human capital in a region, the more likely the CWS will be established and the more likely the NIDZ will be established. We chose the number of university students per ten thousand people in the population and the year-end number of employed personnel as proxy variables [31,32]. The third category is the level of R&D investment, because the more a region invests in R&D, the more likely CWSs will spread and technological innovations will be realized; therefore, the number of patent applications for inventions, the proportion of research and development expenditure to the regional GDP, and the proportion of research and development expenditure to the regional GDP are chosen as proxies for the number of university students per ten thousand people in the population. Expenditure to the regional GDP and proportion of scientific and technological expenditures to the regional GDP are chosen as proxy control variables for the level of R&D investment [33,34]. Last but not least is the category of level of digitization, which represents the level of scientific and technological infrastructure development. The higher the level of digitization the more likely it is to lead to the establishment of a CWS and the more likely it is that the region will be affected by the NIDZ; therefore, the number of broadband internet access users per hundred people and the proportion of employed personnel in the information transmission, computer services, and software industry were selected as proxy control variables for digitization level [10]. Table 1 presents the descriptive statistics of the explanatory variables, explanatory variables, and control variables that will be applied to the multi-period DID model of this paper.

3.2. Baseline Model

To reduce the estimation bias in traditional DID analysis, this article uses a two-way fixed-effects model and employs a multiple DID approach to verify the impact and mechanism of the NIDZ policy on the development of CWSs. The multiple DID model separates the policy treatment queues and sets the policy treatment duration to compensate for the limitations of traditional DID in estimating the effects of multi-period policy treatment. The model is as follows:
Y i t = v i + τ t + c = 0 c p = 0 P c β c p d i d c p i t + n = 1 n α X i t + ε i t
where i (= 1, 2, …, 293) represents prefecture-level cities and t = (2015, 2016, …, 2022) represents years. Y_it is the proxy variable for CWSs in city i in year t. c represents the policy treatment queues divided according to the implementation of the NIDZ policy in each city. The NIDZ policy is implemented in six batches, divided into 7 policy queues, namely c = 0, 1, …, 6. Prefecture-level cities that did not implement the NIDZ policy belong to queue c = 0, and the cities that implemented the policy in the following six batches are categorized as c = 1, 2, …, 6. P_c represents the longest duration of policy treatment received by policy treatment queue c, and P_c = 0, 1, 2, …, 6. For instance, the duration of policy intervention before 2015 is defined as 6, the duration of policy intervention in 2015 is defined as 5, and so on. Cities that never received policy intervention are defined as 0. 〖did〗_cpit is a dummy variable indicating whether city i belongs to queue c and received policy treatment in year t. If it received the treatment, 〖did〗_cpit = 1; otherwise, it is 0. β_cp represents the pure effect of the NIDZ policy on the development of CWSs, which is the focus of this article. X_it represents a series of control variables measuring the economic and social development of cities that are not affected by the NIDZ policy but impact CWS. v_i, τ_t, ε_it represent city fixed effects, year fixed effects, and residual terms, respectively.
To use the multiple DID model, it is essential to pass the parallel trends test. This article employs the event study method to examine whether the two groups satisfy parallel trends before the policy pilot. Based on Equation (1), this article constructs a parallel trends test model (2):
Y i t = j = 2015 t j = 2022 t β j d i d i j t + n = 1 n α X i t + v i + τ t + ε i t
d i d i j t is the interaction virtual variable between the year and policy treatment, meaning if city i conducted a policy pilot from 2015 to 2022, year t is the year j before or after the policy pilot of city i (for instance, if the city’s policy pilot boundary is 2018, then the superscripts j for that city represent −3 and 4, meaning that city i had its policy pilot in 2018, the reference year, and therefore j < 0). In this case, d i d i j t = 1 ; otherwise, it is 0. Thus, the coefficient ( β j ) of this variable measures the significance of differences between the treatment and control groups from 2008 to 2019. To avoid multicollinearity and select the benchmark control period, this article excludes the first year ( β 1 ) of the policy pilot. If the coefficients ( β j , j < 0) before the policy pilot are not significant, it indicates that the study satisfies the parallel trends assumption. v i , τ t represent city fixed effects, year fixed effects, and residual terms, respectively.

4. Results and Robustness Tests

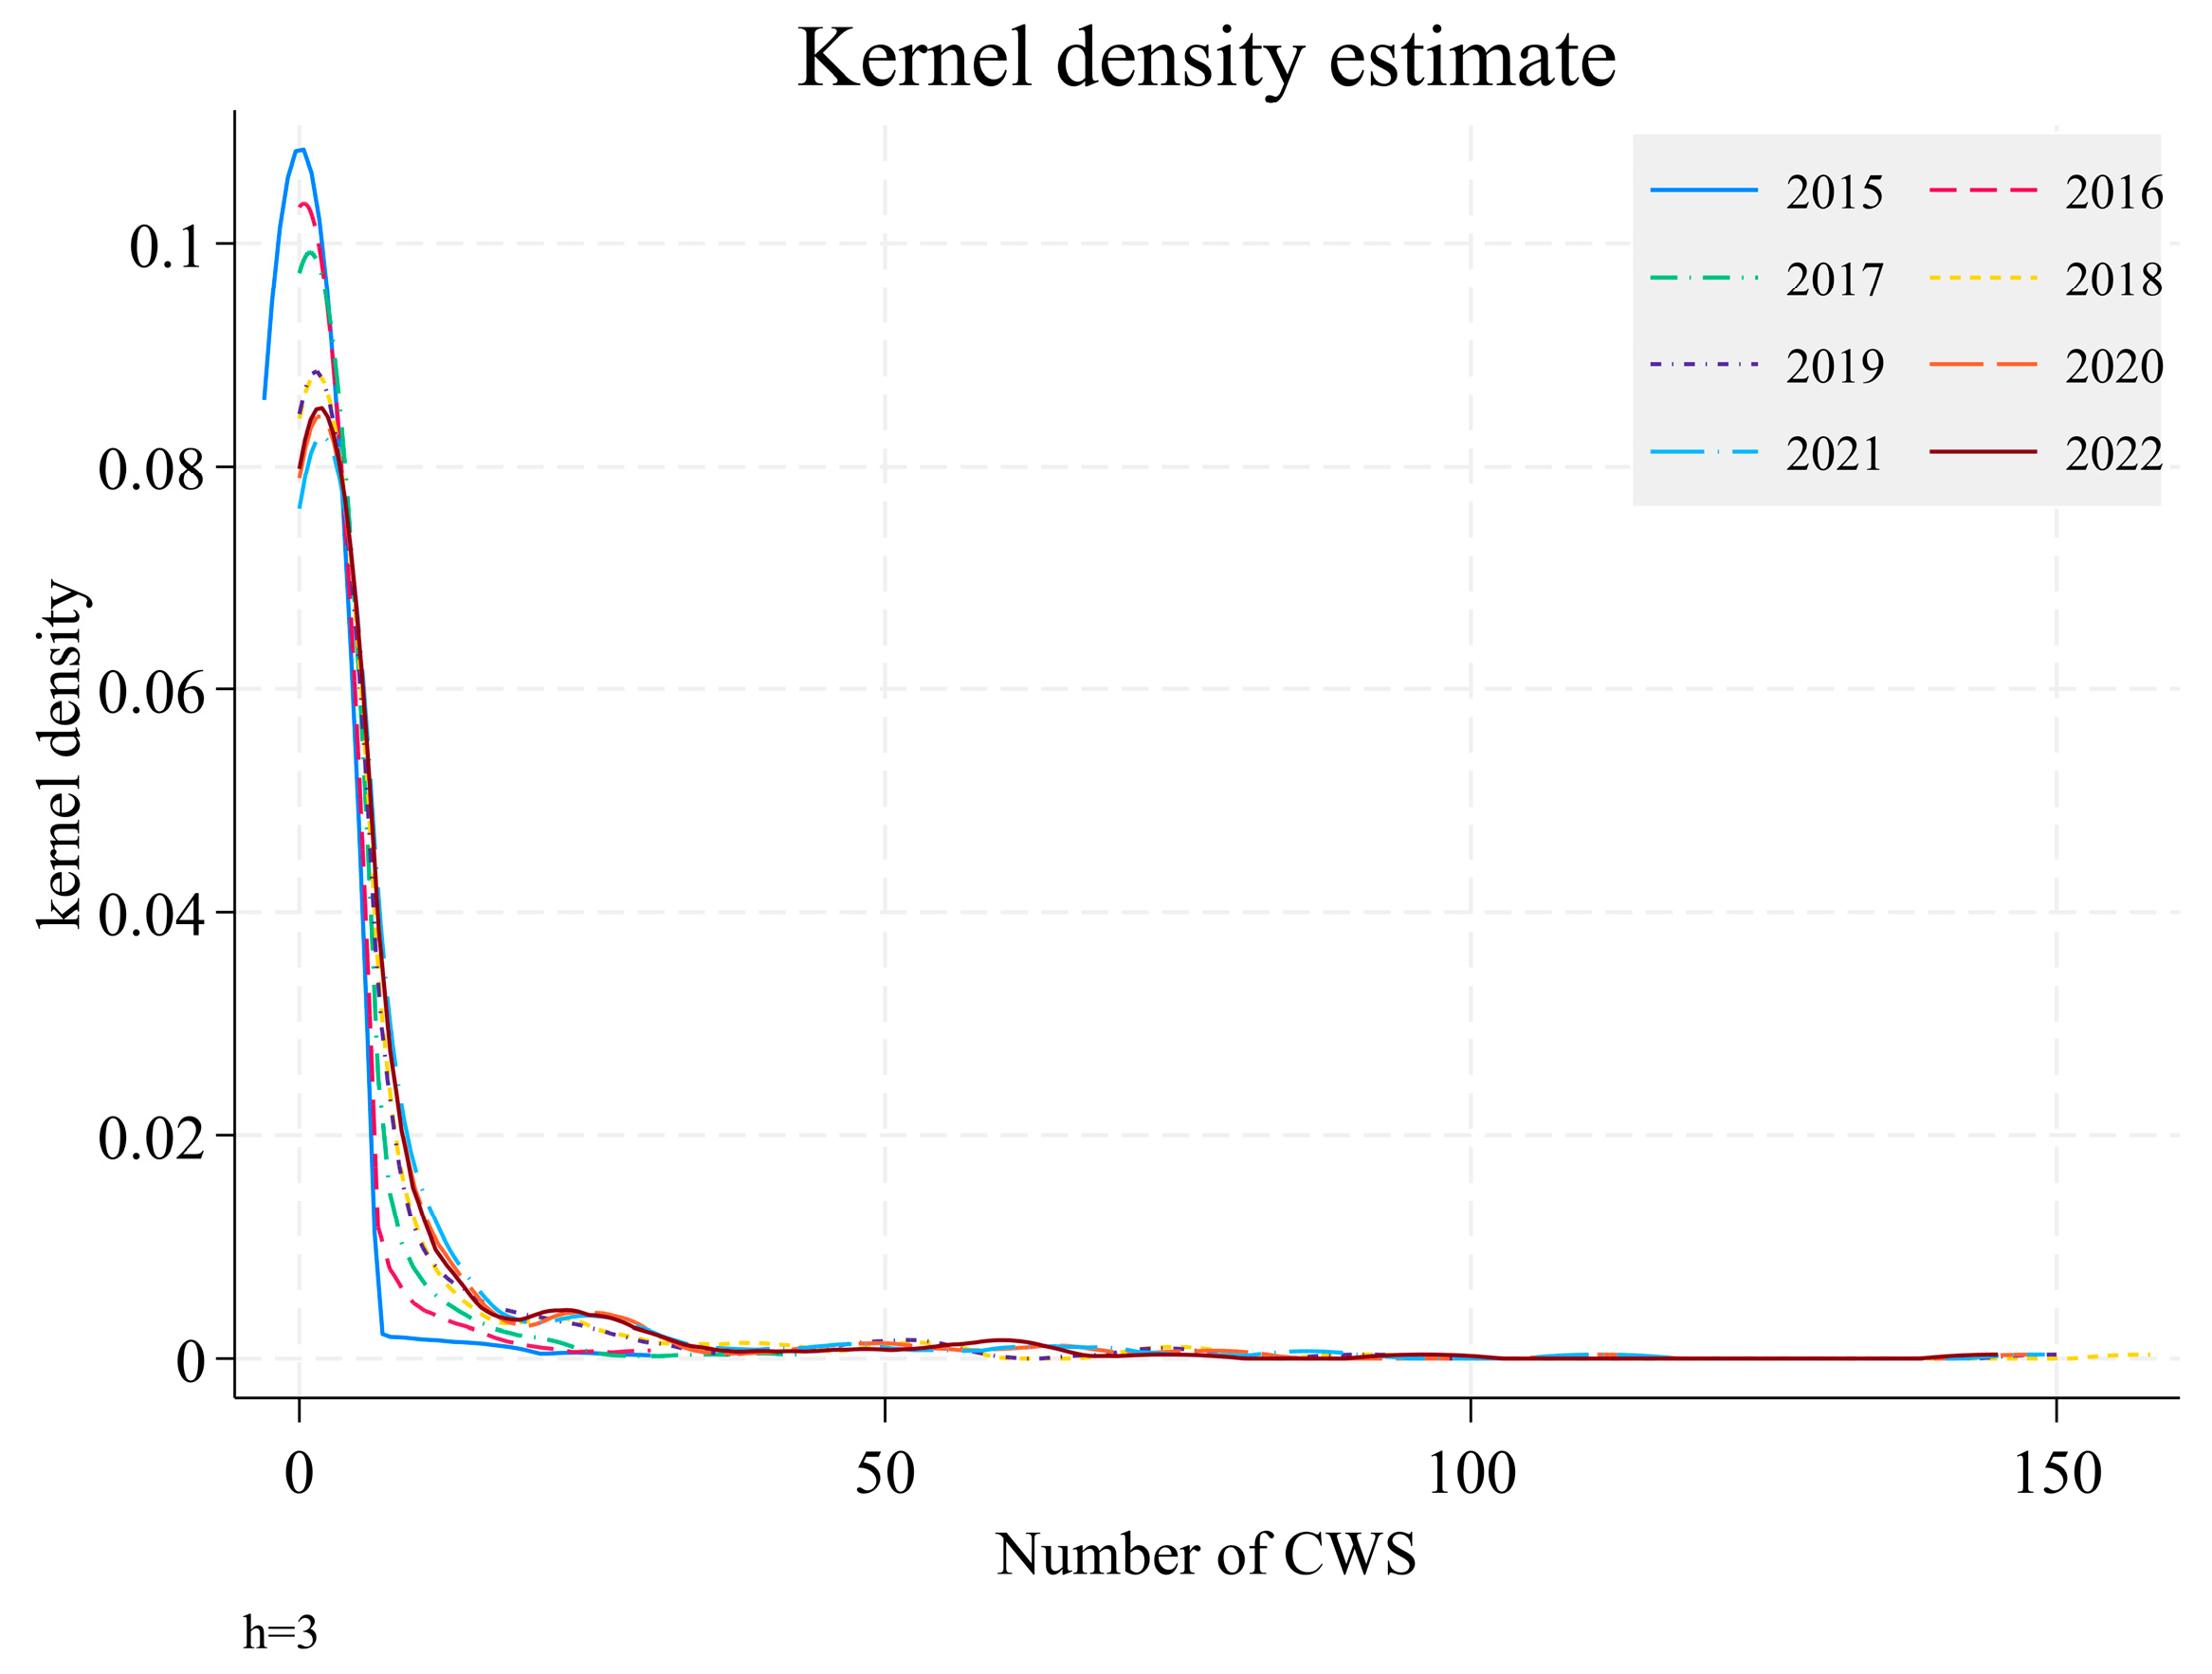
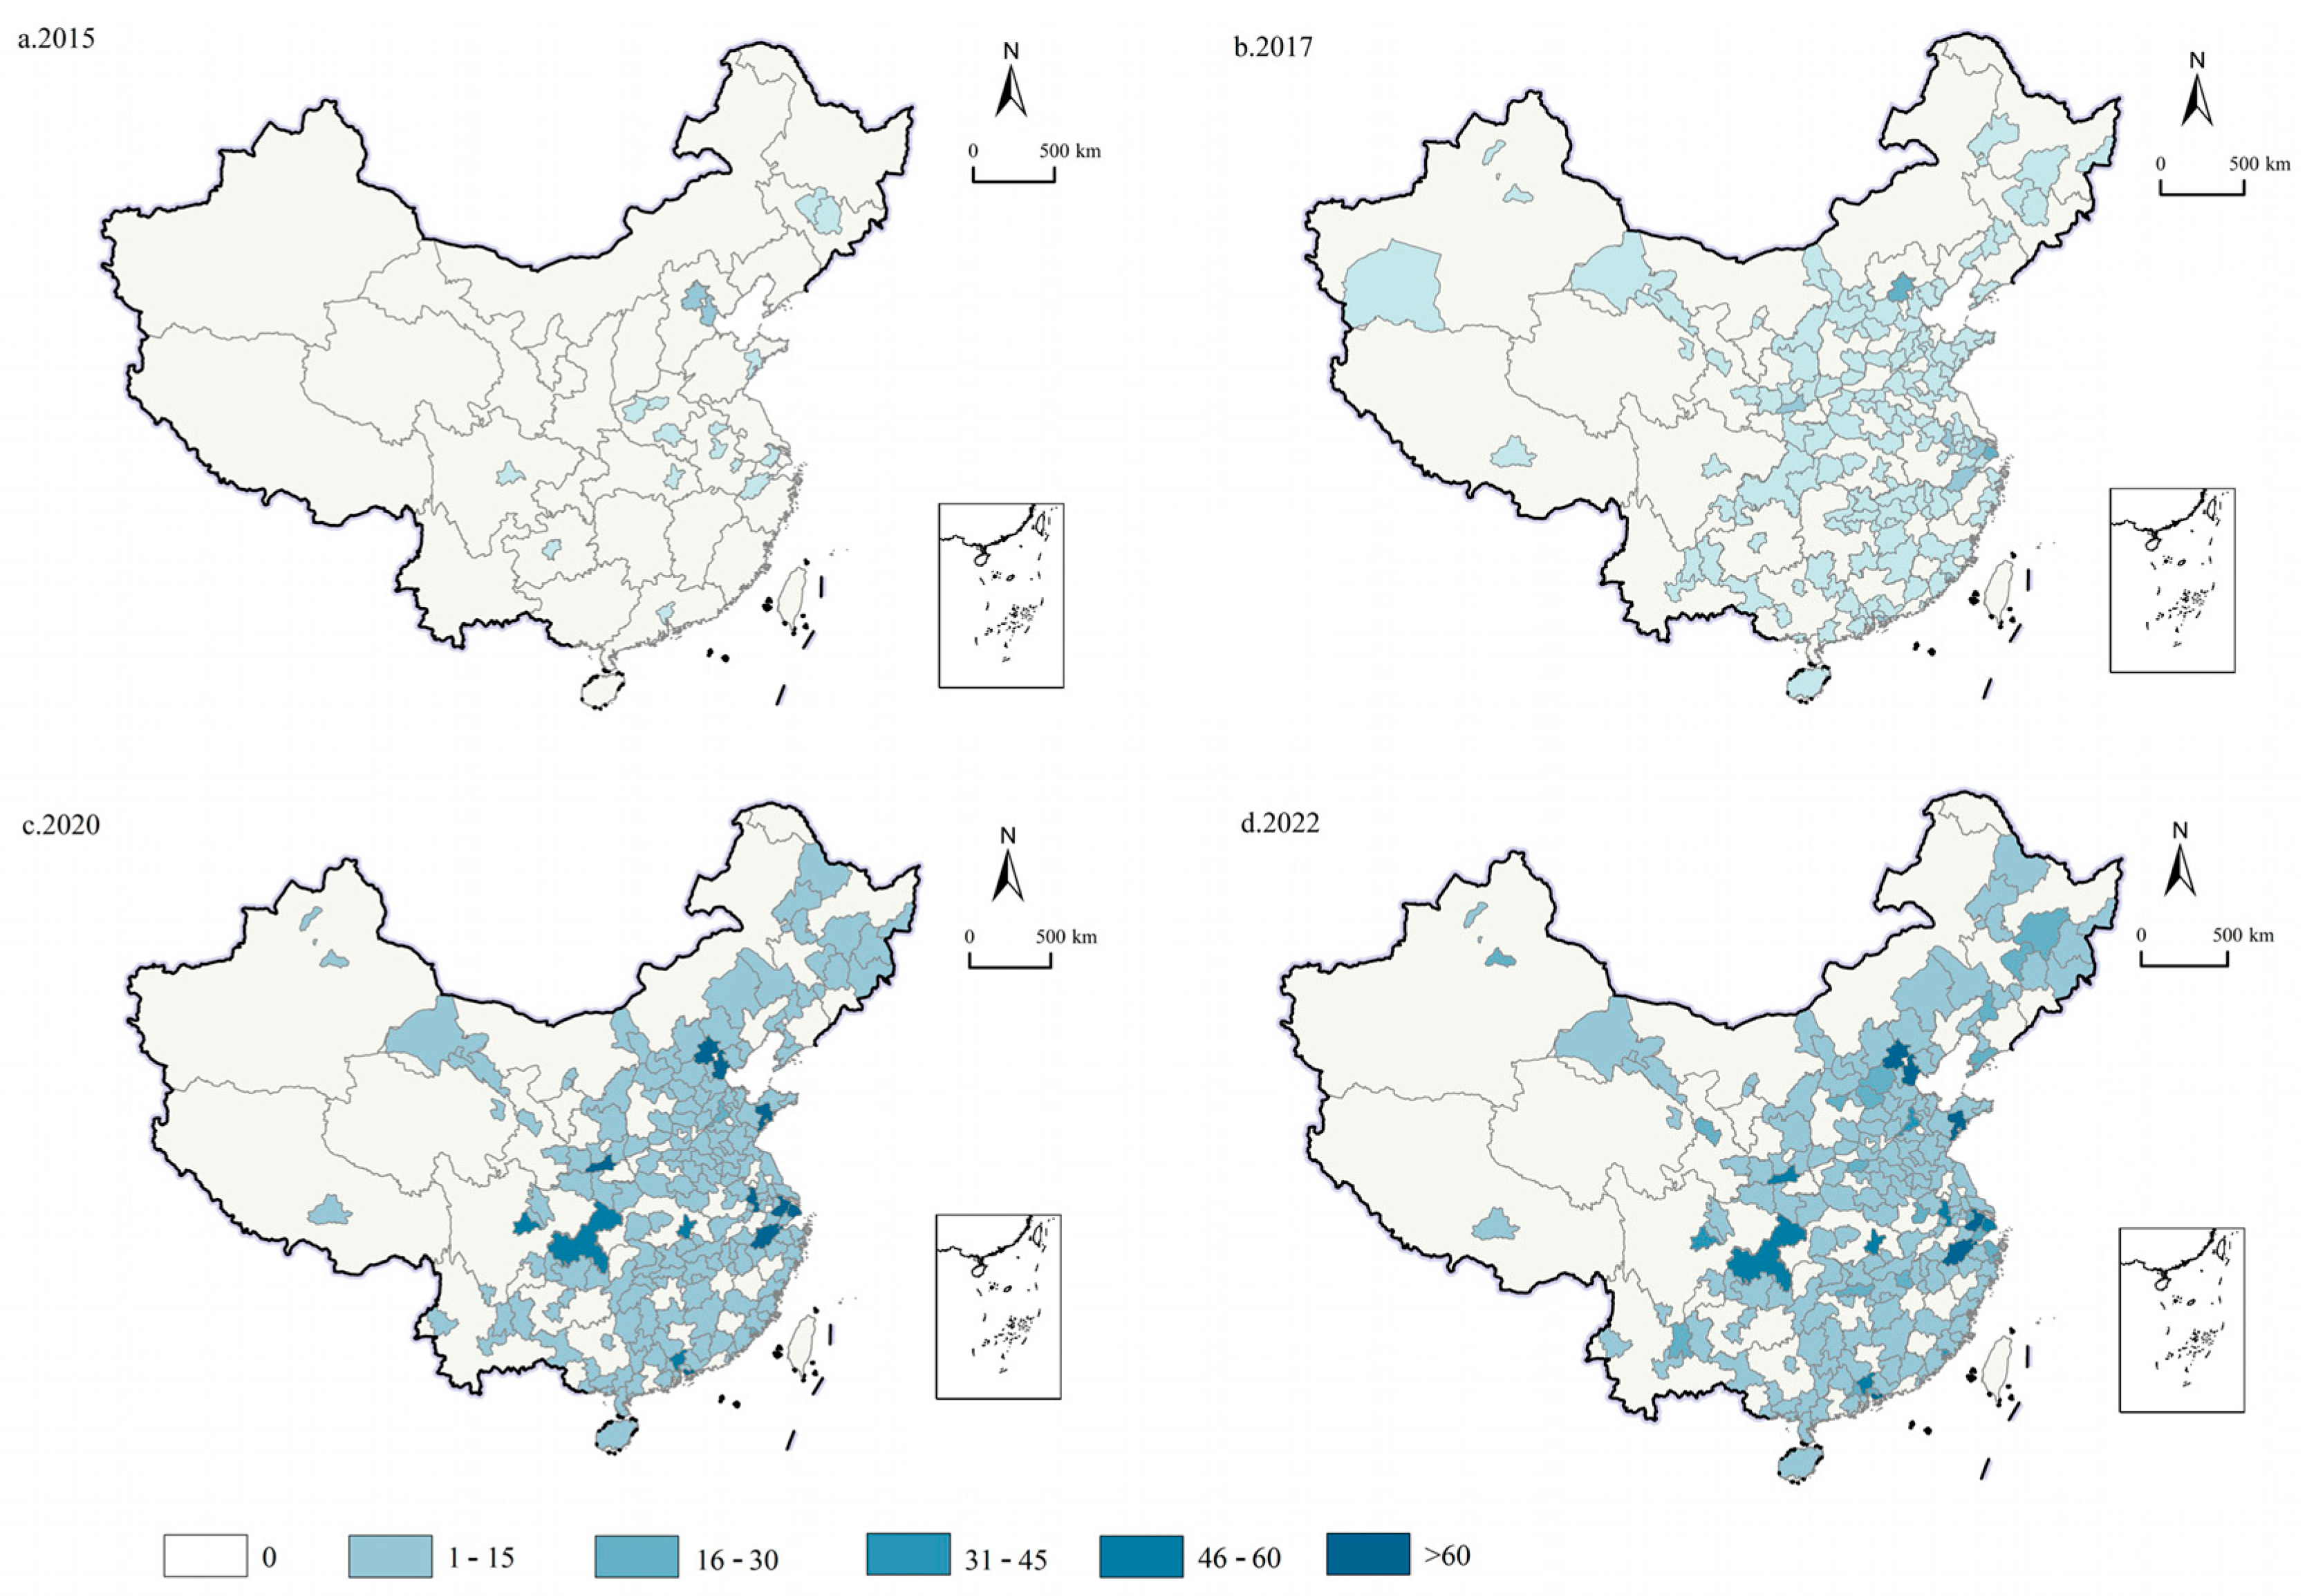
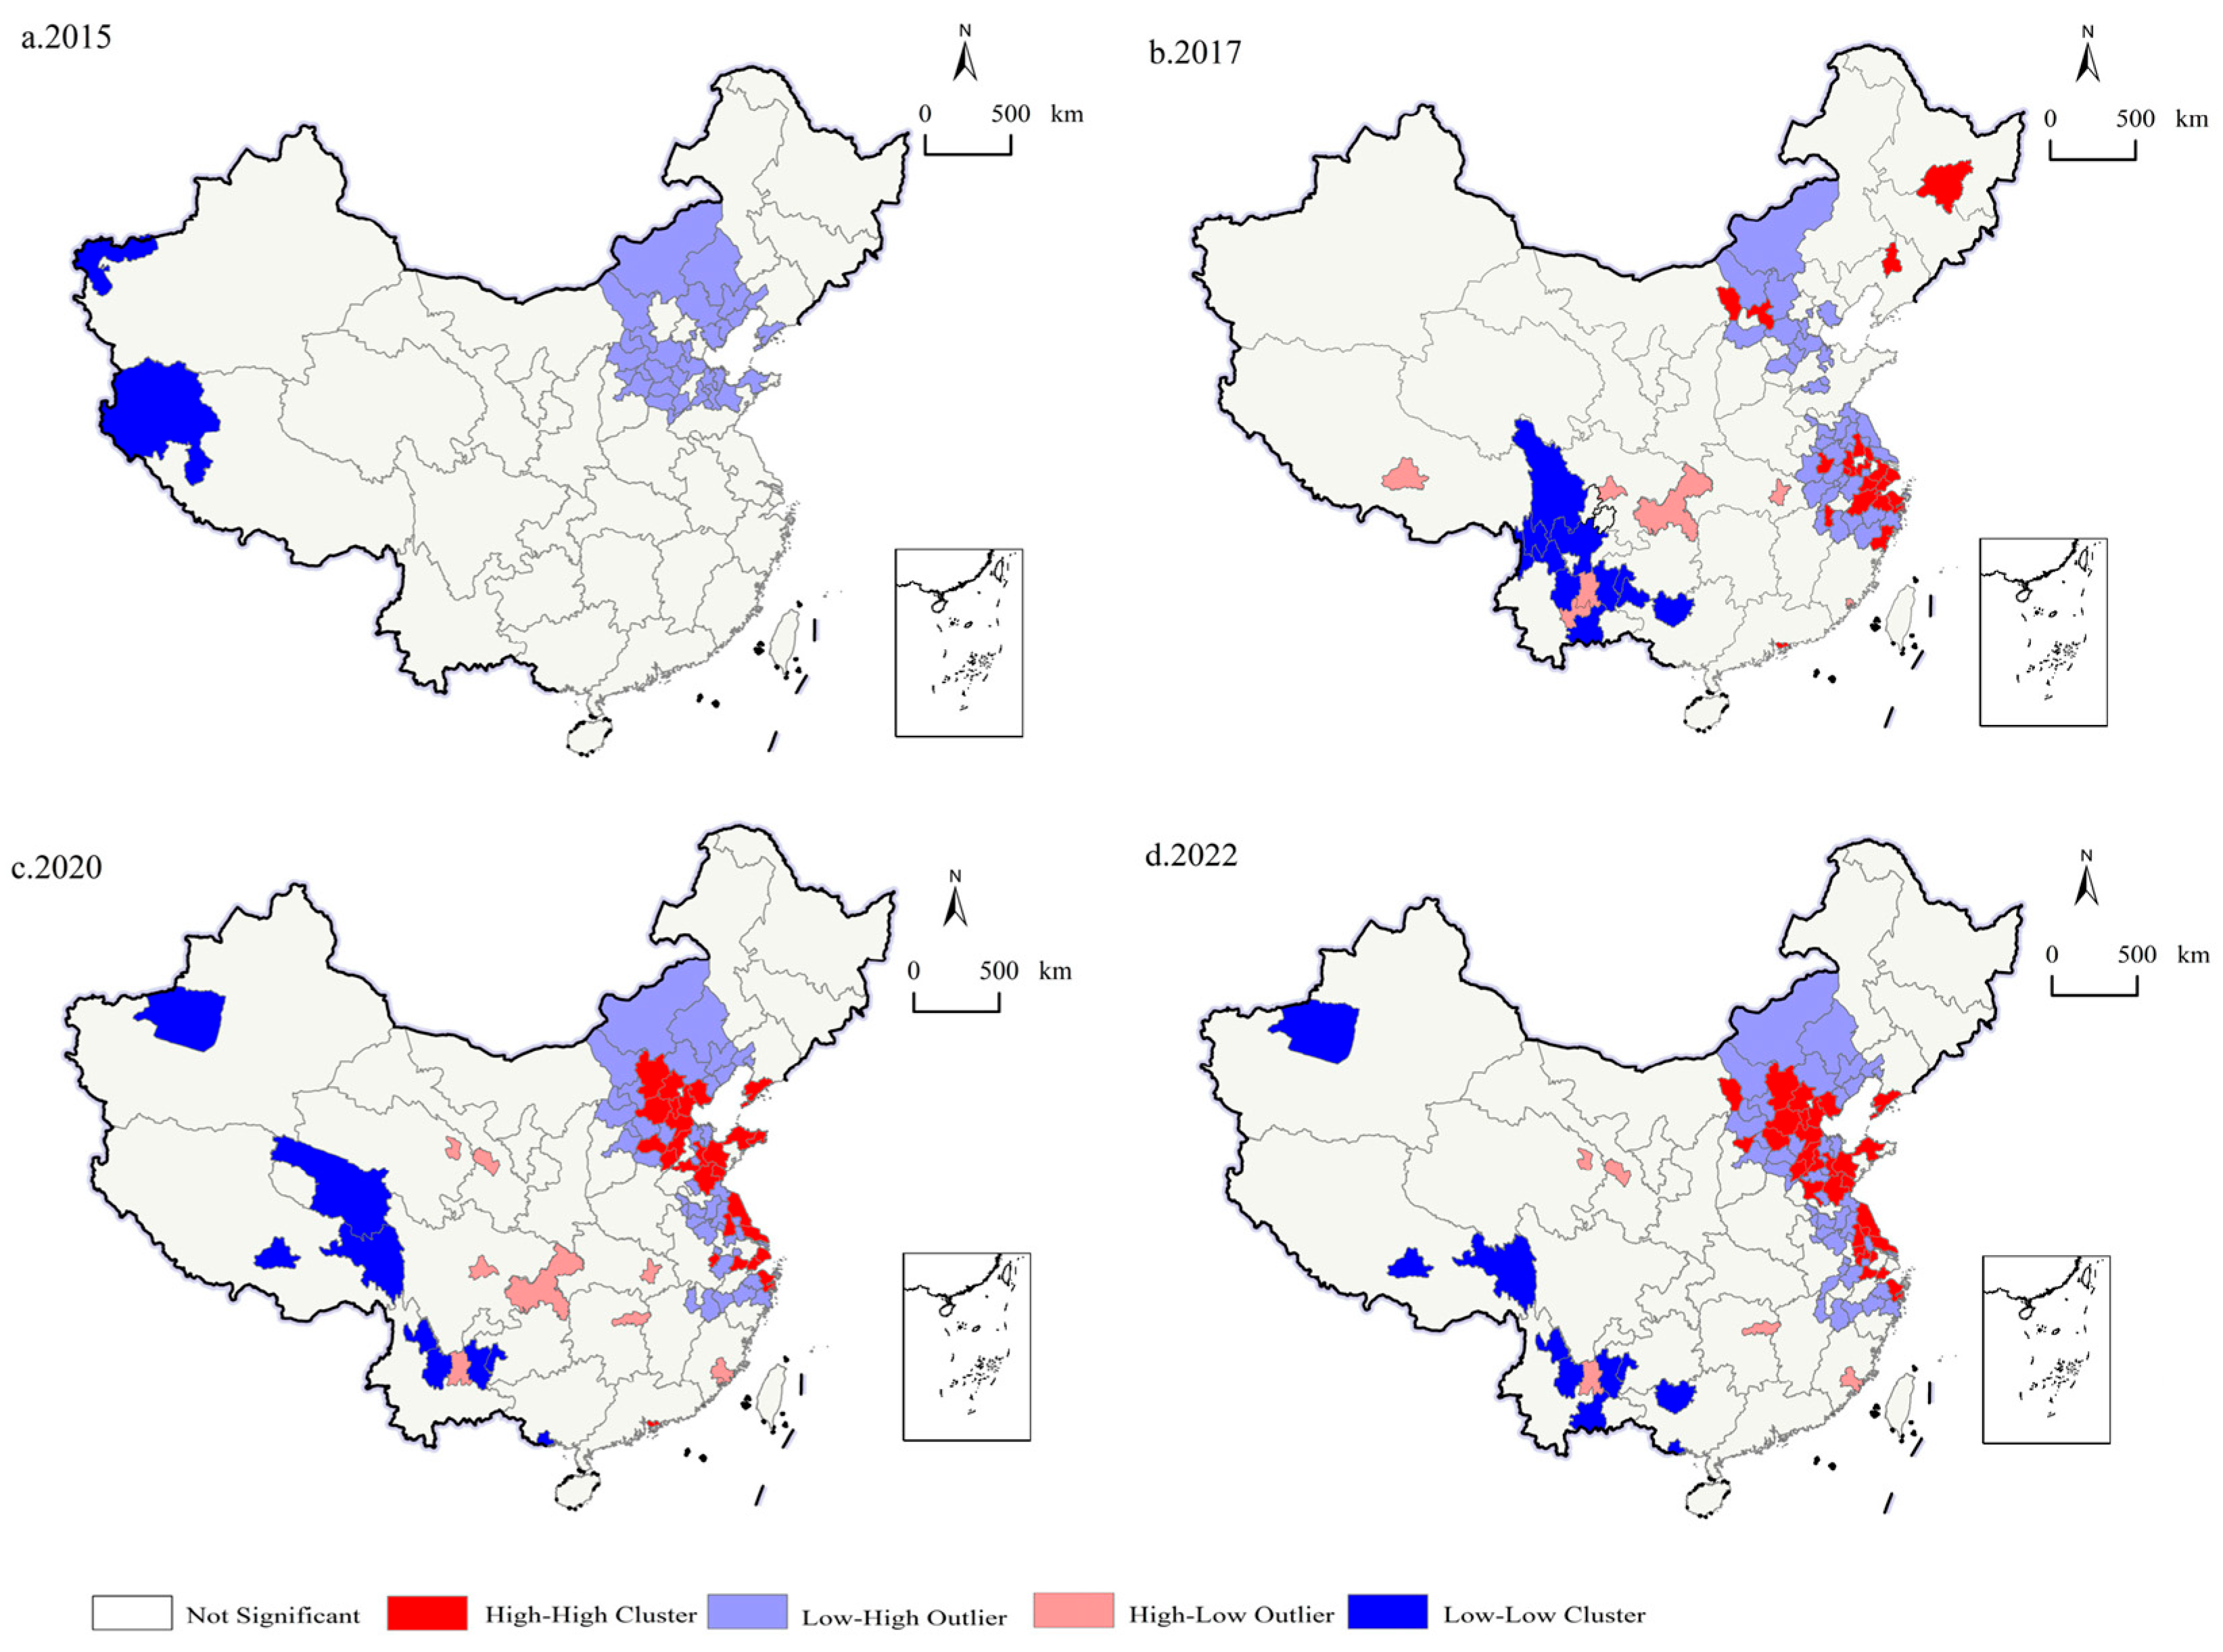
4.1. Overview of CWS Distribution in China

Using kernel density estimation, the characteristics of the annual changes in the number of CWSs in China are shown in Figure 2. Over the study period, the number of CWSs shifted slightly to the right, with a phenomenon of gradually shortening the tail of the curve and a tendency of narrowing the distribution expansion. The total number of CWSs gradually increased over the years.
Examining the peak values of the kernel density curve, it is evident that there is a consistent decreasing trend over the years. In the years from 2015 to 2017, the curve’s summit exhibited a minor alteration, yet it consistently maintained a comparably elevated position relative to other years. This suggests that over this specific time frame, there was minimal disparity in the developmental progress of CWSs in China. In 2018 and 2019, there were no distinct peak values. However, in the years from 2020 to 2022, the top of the curve remained at a lower level, suggesting significant differences in the development of CWSs in various cities during this period.
Since the end of 2019, with the outbreak of the COVID-19 pandemic, regions in China began to implement intermittent lockdowns to control the pandemic. This had a significant impact on the real economy. As per data from the “China Torch Statistical Yearbook”, CWSs derive their primary income from four sources: rental revenue, fees for legal and ancillary services, returns on investments in shares, and government subsidies. Rental income and service fees account for about 30–40% of total revenue. During the pandemic, CWSs, which are places with high human traffic, were often closed, leading to limited profitability. For instance, during the pandemic, Xi’an Gaoxin Road Space made the decision to waive one month’s rent for the companies in their facility. CWSs like “CHEKU COFFEE” also self-financed the purchase of epidemic prevention materials for epidemic control. Even when offline work was carried out, daily preventive measures such as registration and disinfection increased the cost of daily work. The pandemic also affected the output of companies, leading to a decrease in investment income for CWS providers. In such a societal context, large cities with a greater scale, better economic development, and higher resilience and flexibility in management still experienced an increase in the number of CWSs. However, smaller and medium-sized cities faced stagnation in development and could also be removed from the list due to not meeting certain standards, widening the disparities between regions.
Based on the analysis of the annual distribution kernel density of CWSs in China in Figure 2, the spatial autocorrelation distribution of CWSs will be further revealed in each year, as shown in Figure 3. We choose to showcase four years of the eight-year research period, including the initial research year of 2015 and the final research year of 2022, as well as the interspersed years of 2017 and 2020. The following conclusions can be drawn from Figure 3: Firstly, the number of CWS distributions is rising significantly and the spatial autocorrelation is increasing significantly when looking at the study period from 2015 to 2022. Second, the distribution structure of CWSs shows that the number of CWSs in densely populated areas is significantly higher than that in non-densely populated areas, and from 2020 onwards, it can be seen that CWSs are particularly distributed and clustered in the Beijing–Tianjin–Hebei region, which is situated in the plains of North China, the Sichuan–Yuzhou region, which is situated in Southwestern China, and the Yangtze River Delta, which is situated in the coastal area of Southeastern China.
According to Moran’s I [35] using the GeoDa 1.16.0.16 software, the global Moran’s I and z-statistics for the years 2015–2022 were calculated to characterize the spatial pattern evolution of the number of CWSs in China. Moran’s I takes values between −1 and 1. A value closer to 0 indicates stronger spatial randomness, while larger absolute differences from 0 suggest a stronger spatial correlation. Using a distance spatial weight matrix, the calculation results are presented in Table 2. As shown in the table, the global Moran’s I values for the number of CWSs in China are positive, except for 2015 and 2016, which had smaller samples but still passed the significance test at the 1% level. It indicates that the number of CWSs in China was positively correlated.
In order to further reveal the spatial relationships among the observed CWSs, a Lisa clustering diagram is plotted in this paper as shown in Figure 4. Four spatial relationships are revealed in the figure: (1) high–high clusters, where high-value regions are adjacent to each other, manifesting themselves in a policy sense as a clustering effect of CWSs; (2) low–low clusters, where low-value regions are adjacent to each other, in the policy sense of being under-incentivized by relevant policies; (3) high–low outliers, where high-value regions are adjacent to low-value regions, in terms of policy implications of possible diffusion effects from high to low; (4) low–high outliers, where low-value regions are adjacent to high-value regions, in terms of policy implications for the possibility of low-to-high imitation or learning effects. In general, high–high clusters of CWS numbers are primarily concentrated in the Beijing–Tianjin–Hebei region, the North China Plain region, and the Yangtze River Delta region, while low–low clusters are mainly found in the Yunnan–Guizhou Plateau region and some areas of Xinjiang. After 2017, this spatial pattern remained relatively stable, as detailed below.
The high–high clusters are primarily located in the Beijing–Tianjin–Hebei region, the North China Plain region, and the Yangtze River Delta region. Over the years from 2015 to 2022, Beijing consistently maintained the highest number of nationally registered CWSs, far surpassing other cities nationwide. Many areas in the Yangtze River Delta, such as Shanghai, also have a substantial number of CWSs. With the passage of time, the dense areas of CWSs have expanded, mainly showing a westward expansion trend. In terms of regional advantages, the North China region has abundant raw material supply, targeted government support, numerous engineering universities, a large target audience base, and capital intensity. On the other hand, the Yangtze River Delta region excels in supporting open-source hardware companies in terms of funding and technology. It is home to a concentration of engineering and art universities and has a high degree of internationalization.
The high–low outliers are mainly distributed in Lanzhou, Gansu Province, Xining, Qinghai Province, Chengdu, Sichuan, Chongqing, Xiamen, Fujian, Wuhan, Hubei, Changsha, Hunan, Guangzhou, and Shenzhen, Guangdong. They are relatively dispersed, indicating that the development of CWSs in the surrounding areas is comparatively weak. These regions serve as growth poles for innovation activities in their respective areas, and their radiating impact is smaller compared to the eastern Yangtze River Delta and the northern Beijing–Tianjin–Hebei urban agglomeration. They have not formed a strong collaborative innovation environment with other cities.

4.2. Assessment of the Effects of CWS Growth in the Pilot Policy of NIDZ

4.2.1. Benchmark Regression Results

The benchmark model results are shown in Table 3. Based on Equation (1), columns (1) to (4) in Table 3 report the regression results for the impact of the NIDZ policy on the development of CWSs under different conditions. Irrespective of the inclusion of control variables, individual fixed effects exhibit a gradual decline, with increasing demands. The impact of the NIDZ policy on the development of CWSs is significantly positive at a confidence level of at least 10%, demonstrating the robustness of the findings.
From the results, it can be seen that cities that have implemented the policy have significantly averagely increased the number of CWSs by three to 14 compared to cities that have not implemented the policy, which indicates that the NIDZ policy significantly promotes the development of CWSs.
To ensure that the sample estimates are not accidental, it is necessary to test whether the empirical results remain robust when some conditions or assumptions change. To address this, this paper conducts five robustness tests in addition to altering the baseline regression conditions as discussed earlier. In summary, Hypothesis 1 is proven.

4.2.2. Heterogeneity Analysis

Due to significant differences in economic development, resource endowments, and social environments among the eastern, northeastern, central, and western regions of China, the discussion of spatial heterogeneity is necessary. Referring to the ‘China Torch Statistical Yearbook’, the sample cities are divided into these four regions. The eastern region includes 10 provinces and cities such as Beijing, Tianjin, Hebei, Shanghai, Jiangsu, Zhejiang, Fujian, Shandong, Guangdong, and Hainan. The central region consists of six provinces and cities, including Shanxi, Anhui, Jiangxi, Henan, Hubei, and Hunan. The western region comprises 12 provinces and cities, such as Inner Mongolia, Guangxi, Chongqing, Sichuan, Guizhou, Yunnan, Tibet, Shaanxi, Gansu, Qinghai, Ningxia, and Xinjiang. The northeastern region covers three provinces: Liaoning, Jilin, and Heilongjiang. Based on the model, policy effect evaluations were conducted, and the results are presented in Table 4.
From Table 4, it can be observed that, except for the central region, the regression coefficients between other regions and the policy variables all pass the significance test. The impact of the policy on the development of CWSs in the western and northeastern regions is particularly significant. From the above, the policy focus on NIDZs will lead to the clustering of CWSs, creating regional imbalances; therefore, Hypothesis 2 is proved. Western and northeastern regions, being less economically developed and having a lower level of digitalization, exhibit a weaker innovation environment. The National Innovation Demonstration Zone policy involves support measures, entrepreneurial guidance, and training for small and medium-sized startups. It fosters an innovative atmosphere and enhances innovation opportunities. For instance, in the Lanzhou–Baiyin National Innovation Demonstration Zone, the local government collaborated with the Shanghai Zhangjiang High-Tech Zone, successfully facilitating cooperation between local businesses and Shanghai’s technology companies while providing research guidance. Additionally, Gansu and Shanghai jointly organized expos and business lectures, promoting collaborative efforts. All of these contribute to cultivating an innovative environment in the western and northeastern regions. From the results, it can be seen that the effect of the NIDZ policy on the construction of CWSs in the relatively more developed eastern and central regions is significantly weaker than in the less developed regions. Hypothesis 3 is proved.

4.3. Robustness Analysis

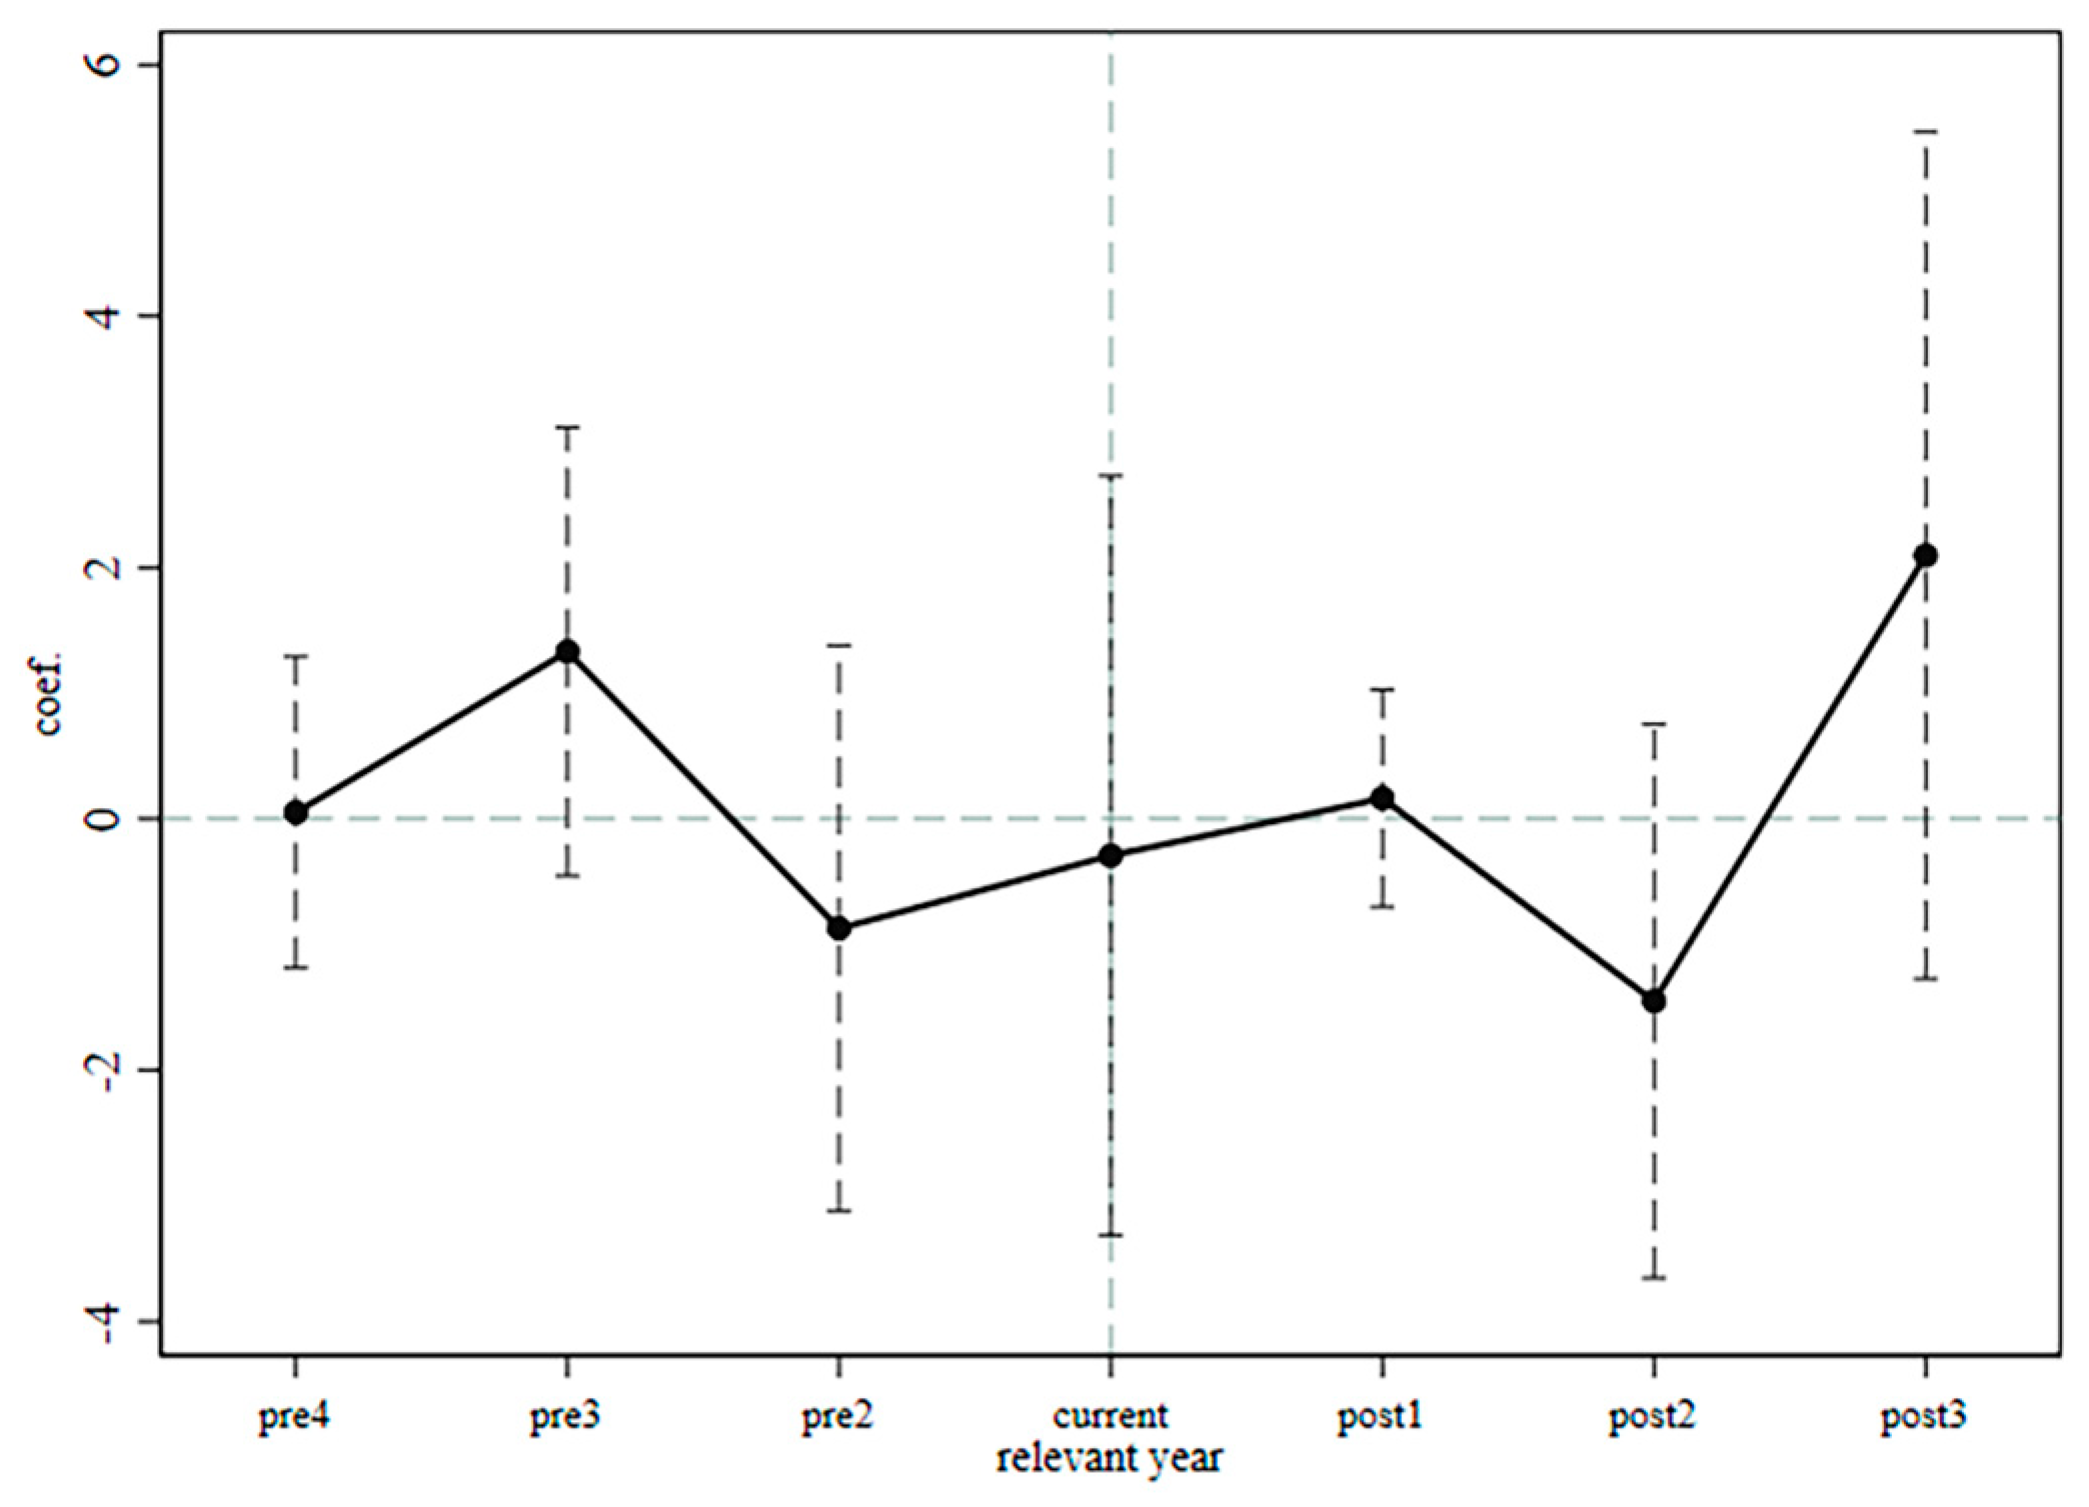
4.3.1. Parallel Trend Test

The time trend plot of the coefficients based on the regression results of Equation (2) is shown in Figure 5. The graph shows the values and their 95 per cent confidence intervals, with the horizontal axis representing the years. Considering the small amount of data for the first 4 years and the last 3 years of the policy implementation, this paper aggregates the data for the first 4 years of the policy implementation into period -4 and the data for the last 3 years of the policy implementation into period -3, characterising the coefficients before and after the policy period in terms of and respectively. The results show that the coefficients of the explanatory variables do not show a clear pattern of change before the policy pilot, and their 95% confidence intervals all contain 0. This suggests that there is no significant difference between policy-implementing and non-policy-implementing cities before and after the policy implementation, and that the hypothesis of a parallel trend is verified to be robust.

4.3.2. PSM Test

This research employs the control variables from the baseline regression as matching indicators, conducting a 1:1 nearest-neighbor matching between treated and control cities at the prefecture level on an annual basis. Under the conditions of propensity score matching (PSM), the regression results are presented in the first column and the second column of Table 4, consistent with the conclusions mentioned earlier in this research.

4.3.3. Exclusion of Other Relevant Policy Interference

Due to the concurrent existence of other innovation-related policies during the same period, such as the National Digital Economic Innovation Development Pilot Zones, Innovative City Construction, Smart City Creation, National Big Data Comprehensive Pilot Zones, and Broadband China Demonstration Cities, it is possible that this may affect the robustness of the conclusions. To address this concern, this research collected lists of these five coexistent innovative policies and introduced them as virtual variables into Equation (1). The regression results, as shown in the third column and the fourth column of Table 5, indicate that the conclusions remain robust even after controlling for the potential interference from these policies.

4.3.4. Exclusion of Selected Key Innovative Cities
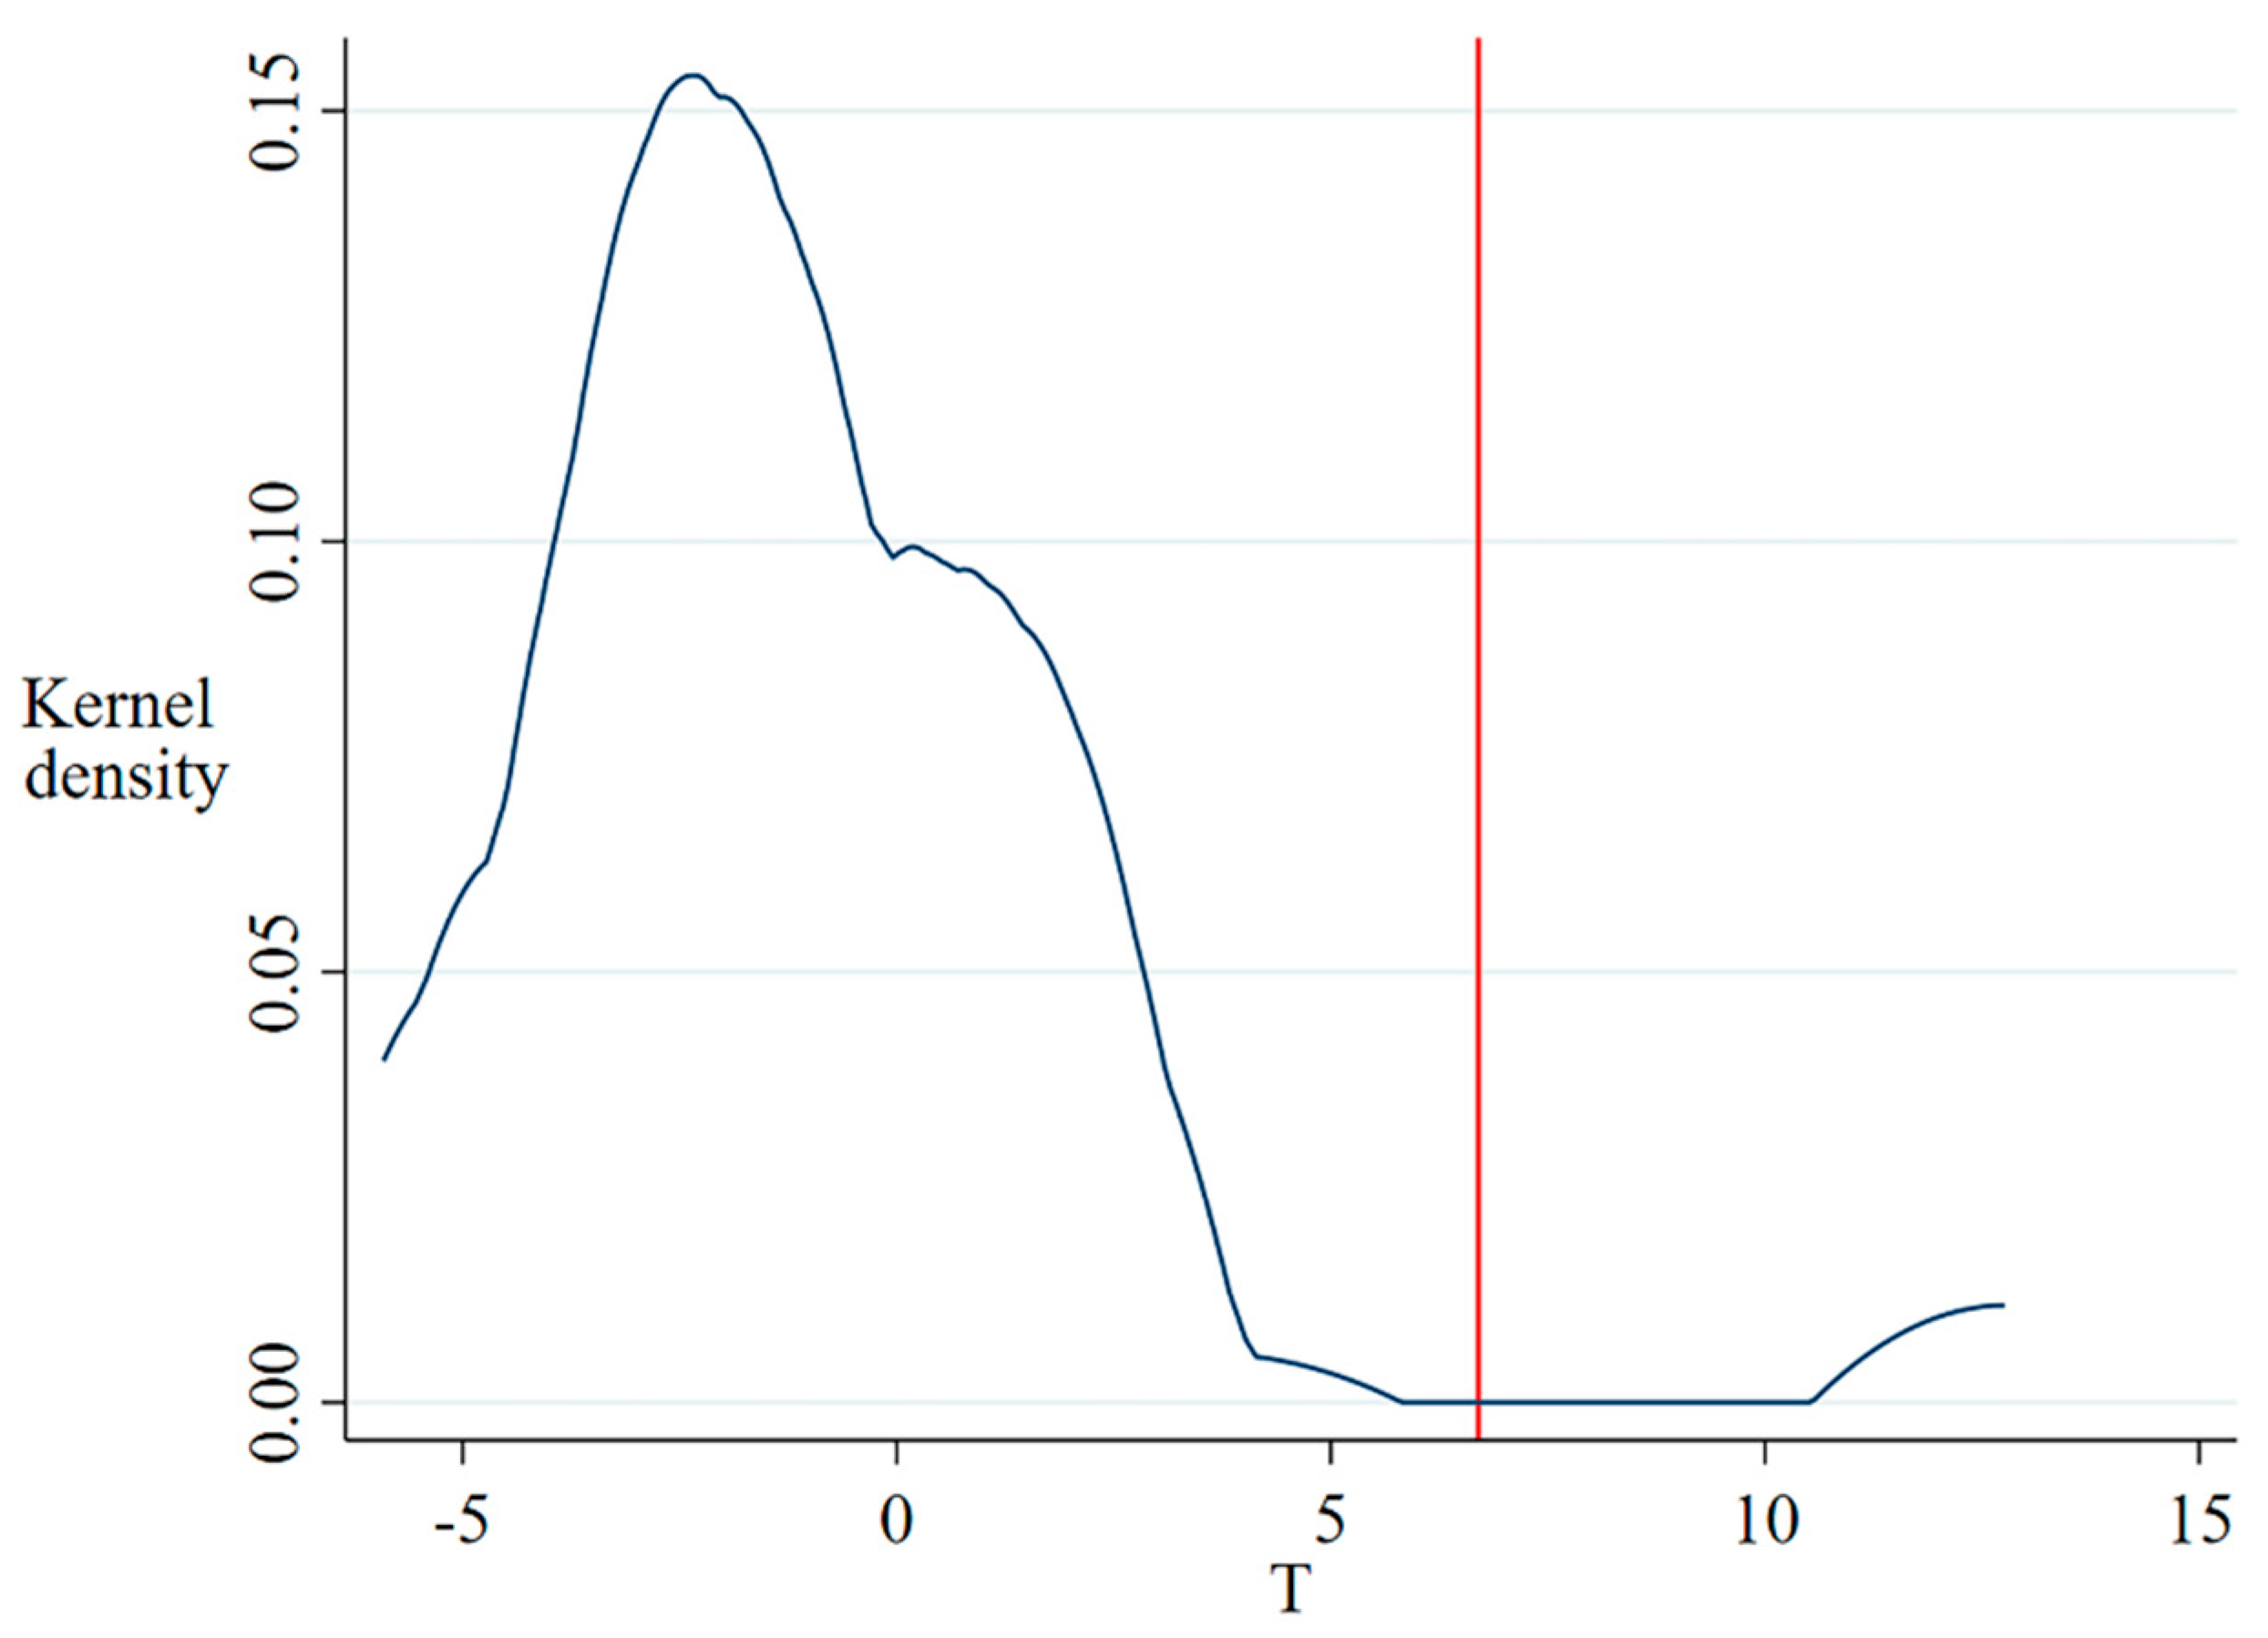
Another potential source of concern regarding the robustness of the conclusions in this paper may arise from certain key innovation cities, especially those with high R&D investments driven by supply-side reforms and the demand for high-quality development. The development of CWSs in these cities may differ from that in other cities. To address this, the paper excluded key innovation cities from the sample, including Beijing, Tianjin, Hangzhou, Wuhan, Guangzhou, and Chengdu. Subsequently, regression analysis was conducted on the sub-sample. The results, shown in the fifth column and the sixth column of Table 4 indicate that all coefficients remain significantly positive. This suggests that the rapid development of CWSs is not limited to key innovation cities and underscores the universality of the impact of the NIDZ policy on CWSs.

4.3.5. Placebo Test

To further verify that the differences in CWSs between the treatment and control groups are indeed due to the NIDZ policy, this paper conducted a placebo test. Following the six batches of cities that implemented the “National Independent Innovation Demonstration Zone” policy as described earlier, while keeping the year constant, an equal number of hypothetical control groups were randomly selected 1000 times. This resulted in 1000 sets of estimated coefficients and t-test values. A t-value kernel density plot, as shown in Figure 6, displays these results. The red solid line represents the t-value from the baseline regression. It is evident from the graph that the vast majority of the hypothetical groups have regression coefficients that are significantly different from the t-value obtained in this paper. This demonstrates the robustness of the conclusions presented earlier.

5. Conclusions

The level of informatization promotes the development of CWSs. CWSs, as multi-party entities with non-single functionality structures, still possess distinct characteristics even when their primary focus is encouraging sustainable innovation and entrepreneurship. Furthermore, the question of how regional policies affect the location patterns of new workspaces is worth exploring. Due to limited knowledge of its spatial distribution and the impact of policies, this study employs an existing dataset of CWSs nationwide in China to address these questions.
Several conclusions are drawn from the analysis. First, CWSs exhibit a certain degree of agglomeration characteristics, and during the pandemic, regional development disparities have widened. Additionally, this study finds that the development of CWSs demonstrates spatial spillover effects, with increasing density in the western region. Although this study has controlled for factors such as economic level and digitalization, the establishment of National Innovation Demonstration Zones still has a significant impact on the sustainable development of CWSs. This influence is particularly significant in less developed regions, such as the western or northwestern parts of China.
While this research has made some progress in understanding the distribution characteristics of CWSs and their policy effects, it is important to consider the ambiguity of CWSs and incubators in practice in China. CWSs may not necessarily target all entrepreneurial groups, and their operators may have governmental ties and be closely related to the policies of National Innovation Demonstration Zones, implying some degree of endogeneity in the model. Therefore, specific case studies are still necessary.
The study highlights that the pandemic has exacerbated regional disparities in the development of CWSs. In 2022, which marks the end of the study period, the pandemic still has some impact, as many small and medium-sized enterprises have not yet benefited from the government’s support for resumption of work and production. Given that the implementation of specific policies for resumption of work and production and their widespread dissemination require some time, future research can continue to focus on the distribution characteristics of CWSs and the enterprises (teams) that use them after benefiting from support policies, comparing the findings with the results of this study. Finally, while we conducted research based on the sustainable development of CWSs, future research can further explore the issue of CWSs from other perspectives, such as the digital entrepreneurial ecosystem and urban resilience.

Author Contributions

Conceptualization, X.X.; Methodology, X.X.; Software, X.X.; Validation, X.X.; Formal analysis, X.X.; Investigation, M.W.; Resources, M.W.; Data curation, M.W.; Writing—original draft, X.X.; Writing—review & editing, M.W.; Visualization, X.X.; Supervision, M.W.; Project administration, X.X.; Funding acquisition, M.W. All authors have read and agreed to the published version of the manuscript.

Funding

This research was funded by Shanghai Municipal Education Commission grant number 2021-01-07-00-08-E00130.

Institutional Review Board Statement

Not applicable.

Informed Consent Statement

Not applicable.

Data Availability Statement

The raw data supporting the conclusions of this article will be made available by the authors on request.

Conflicts of Interest

The authors declare no conflict of interest.

References

  1. Berbegal-Mirabent, J. What do we know about co-working spaces? Trends and challenges ahead. Sustainability 2021, 13, 1416. [Google Scholar] [CrossRef]
  2. Boschma, R. Editorial: Role of Proximity in Interaction and Performance: Conceptual and Empirical Challenges. Reg. Stud. 2005, 39, 41–45. [Google Scholar]
  3. Ferreira, C.; Diogo, V. Co-working spaces in Porto, Portugal: Collaborative economy within capitalism reforms or anti-capitalist experiences? Rev. Nava 2018, 3, 44–58. [Google Scholar]
  4. Oldenburg, R. The Great Good Place: Cafes, Coffee Shops, Bookstores, Bars, Hair Salons, and Other Hangouts at the Heart of a Community; Da Capo Press: Boston, MA, USA, 1999. [Google Scholar]
  5. Sternberg, R. Entrepreneurship and geography—Some thoughts about a complex relationship. Ann. Reg. Sci. 2022, 69, 559–584. [Google Scholar]
  6. Spinuzzi, C. Working alone together: Coworking as emergent collaborative activity. J. Bus. Tech. Commun. 2012, 26, 399–441. [Google Scholar]
  7. Tiwari, A. Understanding the shared working spaces: A geography of co-working supply in Delhi. Geojournal 2023, 88, 3439–3453. [Google Scholar]
  8. Wang, W.; Liang, J.; Niu, J. Site selection of Co-working spaces under the influence of multiple factors: A case study in Hangzhou, China. Sustainability 2022, 14, 2676. [Google Scholar] [CrossRef]
  9. Van Holm, E.J. Makerspaces and local economic development. Econ. Dev. Q. 2017, 31, 164–173. [Google Scholar]
  10. Clifton, N.; Füzi, A.; Loudon, G. Coworking in the digital economy: Context, motivations, and outcomes. Futures 2022, 135, 102439. [Google Scholar]
  11. Micek, G. Studies of proximity in coworking spaces: The basic conceptual challenges. Eur. Spat. Res. Policy 2020, 27, 9–35. [Google Scholar]
  12. Nakano, D.; Shiach, M.; Koria, M.; Vasques, R.; Dos Santos, E.G.; Virani, T. Coworking spaces in urban settings: Prospective roles? Geoforum 2020, 115, 135–137. [Google Scholar] [CrossRef]
  13. Pirogova, O.; Temnova, N. Dynamics of Coworking Growth in the Real Estate Market Under Digitalization; E3S Web of Conferences; EDP Sciences: Les Ulis, France, 2021; p. 10052. [Google Scholar]
  14. Coll-Martínez, E.; Méndez-Ortega, C. Agglomeration and coagglomeration of co-working spaces and creative industries in the city. Eur. Plan. Stud. 2023, 31, 445–466. [Google Scholar] [CrossRef]
  15. Mariotti, I.; Pacchi, C.; Di Vita, S. Co-working spaces in Milan: Location patterns and urban effects. In New Urban Geographies of the Creative and Knowledge Economies; Routledge: Abingdon, UK, 2019; pp. 47–66. [Google Scholar]
  16. Kinsman, N.; Marris, N.; Oakman, J. The impact of coworking spaces on workers’ performance, mental and physical health: A scoping review. Work 2024, 77, 61–75. [Google Scholar] [CrossRef]
  17. Füzi, A.; Clifton, N.; Loudon, G. New in-house organizational spaces that support creativity and innovation: The co-working space. In Proceedings of the R & D Management Conference 2014, Stuttgart, Germany, 3–6 June 2014. [Google Scholar]
  18. Fan, C.C.; Scott, A.J. Industrial agglomeration and development: A survey of spatial economic issues in East Asia and a statistical analysis of Chinese regions. Econ. Geogr. 2003, 79, 295–319. [Google Scholar] [CrossRef]
  19. Marino, M.D.; Rehunen, A.; Tiitu, M.; Lapintie, K. New working spaces in the Helsinki Metropolitan Area: Understanding location factors and implications for planning. Eur. Plan. Stud. 2023, 31, 508–527. [Google Scholar] [CrossRef]
  20. Tisdell, C. Information technology’s impacts on productivity and welfare: A review. Int. J. Soc. Econ. 2017, 44, 400–413. [Google Scholar] [CrossRef]
  21. Curtis, C.; Olaru, D. The relevance of traditional town planning concepts for travel minimization. Plan. Pract. Res. 2010, 25, 49–75. [Google Scholar] [CrossRef]
  22. Audretsch, D.; Colombelli, A.; Grilli, L.; Minola, T.; Rasmussen, E. Innovative start-ups and policy initiatives. Res. Policy 2020, 49, 104027. [Google Scholar] [CrossRef]
  23. Howell, S.T. Financing innovation: Evidence from R&D grants. Am. Econ. Rev. 2017, 107, 1136–1164. [Google Scholar]
  24. Fai, F.M.; Tomlinson, P.R.; Barzotto, M. Coworking spaces and regional development: A role for policy. Reg. Stud. 2024, 1–16. [Google Scholar] [CrossRef]
  25. Sager, T. Neo-liberal urban planning policies: A literature survey 1990–2010. Prog. Plan. 2011, 76, 147–199. [Google Scholar]
  26. Girija, S.; Sharma, D.R.; Yeediballi, T.; Sriramneni, C. Factors influencing the intention to use co-working spaces in emerging markets: An analytic hierarchy process approach. Prop. Manag. 2024, 42, 235–255. [Google Scholar]
  27. Avdikos, V.; Papageorgiou, A. Public support for collaborative workspaces: Dispersed help to a place-based phenomenon? Local Econ. 2021, 36, 669–682. [Google Scholar]
  28. Christino, J.M.M.; Cardozo, É.A.A.; Petrin, R.; Carrieri, A.D.P.; Silva, J.O. Understanding the adoption of co-working spaces. Int. J. Serv. Oper. Manag. 2022, 42, 315–338. [Google Scholar]
  29. Huang, Y.; Pei, X.; Liu, J. The Influencing of the Government’s Entrepreneurial Support Policies Conducive to the Incubation of Maker Space. Sci. Technol. Prog. Policy 2019, 36, 111–116. [Google Scholar]
  30. Mourad, H.; Shafik, Z.; El-Husseiny, M. Space-time mapping of co-working spaces in Cairo: Shifting paradigms from openness to technologically controlled spaces. J. Eng. Appl. Sci. 2021, 68, 39. [Google Scholar]
  31. Orel, M.; Mayerhoffer, M.; Fratricova, J.; Pilkova, A.; Starnawska, M.; Horvath, D. Coworking spaces as talent hubs: The imperative for community building in the changing context of new work. Rev. Manag. Sci. 2022, 16, 1503–1531. [Google Scholar]
  32. Jackson, D.; Shan, H.; Meek, S. Enhancing graduates’ enterprise capabilities through work-integrated learning in co-working spaces. High. Educ. 2022, 84, 101–120. [Google Scholar] [CrossRef]
  33. Ayodele, T.O.; Kajimo-Shakantu, K.; Gbadegesin, J.T.; Babatunde, T.O.; Ajayi, C.A. Exploring investment paradigm in urban office space management: Perspectives from coworking space investors in Nigeria. J. Facil. Manag. 2022, 20, 19–31. [Google Scholar]
  34. Kojo, I.; Nenonen, S. Evolution of co-working places: Drivers and possibilities. Intell. Build. Int. 2017, 9, 164–175. [Google Scholar]
  35. Anselin, L. Lagrange multiplier test diagnostics for spatial dependence and spatial heterogeneity. Geogr. Anal. 1988, 20, 1–17. [Google Scholar]
Figure 1. Establishment year of National Innovation Demonstration Zones. Note: The map of China is drawn to the standard scale, and the review number is GS(2023)2767. There is no modification to the base.
Sustainability 17 03017 g001
Figure 2. Kernel density curve for CWSs in China.
Sustainability 17 03017 g002
Figure 3. Distribution of CWSs by year. Note: The map of China is drawn to the standard scale, and the review number is GS(2023)2767. There is no modification to the base.
Sustainability 17 03017 g003
Figure 4. Lisa cluster of CWSs by year. Note: The map of China is drawn to the standard scale, and the review number is GS(2023)2767. There is no modification to the base.
Sustainability 17 03017 g004
Figure 5. Parallel trend.
Sustainability 17 03017 g005
Figure 6. Placebo test. Note: The red solid line represents the t-value from the baseline regression.
Sustainability 17 03017 g006
Table 1. Descriptive statistics for variables.
VariablesIndicatorsMeanStd.DevMaxMint-Value
CWSThe number of CWSs (CWSs)4.3812.64158017.19
Level of openness to the outside world
Human capital
The proportion of import and export trade to the regional GDP (IMP&EXP)0.170.192.49039.61
The number of university students per ten thousand people in the population (Pop_stu)198.66206.721311.244.7943.73
The year-end number of employed personnel (Pop_emy)12.830.7516.110.16780.25
Level of research and development investmentNumber of patent applications for inventions (IP)930.953454.3845,091013.09
Proportion of research and development expenditure to the regional GDP (R&D)10.571.5315.536.25315.1
Proportion of scientific and technological expenditures to the regional GDP9.631.9715.533222.61
Level of digitizationThe number of broadband internet access users per hundred people (Dig_net)4.8522.42466.7109.84
The proportion of employed personnel in the information transmission, computer services, and software industry (Dig_pop)0.010.010.11068.7
Table 2. Moran’s I of the number of CWSs.
YearMoran’s Iz
20150.0020.2997
20160.0110.8668
20170.039 ***3.2059
20180.029 **2.0323
20190.029 **2.0593
20200.033 **2.2316
20210.038 ***2.5837
20220.034 **2.3457
Standard errors in parentheses. * p < 0.1, ** p < 0.05, *** p < 0.01.
Table 3. Impact of policies on the development of CWSs.
(1)(2)(3)(4)
DID14.184 ***5.100 ***2.491 **3.258 *
(2.115)(1.692)(1.152)(1.937)
IMP&EXP 6.288 **7.492 **
(3.124)(3.349)
Pop_stu −0.000−0.009 **
(0.002)(0.004)
R&D 1.199 ***0.238
(0.313)(0.314)
STE 0.723 ***0.209
(0.204)(0.188)
Pop_emy −2.273 ***−1.789 **
(0.599)(0.837)
Dig_net 0.005−0.003
(0.011)(0.006)
Dig_pop 115.879 **110.524
(47.590)(67.540)
IP 0.002 ***0.004 ***
(0.000)(0.001)
N2448244820712071
R20.5200.7530.7540.870
Control variablesNoNoYesYes
Year fixed effectYesYesYesYes
Individual fixed effectNoProvinceProvinceCity
Standard error clustered levelCityCityCityCity
Standard errors in parentheses. * p < 0.1, ** p < 0.05, *** p < 0.01.
Table 4. Analysis of regional heterogeneity.
(1)(2)(3)(4)
Eastern Central Western Northwestern
DID2.273 *0.6469.787 ***7.404 ***
(1.346)(0.740)(3.291)(2.433)
N616559657238
R20.7850.6590.7270.782
Control variablesYesYesYesYes
Year fixed effectYesYesYesYes
Individual fixed effectProvinceProvinceProvinceProvince
Standard error clustered in city levelIndividualIndividualIndividualIndividual
Standard errors in parentheses. * p < 0.1, ** p < 0.05, *** p < 0.01.
Table 5. Robustness check.
(1)(2)(3)(4)(5)(6)
DID5.605 ***1.462 *8.855 ***2.606 **12.227 ***2.543 **
(1.029)(0.776)(2.047)(1.130)(2.117)(1.091)
N176717672448207124002029
R20.2950.4690.6000.7590.3720.675
Control variablesNoYesNoYesNoYes
Year fixed effectYesYesYesYesYesYes
Individual fixed effectProvinceProvinceProvinceProvinceProvinceProvince
Standard error clustered levelCityCityCityCityCityCity
PSM YesYes
Exclusion of other policies YesYes
Exclusion of other innovative cities YesYes
Standard errors in parentheses. * p < 0.1, ** p < 0.05, *** p < 0.01.
Disclaimer/Publisher’s Note: The statements, opinions and data contained in all publications are solely those of the individual author(s) and contributor(s) and not of MDPI and/or the editor(s). MDPI and/or the editor(s) disclaim responsibility for any injury to people or property resulting from any ideas, methods, instructions or products referred to in the content.

