1. Introduction
The global capacity for renewable energy has grown remarkably, increasing by 40.8% from 473 GW in 2023 to 666 GW in 2024 [
1,
2]. This unprecedented surge is primarily attributed to advancements in solar photovoltaic and wind energy technologies, which are crucial in mitigating climate change and reducing dependency on finite fossil fuel reserves [
3,
4]. Among these, wind energy holds a prominent position as a scalable, cost-effective, and environmentally sustainable resource [
5]. Wind farms, composed of multiple turbines, convert wind’s kinetic energy into electricity. However, achieving optimal turbine placement within wind farms is a significant technical challenge due to the aerodynamic wake effect and other site-specific constraints [
6,
7].
Although abundant and renewable, wind resources are not uniformly distributed and are subject to considerable variability, influenced by local topographical and climatic factors [
8,
9]. For instance, Algeria’s vast area of 2.382 million km
2 showcases stark contrasts in wind energy potential across its regions. Coastal zones like Annaba, Oran, and Béjaia benefit from strong wind acceleration due to the Tellian Atlas relief, while regions such as Adrar Kabertan in the southwest exhibit exceptional wind capacity that is conducive to electricity generation [
10,
11]. Conversely, lowland interior regions typically possess limited wind potential, underscoring the necessity for strategic and optimized wind turbine placement to maximize energy production, while addressing site-specific limitations and environmental challenges [
12,
13].
The aerodynamic wake effect—a key consideration in wind farm optimization—occurs when upstream turbines create turbulence that reduces wind speed and efficiency for downstream turbines. This phenomenon necessitates a delicate balance between turbine density, spacing, and overall energy efficiency to ensure a wind farm’s economic and technical viability [
14,
15]. Addressing this challenge is particularly important for regions with limited wind resources, where maximizing output is essential for project feasibility.
Integrating artificial intelligence (AI) algorithms in renewable energy systems has become indispensable for enhancing efficiency, energy forecasting, and predictive maintenance [
16]. The optimization of wind farm layouts has evolved since the pioneering work of Mosetti et al. (1994), who first introduced genetic algorithms (GAs) for optimizing wind turbine placement. Building on this foundation, Kennedy and Eberhart (1995) developed the particle swarm optimization (PSO) algorithm, inspired by the collective behavior of social organisms, offering an alternative heuristic approach for wind farm layout optimization [
17,
18]. Grady et al. (2005) refined the GA-based method by introducing a larger population size, improving search space exploration and convergence rates [
19].
As optimization techniques evolved, Marmidis et al. (2008) introduced Monte Carlo simulation as a complementary tool for heuristic-based wind turbine placement [
20]. In 2010, González et al. expanded on these methodologies by proposing a multi-objective approach that integrated turbine layout optimization with electrical network design and topographical constraints, leading to a more comprehensive framework for wind farm development [
21]. Their contributions culminated in 2014 when they published a detailed review that consolidated advancements in the field [
22].
The year 2015 was particularly transformative in wind farm optimization research. Feng and Shen (2015) combined GA with random search methods, enhancing solution diversity, while Shafiq-ur-Rehman Massan et al. introduced the firefly algorithm to evaluate wind farm energy capacity [
23,
24]. Gao et al. (2016) further advanced the field by incorporating environmental constraints into optimization models, ensuring that turbine placement decisions accounted for ecological impacts and resource variability [
25].
By 2021, optimization approaches had become increasingly refined and diversified. Wu and Wang (2021) developed an improved ant colony optimization (ACO) algorithm for wind farm layout, while Çelik et al. enhanced the PSO method with novel improvements in parameter adaptation and search efficiency [
26,
27]. Ogunjuyigbe (2021) took a more practical approach, considering multidirectional wind patterns and refining GA-based solutions for real-world wind farm scenarios [
28].
Asfour et al. (2022) recently proposed a hybrid approach, integrating an optimized GA with Jensen’s wake model to maximize energy production and minimize costs [
29]. Their findings demonstrated that increasing GA iterations improved turbine placement configurations, leading to significant productivity gains.
These studies contribute to the development of bio-inspired metaheuristic algorithms, particularly evolutionary algorithms based on the mechanisms of Darwinian evolution [
30], which can effectively solve complex optimization problems in wind farms. However, the research highlights the need for a more thorough justification of algorithmic parameter selection.
Although several studies have indicated that GAs offer good results in optimizing the layout of wind farms, little attention has been paid to the study of their parameters. While this paper references previous works [
17,
19,
31], its primary focus is on a different topic. The present study bridges a critical gap in wind farm optimization by introducing a systematic and statistically driven approach for fine-tuning GA parameters. While GAs have been widely applied in wind farm layout optimization, limited research has focused on optimizing their internal parameters to enhance both computational efficiency and solution accuracy. Existing studies primarily employ default or empirically chosen crossover and mutation rates, leading to suboptimal convergence and inconsistent results.
To address this limitation, this study implements a design of experiments (DOE) framework, specifically a complete factorial design, to systematically analyze interaction effects between crossover and mutation coefficients. This structured tuning approach provides quantifiable insights into how these parameters influence energy production outcomes and computational efficiency, ensuring a robust and adaptable optimization process. By refining GA parameter selection, this research significantly improves the precision, reliability, and scalability of GA-based wind farm layout optimization, making it a more effective tool for advancing renewable energy solutions.
Beyond its technical contributions, the study has broader implications for developing efficient and sustainable wind energy systems. By integrating systematic optimization techniques, the proposed methodology offers practical applications for resource-constrained regions such as Algeria, where maximizing wind farm efficiency is crucial to meeting increasing energy demands. Furthermore, the approach lays a foundation for future advancements, including real-time smart grid integrations, which could adapt dynamically to changing conditions and enhance the resilience of renewable energy infrastructures.
The remainder of this paper is structured as follows:
Section 2 outlines the implementation of the design,
Section 3 presents the results,
Section 4 discusses and analyzes the findings, and
Section 5 concludes the study by summarizing its contributions and implications. By addressing critical gaps in parameter optimization, this research offers practical and theoretical insights that advance the state of wind farm design, ensuring that renewable energy systems can meet future challenges.
2. Methodology
A GA is an organized set of instructions designed to iteratively generate solutions from a specified starting point. Inspired by natural processes, GAs mimic biological phenomena such as crossover, mutation, and selection to identify optimal solutions. Conceptualized initially by John Holland in the 1960s and further developed by David Goldberg in the 1980s [
32], GAs evolve a population of potential solutions through genetic operations, progressively improving the quality of the solutions over successive generations [
33].
The effectiveness of GAs largely depends on carefully selecting and tailoring their parameters to suit specific problems. Well-designed parameters enable these algorithms to explore the solution space efficiently and converge toward optimal results, even for complex challenges. Additionally, GAs can be combined with other techniques to form hybrid systems, further enhancing their adaptability and robustness [
28]. In this framework, each solution is represented by a chain analogous to a biological chromosome, which undergoes evolutionary interactions with other solutions to improve its quality over time. The versatility of GAs is demonstrated by their wide range of applications, underscoring their efficiency in solving diverse optimization problems.
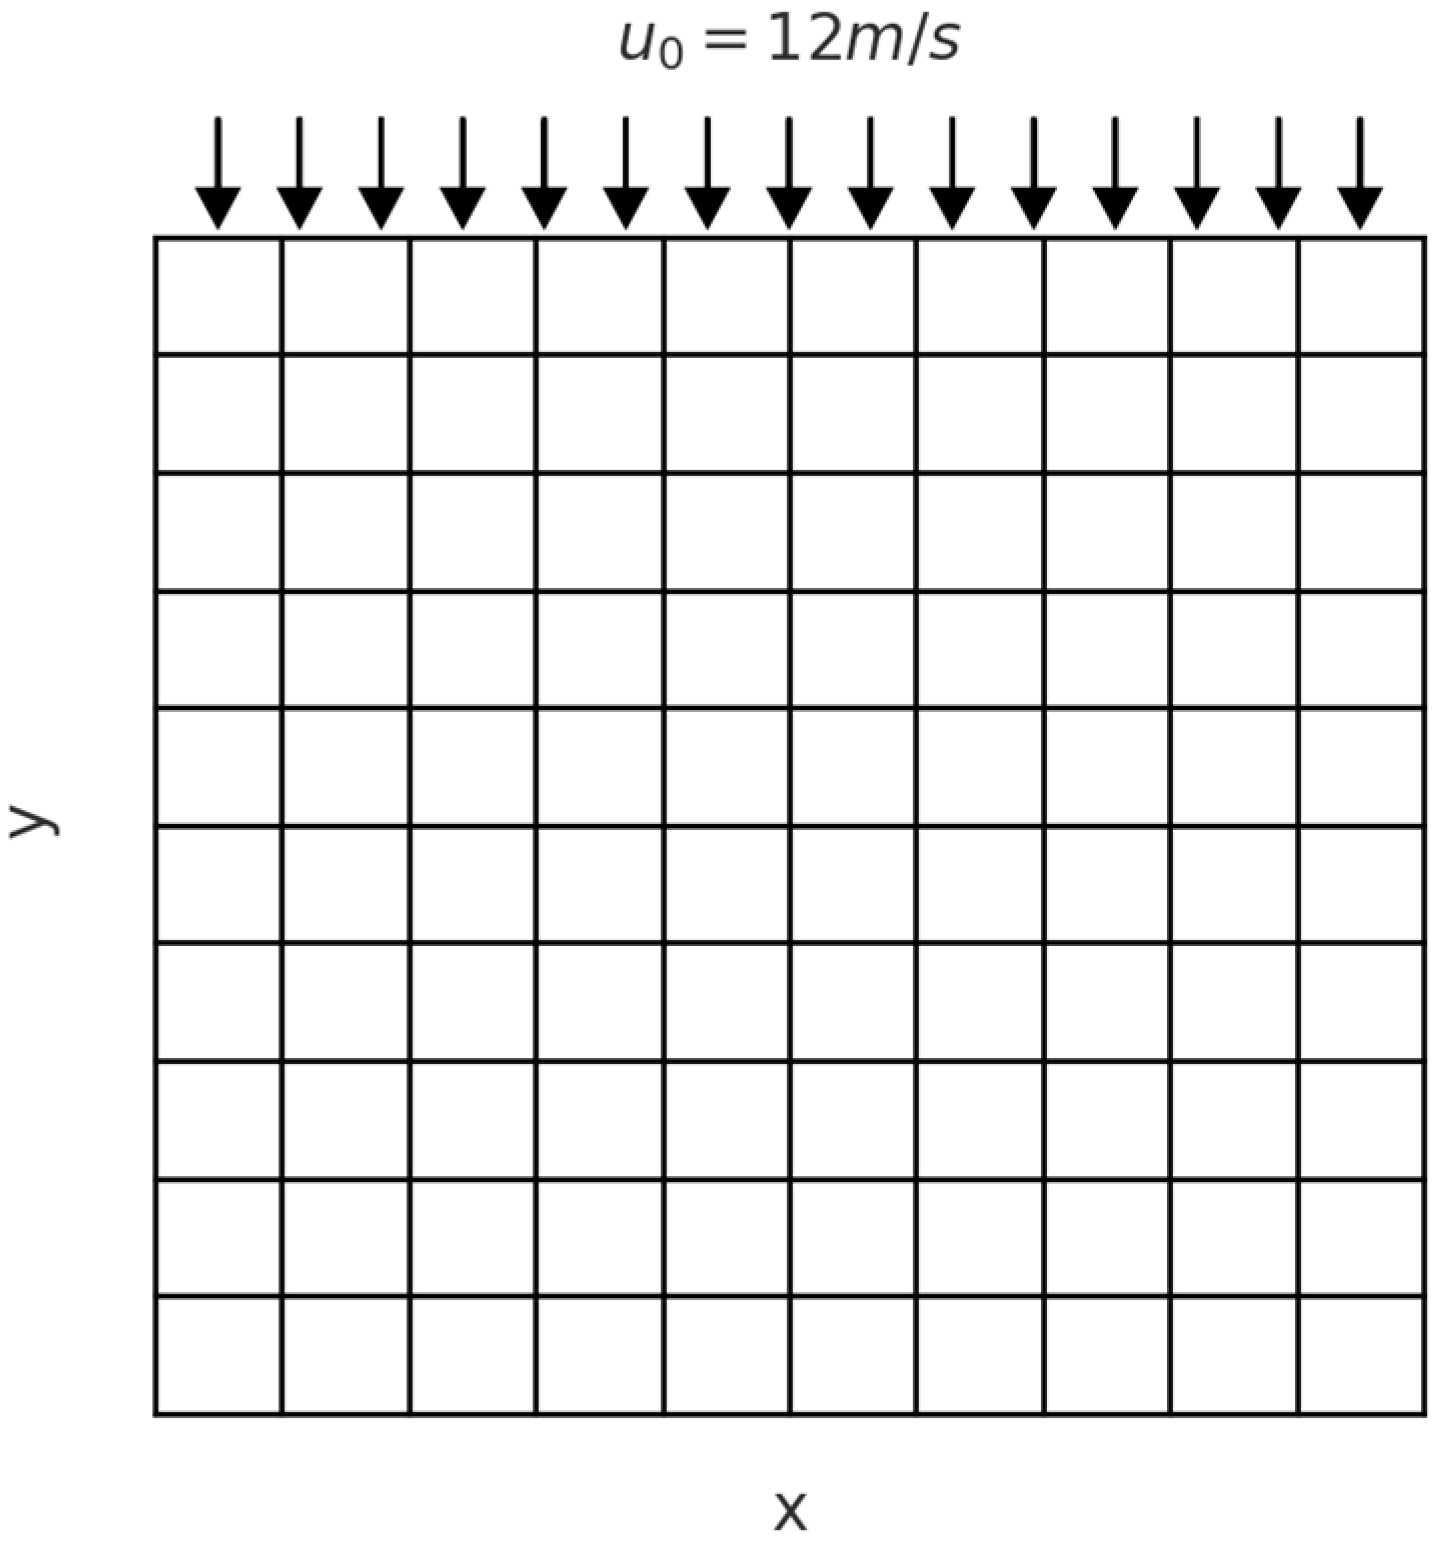
This study’s context is optimizing wind turbine placement within a wind farm. The following attributes characterize the wind farm:
A total area of 2 km2, divided into 100 cells.
Each cell has a surface area of 200 m2.
A surface roughness coefficient of 0.3.
The wind regime considered is unidirectional, consistently blowing from the north at a fixed speed of 12 m/s, as depicted in
Figure 1. These parameters were chosen to model realistic conditions and provide a robust framework for evaluating the performance of the proposed optimization methodology. However, assuming a constant and unidirectional wind is a notable simplification, as wind direction and speed vary in real-world conditions. These limitations should be considered when interpreting the results. Nevertheless, this assumption remains relevant in our case study as it allows for an adequate assessment of the proposed optimization methodology while maintaining a balance between accuracy and computational feasibility.
To execute the GA, an initial population of potential solutions, or layouts, is created. Each individual, represented as a chromosome, encodes the location of wind turbines, defining a possible wind farm configuration. The GA evaluates each layout using a fitness function designed to maximize energy production while minimizing costs. The fitness function is expressed as:
where
P represents wind power in watts (W), calculated by Equation (2):
In this equation:
A: Area swept by the turbine blades (m2).
ρ: Air density (kg/m3).
u: Wind speed (m/s).
η: Efficiency coefficient of the wind turbine, accounting for energy conversion losses.
The economic model for wind turbines assumes that the total cost is influenced solely by the number of turbines (
N) deployed in the wind farm. The annual total cost is calculated using [
34]:
The fitness function incorporates both energy production and spatial constraints, addressing the interactions between turbines caused by the wake effect [
35]. Wake effects are modeled using Jensen’s wake model [
36], which assumes a linear expansion of the wake and is expressed mathematically as:
where:
is the wind speed at distance x downstream.
is the free-stream wind speed.
is the thrust coefficient.
k is the wake decay coefficient.
D is the rotor diameter.
It significantly reduces downstream turbines’ wind speed and energy output, as depicted in
Figure 2. This ensures that the optimization process accounts for the aerodynamic interdependence between turbines.
The Jensen wake model was selected because of its widespread use in wind farm optimization studies, particularly in computationally constrained scenarios where efficiency is a priority. While more sophisticated wake models exist, the Jensen model balances accuracy and computational simplicity, enabling a clear assessment of optimization strategies without excessive processing costs. Similar simplifications have been adopted in previous studies, such as those by Grady et al. (2005) and Emami & Noghreh (2010), to facilitate optimization while capturing essential wake interactions [
19,
34].
However, it is important to acknowledge the limitations of the Jensen model. The assumption of a uniform wake expansion does not account for turbulence effects, wake asymmetry, or atmospheric stability variations, which may impact the accuracy of the results. Despite these limitations, the Jensen model remains an effective choice for this study, as it provides a practical and computationally efficient framework for wind farm layout optimization while maintaining a reasonable level of accuracy for performance evaluation.
Additional considerations are included in the fitness function to ensure realistic and practical solutions. These include:
Terrain roughness, which influences wind flow.
Environmental constraints, such as local ecological and regulatory factors.
Minimum safety distances between turbines to mitigate mechanical and operational risks.
By integrating these factors, the GA ensures that the resulting layouts are both energy-efficient and economically viable, providing a robust framework for wind farm optimization.
The wind blows at a particular speed
, until it reaches a turbine with a rotor of a specific size
. When it reaches a distance
downstream of the turbine, its speed decreases to
, and the diameter of the wake (initially equal to
) becomes:
The scalar coefficient
governs the rate of expansion of the wake as the distance increases and is defined as follows:
where:
: The height of the turbine hub generating the wake.
: Surface roughness, depending on the characteristics of the terrain.
The following equation shows the downwind wind speed derived from the Jensen wake model (4):
where
a is the axial induction factor, and it is related to the thrust coefficient
by the following equation:
The downstream radius,
, is given by:
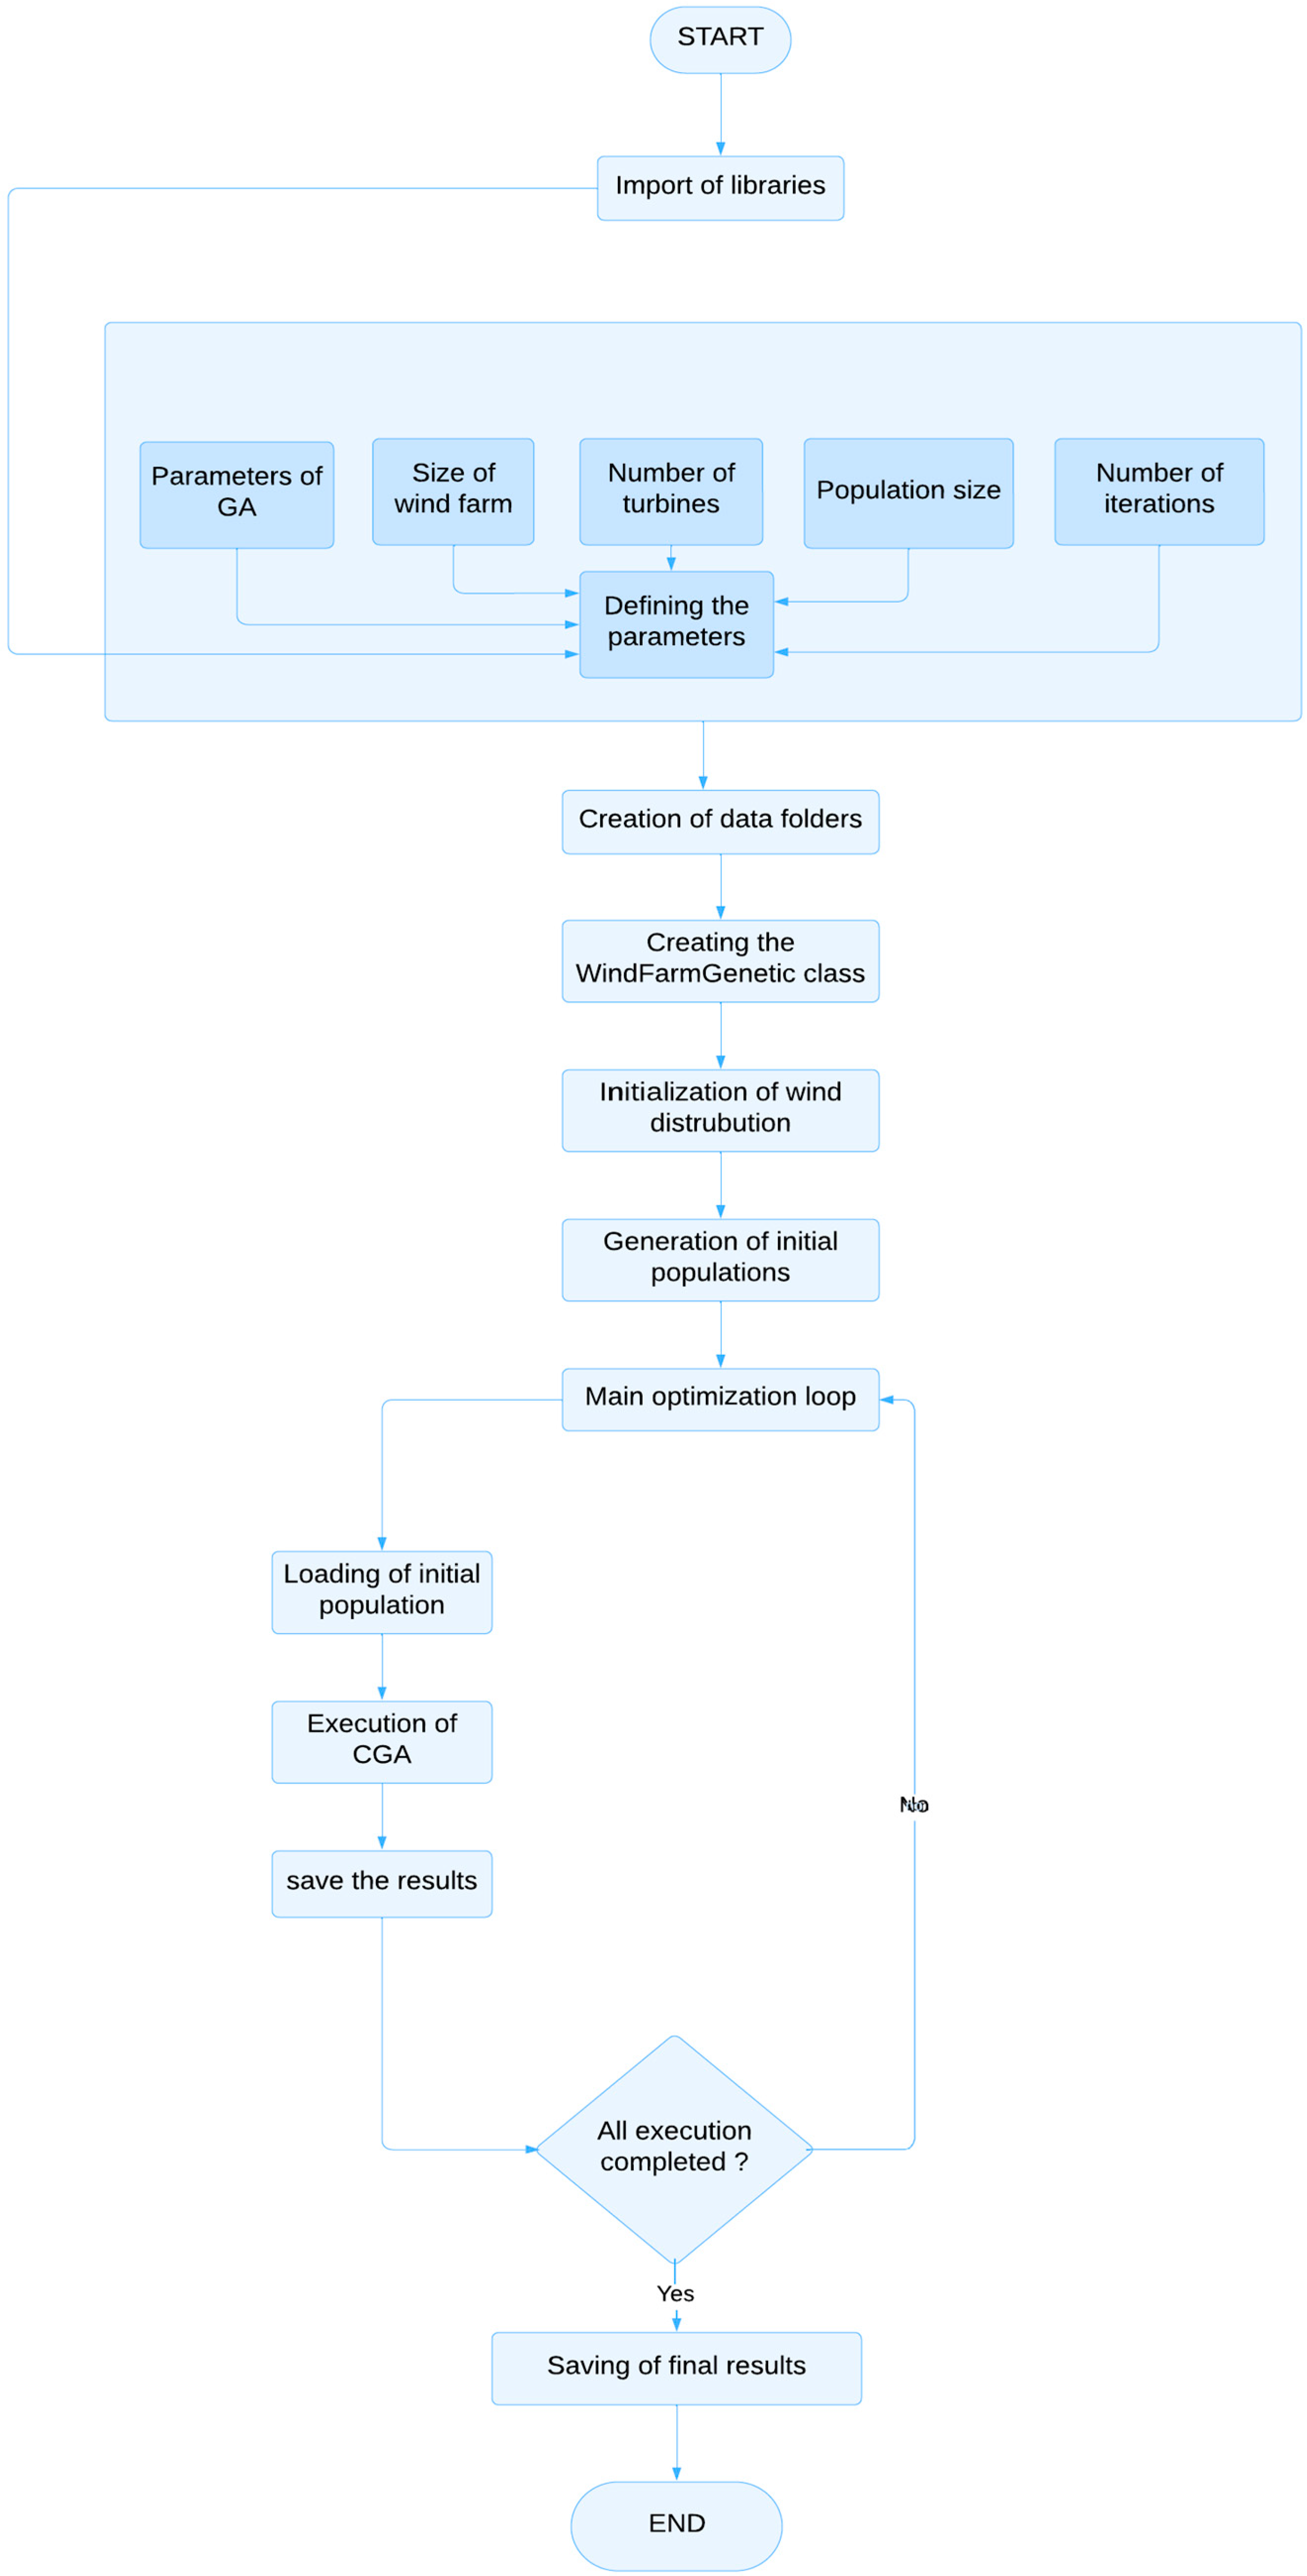
The GA begins by generating an initial population of potential wind farm layouts, where each individual represents a unique turbine configuration. The evaluation process identifies the most promising solutions, referred to as parents, which are then used to produce a new generation of solutions or children. A growth coefficient is employed to maintain genetic diversity and prevent premature convergence to local optima, and a mutation operator is selectively applied to specific individuals. This ensures that the algorithm continues exploring the solution space effectively. The detailed steps of the GA are illustrated in the flowchart in
Figure 3, which outlines its iterative process of selection, crossover, and mutation.
Figure 4 provides a broader view of the optimization process, detailing how the GA integrates various evaluation criteria to iteratively refine the wind turbine layout. This flowchart highlights the optimization process.
Traditional GA parameter tuning often relies on trial-and-error techniques, which can be both inefficient and computationally expensive. For instance, Mosetti et al. [
17] and Grady et al. [
19] employed arbitrary mutation and crossover rates in their wind farm optimization studies, leading to suboptimal convergence rates and requiring extensive fine-tuning. More recent adaptive approaches, such as those introduced by Feng Liu et al. (2017) [
37], dynamically adjust parameters based on population diversity. However, these adaptive techniques introduce additional complexity and necessitate further optimization of their hyperparameters.
Given the lack of a standardized and systematic approach for fine-tuning critical GA parameters (e.g., mutation and crossover rates), an efficient methodology that improves algorithm performance without excessive computational cost is urgently needed.
A commonly used empirical approach involves testing multiple parameter combinations to evaluate their impact on GA performance. In this study, we considered:
Mutation rate: Interval of [0.01, 0.1], step size 0.01
Crossover rate: Interval of [0.6, 0.9], step size 0.03
This resulted in 100 different parameter configurations. Each configuration was tested, and the best-performing one was selected based on fitness improvement.
Table 1 provides a sample of these results.
Although this brute-force approach helps identify adequate parameter settings, it presents several drawbacks:
A large step size may overlook optimal solutions.
A smaller step size improves precision but significantly increases the number of required tests, making optimization computationally costly.
This approach evaluates parameters independently, ignoring potential interactions between mutation and crossover rates, even though they jointly influence algorithm performance.
To overcome these limitations, this study adopts the design of experiments (DOE) methodology, which provides a systematic framework for analyzing parameter interactions and optimizing their configurations using only four well-defined parameter combinations. Unlike trial-and-error methods, DOE offers statistical insights into how mutation and crossover rates impact algorithm convergence and solution quality, ensuring a more robust and reliable tuning process [
38].
Several studies have successfully applied DOE to GA parameter tuning:
Arin et al. (2011) [
39] used DOE to optimize GA parameters for scheduling problems, demonstrating that statistically analyzing genetic operators’ main effects and interactions enhanced robustness while reducing computational time.
Mosayebi and Sodhi (2020) [
40] employed factorial designs to refine GA parameters for the Traveling Salesman Problem (TSP), leading to improved convergence and solution quality.
Building on these approaches, our study applies DOE to systematically refine GA parameters in wind farm optimization. We employ a full factorial design to ensure efficient solution space exploration while improving algorithm convergence and robustness.
A full factorial design evaluates all possible combinations of selected factor levels, making it particularly useful for examining interaction effects between parameters [
41]. Unlike fractional factorial designs, which reduce the number of experiments by analyzing only a subset of combinations, a full factorial approach ensures that no critical interaction effects are overlooked.
This is particularly important for GA optimization, where crossover and mutation rates can significantly influence algorithm performance. Certain parameter combinations may cause genetic drift, reducing diversity and increasing the risk of premature convergence. By systematically evaluating all parameter configurations, full factorial DOE enables precise optimization, leading to a more efficient and reliable wind farm layout.
While fractional factorial designs could reduce experimental costs, they risk losing information on higher-order interactions, which are often nonlinear and unpredictable in GA optimization. As highlighted by Goupy (1990) and Mosayebi & Sodhi (2020), full factorial designs provide a more reliable assessment of parameter dependencies, ensuring that the optimal configuration is identified with high confidence [
40,
42].
For this study, a 2
2 full factorial design was employed, with two GA parameters (crossover rate and mutation rate) tested at two levels, as shown in
Table 2. The parameter values were selected based on a comprehensive literature review, ensuring their practical relevance.
The DOE methodology systematically evaluated these four parameter combinations, assessing their effectiveness based on multiple performance metrics:
Algorithm convergence time
Quality of power optimization solutions
Robustness of results to initial conditions
Impact on energy efficiency and cost-effectiveness
Regarding the objective function and cost consideration, it is essential to clarify that the cost metric used in this study corresponds to the cost per unit of produced power (“cost/kWh”), which serves as the objective function for optimization. This cost is determined solely by:
The methodology ensures enhanced efficiency, improved power output, and a more cost-effective wind farm layout by refining GA parameters through DOE-driven optimization.
This systematic approach also allowed the study of potential interactions between parameters, a feature often overlooked in conventional trial-and-error methods. By evaluating the relative influence of crossover and mutation rates and their interactions on the fitness function, statistical insights were obtained using analysis of variance (ANOVA). ANOVA results statistically confirmed the findings, with the adjusted coefficient of determination (R2 = 1.0) indicating a perfect model fit. However, to avoid overfitting, the R2 value was interpreted cautiously. Residuals were rigorously analyzed for uniformity and normality, ensuring statistical validity and identifying anomalies.
To assess the relative importance of factors, standardized effect coefficients were calculated, and interaction graphs and response surfaces were generated. Pareto charts were used to prioritize the effects of parameters and their interactions. Residual analysis was conducted to validate model assumptions, identify any anomalies, and improve statistical reliability. These tools provided a comprehensive understanding of the impact of crossover and mutation rates on GA performance, ensuring the robustness and reproducibility of the findings.
By employing this systematic and statistically validated approach, the study advances the optimization of GAs for wind farm layout design, offering a replicable methodology that replaces trial-and-error with rigorous, efficient experimentation.
3. Results
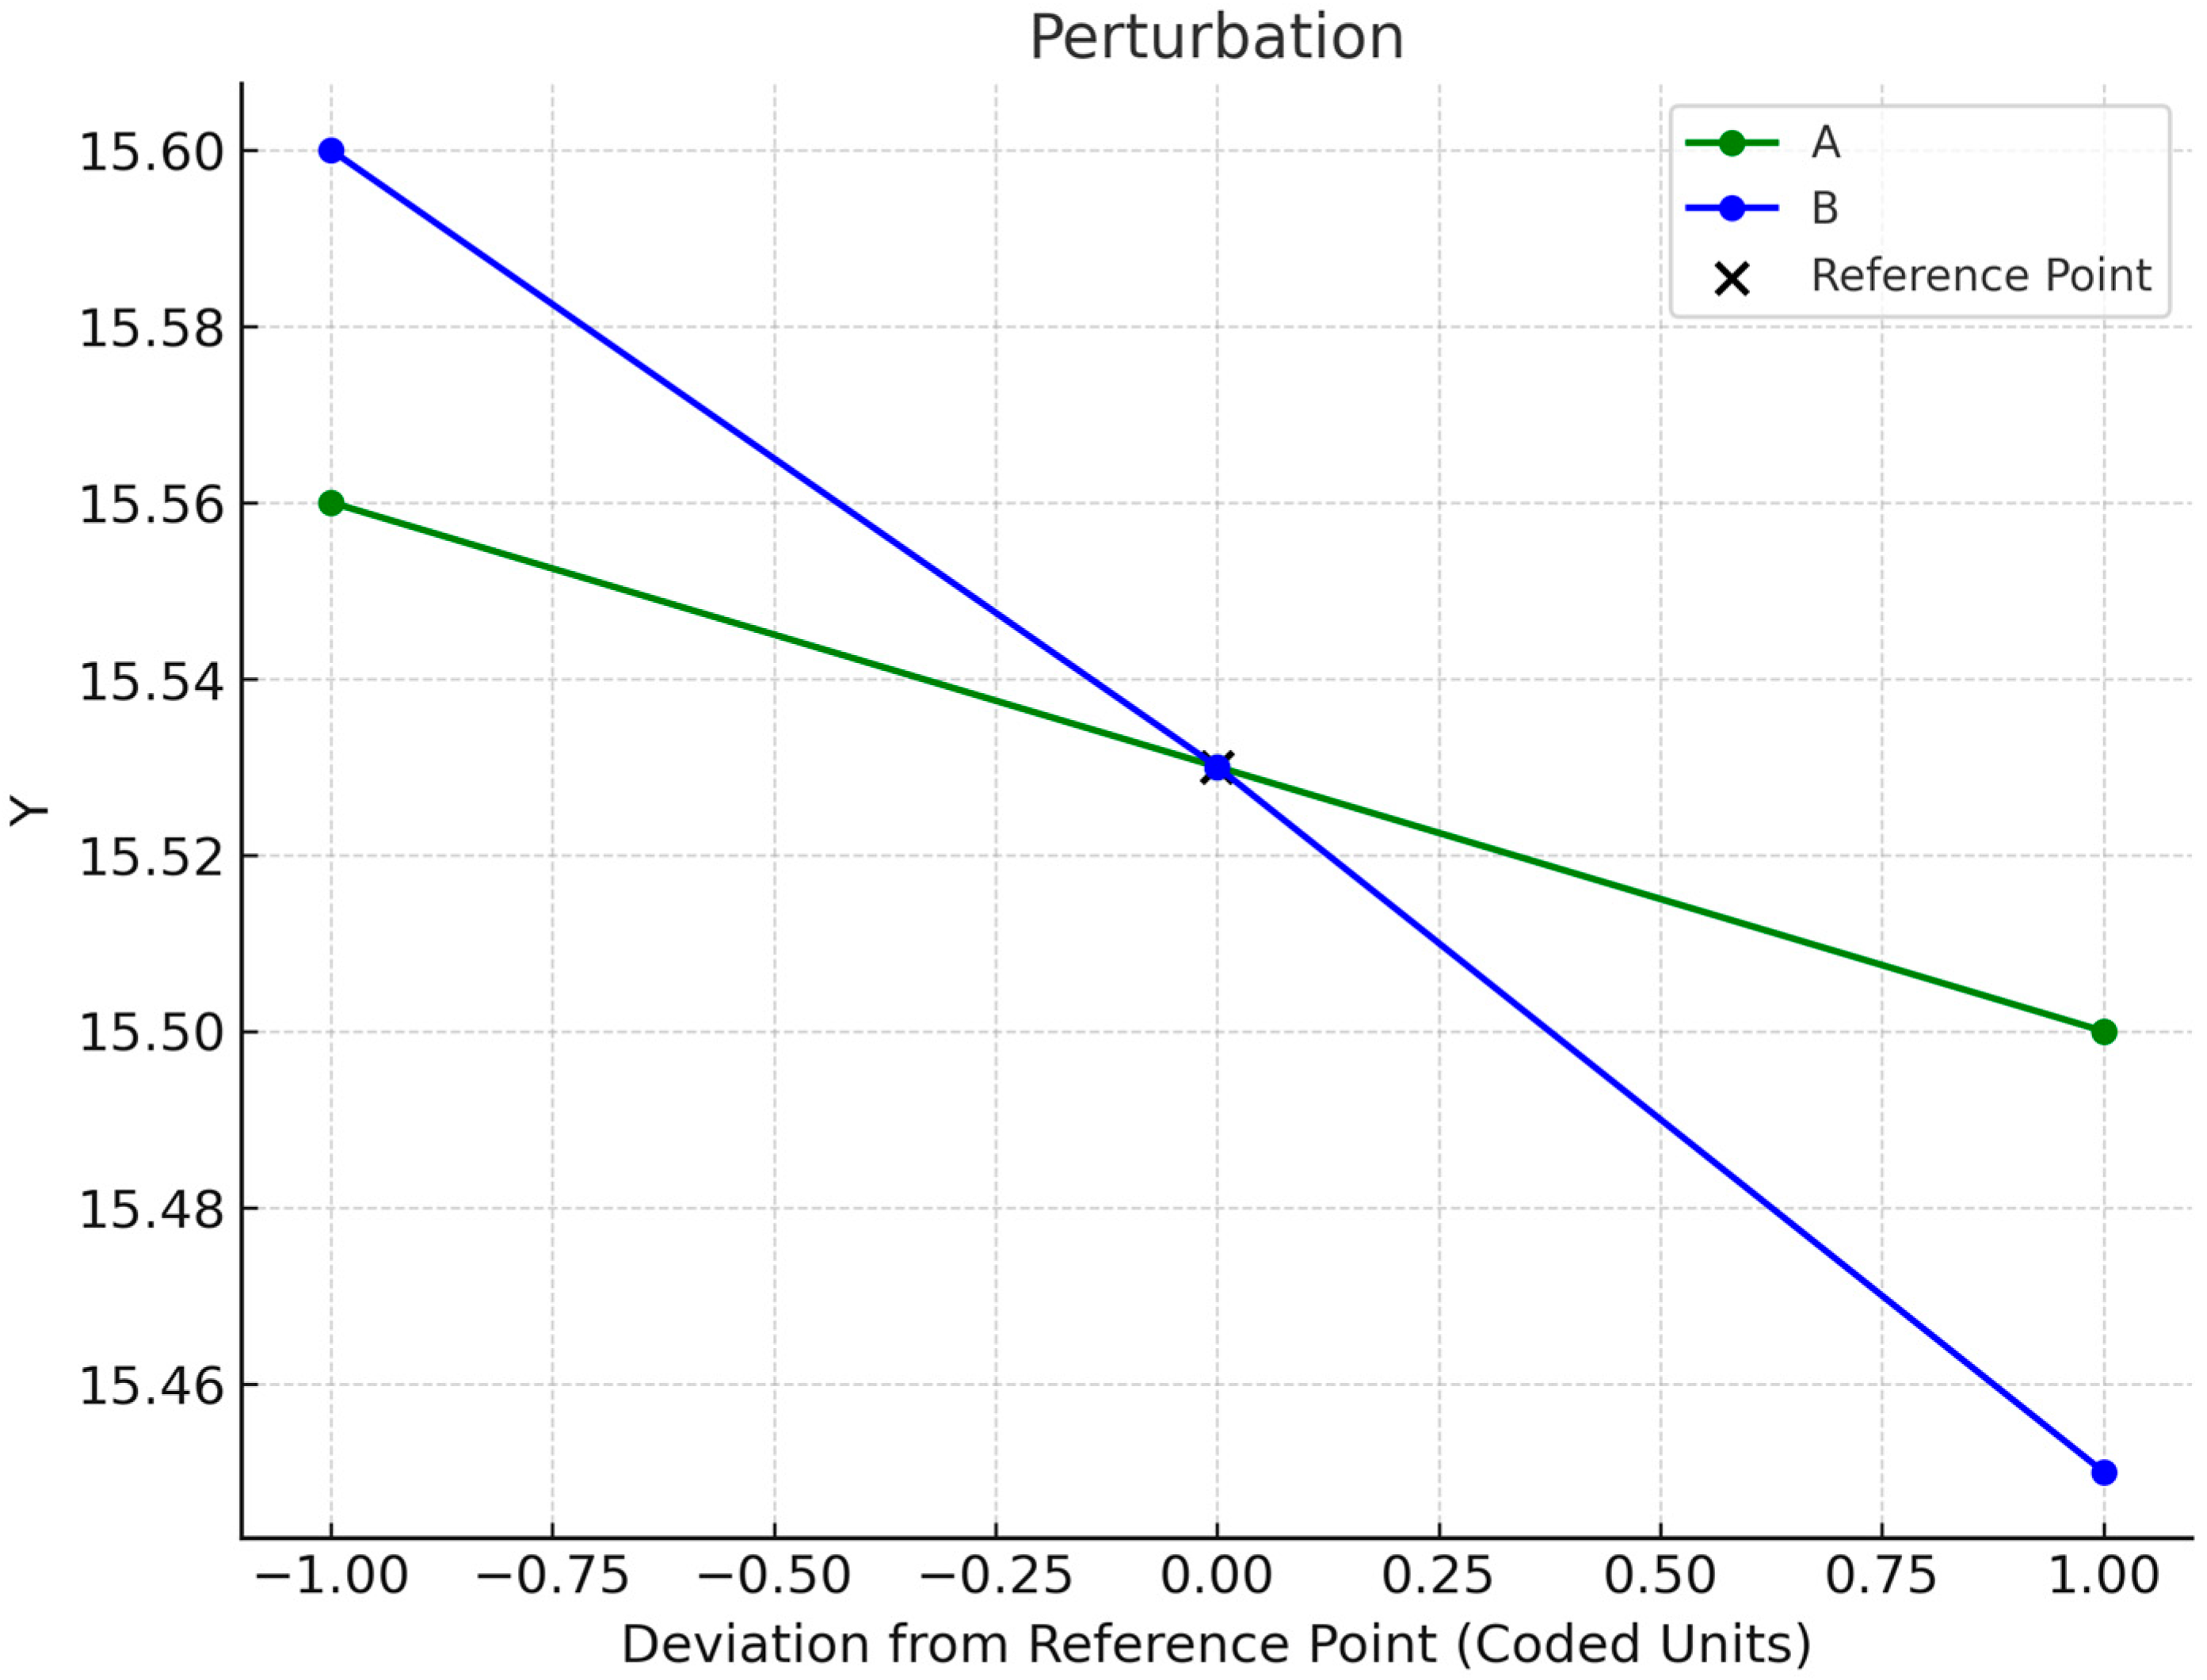
Figure 5 illustrates the main effects of mutation rate (A) and crossover rate (B) on the fitness value (Y). A steeper negative slope on line B suggests that crossover rate (B) substantially influences optimization performance more than mutation rate (A).
When the mutation rate (A) increases from its lowest to the highest value, the fitness value Y decreases moderately from 15.56 to 15.50, reflecting a small variation of 0.06.
In contrast, increasing the crossover rate (B) from its lowest to highest value results in a more significant drop in fitness value from 15.60 to 15.45, representing a larger variation of 0.15.
This indicates that the crossover rate plays a more substantial role in optimizing the solution than the mutation rate.
Notably, performance improves significantly when the crossover rate exceeds 0.75, as the fitness value drops more rapidly towards 15.45, signifying better optimization results. However, performance deteriorates when the crossover rate falls below 0.75, with the fitness value rising toward 15.60.
Furthermore, crossing the lines in
Figure 5 highlights a strong interaction effect between mutation and crossover. This suggests that the impact of mutation depends on the crossover rate, meaning that these parameters should be optimized jointly rather than independently to achieve the best results.
Figure 6 shows the interaction effect between parameters. The
x-axis shows the values of A, while B is represented by a black line at a low level (0.6) and a red line at a high level (0.9).
The variation of crossover from 0.6 to 0.9 shows its positive effect on fitness, while mutation has a less apparent average effect, which is conditioned by the crossover level, as illustrated graphically. Increasing mutation weakens performance in the case of low crossover (0.6) while increasing mutation improves performance in the case of high crossover (0.9).
The interaction is highly significant because the effect of A reverses, depending on the value of B.
The results demonstrate that the crossover rate significantly impacts the mutation rate. Raising the mutation rate when the crossover rate is low (0.6) negatively impacts performance. This is because there is still a limited diversity of solutions in this situation, and too much mutation causes noise that prevents convergence.
Conversely, the GA gains from greater diversity due to intensive crossover when the crossover rate is high (0.9). In this context, increasing the mutation rate enhances exploration without compromising convergence, which explains the observed performance improvement.
After the results were analyzed, the following mathematical model was produced:
In terms of coded factors (−1, +1), the model is expressed as follows:
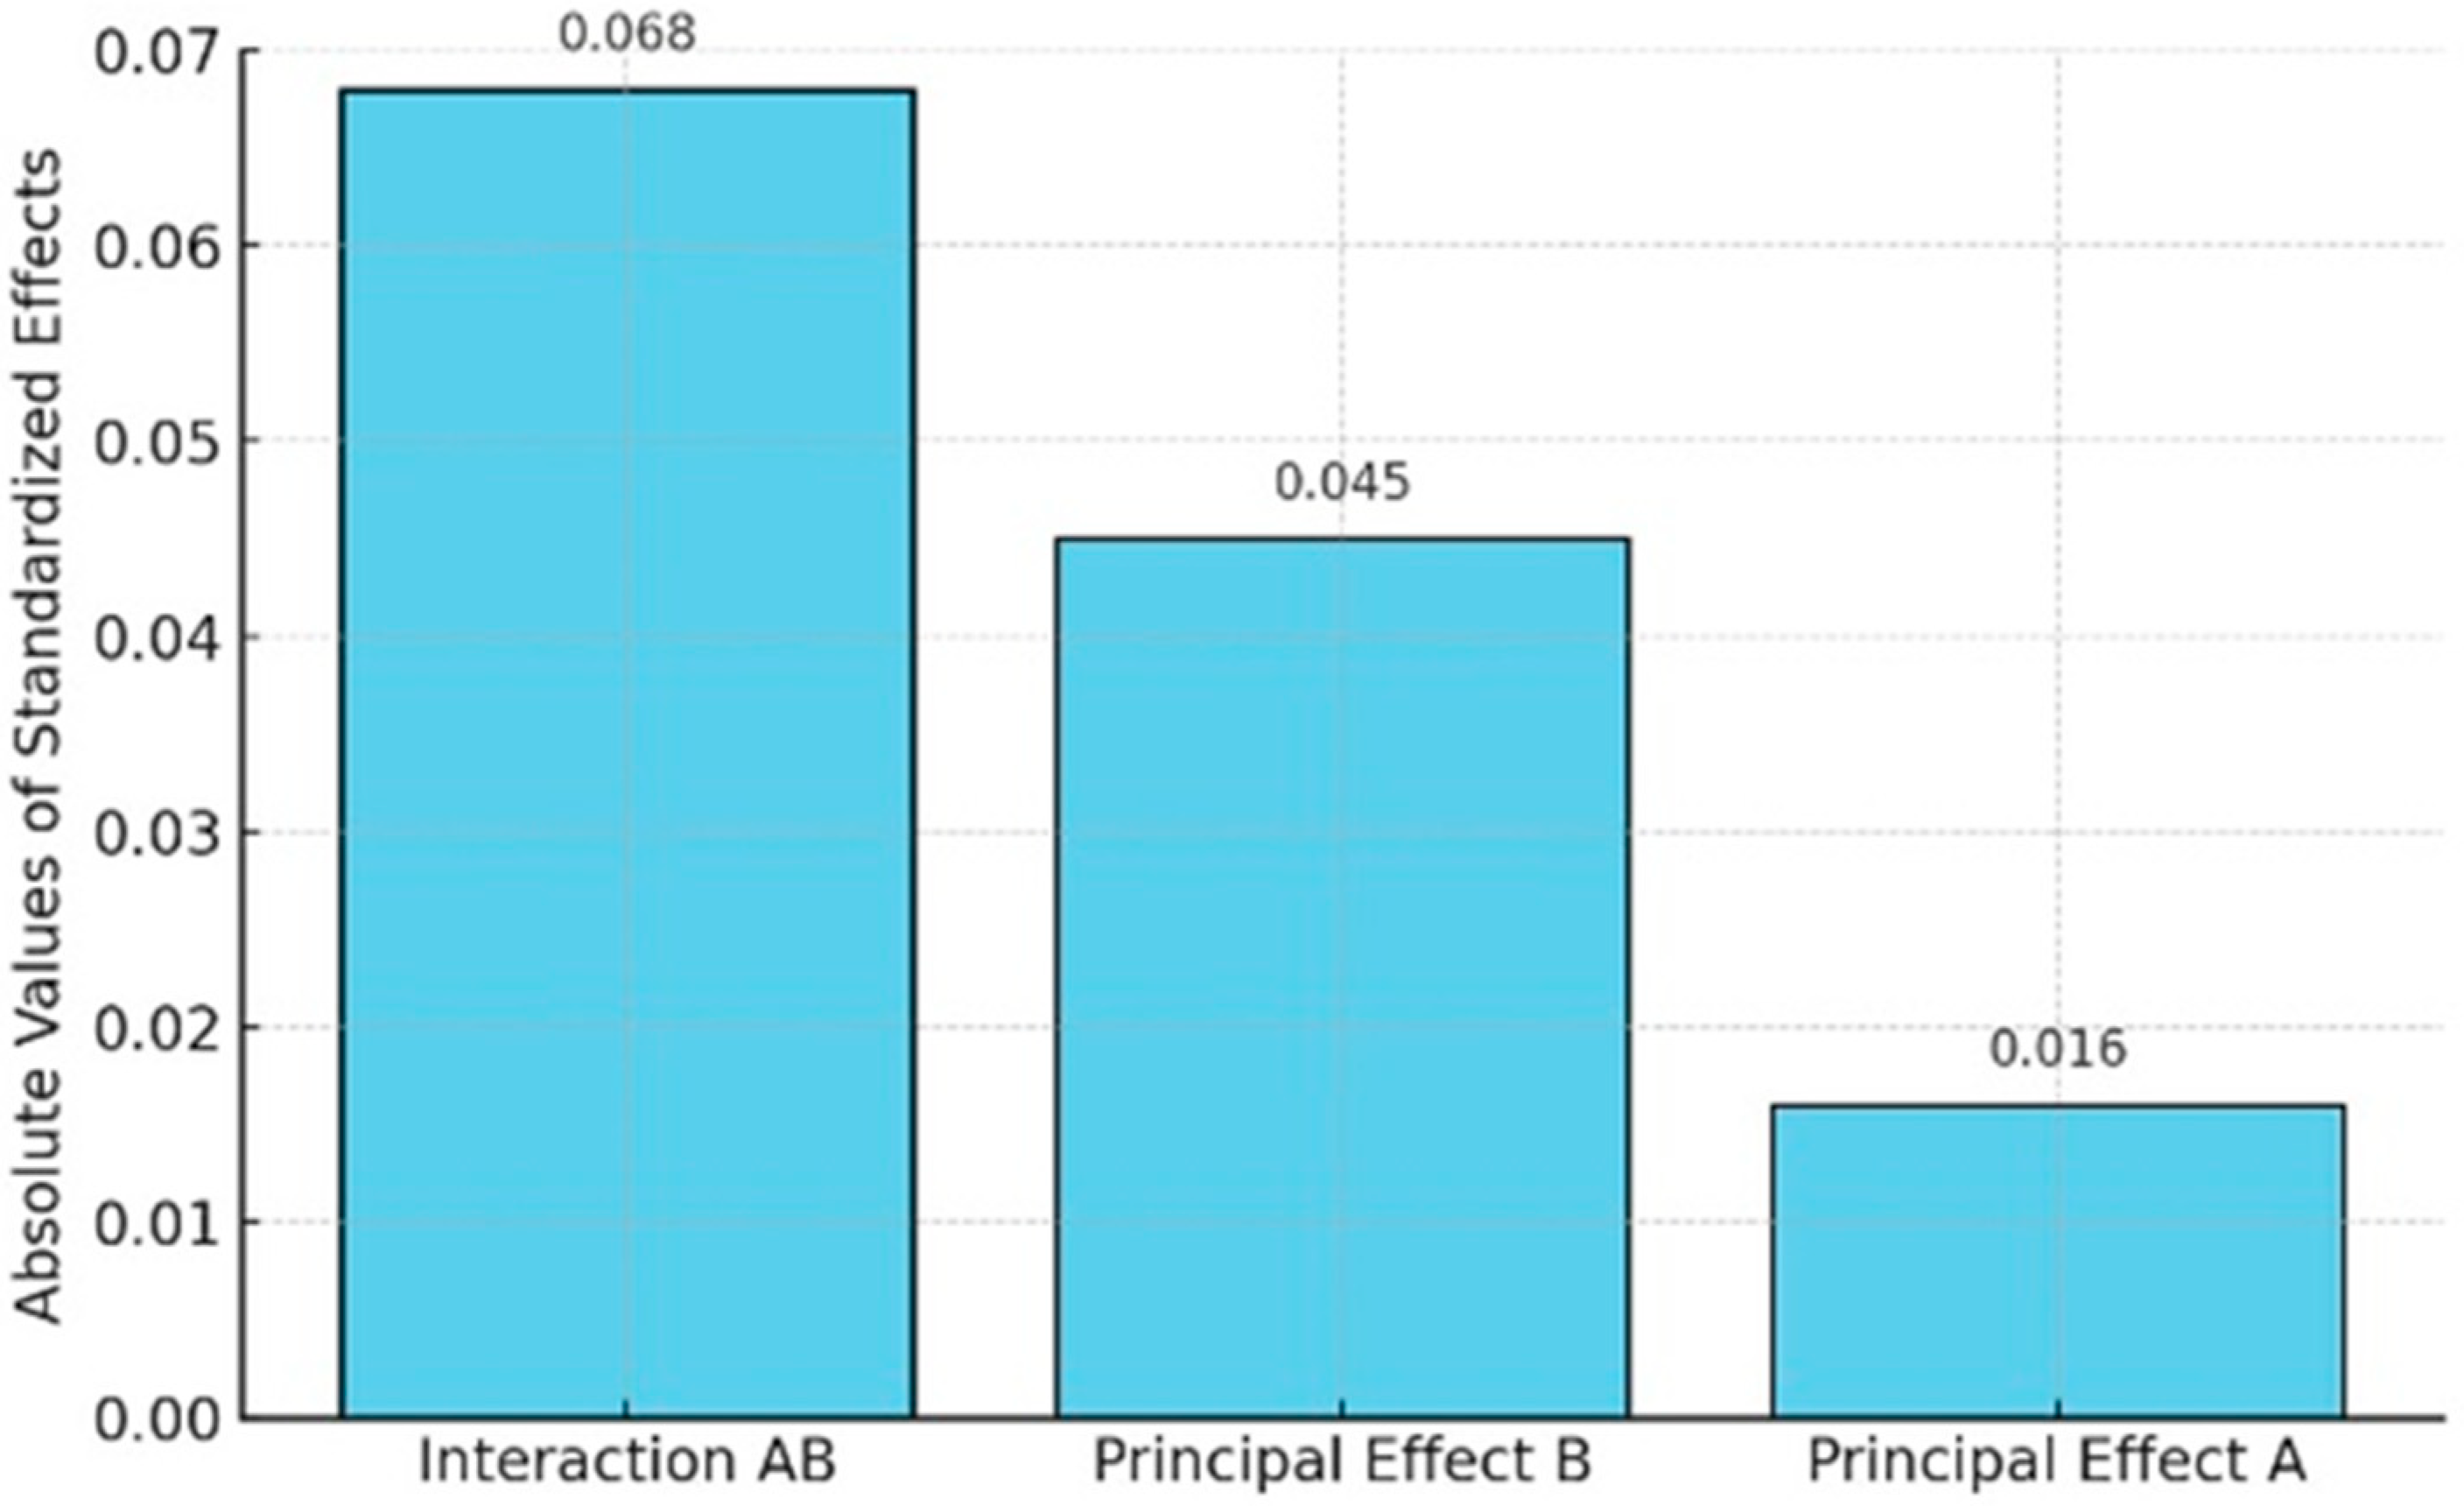
The Pareto diagram of the effects presented in
Figure 7 illustrates the relative relevance of the standardized effects arranged from greatest to least influence, as determined by the analysis.
When the two components (A and B) interact, the interaction AB displays the most significant effect, with an effect of −0.068. The response is least affected by main effect A (−0.016), but main effect B (−0.045) exhibits a considerable influence. The significance of taking into account the interaction between parameters rather than optimizing them alone is highlighted by this effect prioritization.
Joint parameter optimization improves fitness by 151.1% compared to individual optimization of B, since parameter B has a more significant influence on the response than parameter A. This analysis allows for a better quantification of the impact of the interaction. This result shows the importance of considering the interactions between parameters A and B, leading to a more optimized result.
The ANOVA analysis confirms that both crossover and mutation factors significantly impact the GA performance. Additionally, a strong interaction effect between these two parameters was identified, indicating that the efficiency of crossover is influenced by the level of mutation used. Specifically, a low mutation rate limits crossover efficiency, whereas combining a high crossover rate with an adequate mutation rate yields the best overall performance. This finding underscores the importance of systematic parameter tuning to optimize GA performance effectively.
Figure 8 presents the response surface contour map, illustrating how changes in mutation (A) and crossover (B) parameters affect the standardized fitness value (Y):
The global minimum is identified at A = 0.1 (mutation rate) and B = 0.9 (crossover rate), achieving a minimum fitness value of 15.4087.
The optimal region is concentrated in the upper-right corner of the experimental domain, indicating that higher crossover rates consistently improve performance when coupled with a moderate mutation rate.
The slight non-linearity in the surface further confirms the interaction effect (AB), reinforcing that mutation and crossover must be optimized together rather than in isolation.
Wind farm optimization studies have historically relied on empirical parameter tuning, often without systematic justification:
Mosetti et al. (1994) arbitrarily set the mutation rate to 0.1 and the crossover rate to 0.6 [
17].
Grady et al. (2005) followed a similar range without formal validation [
19].
Şişbot et al. (2010) adopted a crossover rate of 0.8 for multi-objective GA optimization [
43].
Gao et al. (2014) explored crossover rates between 0.7 and 0.9 and mutation rates from 0.001 to 0.05 for offshore wind farm optimization [
44].
Unlike previous studies that relied on trial-and-error tuning, our methodology employs a statistically rigorous DOE framework, ensuring:
Optimized parameter selection based on empirical evidence rather than arbitrary choices.
Better solution quality through systematic tuning rather than ad hoc adjustments.
Improved convergence efficiency, reducing unnecessary computational cost.
Enhanced reproducibility, making the optimization process more reliable and generalizable.
By adopting A = 0.1 and B = 0.9, our approach aligns with commonly accepted parameter ranges and outperforms traditional tuning methods by providing a data-driven, reproducible, and computationally efficient optimization strategy.
To assess the reliability of the experimental results, we estimate the 95% confidence interval (CI) for the mean response using the standard deviation and the number of observations. The confidence interval provides a range of values within which the true mean of the population is expected to lie, with a specified level of confidence (in this case, 95%).
The 95% confidence interval for the mean
is calculated using the following formula:
where:
- -
= 15.54 (mean of the responses),
- -
= 0.0959 (standard deviation of the responses),
- -
= 4 (number of observations),
- -
is the critical value from the Student’s t-distribution for = 0.025 and = n − 1 = 3 degrees of freedom. For a 95% confidence interval, ≈ 3.182.
Substituting the values into the formula:
Thus, the 95% confidence interval for the mean response
is:
The 95% confidence interval for the response is [15.39; 15.69]. This means that if the experiment were repeated multiple times under the same conditions, we would expect the true mean of the responses to fall within this interval in 95% of the cases. The narrow range of the confidence interval indicates high precision in estimating the mean response.
4. Discussion
Through experiment design, we determined the ideal set of parameters (B = 0.9, A = 0.1), which allows for more targeted search space exploration with GAs.
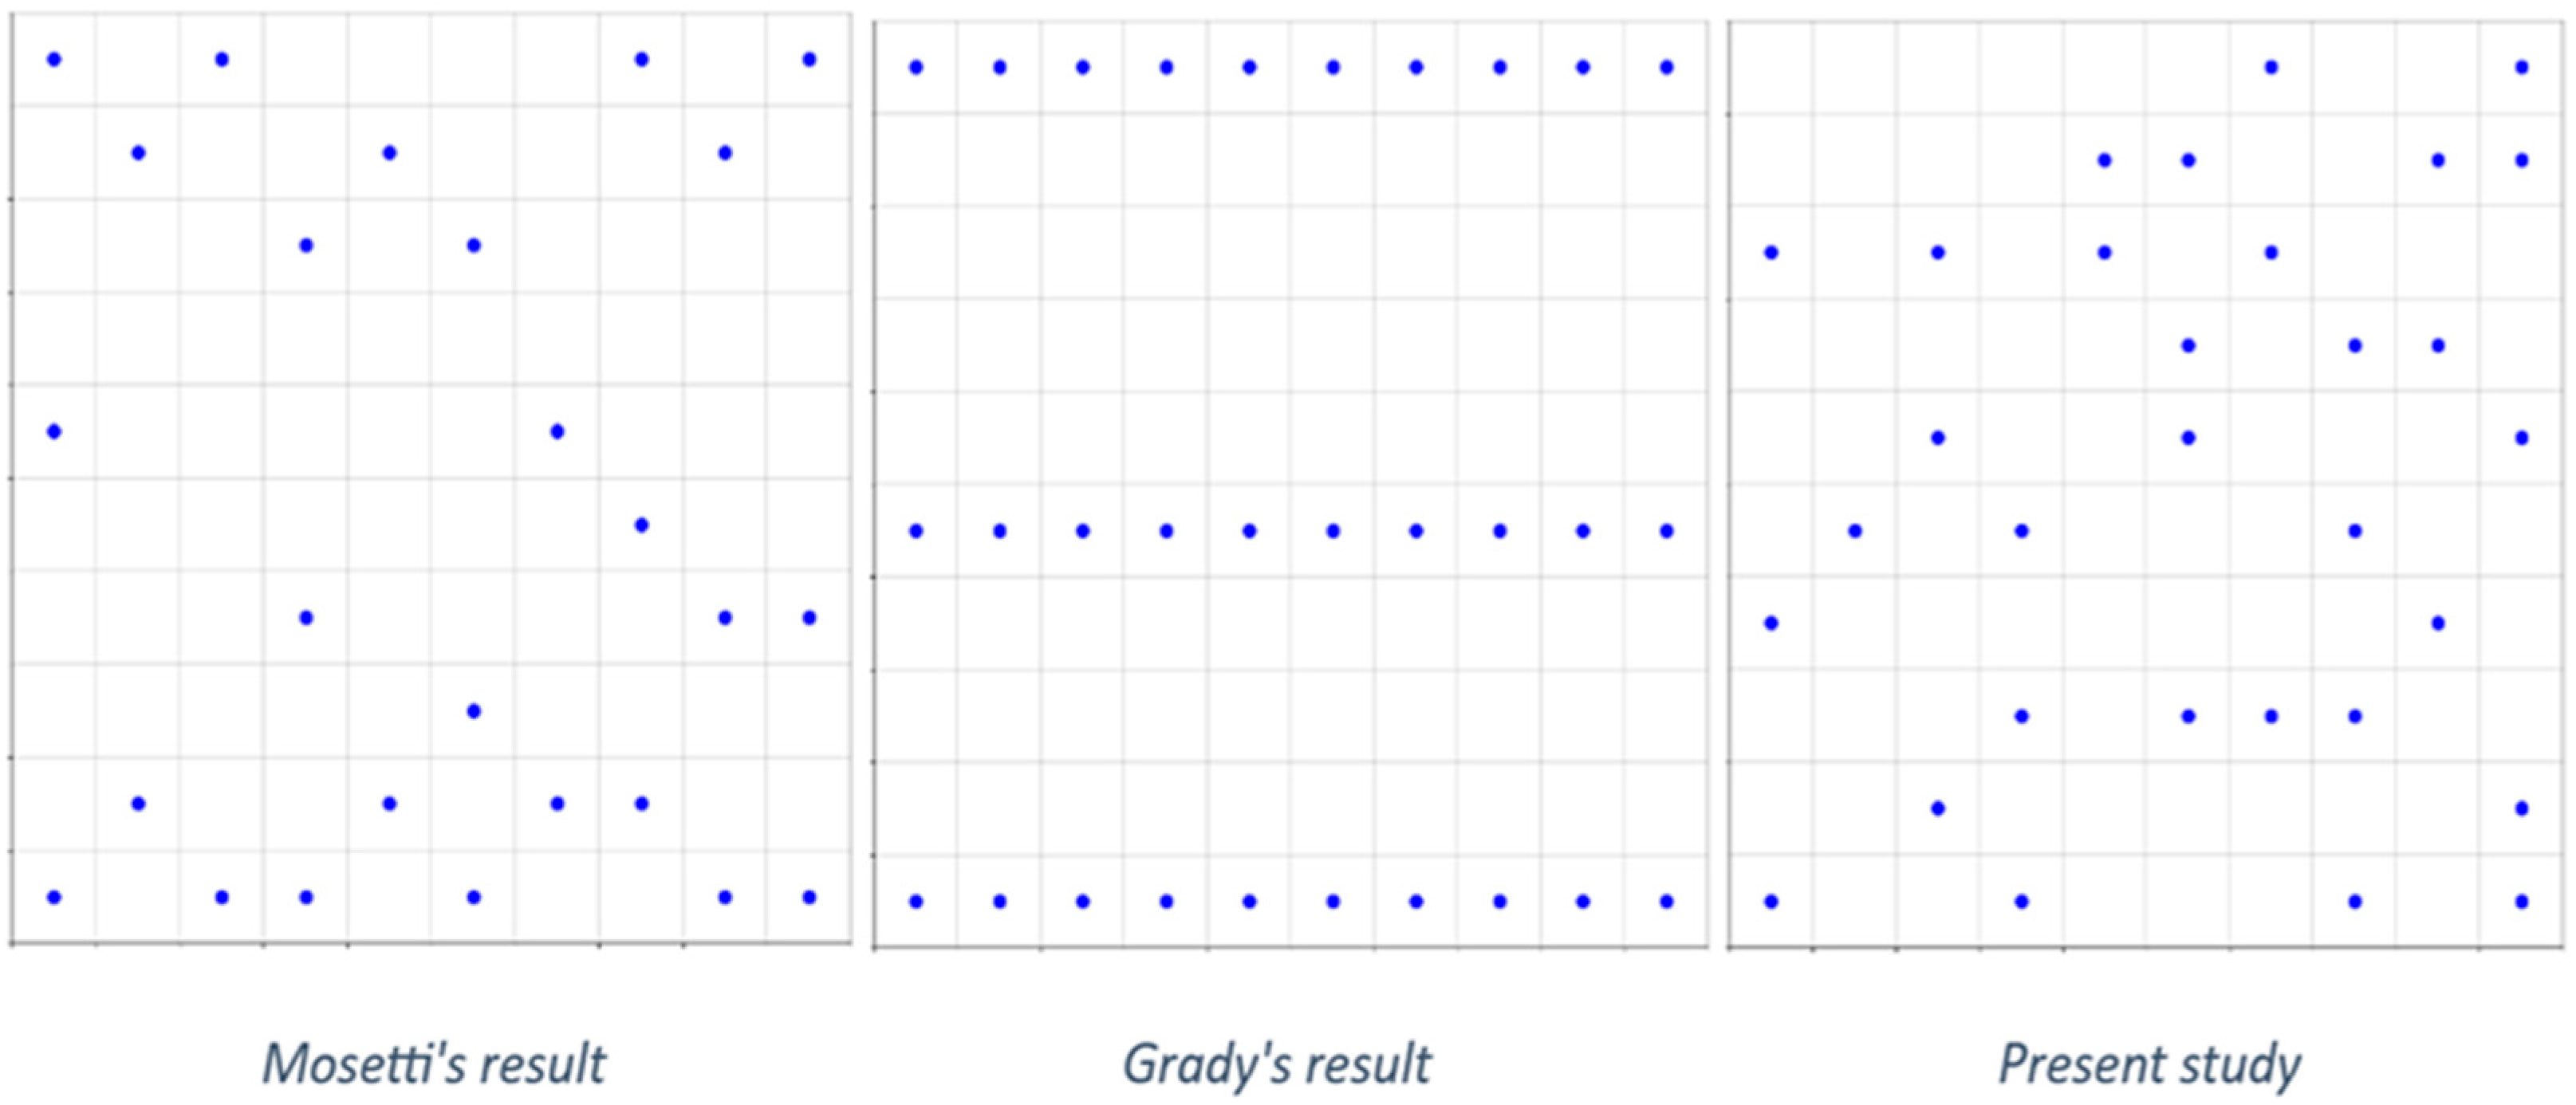
As seen in
Figure 9, this new configuration allows better use of the site area by installing additional wind turbines (31), compared to the previous studies of Mosetti (26 turbines) and Grady (who used 30 turbines), leading to increased energy production.
Table 3 summarizes the comparison of results between the present study and the previous ones [
17,
19].
The site’s energy potential has been improved, as indicated by the increase in electricity production, at 14,672 kWh. The fitness ratio (0.00154087), defined as the ratio of the cost to installed power, also improved, indicating a more cost-effective option. This fitness confirms the reliability of our approach to optimizing the turbines’ layout. Furthermore, the technique displayed faster convergence, requiring fewer computer resources for an ideal solution.
However, there was a modest decline in energy efficiency compared to previous experiments. This decline could be attributable to higher turbine density, which may have resulted in more significant interference losses. This trade-off between energy efficiency and cost minimization highlights the inherent constraints of optimizing complex systems. Nonetheless, the comparison results, as detailed in
Table 2, show that, despite the minor loss in efficiency, the significant cost reduction, increased energy production, and convergence speed demonstrate the resilience of this hybrid strategy that combines the design of experiments with GAs.
This study represents a promising advancement in wind farm techno-economic optimization, offering a systematic approach to fine-tuning GA parameters. Future research could further enhance this methodology to address broader energy efficiency concerns and adapt the optimization process to different wind conditions.
To evaluate the impact of wind speed on crossover and mutation parameters, we expanded our initial study—conducted at 12 m/s—to include two additional wind speeds: 10 m/s and 17 m/s. The optimization focuses on GA parameters rather than wind farm sizing, meaning that the number of wind turbines (31) remains constant across all scenarios.
The primary objective is determining how optimal GA parameters (crossover and mutation rates) change with varying wind conditions and whether the identified trends remain consistent or require adjustments. The optimal crossover and mutation combinations were identified for each wind speed scenario, demonstrating consistent trends across varying conditions. The resulting fitness values and annual energy production were analyzed, and the results are presented in
Table 4:
The analysis reveals that higher wind speeds increase energy production, with annual output rising from 8831 kWh/year at 10 m/s to 19,607 kWh/year at 17 m/s. This trend underscores the direct relationship between wind availability and power generation efficiency. Additionally, the optimal crossover rate (Pc) remains consistently high, at 0.9, across all wind speeds, suggesting that a more substantial genetic diversity enhances convergence and improves solution quality. However, the mutation rate (Pm) varies based on wind conditions, with lower values (0.01) being more effective at lower wind speeds (10 m/s), to minimize unnecessary randomness. In comparison, higher values (0.1) are preferable at 12–17 m/s to help the GA escape local optima in more dynamic wind environments. Furthermore, fitness values decrease as wind speed increases, dropping from 0.00255993 at 10 m/s to 0.00115303 at 17 m/s, indicating improved optimization efficiency at higher wind speeds. This trend suggests that greater wind availability contributes to more stable convergence and better overall GA performance.
To evaluate the effectiveness of our GA-DOE optimization approach, we compared it against binary particle swarm optimization (BPSO) using key performance metrics. The resulting wind farm configuration is presented in
Figure 10, and the results are summarized in
Table 5 [
45]. This comparison provides valuable insights into energy production, fitness value, efficiency, and overall optimization robustness, highlighting the advantages and limitations of each method.
A comparison between BPSO and GA-DOE reveals key differences in efficiency, energy output, fitness value, and adaptability. While BPSO achieves a slightly higher efficiency of 92.01% compared to 91.29% for GA-DOE, this is primarily due to its use of fewer wind turbines (30 vs. 31). However, GA-DOE produces higher total energy, generating 14,672 kWh/year compared to 14,310 kWh/year with BPSO, representing a +2.5% increase in energy output. This demonstrates that GA-DOE optimizes spatial utilization more effectively, ensuring more significant energy production.
The GA-DOE approach also achieves a better fitness value (0.00154087 vs. 0.001544 for BPSO). A lower fitness value indicates a more efficient cost-to-power ratio, meaning that GA-DOE optimally allocates resources, while maintaining a high-performance level. This suggests that the DOE-based tuning process enhances the overall effectiveness of the GA optimization method.
One of the key advantages of GA-DOE over BPSO lies in its systematic parameter-tuning methodology. Unlike BPSO, where parameters remain fixed throughout the optimization process, GA-DOE employs a structured DOE framework to dynamically fine-tune crossover and mutation rates. This leads to:
More reliable convergence towards optimal solutions.
Greater adaptability for different wind conditions and configurations.
Enhanced robustness in the optimization process, making it more applicable to diverse scenarios.
Despite these advantages, computational cost remains a consideration for GA-DOE, particularly for large-scale applications. While the DOE-based tuning improves convergence speed and accuracy, its computational demands could limit scalability. To address this, future research should explore adaptive heuristics to reduce the number of GA iterations while maintaining optimization efficiency. This would enable GA-DOE to be more scalable, making it a viable solution for larger wind farm projects.


