2. Literature Review
The transition to renewable energy in Eastern Europe has been shaped by a complex mix of economic structures, institutional frameworks, and geopolitical constraints. While the Environmental Kuznets Curve (EKC) provides a broad framework for understanding the relationship between economic growth and emissions, its applicability in post-socialist economies remains debated due to industrial legacies and policy heterogeneity. Institutional Theory helps explain why some countries successfully implement EU climate policies, whereas others struggle with regulatory inefficiencies and transition gaps. Resource Dependence Theory highlights the role of domestic fossil fuel reserves and energy security concerns in shaping policy decisions.
Additionally, recent research emphasizes the importance of spatial spillovers, as energy trade, cross-border investments, and policy diffusion influence emission reduction efforts across the region. This section reviews key contributions from the literature by integrating these theoretical perspectives to contextualize Eastern Europe’s energy transition and its policy implications.
Our main analysis is particularly relevant for Eastern Europe, where the legacy of Soviet-era industrial policies, continued reliance on fossil fuels, and varied national responses to EU regulations have created fragmented energy-transition pathways. During the Soviet era, centralized economic planning prioritized heavy industry and energy security, leading to strong dependence on coal, oil, and natural gas. Countries such as Poland, Czechia, Bulgaria, and Romania have built energy-intensive economies, with fossil fuels serving as the backbone of manufacturing, metallurgy, and chemical industries. This historical dependence continues to shape national energy strategies, complicating efforts to meet the EU’s climate-neutrality goals under the Green Deal.
Despite a common regulatory framework at the EU level, the implementation of renewable energy policies, carbon pricing mechanisms, and transition incentives varies significantly across Central and Eastern European (CEE) states. Differences in economic structures, institutional frameworks, and energy security concerns lead to policy heterogeneity and transition gaps, with some countries accelerating their transition while others remain tied to fossil fuels.
Poland continues to rely on coal for nearly 80% of its electricity generation, justified by large domestic reserves and political pressure from the coal sector [
1]. Although Poland has introduced renewable energy auctions and is investing in offshore wind and nuclear power, its transition remains gradual due to the economic and social costs of reducing coal dependency. Romania, in contrast, has rapidly expanded its wind energy sector, with an installed capacity of over 3000 MW, making it one of the region’s renewable energy leaders [
2]. This acceleration has been facilitated by foreign direct investment (FDI), the green certificate system, and the strategic use of EU funding. Czechia has adopted a more balanced approach, implementing carbon pricing mechanisms and industrial energy efficiency subsidies, aligning its policies more closely with Western European standards [
3]. However, grid modernization and reliance on nuclear energy remain key challenges. Bulgaria faces transition difficulties due to its aging infrastructure, reliance on coal and nuclear power, and slower adoption of renewable technologies. Its energy transition is hindered by regulatory uncertainty and its dependence on Russian gas imports [
4]. Hungary is making progress in solar energy expansion, with government subsidies and corporate investments driving significant capacity growth [
5]. However, grid stability issues and slow decarbonization of the transport sector present ongoing challenges. Baltic states (Estonia, Latvia, and Lithuania) have successfully integrated renewables into their energy mix, leveraging interconnectivity with Nordic energy markets to reduce reliance on Russian fossil fuels [
6]. Estonia, in particular, has transitioned away from oil shale, a highly polluting fuel source, and now relies heavily on wind and biomass energy [
7].
These varying energy transition pathways underscore the critical role of institutional frameworks, economic incentives, and geopolitical factors in shaping national energy policy. Institutional Theory provides insights into why some Eastern European countries have effectively incorporated EU climate policies, whereas others face challenges in policy implementation and regulatory enforcement [
8]. Resource Dependence Theory highlights the extent to which domestic fossil fuel reserves, energy import dependencies, and trade relationships dictate the pace and direction of energy transition [
9]. Additionally, spatial spillover models suggest that cross-border energy trade, infrastructure connectivity, and foreign direct investment (FDI) play a pivotal role in regional emission reduction efforts, reinforcing the need for coordinated energy strategies. The relationship between economic growth and environmental degradation remains a central topic in sustainability research, with the Environmental Kuznets Curve (EKC) serving as a key theoretical framework. The EKC hypothesis posits that as economies develop, environmental degradation initially increases but then declines after reaching a certain income threshold, as technological advancements and regulatory frameworks improve sustainability [
8]. However, empirical research on the EKC presents mixed findings, with regional variations and pollutant-specific differences influencing the strength and validity of the observed relationship. While some studies confirm the EKC pattern in certain economies, others suggest that economic structure, energy dependency, and policy interventions play more decisive roles in shaping emission trajectories.
In the MENA region, the EKC was confirmed for SO
2 and CO
2 emissions in certain countries, but not in the entire region. Studies have predicted China’s CO
2 emissions will increase until approximately 2078, indicating a delayed EKC effect [
9]. East Africa showed a bell-shaped relationship between per capita income and CO
2 emissions [
10]. Among the 44 countries, only the EU, OECD, and G7 have displayed EKC patterns [
11]. Greenland exhibits a U-shaped EKC, suggesting an initial decoupling followed by an emission resurgence [
12]. OECD countries show varied EKC patterns, including U-shaped and N-shaped relationships [
13].
These findings suggest that the EKC hypothesis is not universally applicable and depends on factors such as industrialization, policy frameworks, and energy transitions.
Classical EKC studies confirm this hypothesis for various pollutants, but contradictions persist. The EKC holds for sulfur oxides, non-methane volatile organic compounds, greenhouse gases, and ammonia in the EU-28 countries [
14]. Brazilian CO
2 and nitrous oxide emissions followed the EKC pattern across states [
15]. However, Turkish provinces showed a U-shaped relationship between economic development and SO
2 levels [
16].
The validity of the EKC depends on pollutant type, economic structure, and timeframe. A high elasticity of substitution between fossil fuels and renewable energy may be necessary for EKC confirmation [
17]. The EKC may not exist for both developed and developing nations, reflecting the nonlinearity in economic-environmental interactions [
18].
Recent studies provide a nuanced perspective on the EKC in Eastern Europe. Using industrial share as a proxy for economic structure, the EKC has not yet been confirmed in European countries. Instead, a U-shaped relationship was observed [
19]. In OECD countries, the relationship between economic growth and emissions depends on the emission levels:
These findings suggest that the EKC is not universally applicable in Eastern Europe, and depends on sectoral dynamics, energy efficiency, and policy interventions.
Although the EKC has been widely studied, numerous studies contradict its predictions. In OECD countries, panel quantile regression revealed U-shaped and N-shaped patterns [
13]. A study across 44 nations found EKC patterns in only three major economic communities, with only 9 out of 44 countries following the expected trajectory [
11]. A broader analysis of 62 countries showed that the economic growth-environmental degradation relationship followed an N-pattern rather than an inverted U-shape [
20].
These contradictions highlight that the economic structure, energy sources, and policy measures play a critical role in determining emission trajectories. The EKC hypothesis should be considered within a region-specific and pollutant-specific framework, rather than as a universal model.
Industrialization significantly affects carbon emissions, especially in emerging and heavy manufacturing economies. Case studies illustrate the complex relationship between industrial development and emissions trends. In emerging economies, CO
2 emissions have risen due to urbanization and industrialization, partly offset by improved energy efficiency and mix [
21]. China’s carbon emissions trading rights policy for six heavy-pollution industries has reduced manufacturing sector emissions [
22]. In Latin America and the Caribbean, industrial restructuring has slowed emissions growth [
21]. India’s industrialization has a long-term positive impact on CO
2 emissions, highlighting the need for cleaner production and expansion of the non-polluting sector [
23]. In Gulf Cooperation Council countries, accelerated industrialization has increased emissions, despite efforts to transition to green economies [
24].
These findings suggest that industrialization-driven emissions can be mitigated through targeted policies including energy efficiency improvements, regulatory interventions, and industrial structure shifts.
The relationship between industrialization and energy substitution varies across regions. In Pakistan, industrialization has enabled a significant substitution between energy and non-energy factors [
25]. Malaysia has strong substitution potential between hydropower and fossil fuels for electricity generation [
26]. In Latin America, renewable energy consumption supports economic growth, with a 1% increase corresponding to 1% economic growth, thus supporting a renewable-based industrialization model [
27]. These findings indicate that industrialization can coexist with the renewable energy transition, although substitution depends on local resources, policies, and technological advancements.
The impact of renewable energy consumption on CO
2 emissions varies between the long and short run. In the long term, renewable energy significantly reduces emissions. In the United States, renewable energy consumption is associated with an emission decline [
28]. Argentina shows a similar trend, with renewables contributing to long-term environmental quality improvement [
29]. In China, the short-run impact of renewable energy on emissions appears to be weak, indicating that the transition effect takes time [
30].
While renewable energy adoption is beneficial, the long-term and short-term effects may be negligible. However, an analysis of COVID-19-related emission reductions suggests that temporary reductions in fossil fuel consumption do not significantly affect global climate trends [
31].
These findings emphasize that renewable energy investments require time to yield significant emission reductions, highlighting the importance of long-term policy commitments [
32].
Empirical evidence confirms that renewable energy investments take time to measurably affect emissions. In China, both green energy investments and renewable energy consumption reduce emissions, with renewables having a higher marginal contribution owing to investment lag effects [
33]. Studies show that off-grid renewable energy investments initially increase CO
2 emissions but lead to reductions after a one-year lag [
34]. Further studies reinforce that long-term investments in renewables have positive effects on environmental quality [
32,
35]. These findings support the fact that renewable investments require time to take effect, stressing the need for consistent policy measures [
36].
Despite substantial investments in renewables, some studies have indicated no immediate decline in emissions. In France, Spain, and Sweden, CO
2 emissions have not substantially decreased despite high renewable energy penetration and active climate policies [
37]. Some findings suggest that renewable energy can directly contribute to increased CO
2 emissions in certain contexts [
38]. The effectiveness of renewables on emissions may also depend on the ecological footprint quantiles, with diminishing effects in higher-emission economies [
39].
These contradictions suggest that while renewable energy is crucial for emissions reduction, its impact is gradual and depends on economic growth patterns, energy mixes, and technological advancements [
37]. To effectively transition to low-carbon economies, coordinated policy actions and technological innovations are required [
40].
The transition to renewable energy, which reduces CO2 emissions, has been gradual. Long-term studies have confirmed its effectiveness, while short-term contradictions have highlighted challenges. These findings emphasize the importance of sustained investments, policy stability, and technological development for the successful adoption of renewables in decarbonization.
The renewable energy transition in Eastern Europe has been shaped by market- and regulatory-based approaches. The region’s status as “dependent market economies” (DMEs) has influenced its policy frameworks [
41]. Initially, Eastern European countries adopted coordinated market economy (CME) style policies. Recently, there has been a shift towards centralization and market-based governance at the national and EU levels [
41].
Recent studies have highlighted the evolving impact of the EU Green Deal on renewable energy policy. The European Green Deal (EGD) has significantly influenced renewable energy policy in the EU, aiming to achieve climate neutrality by 2050 [
42]. EGD has led to a comprehensive review of energy and climate policies, focusing on scaling up greenhouse gas emission reductions, boosting renewable energy deployment, and improving energy efficiency [
42]. The Fit-for-55 package, introduced in 2021, has further strengthened the EU’s commitment to a clean energy transition. This package includes stricter carbon pricing mechanisms and investment incentives for clean energy projects, which are expected to drive regional policies [
43]. The implementation of high carbon pricing has shown limited negative impacts on EU GDP and consumption, while triggering an economic transformation towards a capital-intensive structure through increased investment in low-carbon technologies and energy-efficient equipment [
43]. In conclusion, the EU Green Deal and subsequent policies have created a significant shift in the EU’s approach to renewable energy and climate change. The combination of regulatory and market-based policies, particularly carbon pricing, drives the large-scale transformation of EU energy and economic systems [
43]. However, while supply-side policies have shown positive impacts on reducing greenhouse gas emissions, more aggressive efforts are needed on the demand side to achieve the ambitious climate goals set by the EU [
44].
Market-based mechanisms have shown some success; however, their effectiveness has been limited by the institutional and structural constraints of DMEs.
Market-driven policies have increased investment incentives but often face regulatory instability;
Regulatory interventions have expanded renewable energy capacity, but long-term funding remains uncertain.
The interplay between market-based and regulatory policies suggests that a balanced, context-specific approach is necessary for successful transition in Eastern Europe. Market-based solutions foster competition, whereas regulatory interventions are crucial for overcoming barriers.
The effectiveness of renewable energy policies varies by region and instrument. Feed-in Tariffs (FITs) and Renewable Portfolio Standards (RPS) are among the most effective. FITs stimulate research and development (R&D) and increase capacity growth more efficiently than RPS [
45]. Renewable energy policies have evolved in the United States since the 1990s, with command-and-control regulations proven effective in established markets [
46]. The European Union Emissions Trading System (ETS) and Renewable Energy Directive are significant policies for reducing greenhouse gas emissions in the electricity sector [
47].
Contradictions exist regarding policy effectiveness in various economic and market contexts. Some studies suggest that policy credibility and predictability are key factors influencing investment risk [
48]. Others argue that specific policy design elements (such as auction-based FITs and performance-based incentives) have a more significant impact than general regulatory frameworks [
48]. Market structure also affects policy outcomes; in deregulated markets, lower subsidies are required for clean energy technologies with low penetration rates, whereas regulated markets are more cost-effective for high renewable energy targets [
49].
The effectiveness of renewable energy policies depends on the interaction between market-based mechanisms and regulatory intervention. A coordinated approach that combines investment risk mitigation, public engagement, and policy consistency is essential to maximize renewable energy adoption. Additionally, a policy mix integrating emissions trading systems (ETS) and renewable energy incentives can enhance the overall decarbonization outcomes [
50].
The efficiency of energy transitions varies significantly across countries and is influenced by policy design, infrastructure development, and economic structure. Some studies suggest that Latvia has a highly efficient energy transition, whereas others contradict this [
51,
52].
Comparisons highlight disparities in the energy transition performance. Policy consistency and governance capacity are crucial factors. In the European Union, institutional disparities affect energy policy effectiveness [
53]. Infrastructure strategies impact the outcomes. China uses a bottom-up approach to foster adaptive planning, whereas the EU emphasizes regulatory harmonization [
54]. Feed-in tariffs (FITs) are effective in some countries, leading to higher solar photovoltaic capacity growth [
55].
These findings suggest that policy consistency, institutional governance, and infrastructure adaptability are the key factors in energy transition efficiency.
Despite increased investments in low-carbon technologies, higher spending does not always correlate with proportional emission reductions because of policy inefficiencies, economic constraints, and carbon leakage. In Palembang, Indonesia, a
$405.6 million investment was estimated to reduce emissions by 24.1% in 2025, yet governance barriers hinder full realization [
56]. A study of 72 countries found that domestic clean energy investments reduce emissions by 0.05%, often offset by a 0.28% increase in neighboring countries, suggesting pollution outsourcing [
57]. These inefficiencies highlight the need for better energy governance, coordinated international frameworks, and policies to minimize carbon leakage.
The effectiveness of energy transition strategies varies across countries and is influenced by policy design, regulatory consistency, and infrastructure development. While some nations have achieved high energy efficiency, others have struggled with policy fragmentation and carbon leakage.
The impact of environmental spending on emission reduction often shows diminishing returns, where increased expenditures do not always lead to proportional improvements. A key factor is the rebound effect, in which efficiency gains or subsidies lead to increased consumption, rather than absolute reductions in emissions.
Studies indicate that removing or reducing energy subsidies can decrease overall energy consumption and greenhouse gas emissions. In Ukraine, the elimination of subsidies was estimated to reduce energy consumption by 2.5% and GHG emissions by 3.6% [
58]. In Iran, electricity subsidy reforms could reduce electricity consumption by 22% and prevent 944 million tons of CO
2 emissions over 33 years [
59]. However, the effectiveness of these reforms is often undermined by rebound effects, as consumers increase their energy usage because of cost savings.
The magnitude of the rebound effects varies across sectors. In Australia, low-income households demonstrated high rebound effects using savings from energy subsidies for increased consumption [
60]. In food waste prevention initiatives, macroeconomic rebound effects offset 38% of potential environmental savings [
61]. In smartphone reuse in the U.S., rebound effects were estimated to offset 29–46% of emission savings, with a potential backfire effect exceeding 100% in extreme cases [
62]. In Pakistan, direct rebound effects from energy efficiency improvements were estimated at 69.5% in the long run and 42.9% in the short run, significantly reducing net energy savings [
63].
These findings highlight the importance of designing environmental policies that account for potential rebound effects to maximize the effectiveness of achieving sustainability goals.
Research suggests that environmental expenditure exhibits diminishing marginal returns, indicating that beyond a certain threshold, additional spending fails to generate proportionate benefits. Green finance development has a non-linear effect on reducing energy intensity, with significant improvements occurring only after the green finance index threshold of 0.199 is exceeded [
64]. Environmental regulations also play a nonlinear role in shaping the relationship between green finance and high-quality economic development. Excessive regulatory intensity can reduce the effectiveness of green finance, limiting economic benefits, while failing to yield additional environmental improvements [
65]. In ASEAN economies, a trade-off exists in which green finance enhances environmental sustainability but at the potential expense of economic growth. Conversely, financial development, foreign direct investment (FDI), R&D investment, and green technologies support economic expansion, albeit sometimes at the cost of environmental degradation [
66].
These findings underscore the complex tradeoffs between environmental sustainability and economic growth, emphasizing the need for carefully calibrated environmental policies.
Environmental policies often have spillover effects across regions, influencing carbon leakage, industrial migration, and emission reduction. While carbon pricing and emissions trading schemes (ETS) have reduced emissions in participating regions, they may also cause unintended consequences in non-participating areas [
67,
68].
A major concern is carbon leakage, in which CO
2-intensive industries relocate to regions with less stringent regulations. Some studies suggest that aggregate international trade does not significantly contribute to leakage, but evidence shows higher leakage rates for imports from countries with stringent carbon policies [
69]. This highlights the need for global cooperation to prevent the displacement of emissions.
Similar regulatory shifts have been observed in Asia, where emission-pricing schemes have led to both positive and negative spillover effects. In China, regional carbon trading programs have reduced CO
2 emissions but have also displaced high-emission industries to provinces with weaker enforcement [
70,
71]. These insights emphasize the need for a careful policy design to balance emission reductions with economic stability.
Industrial migration is another result of unilateral climate policies, particularly affecting energy-intensive and trade-exposed sectors [
72]. However, regional policy spillovers can also positively impact emission reduction. Technological diffusion and inter-regional carbon spillovers can accelerate transportation sector decarbonization [
73]. Innovations, such as hydrogen-based steel production (DRI-H2), benefit from early adoption in one region, reducing overall costs and emissions elsewhere [
74].
To maximize positive spillovers and mitigate negative effects, policymakers should perform the following:
Neighboring regions often influence environmental policies, leading to both positive and negative spillover effects.
Research indicates that regulations reduce local carbon emissions, but may increase emissions in adjacent areas due to industrial relocation [
67]. The digital economy has strong spatial spillover effects on emissions, extending up to 750 km before declining [
75].
There are contradictions regarding neighboring policies. In China, stringent air pollution controls have reduced PM2.5, secondary precursor emissions in targeted regions, and increased emissions in neighboring provinces, potentially shifting pollution rather than reducing it [
76]. While some regions benefit from spillover effects, others experience environmental degradation, as industries relocate to areas with weaker regulations. These findings highlight the complex interplay between the local and regional environmental policies.
The role of spatial spillovers in emission reduction underscores the importance of regional cooperation in environmental policy design. While carbon pricing and regulatory measures can be nationally effective, their regional consequences must be considered to avoid carbon leakage, industrial migration, and unintended emission shifts. A coordinated approach is crucial for maximizing positive policy spillovers while minimizing negative externalities.
Spatial spillovers in economic and environmental policies have been widely studied, revealing both positive and negative effects in different contexts. These spillovers occur through multiple channels, including geographical proximity, trade relationships, and financial linkages [
77]. However, the impact of spillovers varies significantly based on the policy approach and economic environment.
Contradictions arise in the observed effects of spatial spillover. Capital subsidy policies may lead to positive agglomeration effects, often offset by negative cross-sectional substitution and crowding-out effects [
78]. For FDI in China, negative intra-regional spillovers outweigh the potential positive externalities in certain regions [
79].
These findings highlight the complex nature of spatial spillovers and the need for context-specific considerations when designing economic and environmental policies. The literature suggests that policy coordination and tailored interventions are essential for maximizing positive spillovers while mitigating negative effects [
80,
81].
The impact of spatial spillovers in renewable energy technology innovation (RETI) presents a complex picture. Liu et al. (2022) found that RETI promotes local industrial green transformation and upgrading (IGTU) but inhibits IGTU in neighboring regions, creating a “beggar-thy-neighbor” effect [
82]. This negative spillover effect is observed up to 800 km, but turns positive beyond 800–1400 km, indicating a nonlinear relationship between distance and spillovers.
Other studies have emphasized the positive spillover effects of renewable energy innovation. International knowledge spillovers play a crucial role in advancing renewable energy technologies in OECD countries, with contributions comparable to domestic R&D and human capital investments [
83]. This suggests that knowledge and technology transfer across borders can enhance the effectiveness of renewable energy investments.
The contradictions in spatial spillover effects may stem from the following:
Differences in focus areas (e.g., industrial transformation vs. technological innovation);
Variations in geographical scale (e.g., provincial vs. international comparisons);
Different economic and regulatory conditions affecting spillover intensity and direction.
These findings highlight the multifaceted nature of spatial spillovers in energy technology. While some studies indicate negative competitive effects between regions, others underscore positive knowledge spillovers, benefiting from broader energy transitions.
The role of spatial spillovers in economic and environmental policies underscores the need for tailored region-specific interventions. While command-and-control policies can mitigate negative spillovers, market-driven approaches foster positive technological diffusion. The beggar-thy-neighbor effect in renewable energy technology highlights the importance of inter-regional cooperation in ensuring sustainable technological progress.
While existing research has examined emissions dynamics in advanced economies and major polluters, such as China and the United States, limited empirical work has focused on Eastern Europe. The effectiveness of government environmental spending in the region remains underexplored, particularly regarding the threshold effects and nonlinear efficiency patterns. This study fills this gap by combining advanced spatial econometrics, nonparametric threshold regression, and efficiency analysis to assess emission mitigation policies in Eastern Europe. The findings will inform policymakers on the optimal allocation of environmental expenditures and the necessity of regional coordination in emission reduction efforts.
3. Methodology
The dataset used in this study incorporates a wide range of variables that are essential for examining the relationships between economic growth, energy transformation, and environmental performance in Eastern Europe. The research concentrated on Bulgaria, Croatia, Czechia, Estonia, Hungary, Latvia, Lithuania, Poland, Romania, Slovakia, and Slovenia, covering the period 2010–2023. Economic indicators such as GDP per capita and trade openness shed light on these nations’ financial landscapes, while energy-related factors such as renewable energy investment patterns and fossil fuel usage provide a detailed overview of their energy sectors. The incorporation of environmental performance metrics and expenditure information enables sophisticated analysis of how these countries tackle ecological issues within the framework of their economic and energy strategies.
The use of multiple reputable data sources enhances the reliability and depth of analysis. Eurostat, as the statistical office of the European Union, offers standardized and comparable data across member states, which is particularly valuable for studying Eastern European countries. The International Energy Agency’s data on energy trends provides a global perspective on these nations’ energy transitions. The World Bank’s economic indicators offer a broader context to understand these countries’ positions in the global economy. Finally, the OECD’s Environmental Performance Index adds a crucial dimension for assessing the effectiveness of environmental policies and practices. This diverse range of sources has ensured a multifaceted approach to examining the complex relationships between economic growth, energy transition, and environmental sustainability in Eastern Europe over the past decade.
The dataset encompasses a comprehensive range of variables that provide insights into the economic, energy transition, and environmental performance of various countries and regions (
Table 1). Economic indicators offer a multifaceted view of economic health, including measures of overall economic output (GDP per capita), labor market conditions (labor costs), capital investment (gross fixed capital formation), and international trade engagement (trade openness). These metrics provide a picture of economic development and competitiveness.
The energy transition metrics delve into the progress towards sustainable energy systems, capturing investments in renewable energy capacity, improvements in grid efficiency, and shifts in energy consumption patterns from fossil fuels to low-carbon sources. The environmental performance category directly addresses the environmental impact of economic activities and energy use, with CO2 emissions serving as a key indicator of climate change contributions and the Environmental Performance Index, providing a broader assessment of environmental sustainability. This diverse set of variables enables researchers to explore the complex interrelationships among economic growth, energy transition efforts, and environmental outcomes, potentially informing policy decisions and strategies for sustainable development.
To comprehensively analyze the determinants of CO
2 emissions in Eastern Europe, we employ a multi-model econometric approach that leverages both static and dynamic panel data techniques as well as spatial econometric methods [
84,
85]. This methodological framework allows for a robust examination of both the short- and long-term factors influencing emissions while accounting for spatial dependencies among countries. By incorporating static models, we can identify the fundamental relationships between key economic, demographic, and policy variables and CO
2 emissions. Dynamic panel data techniques help to capture temporal dependencies and potential feedback effects, ensuring a more comprehensive understanding of how emissions evolve over time.
Additionally, spatial econometric methods enable us to assess the extent to which CO2 emissions in one country are influenced by those in neighboring countries, highlighting the role of regional spillover effects. This is particularly relevant in Eastern Europe, where economic integration, shared environmental policies, and cross-border industrial activities may contribute to interdependencies in emissions patterns. By combining these approaches, our study provides a nuanced perspective on the drivers of CO2 emissions, offering valuable insights for policymakers seeking to design effective strategies for emission reduction, while considering both national and regional dynamics.
This study incorporated several robustness checks to ensure the reliability of our findings. We conducted a Variance Inflation Factor (VIF) analysis to assess multicollinearity, confirming that none of the predictor variables exhibited excessive correlation. Additionally, Breusch–Pagan and White tests for heteroskedasticity were performed to verify that the variance distribution does not bias our results. Serial correlation checks using the Durbin–Watson statistic confirmed the absence of significant autocorrelation in the residuals. To further validate the stability of our model, we conducted Leave-One-Country-Out Cross-Validation, sequentially omitting individual Eastern European economies from the dataset. This analysis ensures that our results are not disproportionately driven by any country’s economic profile, such as Poland’s significant industrial footprint. By incorporating these robustness checks, we ensure that our conclusions remain statistically sound and generalizable across different national contexts in Eastern Europe.
The fixed-effects model (FEM) is a powerful statistical approach used in panel data analysis to control for unobserved country-specific heterogeneity [
86]. This technique effectively removes the impact of these unobserved factors from the estimation, allowing for a more accurate assessment of the relationship between independent variables and the outcome of interest.
One of the key advantages of FEM is its ability to reduce the risk of confounding effects. By focusing on within-country variation over time, the model eliminated the influence of omitted variables that remained constant for each country throughout the study period. This approach enhances the overall robustness of the analysis as it mitigates the potential biases that could arise from unaccounted country-specific factors. Additionally, FEM allows the isolation of the effects of time-varying independent variables, providing more reliable estimates of their impact on the dependent variable. This method is particularly valuable in cross-country studies, where unobserved cultural, institutional, or historical factors may play a significant role in shaping economic outcomes. We also used Principal Component Analysis (PCA). This technique is generally used to transform correlated variables into smaller sets of uncorrelated components. In our analysis, PCA was applied to mitigate multicollinearity, and the resulting components (PC1, PC2, etc.) served as stable predictors in the regression model.
The equation of the model is as follows:
where α
i represents country-specific fixed effects, PCA-derived predictors (PC1–PC4) mitigate multicollinearity from correlated independent variables, and ε
it is the robust error term.
We employed a scree plot analysis and a cumulative variance threshold to determine that PC1–PC4 collectively explain 85% of the variance, making them the most relevant predictors while mitigating collinearity (
Figure 1 and
Table 2).
The model employs cluster-robust standard errors to address two common issues in econometric analysis: heteroscedasticity and serial correlation. Heteroskedasticity occurs when the variability of a variable is unequal across the range of values of the second variable that predicts it. Serial correlation, on the other hand, refers to the relationship between a given variable and itself over various time intervals. Using cluster-robust standard errors, the model accounts for these potential problems, ensuring more accurate and reliable estimates. This approach is particularly useful when dealing with panel data or time series, in which observations within clusters (such as individuals, firms, or countries) may be correlated over time. Cluster-robust standard errors allow for arbitrary correlation within clusters while assuming independence between clusters. This method provides a more conservative estimate of standard errors, reduces the likelihood of Type I errors (false positives) in hypothesis testing, and improves the overall robustness of the model’s results.
The Johansen Cointegration Test, Granger Causality Tests, and Impulse Response Functions (IRFs) form a comprehensive analytical framework for investigating the complex interplay between emissions, renewable investments, and environmental expenditures. The Johansen Cointegration Test is particularly useful for identifying long-term equilibrium relationships among these variables, even if they individually exhibit nonstationary behavior. This test can reveal whether these factors move together over time, indicating a stable long-run association that persists despite the short-term fluctuations.
The Granger Causality Tests complement this analysis by focusing on short-term directional relationships. These tests help determine whether changes in one variable precede and predict changes in another, providing insights into potential cause-and-effect dynamics. For instance, they can reveal whether increased renewable investments lead to reduced emissions or whether higher environmental expenditures drive greater renewable investments. Impulse Response Functions offer a dynamic perspective by simulating how the system responds to sudden shocks or changes in one variable. IRFs can illustrate the magnitude and duration of the effects that a sudden increase in environmental expenditures might have on emissions levels or renewable investments over time, accounting for the complex feedback mechanisms within the system.
To estimate the energy efficiency scores, we used the following stochastic frontier model:
where v
it∼N(0,σ
v2)v
it∼N(0,σ
v2) is the symmetric noise term, and u
it∼∣N(0,σ
u2)∣u
it∼∣N(0,σ
u2)∣ represents technical inefficiency.
This approach enables a comprehensive assessment of a country’s effectiveness in harnessing and deploying low-carbon energy sources. By examining factors, such as the proportion of renewable energy in the overall energy mix, investments in clean energy infrastructure, and policies promoting sustainable energy adoption, we can gauge the efficiency of a nation’s low-carbon energy utilization. This analysis provides valuable insights into the progress made towards reducing carbon emissions and transitioning to more sustainable energy systems.
Furthermore, this method facilitates comparisons between countries, highlighting the best practices and areas of improvement. This can reveal disparities in technological advancements, policy frameworks, and resource allocation among nations. By identifying countries that excel in low-carbon energy utilization, we can extract valuable lessons and strategies that can be adapted and implemented in other regions. This approach also helps pinpoint barriers to efficient low-carbon energy use, such as inadequate infrastructure, lack of public awareness, and economic constraints, allowing targeted interventions and international cooperation to address these challenges.
To investigate nonlinearities in government environmental expenditure, we estimate a threshold regression model to test whether there exists a critical level beyond which expenditure ceases to reduce emissions. The estimated model is as follows:
where τ denotes the estimated expenditure threshold.
In the context of government environmental expenditure, this model can help determine whether there is a specific spending level beyond which the effectiveness or impact of expenditure changes significantly. The model works by dividing the data into different regimes based on the threshold variable, in this case, government environmental expenditure. It then estimates separate regression equations for each regime, allowing different slopes and intercepts. This enables the identification of distinct patterns in the relationship between environmental spending and its outcomes at different expenditure levels. By testing for the existence of a critical level, policymakers can gain insight into the optimal allocation of resources for environmental protection and potentially improve the efficiency of their spending strategies.
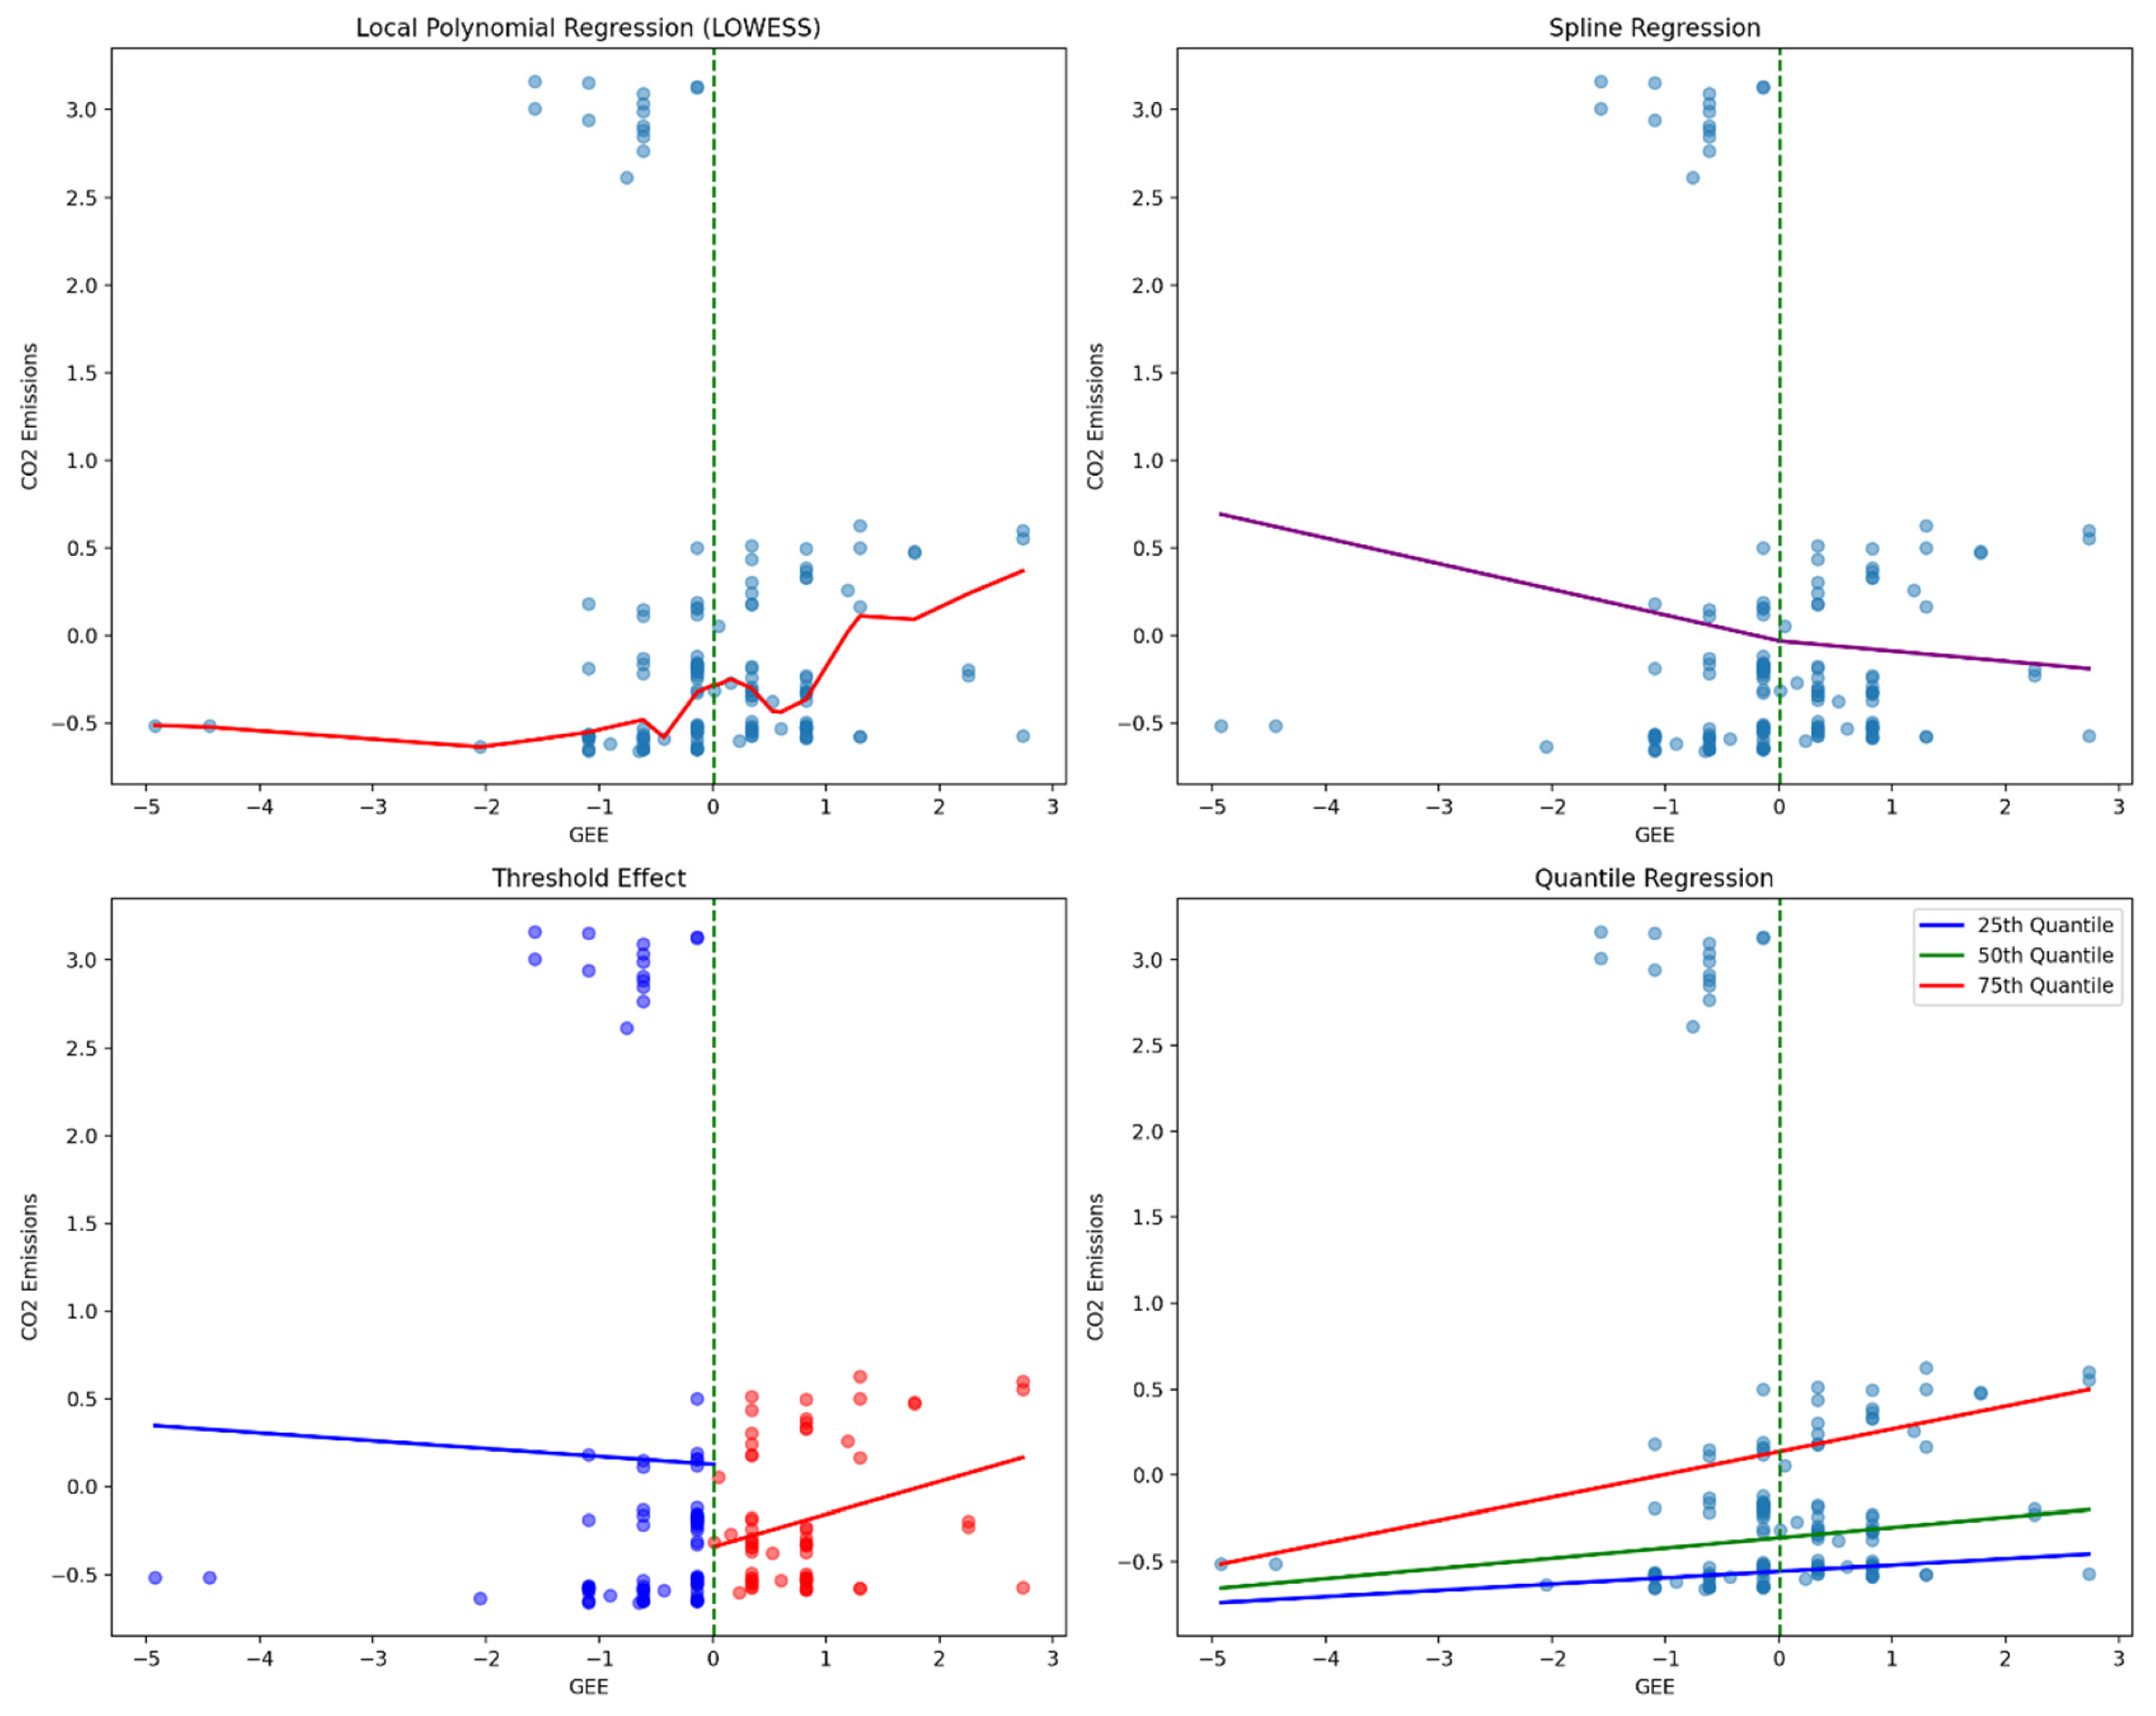
We validated the 0.01 GDP threshold using nonparametric approaches, including LOWESS smoothing, spline regression, and quantile regression (
Figure 2). These methods consistently indicate a regime shift in the expenditure-emissions relationship, where spending beyond 0.01 GDP results in inefficiency.
The Spatial Durbin Model (SDM) is an advanced econometric technique used to analyze spatial relationships and dependencies in data. This is particularly useful when studying phenomena such as CO
2 emissions that tend to exhibit geographic spillovers, meaning that emissions in one area can affect or be influenced by emissions in neighboring regions. SDM extends traditional regression models by incorporating both spatially lagged dependent variables and spatially lagged independent variables, allowing for a more comprehensive analysis of spatial interactions.
where W is the spatial weight matrix that captures the cross-border interactions, ρ is the spatial autoregressive parameter, and WX captures the spillover effects of independent variables (e.g., renewable investments in one country influencing emissions in another).
In the context of CO2 emissions, SDM can help researchers and policymakers understand how emission patterns in one location are related to those in nearby areas. This model can account for various spatial effects such as the diffusion of pollutants across borders, shared economic activities, and common environmental policies among neighboring regions. By using SDM, analysts can quantify the direct effects of local factors on CO2 emissions as well as the indirect effects that occur through spatial spillovers. This approach provides a more nuanced and accurate picture of the complex spatial dynamics involved in CO2 emissions, which is crucial for developing effective strategies to mitigate climate change and reduce greenhouse gas emissions on a regional or global scale.
To ensure the validity and reliability of the model, a comprehensive set of diagnostic tests was conducted as part of a robustness check. These tests are crucial for identifying potential issues that could compromise the accuracy and interpretability of results. Variance Inflation Factor (VIF) analysis is employed to detect multicollinearity among the independent variables, which can lead to unstable and unreliable coefficient estimates if present. The Breusch–Pagan and White tests are utilized to assess heteroskedasticity, which occurs when the variance of the error terms is not constant across all observations. This can affect the efficiency of the estimators and the validity of statistical inferences.
Furthermore, the Durbin–Watson statistic was calculated to examine serial correlation, which is particularly important in time-series data analysis. Serial correlations, if unaddressed, can lead to biased standard errors and inefficient estimates. The Leave-One-Country-Out Cross-Validation technique was also implemented, likely to assess the model’s predictive performance and stability across different subsets of the data. This method involves iteratively excluding one country from the dataset, refitting the model, and evaluating its performance on the excluded country to provide insights into the model’s generalizability and sensitivity to individual country effects. These robustness checks collectively contribute to a thorough evaluation of the model’s assumptions and performance, thus enhancing the credibility of the findings.
Data cleaning and normalization are crucial steps in preparing datasets for analysis. Missing data treatment involves the use of linear interpolation to fill minor gaps in the data and ensure continuity and completeness. Winsorization was applied to outliers beyond the 99th percentile, effectively reducing the impact of extreme values on the analysis. Log transformations are utilized for variables that do not follow a normal distribution, such as CO2 emissions and GDP per capita, to improve the statistical properties of the data and enhance the validity of the subsequent analyses.
The computational tools employed in this study span multiple software environments, leveraging the strengths of the Python 3.11.6. and R 4.4.2 programming languages. Specific R packages are used for various analytical techniques: plm for panel data estimation, vars for Vector Autoregression (VAR) modeling, frontier for Stochastic Frontier Analysis (SFA), and spdep for spatial econometrics. This comprehensive toolkit enables a thorough and rigorous examination of the data, ensuring the reliability and validity of the study’s findings.
4. Results
4.1. Fixed Effects Model with PCA-Based Predictors
The panel fixed effects model with robust standard errors provides a comprehensive estimation of the determinants of CO
2 emissions in Eastern Europe. The R-squared value of 0.7269 suggests that approximately 72.69% of the variation in log-transformed CO
2 emissions is explained by the predictors within countries over time. Inter-country variations are well captured by the R-squared value of 0.9703, reinforcing the strong explanatory power of the model. Sensitivity tests confirmed that the inclusion of PC1-PC4 provides stable estimations, and alternative specifications with fewer components yielded consistent trends (
Figure 3).
The coefficient for PC1 was −0.5150 (p < 0.001), indicating that the primary dimension of variation among the principal components, largely reflecting past emissions and GDP interactions, had a significant negative impact on emissions.
d_log_GDP exhibits a positive and statistically significant coefficient of 0.5505 (p < 0.001), affirming that short-term economic growth remains associated with increasing emissions.
Renewable_Investments are negatively associated with emissions, with a coefficient of −2.348 × 10⁻⁵ (p = 0.0022), although the effect size remains relatively small.
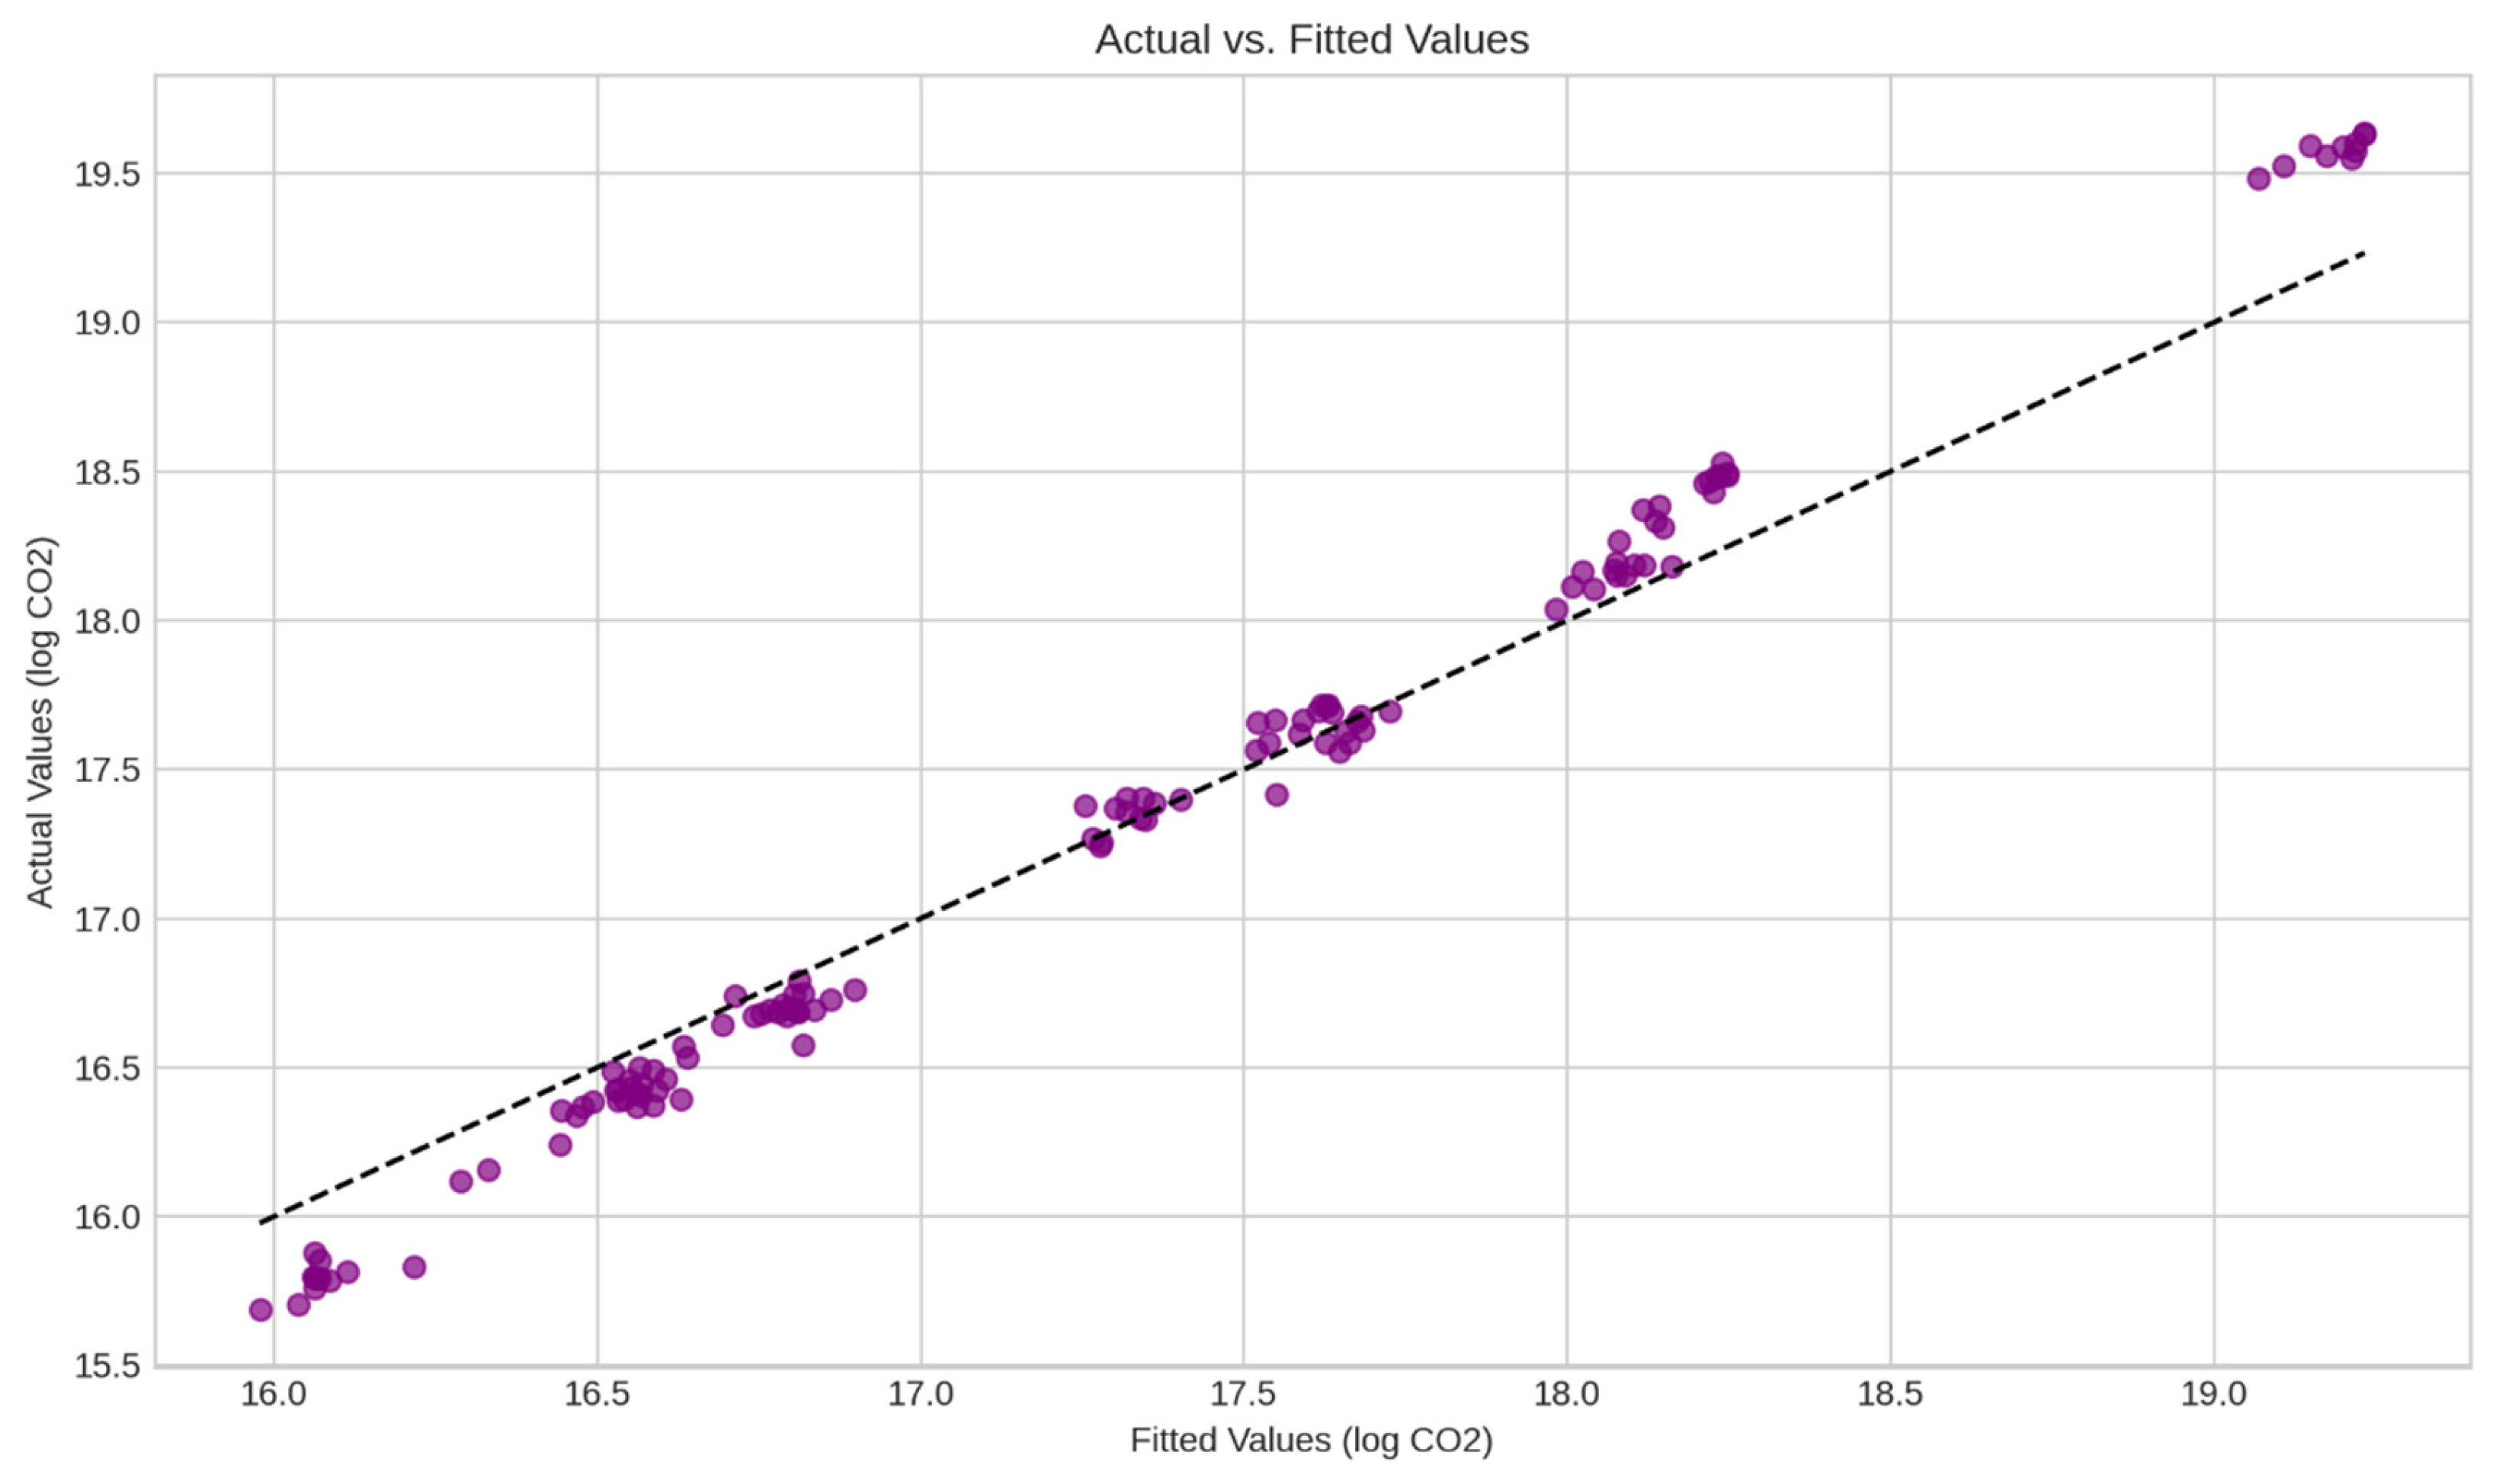
The scatter plot presents the relationship between the actual values of log-transformed CO2 emissions and the fitted values predicted by the regression model. The diagonal dashed line serves as a reference, representing a perfect match between the predicted and actual values, where all points would lie if the model had zero error.
The distribution of points closely follows the diagonal, indicating that the model demonstrates a strong predictive capability. This alignment suggests that the fitted values effectively capture the variation in actual CO2 emissions, reinforcing the reliability of the model’s estimates. The limited dispersion around the line implies that the residual errors were small with no obvious systematic bias in the predictions.
At higher fitted values, slight deviations from the diagonal became noticeable. These variations may suggest that certain extreme observations or specific conditions introduce small discrepancies between actual and predicted emissions. Despite these minor deviations, the overall pattern of the plot confirms the robustness in estimating CO2 emissions, supporting its validity for further analysis and policy recommendations.
4.2. VAR Model and Cointegration Tests
The Johansen cointegration test results confirmed the presence of a long-run equilibrium relationship between CO2 emissions, renewable investments, and government environmental expenditures. The trace statistics exceed the critical values at the 5% significance level, leading to rejection of the null hypothesis of no cointegration. This indicates that these variables co-move over time, reinforcing the idea that energy transition policies have persistent, long-term effects.
Additionally, Granger causality tests provide insights into the short-term dynamics of these relationships.
Renewable investments did not Granger-cause CO2 emissions in the short run (p = 0.3407), suggesting that their immediate impact was limited;
Government environmental expenditures exhibit weak Granger causality at the 10% level (p = 0.0967), implying a potential but statistically fragile short-term link between government spending and emission reductions;
Impulse Response Function (IRF): The long-term effect of renewable Investments on CO
2 Emissions (
Table 3);
To further explore the temporal dynamics of renewable investments, impulse response functions (IRFs) illustrate how a shock in renewable investments influences CO
2 emissions over time (
Figure 4).
The Impulse Response Function (IRF) visualization illustrates the dynamic evolution of CO2 emissions following a shock in renewable investments, capturing both immediate and long-term effects.
The interpretation of the IRF results is as follows. At the moment of investment (Period 0), emissions remain unchanged as new renewable capacity has not yet been deployed. In Period 1, emissions started declining slightly (−3281 CO2 units), indicating that while the shift towards renewables began immediately, the effect was initially modest. Over the next few periods, emissions reductions accelerated significantly, with the impact peaking in Period 4 at −26,156 CO2 units. This suggests that renewable investments take time to reach maximum efficiency, likely because of delays in infrastructure deployment, grid adaptation, and full technology adoption.
Following this peak, the emission reductions begin to stabilize and gradually diminish. In Periods 5–10, the emissions remained well below the initial baseline but experienced a slight upward trend, decreasing at a slower rate. This pattern suggests that, while renewable energy continues to displace fossil fuel-based generation, its marginal benefits diminish over time. Potential reasons for this include market saturation, where additional capacity contributes less significantly to overall reductions, and grid limitations, where outdated infrastructure constrains further efficiency gains.
The IRF results reinforce the importance of long-term stable investment strategies in the renewable sector. Governments should anticipate a delay of 3–5 years before realizing full emission reductions and should complement renewable energy expansion with grid modernization and energy storage solutions to sustain long-term benefits. The results confirm that renewable energy investments play a crucial role in reducing CO2 emissions, albeit with delayed, but sustained effectiveness. While the short-term effects are minimal, long-term reductions in emissions are substantial, emphasizing the need for consistent and patient policy efforts to support renewable energy adoption.
4.3. Stochastic Frontier Analysis (SFA) for Efficiency Estimation
The Stochastic Frontier Analysis (SFA) model provides a detailed estimation of low-carbon energy consumption efficiency, identifying that 20–23% of the variance in energy consumption can be attributed to inefficiency rather than structural or external factors. The results highlight substantial variations across Eastern European countries, pointing to policy-driven discrepancies in energy optimization.
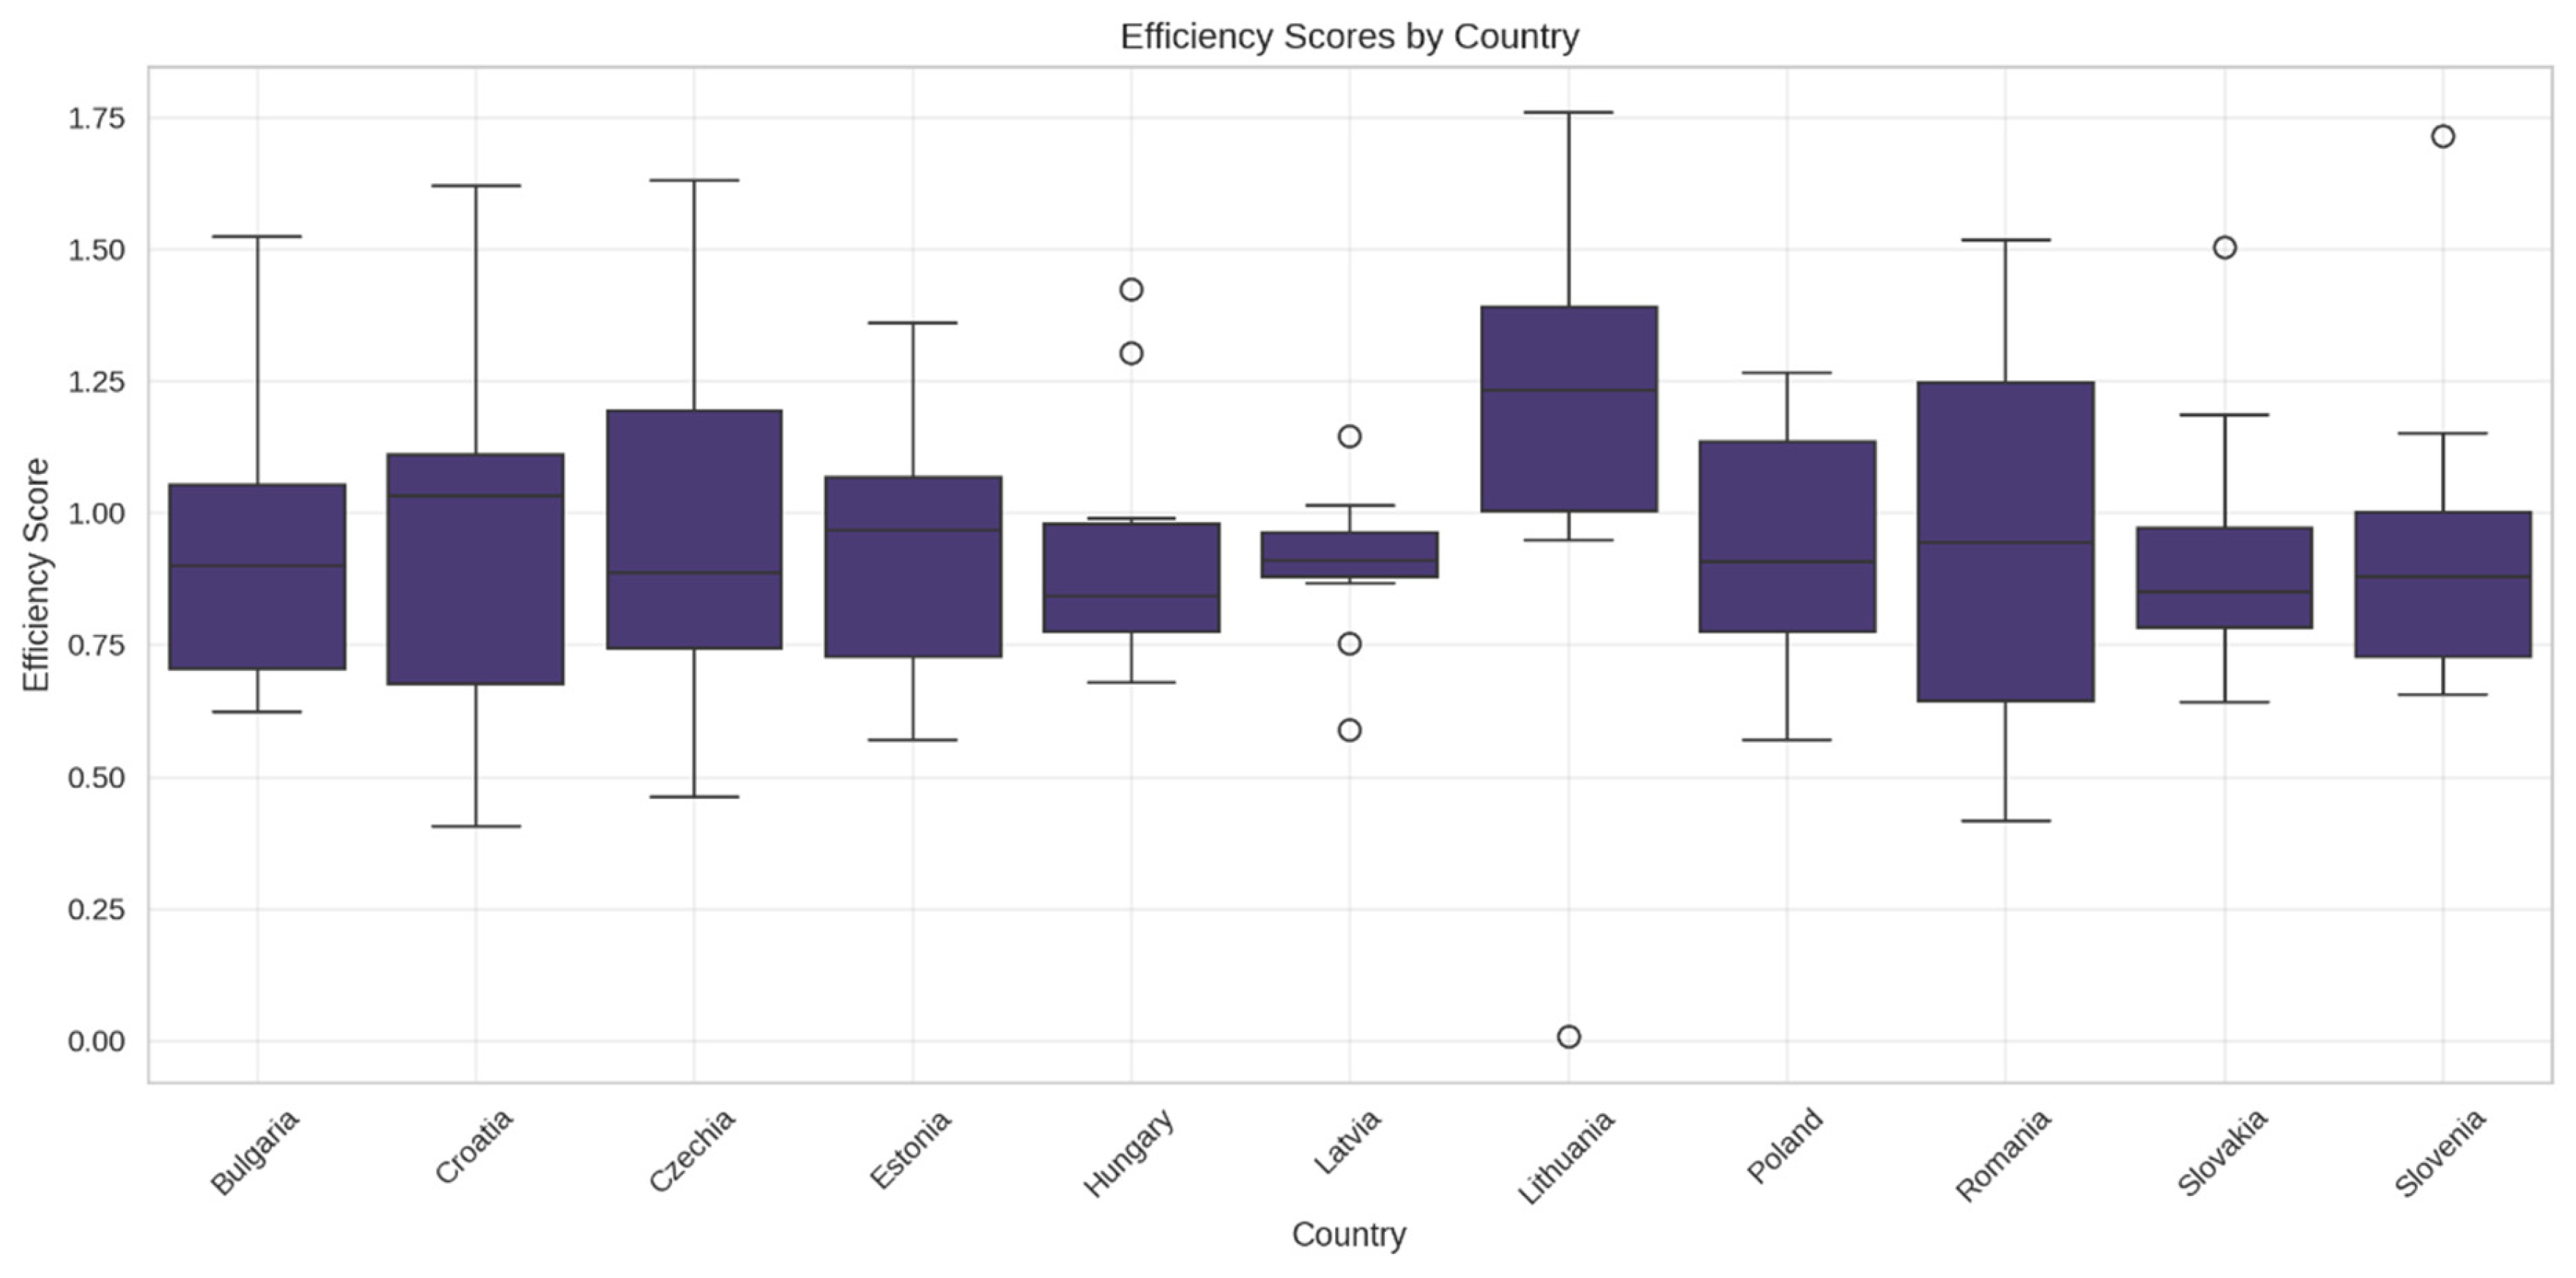
A comparative assessment of country-specific efficiency scores revealed marked differences in energy efficiency levels (
Figure 5). Among the analyzed nations, Lithuania exhibited the highest efficiency (~1.18), while Latvia recorded the lowest (~0.90). This disparity underscores the influence of national energy policies, investment in renewable technologies, and institutional frameworks on shaping efficiency outcomes. Countries with robust regulatory frameworks and well-integrated renewable energy sources tend to achieve higher efficiency, whereas those with fragmented or inconsistent policies tend to exhibit lagging performance.
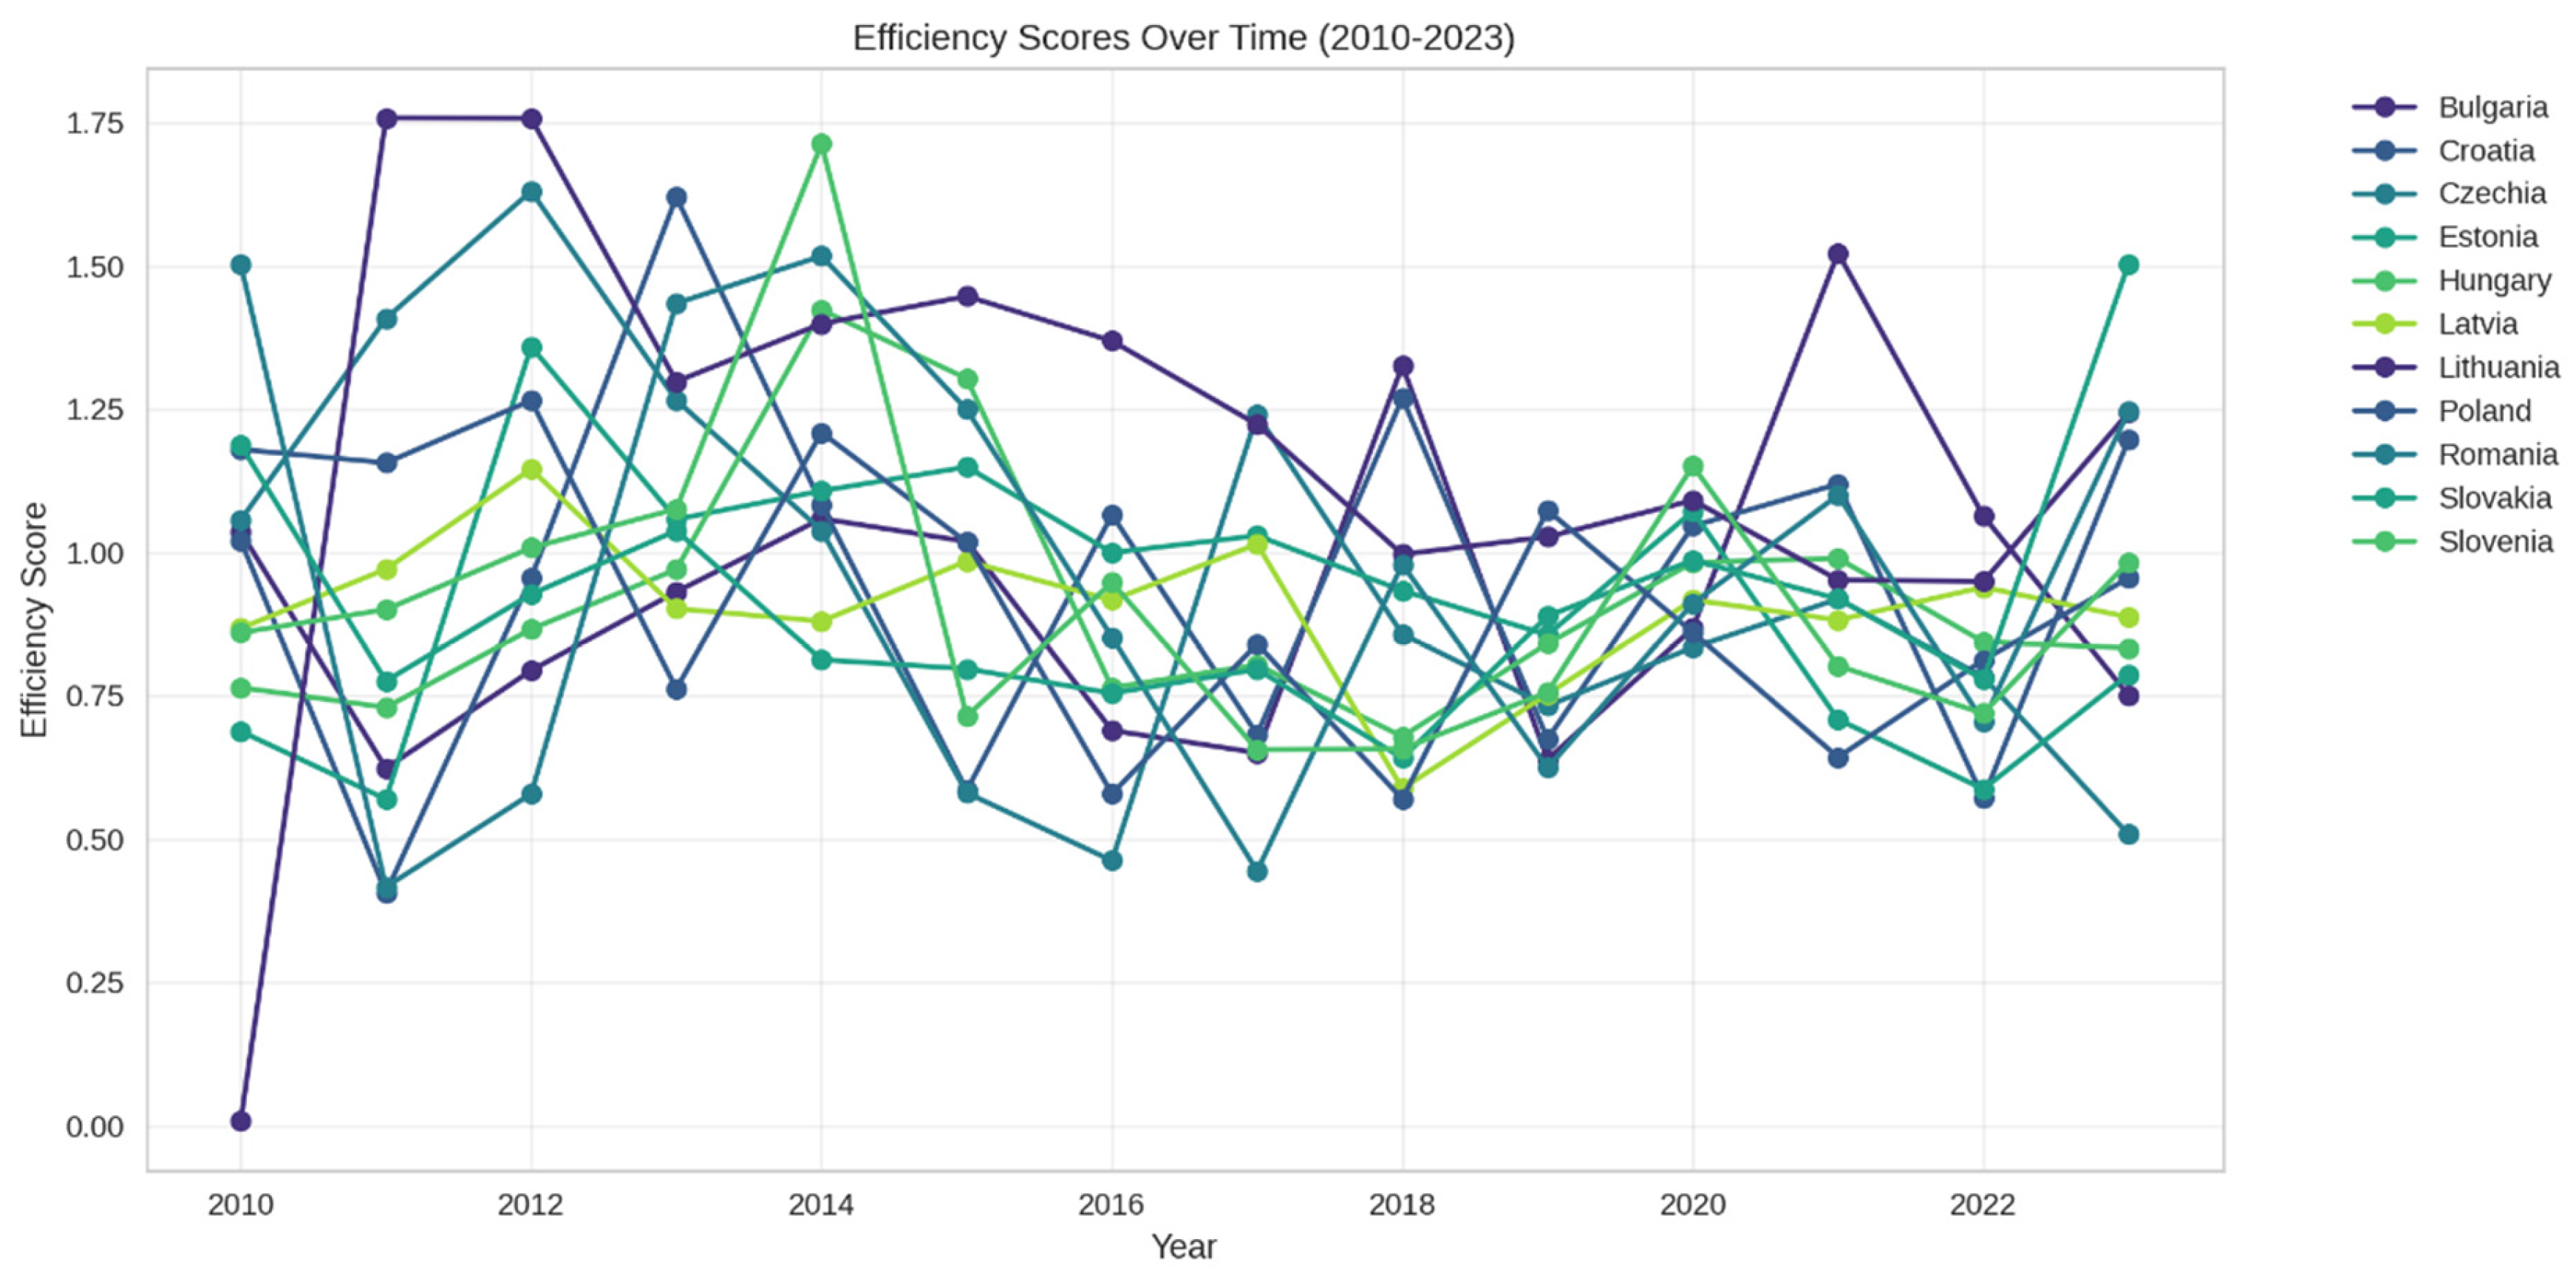
Examining efficiency trends over time, the results indicate that efficiency levels peaked around 2014, aligned with the implementation of major EU energy transition policies and increased funding for renewable infrastructure (
Figure 6). However, a decline in the efficiency scores in the period 2022–2023 suggests potential setbacks in the energy transition process. This recent downturn may be associated with economic disruptions, geopolitical factors affecting energy supply chains, or shifts in policy priorities that have temporarily hindered progress in improving energy efficiency.
These findings emphasize the need for sustained policy efforts to reinforce efficiency gains and mitigate the risk of regression in energy-transition achievements. Policymakers should focus on enhancing energy grid integration, promoting digitalization in energy management, and ensuring long-term regulatory stability to maintain and further improve efficiency levels across the region.
4.4. Threshold Regression Analysis
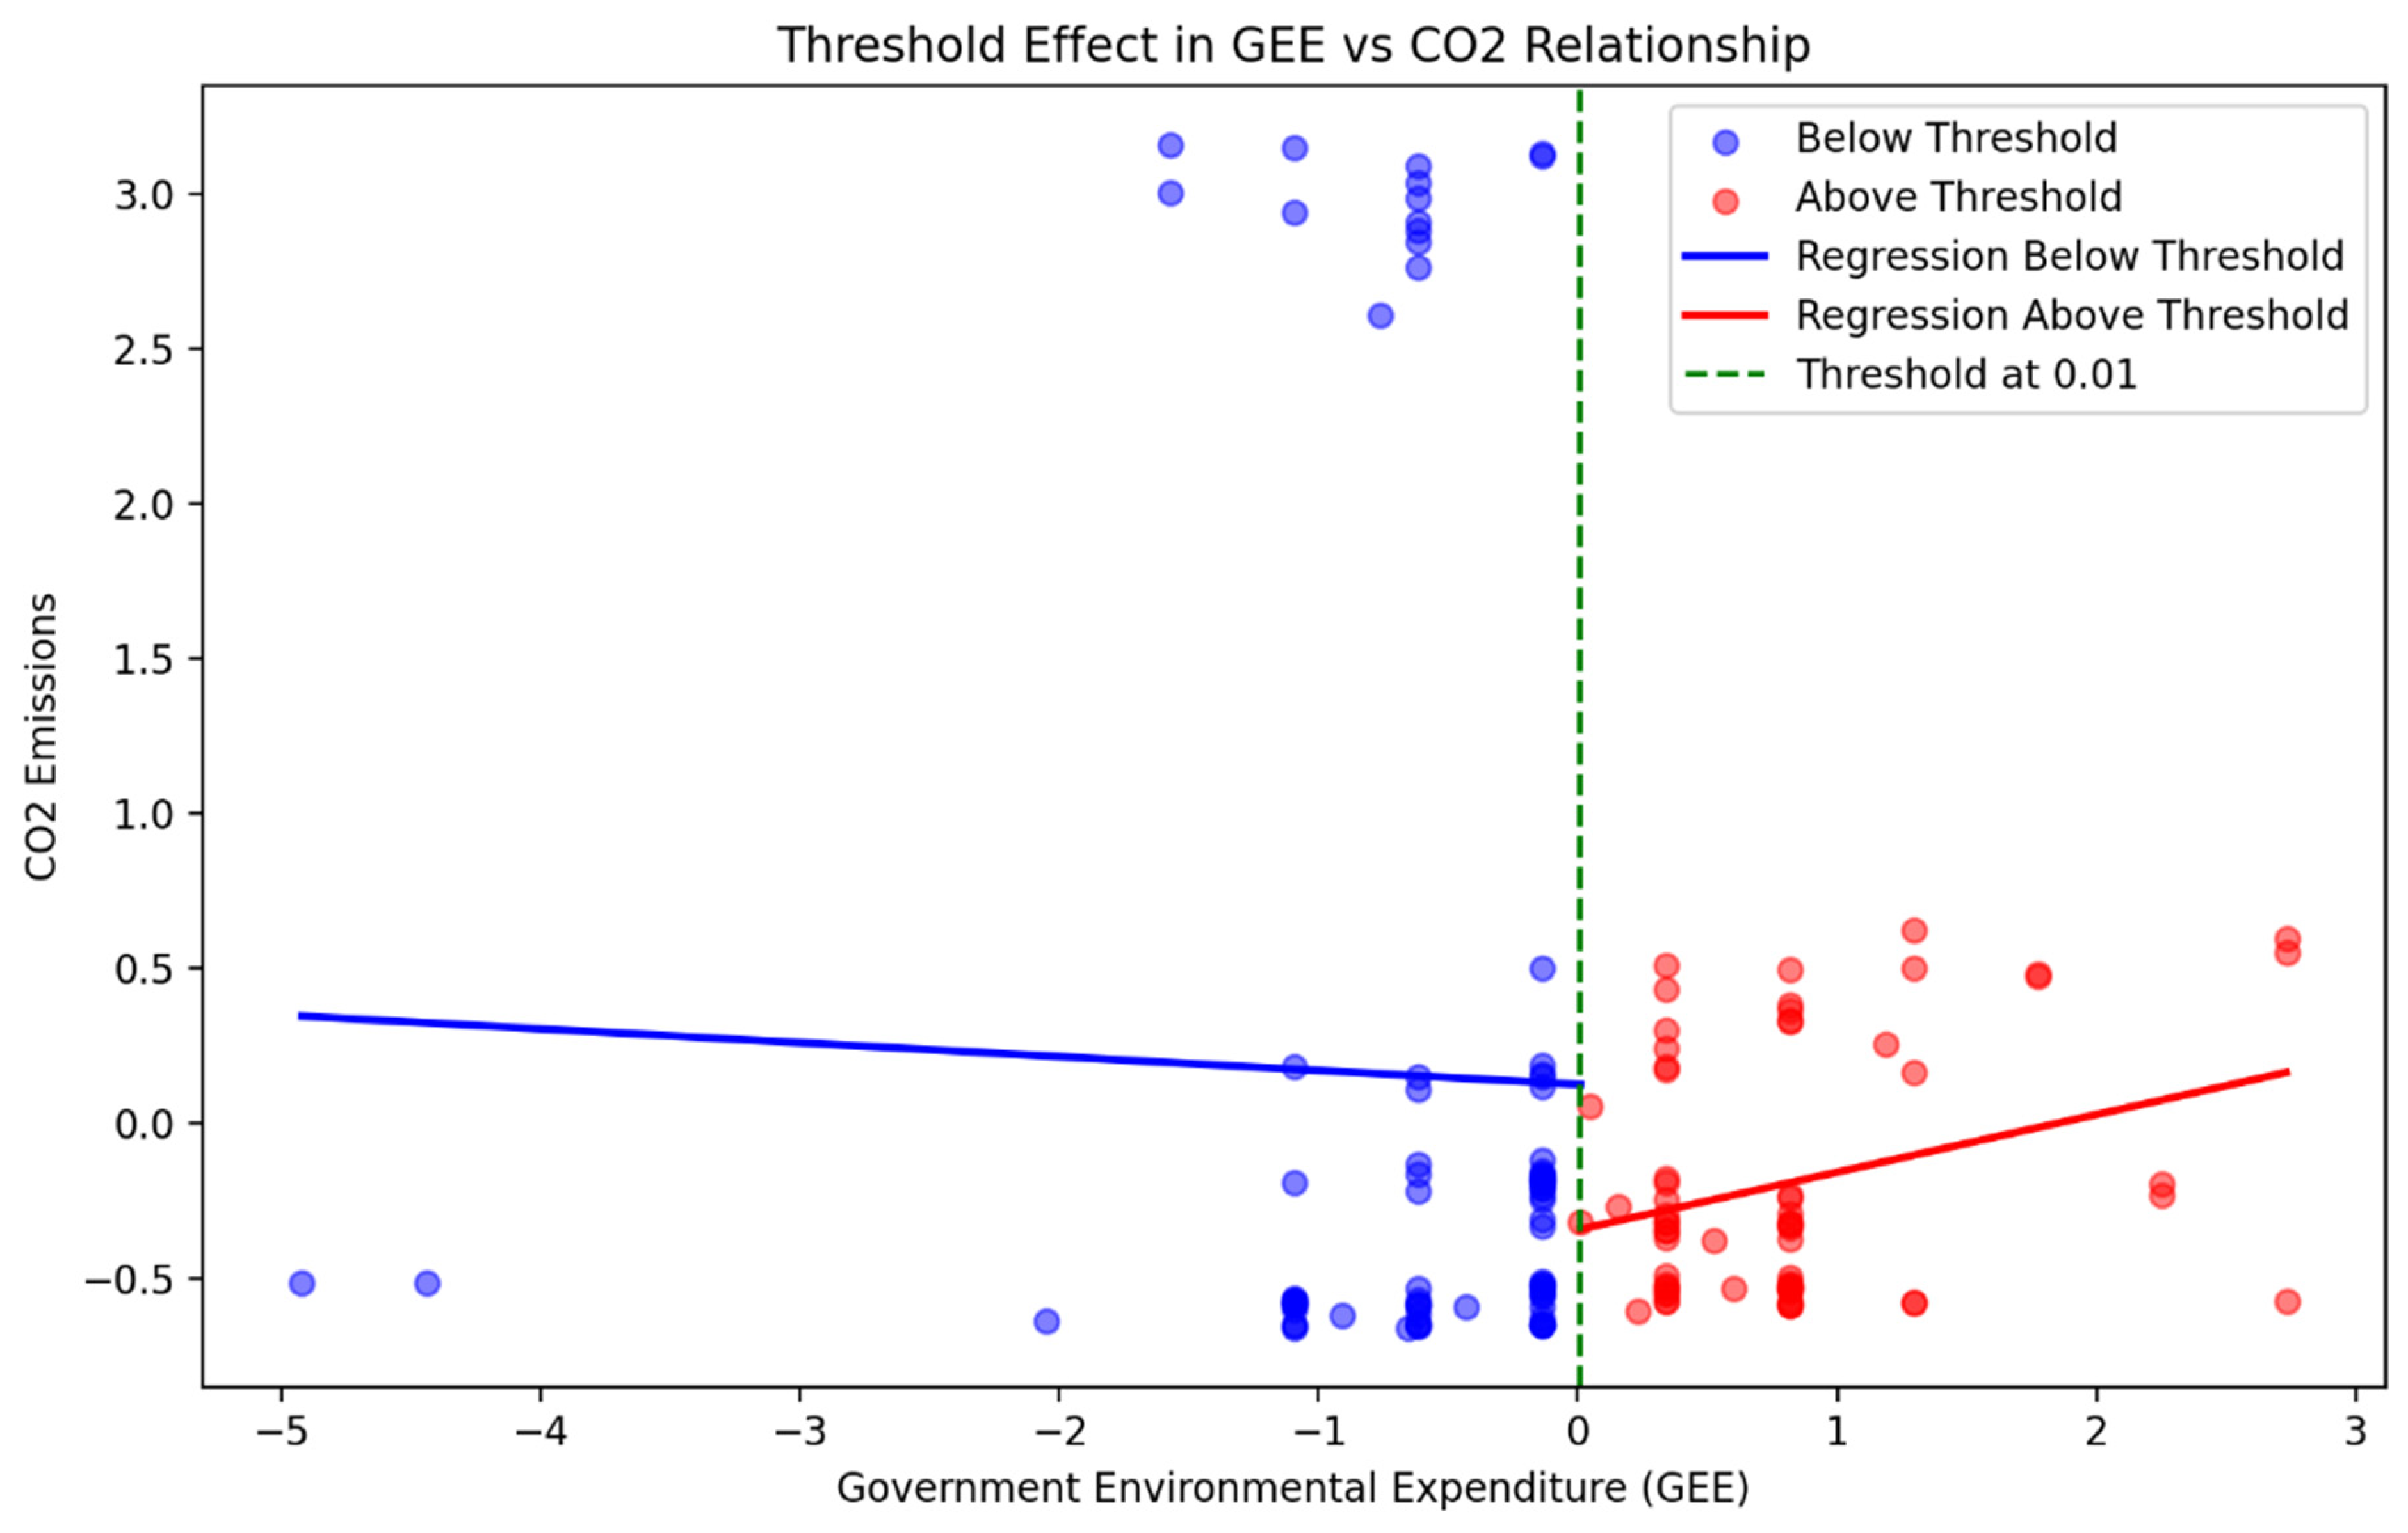
The threshold regression model reveals a critical spending point of 0.01 GDP, beyond which government environmental expenditure becomes less effective and may even increase emissions (
Figure 7). In the visualization, the dashed line highlights the threshold, marking the point of transition, while the blue and red lines illustrate the distinct relationships on either side: the blue line shows the estimated effect for spending below the threshold, and the red line represents the effect for spending above it. This finding suggests that there is a limit to the extent to which public spending can reduce emissions before diminishing returns set in.
Before reaching the 0.01 GDP threshold, each 0.1% GDP increase in environmental spending reduces CO2 emissions by 5.24%. This means that moderate and well-targeted investments in renewable energy, efficiency programs, and regulatory measures effectively contribute to emission reduction. However, once spending exceeds this threshold, its impact reverses, leading to a 14.08% increase in emissions instead of further reduction. This suggests that simply increasing budgets is not always beneficial and may lead to inefficiency.
The reasons for this effect include diminishing returns, where additional investments no longer yield significant environmental benefits. Regulatory saturation may also play a role because too many overlapping policies and programs can become redundant and fail to produce further improvements. Additionally, rebound effects can occur, where increased energy efficiency leads to higher overall energy consumption and offsets emission reductions.
In the same direction, the local polynomial regression plot shows how CO2 emissions change with GEE using a flexible red curve that follows the natural pattern in the data, revealing that emissions tend to increase more rapidly after a certain point (marked by the green dashed line). The spline regression uses a purple line that acts like a smooth bridge connecting different segments of data, showing a slight downward trend overall. The threshold effect plot divides the data into two groups (before and after the green line), using blue and red lines to show that the relationship changes dramatically at this dividing point—decreasing before and increasing after. Finally, the quantile regression doesn’t just show the average trend but displays how different levels of CO2 emissions (low, middle, and high) respond to changes in GEE, with the highest values (red line) showing the steepest increase.
Rather than increasing environmental budgets indiscriminately, governments should focus on optimizing the efficiency of their expenditure. Directing funds for high-impact projects such as grid modernization, energy storage, and industrial emission reductions can ensure that spending translates into measurable environmental benefits. Additionally, incorporating performance-monitoring mechanisms can help assess whether policies are achieving their intended outcomes, allowing for adjustments that maximize effectiveness.
4.5. Spatial Durbin Model (SDM)
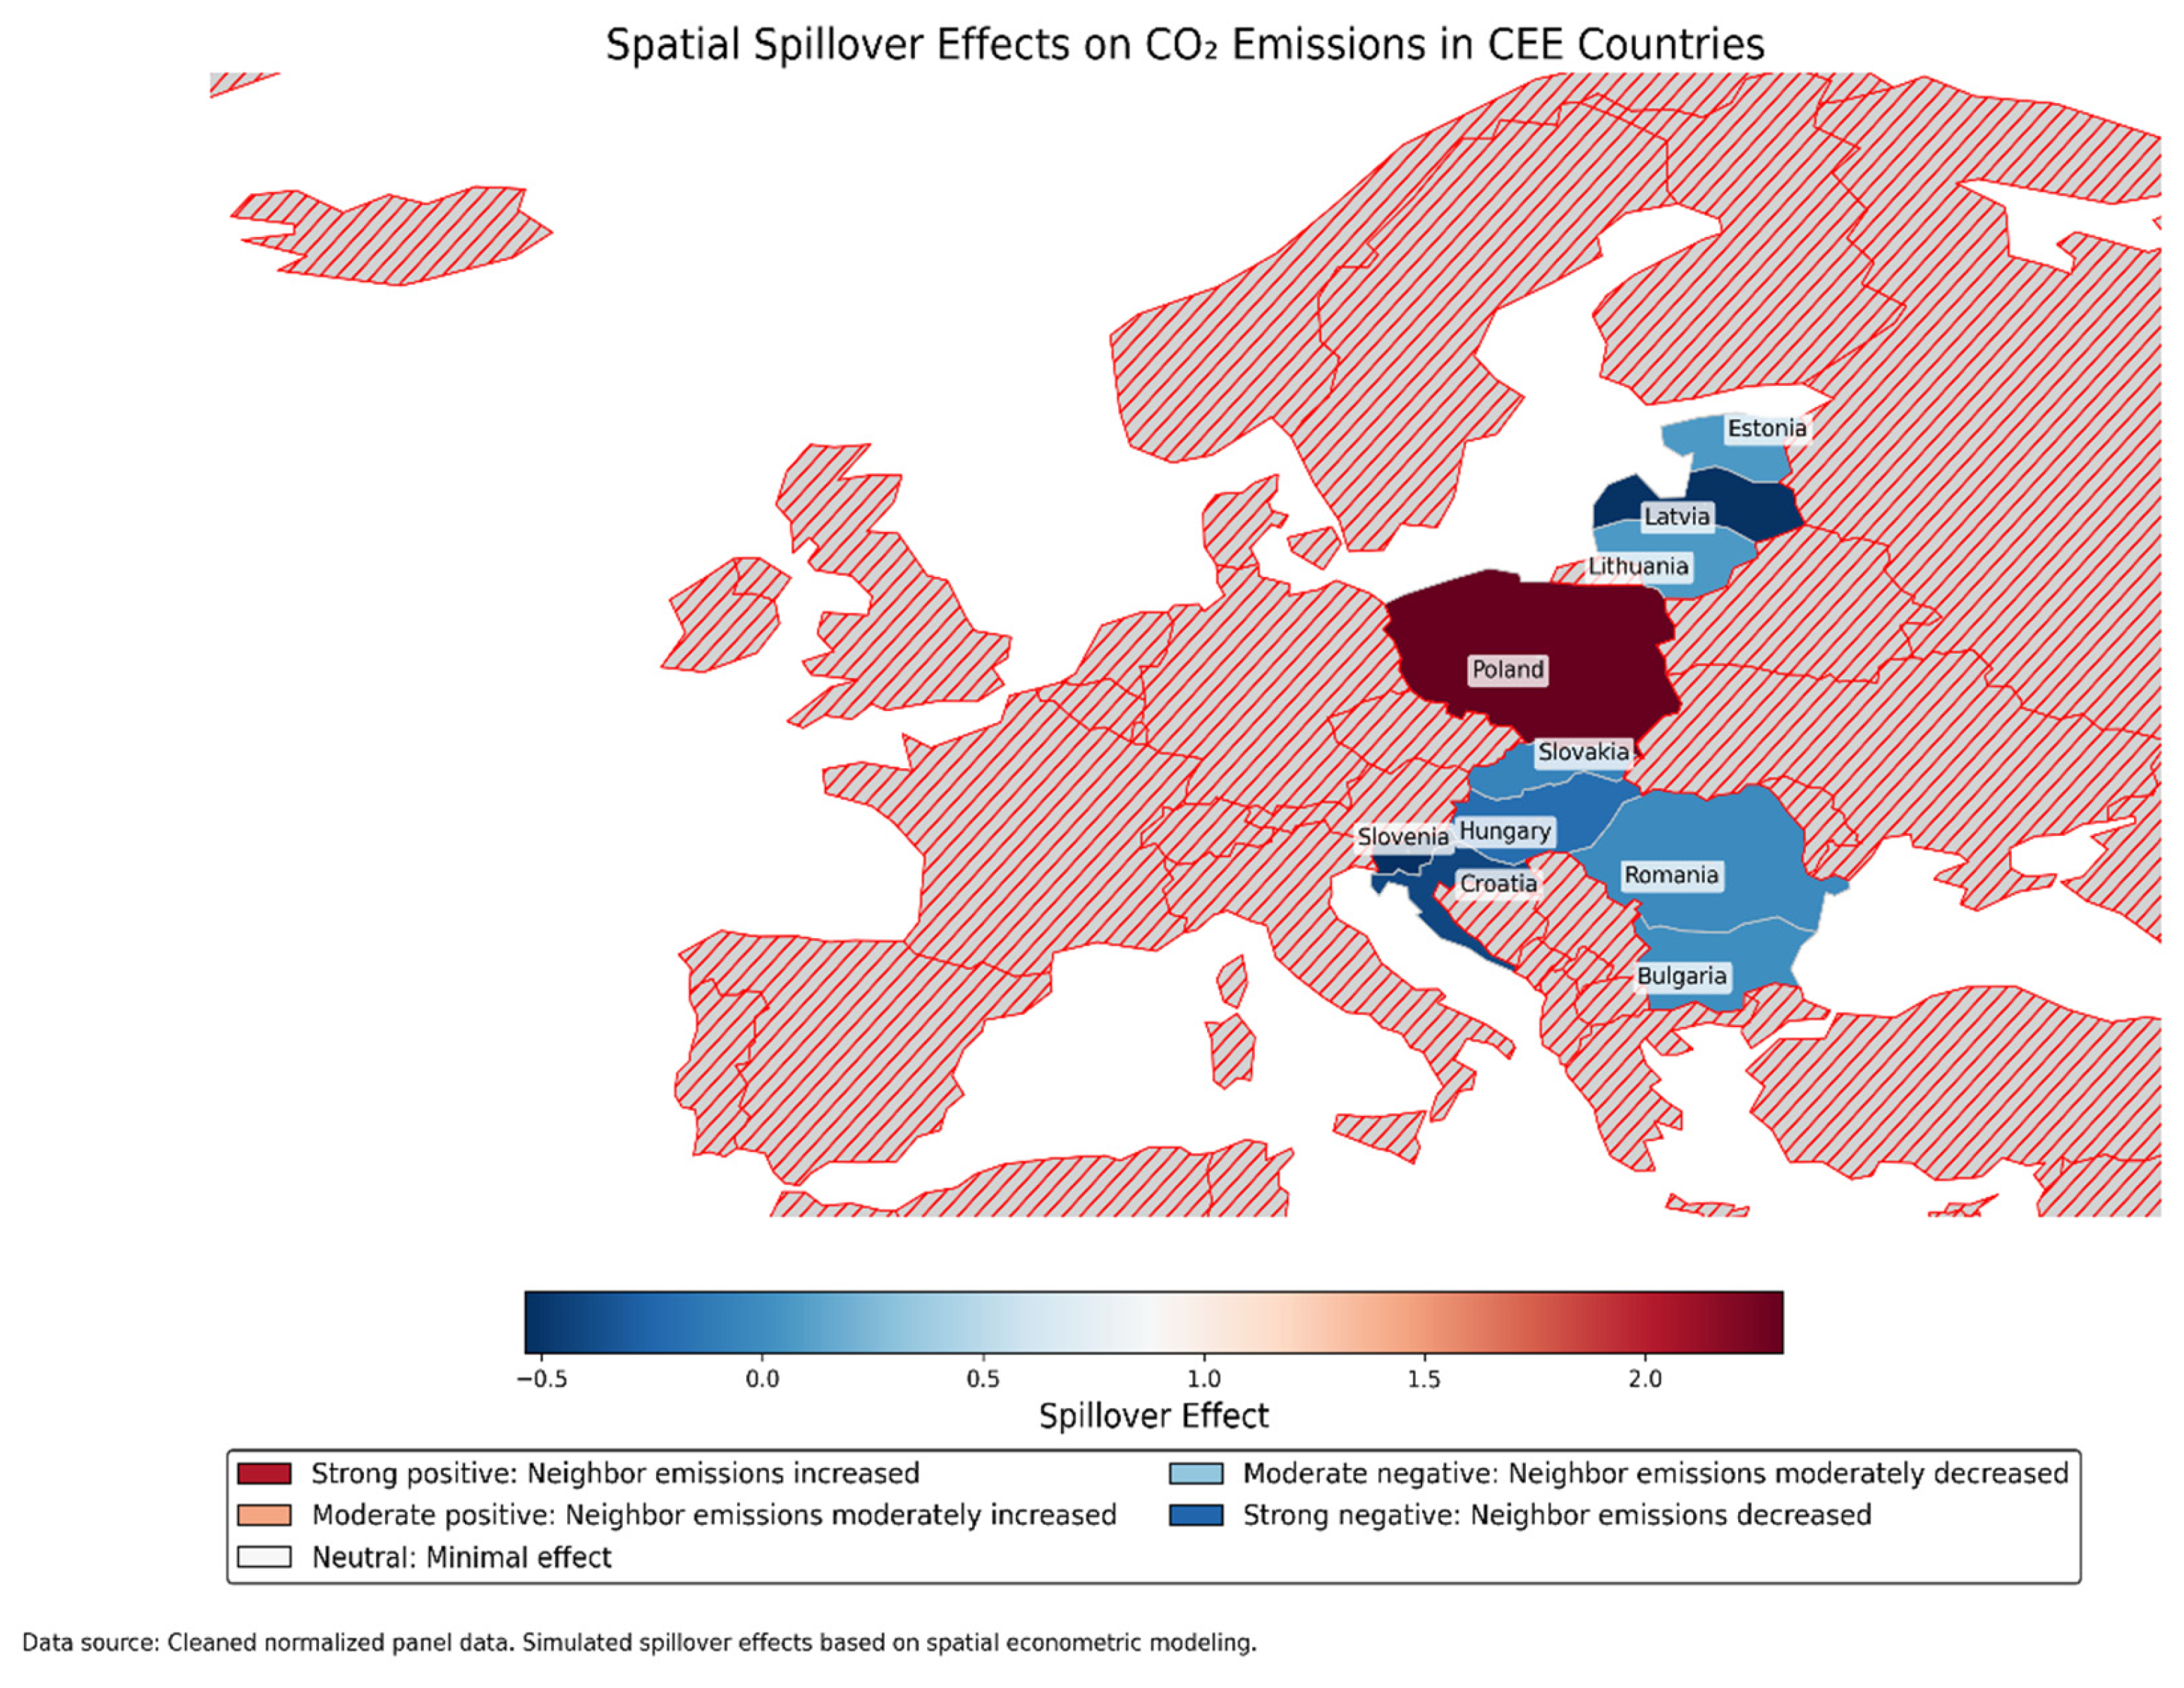
The Spatial Durbin Model (SDM) results highlight the strong spatial interdependence of emissions across Eastern European countries, reinforcing the need for coordinated environmental policies (
Figure 8). The findings suggest that national-level environmental policies do not operate in isolation, as emission outcomes are influenced by cross-border spillovers and regional policy dynamics.
Government environmental expenditure exerted a significant direct negative effect on emissions (−1.26, p < 0.01), confirming its role in reducing national CO2 levels. However, the spillover effects vary depending on the spatial weighting method used.
Under KNN-based weighting, spillovers remain moderate (+0.15, p < 0.05), indicating that neighboring countries may experience indirect benefits from increased environmental spending in a given nation.
Under the inverse distance weighting, spillovers are statistically negligible (+0.03, p = 0.25), suggesting that distant countries are less affected by environmental policies enacted elsewhere.
This variation highlights the importance of selecting an appropriate spatial weight matrix for modeling cross-border environmental effects. Policies implemented at the national level may not be sufficient in isolation, requiring regional cooperation and policy harmonization to prevent emission leakage.
Renewable investments exhibit positive total effects (+1.46), suggesting that while domestic investments drive clean energy adoption, they may also lead to emission displacement to neighboring countries. This phenomenon, known as carbon leakage, occurs when stricter environmental regulations in a country push emission-intensive industries to relocate to jurisdictions with laxer standards.
These results emphasize the need for multilateral environmental strategies in Eastern Europe, including the following:
Cross-border emissions trading schemes to mitigate carbon leakage;
Harmonized energy taxation policies to prevent industrial displacement;
Regional investment in transnational renewable energy projects to optimize the distribution of clean energy infrastructure.
By addressing spatial dependencies, policymakers can design more effective and coordinated environmental strategies, ensuring that emission reduction efforts yield tangible regional benefits rather than shifting pollution across borders.
5. Discussion
The empirical findings provide several key insights into the dynamics of economic growth, renewable energy investments, and emissions in Eastern Europe.
The fixed-effects model confirms the well-documented positive relationship between economic growth and emissions. An elasticity of 0.5505 suggests that rapid industrial expansion remains a key driver of environmental degradation. These results align with the Environmental Kuznets Curve (EKC) hypothesis, where early-stage industrialization contributes to higher emissions and requires active mitigation strategies to achieve sustainable growth. The relationship between economic growth and emissions is complex, as evidenced by various studies of the EKC hypothesis. While some studies support the EKC framework, others present contradictory findings, highlighting the need for context-specific analyses. Several studies have confirmed a positive relationship between economic growth and emissions, aligning with the initial phase of the EKC hypothesis. For instance, in Turkey, economic expansion and energy consumption have been found to positively affect CO
2 emissions, emphasizing the role of industrial activities in environmental degradation [
87]. Similarly, in Baltic countries, higher levels of energy consumption lead to adverse environmental consequences [
88].
However, contradictions have been reported in the literature. In China, a study on Nitrogen Dioxide pollution found a slowly rising linear relationship with economic growth rather than the inverted U-shape predicted by the EKC hypothesis [
89]. Additionally, among the nine Central European countries, the EKC hypothesis was only confirmed in Poland, whereas other nations exhibited different environmental patterns [
90].
Some studies suggest that the EKC relationship may only hold under specific conditions, such as a high elasticity of substitution between fossil fuels and renewable energy [
17]. This implies that countries with strong renewable energy transitions might exhibit earlier emission peaks, while others remain trapped in a growth-emissions cycle.
Although a positive relationship between economic growth and emissions is frequently observed, the validity of the EKC hypothesis varies across regions and pollutants. These studies underscore the importance of considering factors, such as energy consumption, financial development, and renewable energy adoption, in environmental policies. As economies develop, active mitigation strategies and tailored policy approaches become crucial to achieving sustainable growth and reducing environmental degradation.
While renewable energy investments show a statistically significant negative impact on emissions, the small effect size highlights the gradual nature of the transition process. VAR analysis and impulse response functions further support this view, indicating that renewable energy infrastructure requires time to achieve its full environmental benefits. Policymakers should emphasize long-term policy consistency rather than expecting immediate reductions in emissions.
Available research generally supports the notion that renewable energy investments have a gradual impact on reducing emissions, requiring time to achieve their full environmental benefits. Several studies that use VAR analysis and impulse response functions have confirmed this effect. For instance, Li and Su (2017) found that while renewable energy use initially leads to an increase in emissions, it significantly reduces carbon emissions in the long run [
91]. Similarly, Oryani et al. (2020) show that increasing the share of renewable electricity has a positive impact on economic growth, but it is not yet desirable to significantly lower CO
2 emissions [
36]. This suggests that the transition process is gradual and requires time to manifest its full benefit.
Some studies have revealed contradictions or nuances in this relationship. Piłatowska et al. (2020) find that rising renewable energy consumption has a negative but insignificant impact on emissions during economic expansions [
37]. Additionally, Piłatowska and Geise (2021) indicated that despite enormous growth in renewables and active mitigation policies, CO
2 emissions have not substantially decreased in selected countries or globally [
37]. These findings highlight the complexity of the transition process and the need for comprehensive policy approaches.
In conclusion, this research supports the view that renewable energy investments have a gradual impact on emissions reduction, emphasizing the need for long-term policy consistency. Policymakers should focus on sustained efforts and comprehensive strategies, rather than expecting immediate results. As Hao (2022) suggests, under the premise of not affecting economic growth, appropriate renewable energy policies are crucial for achieving a healthy and sustainable global environment [
92].
The SFA model results revealed significant heterogeneity in energy efficiency across Eastern European countries, underscoring the lack of uniform policy implementation in the region. Countries such as Lithuania demonstrate higher efficiency, suggesting better optimization of energy consumption, while Latvia and Slovakia show lower efficiency, indicating the need for targeted interventions to improve technological adoption and grid efficiency.
Existing literature provides mixed evidence regarding cross-country efficiency rankings. 51 et al. (2018) found that Latvia performed better than other Baltic nations in terms of energy efficiency, contradicting findings from Miskinis et al. (2023), which reported that Latvia had the smallest decrease in energy intensity in manufacturing compared to Estonia and Lithuania [
52,
53]. These conflicting conclusions highlight the importance of methodological differences in assessing energy efficiency.
Moreover, studies indicate that efficiency improvements are closely linked to policy consistency and investment in the energy infrastructure. Meyer et al. (2018) emphasize that countries with well-designed regulatory frameworks achieve better efficiency gains, while ad-hoc policy interventions lead to inconsistent progress [
93]. The presence of structural inefficiencies in some countries suggests that technology diffusion, grid modernization, and targeted fiscal policies are essential for closing the efficiency gaps.
In conclusion, while heterogeneity in energy efficiency exists across Eastern European nations, the precise rankings vary based on the methodology used. Policymakers should focus on long-term technology-driven solutions rather than short-term policy adjustments, ensuring that energy efficiency gains are sustained and equitable across the region.
The threshold regression findings reveal that, while initial environmental expenditures reduce emissions, excessive spending beyond 0.01 of GDP may lead to inefficiencies. This could be due to diminishing returns, bureaucratic inefficiencies, or rebound effects, where increased subsidies inadvertently drive higher energy consumption rather than curb emissions. The findings of this study align with and extend a growing body of literature on the effectiveness of environmental spending and the challenges associated with scaling up such investments. The identification of a 0.01% GDP threshold for environmental spending is consistent with studies that highlight the non-linear relationship between environmental investment and outcomes. For instance, research found that environmental policies often exhibit diminishing returns beyond a certain point due to saturation effects, where the most cost-effective measures are implemented first, leaving less efficient options for later [
94]. Peres et al. (2018) argue that weak institutional capacity and corruption often lead to inefficient allocation of environmental funds, particularly in developing countries [
95]. This highlights the need for institutional reforms to improve transparency, accountability, and the targeting of resources. Energy efficiency subsidies can lead to increased energy use (the “rebound effect”) as lower costs encourage higher consumption [
96]. This suggests that policymakers must design subsidies carefully, incorporating mechanisms to mitigate unintended consequences, such as caps on usage or tiered pricing structures.
The literature provides empirical evidence of the nonlinear effects of environmental policies. Shu et al. (2018) highlighted that energy efficiency improvements can stimulate economic activity, sometimes offsetting emission reductions due to rebound effects [
97]. Similarly, Xiong and Wang (2020) demonstrated that environmental regulations exhibit an inverted U-shaped effect on industrial pollution, indicating that after a certain point, additional regulations may become less effective [
98].
Moreover, Batool et al. (2022) find that ICT development asymmetrically affects sectoral energy consumption, suggesting that policy impacts vary by economic sector [
99]. This reinforces the argument that blanket increases in environmental spending may not yield proportionate benefits and that targeted efficiency-focused policies are essential.
In addition, our findings align with the literature on subsidy-related rebound effects, where increased financial support may incentivize energy overuse rather than emission reduction [
95,
96].
In conclusion, while environmental spending plays a critical role in emissions reduction, policymakers must optimize allocation strategies rather than focus solely on increasing budgets. A balanced approach that integrates efficiency metrics and adaptive policy frameworks is crucial for ensuring sustainable environmental and economic outcomes [
93,
100].
The Spatial Durbin Model (SDM) demonstrates that national policy measures have cross-border implications. The positive spillover effect of renewable investments suggests that while green energy transitions are beneficial at the national level, they may relocate emissions rather than eliminate them, possibly because of industrial migration or supply chain dependencies. This underscores the need for coordinated regional policies to prevent carbon leakage and enhance collective sustainability.
The literature confirms that spatial spillover effects play a crucial role in environmental and economic policy. Zhong et al. (2022) highlighted that digital economy development has a significant spatial spillover effect on carbon emission intensity, reinforcing the idea that technological advancements influence emissions beyond national borders [
101]. Similarly, Pang et al. (2023) demonstrated that energy intensity reduction targets have a positive spillover effect on carbon emissions in adjacent regions, suggesting policy interdependencies across borders [
102].
However, studies have also revealed contradictory spillover effects. Zhang and Xu (2023) find that market-driven environmental regulations exhibit a U-shaped relationship with green technology spillovers, while command-and-control regulations follow an inverted U-shape pattern [
103]. Additionally, Liu et al. (2022) indicate that while renewable energy technology innovation promotes local industrial green transformation, it inhibits development in neighboring regions, creating a “beggar-thy-neighbor” effect [
82]. To mitigate carbon leakage, a regional emissions trading scheme (ETS) could be introduced, aligning national policies and preventing emissions relocation due to industrial migration.
In conclusion, although the specific spillover effect of renewable investments varies across contexts, the literature strongly supports the presence of cross-border interactions in environmental policies. Coordinated regional strategies are crucial for mitigating negative spillovers, enhancing the effectiveness of climate policies, and ensuring that sustainability goals are met equitably across regions.


