
Enhancing Mangrove Aboveground Biomass Estimation with UAV-LiDAR: A Novel Mutual Information-Based Feature Selection Approach

Abstract
1. Introduction
2. Materials and Methods
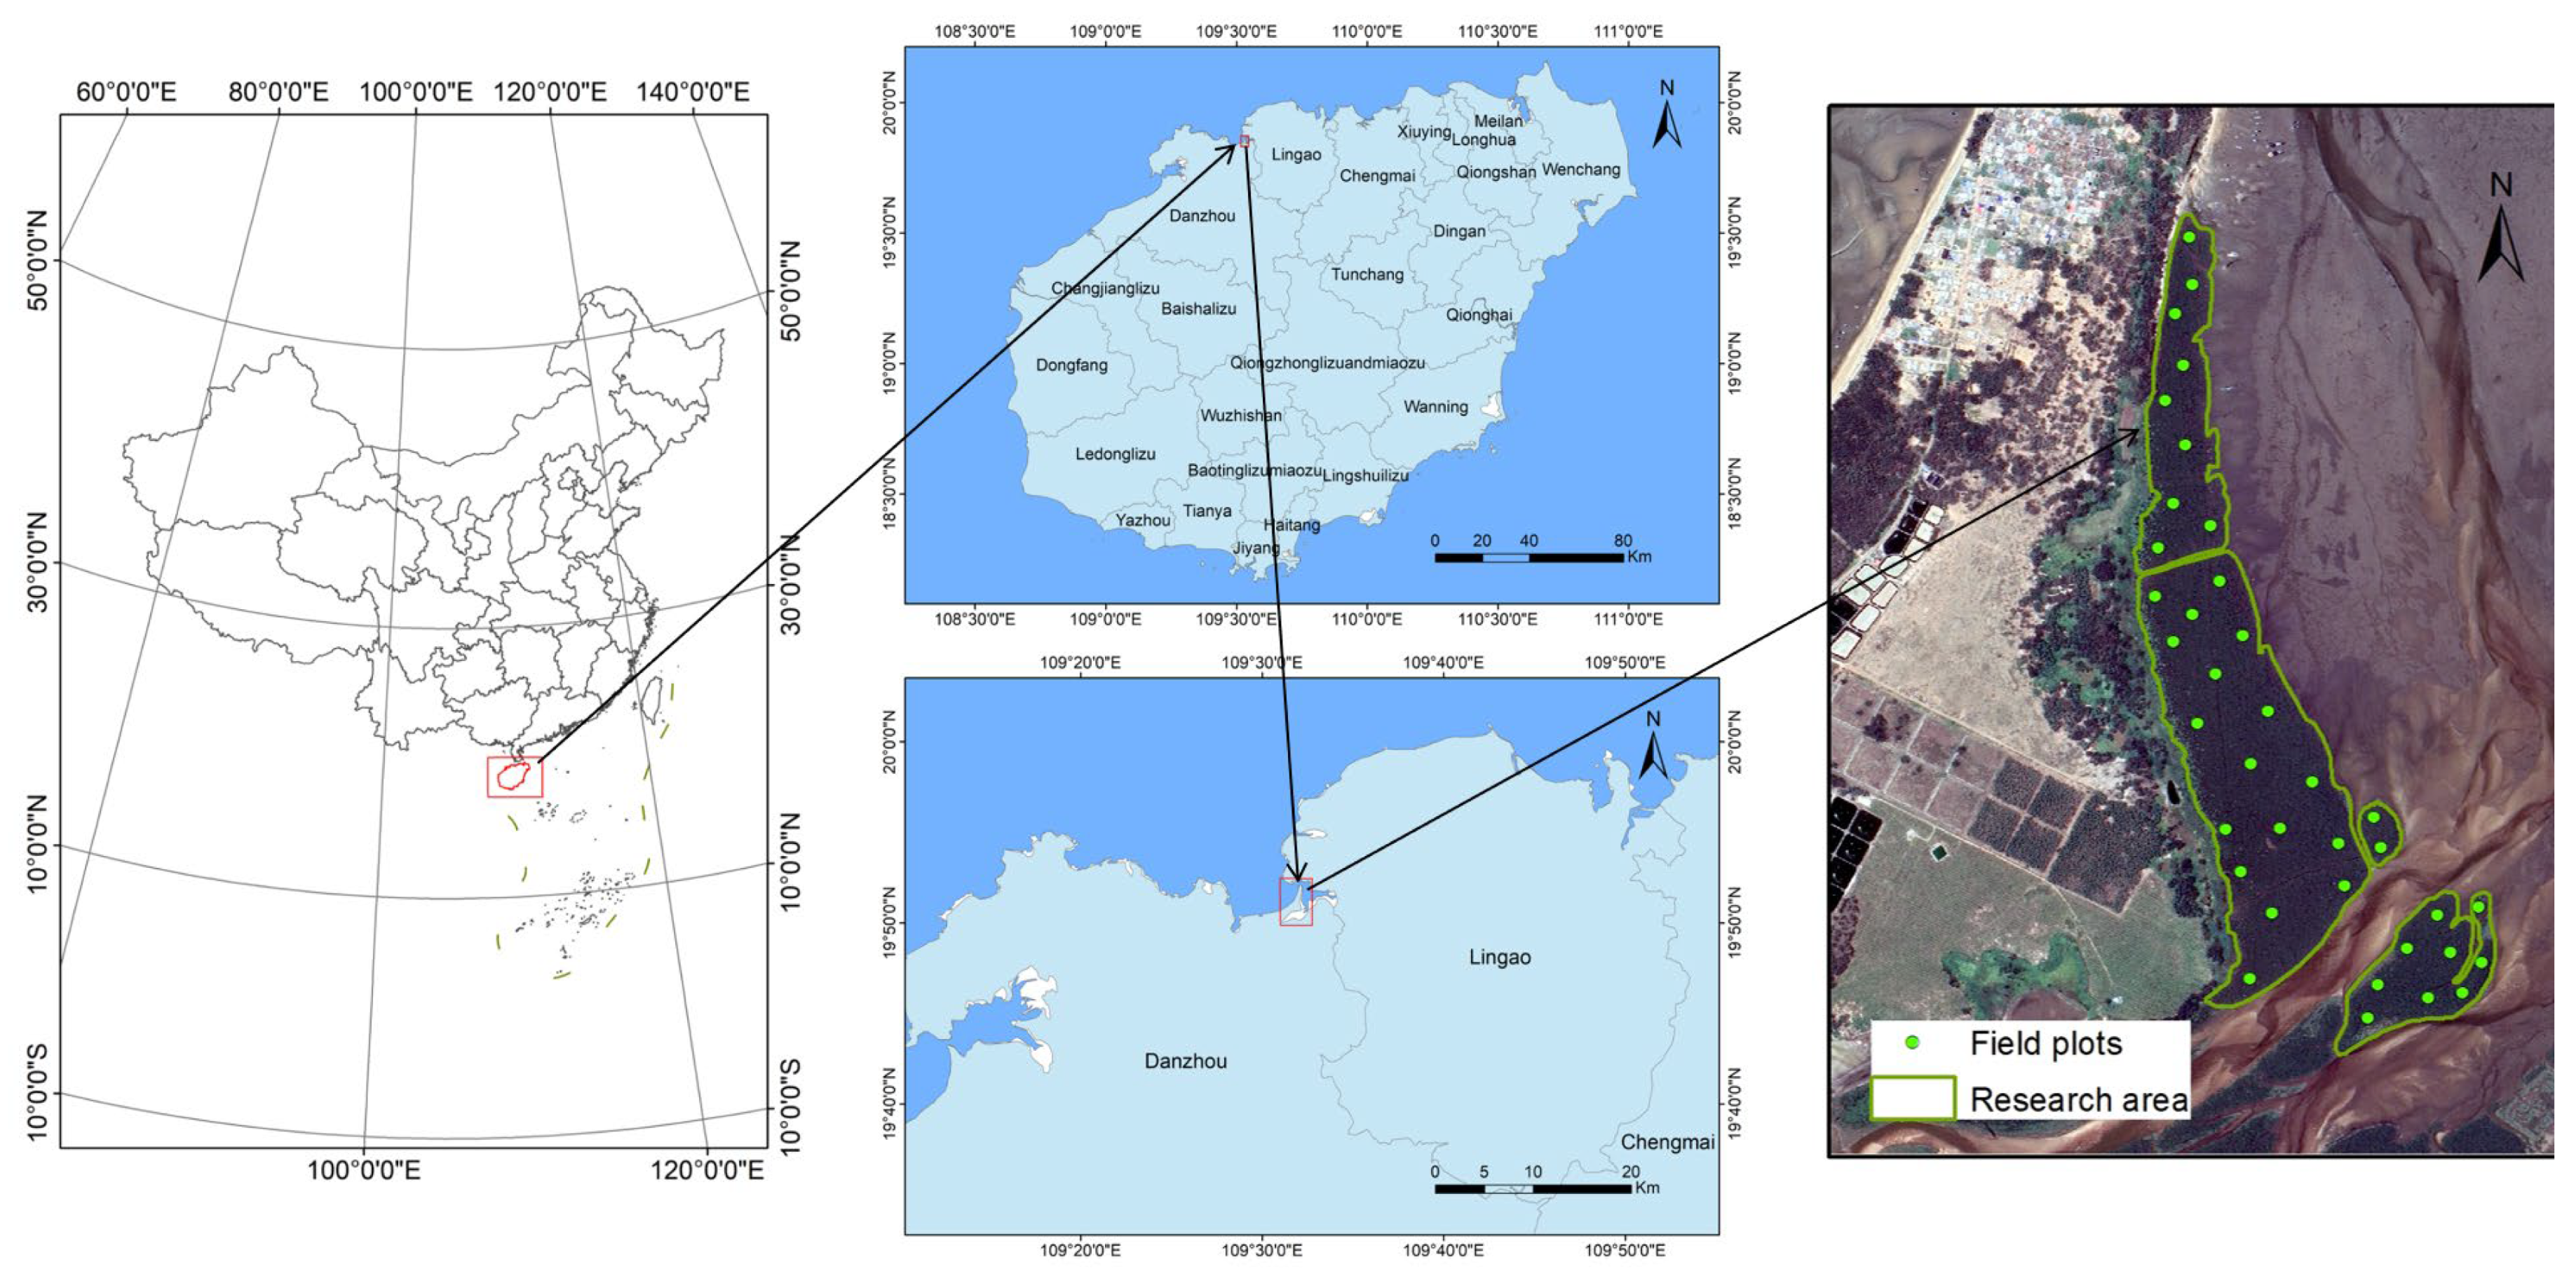
2.1. Study Area
2.2. Data Acquisition and Processing
2.2.1. Field Data Acquisition and Processing
2.2.2. UAV-LiDAR Data Acquisition and Processing
2.3. Research Methodology
2.3.1. Technical Routes
2.3.2. Variable Selection Methods
- Zero-Importance Feature Selection
- 2.
- Zero-Importance Feature Selection Based on Mutual Information
2.3.3. Machine Learning Algorithms
- Random Forest Algorithm
- 2.
- Extreme Gradient Boosting Algorithm
- 3.
- Support Vector Machine Algorithm
2.3.4. Model Accuracy Assessment
3. Results
3.1. Mangrove Identification Result
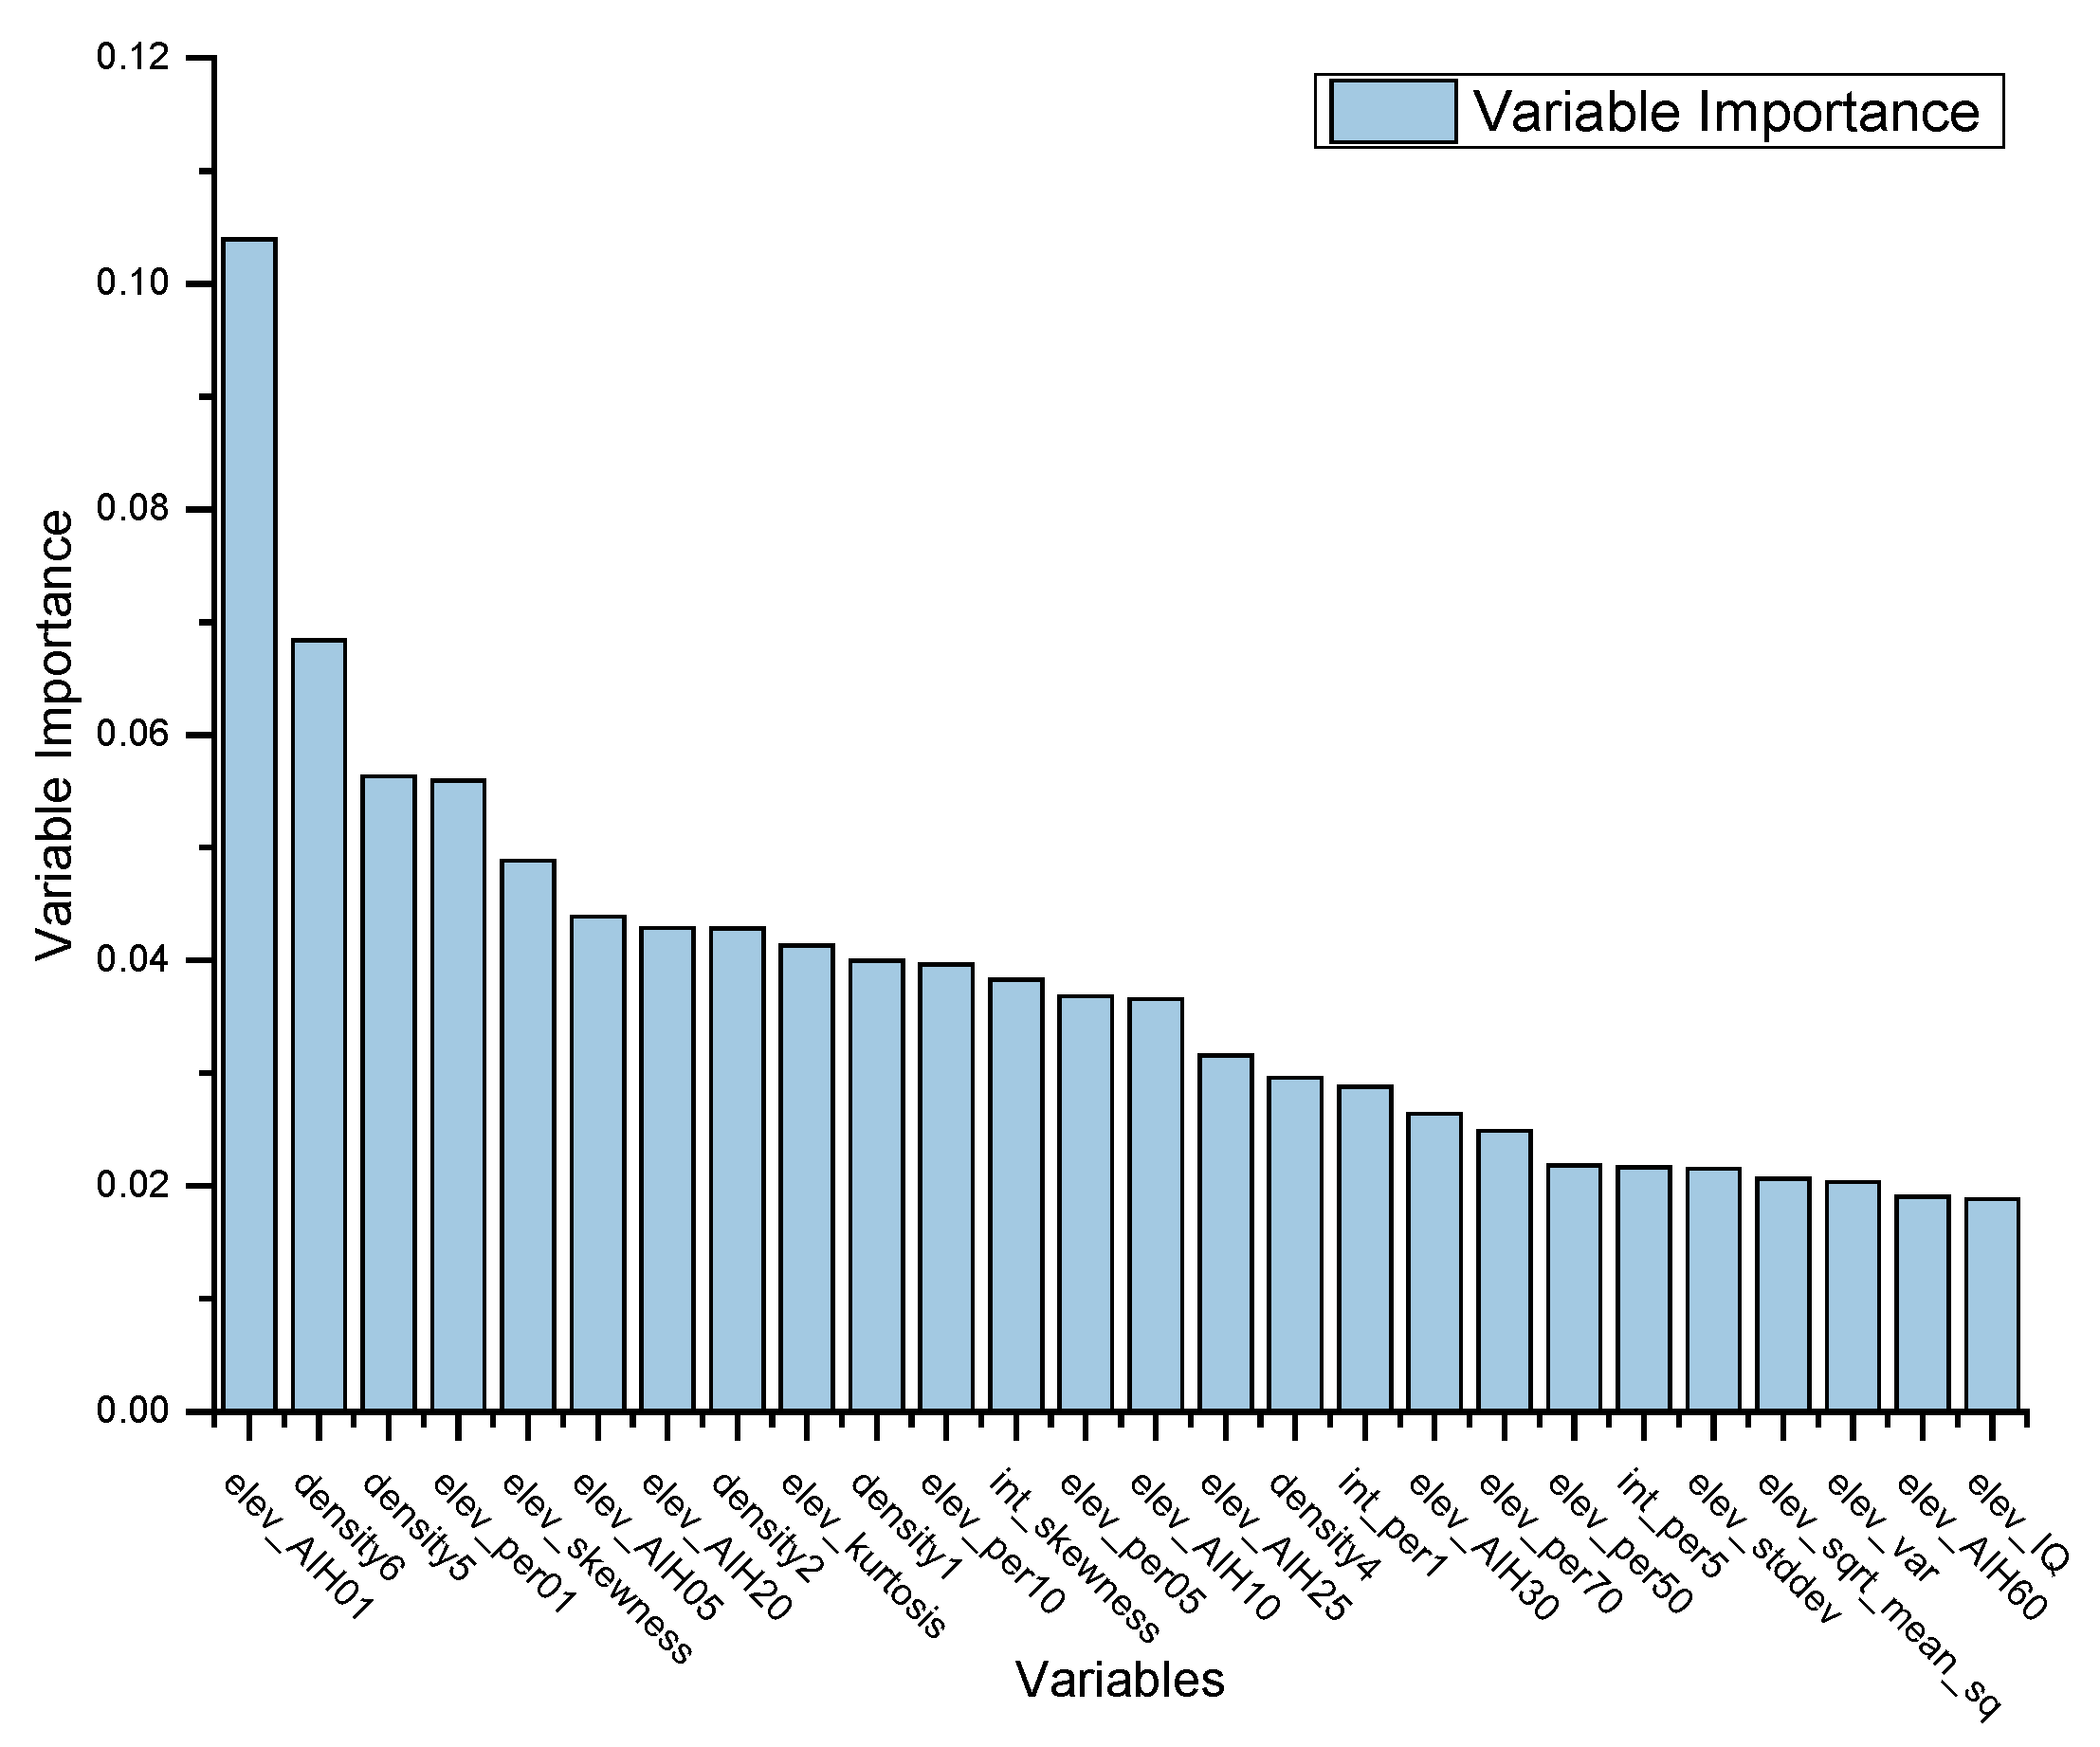
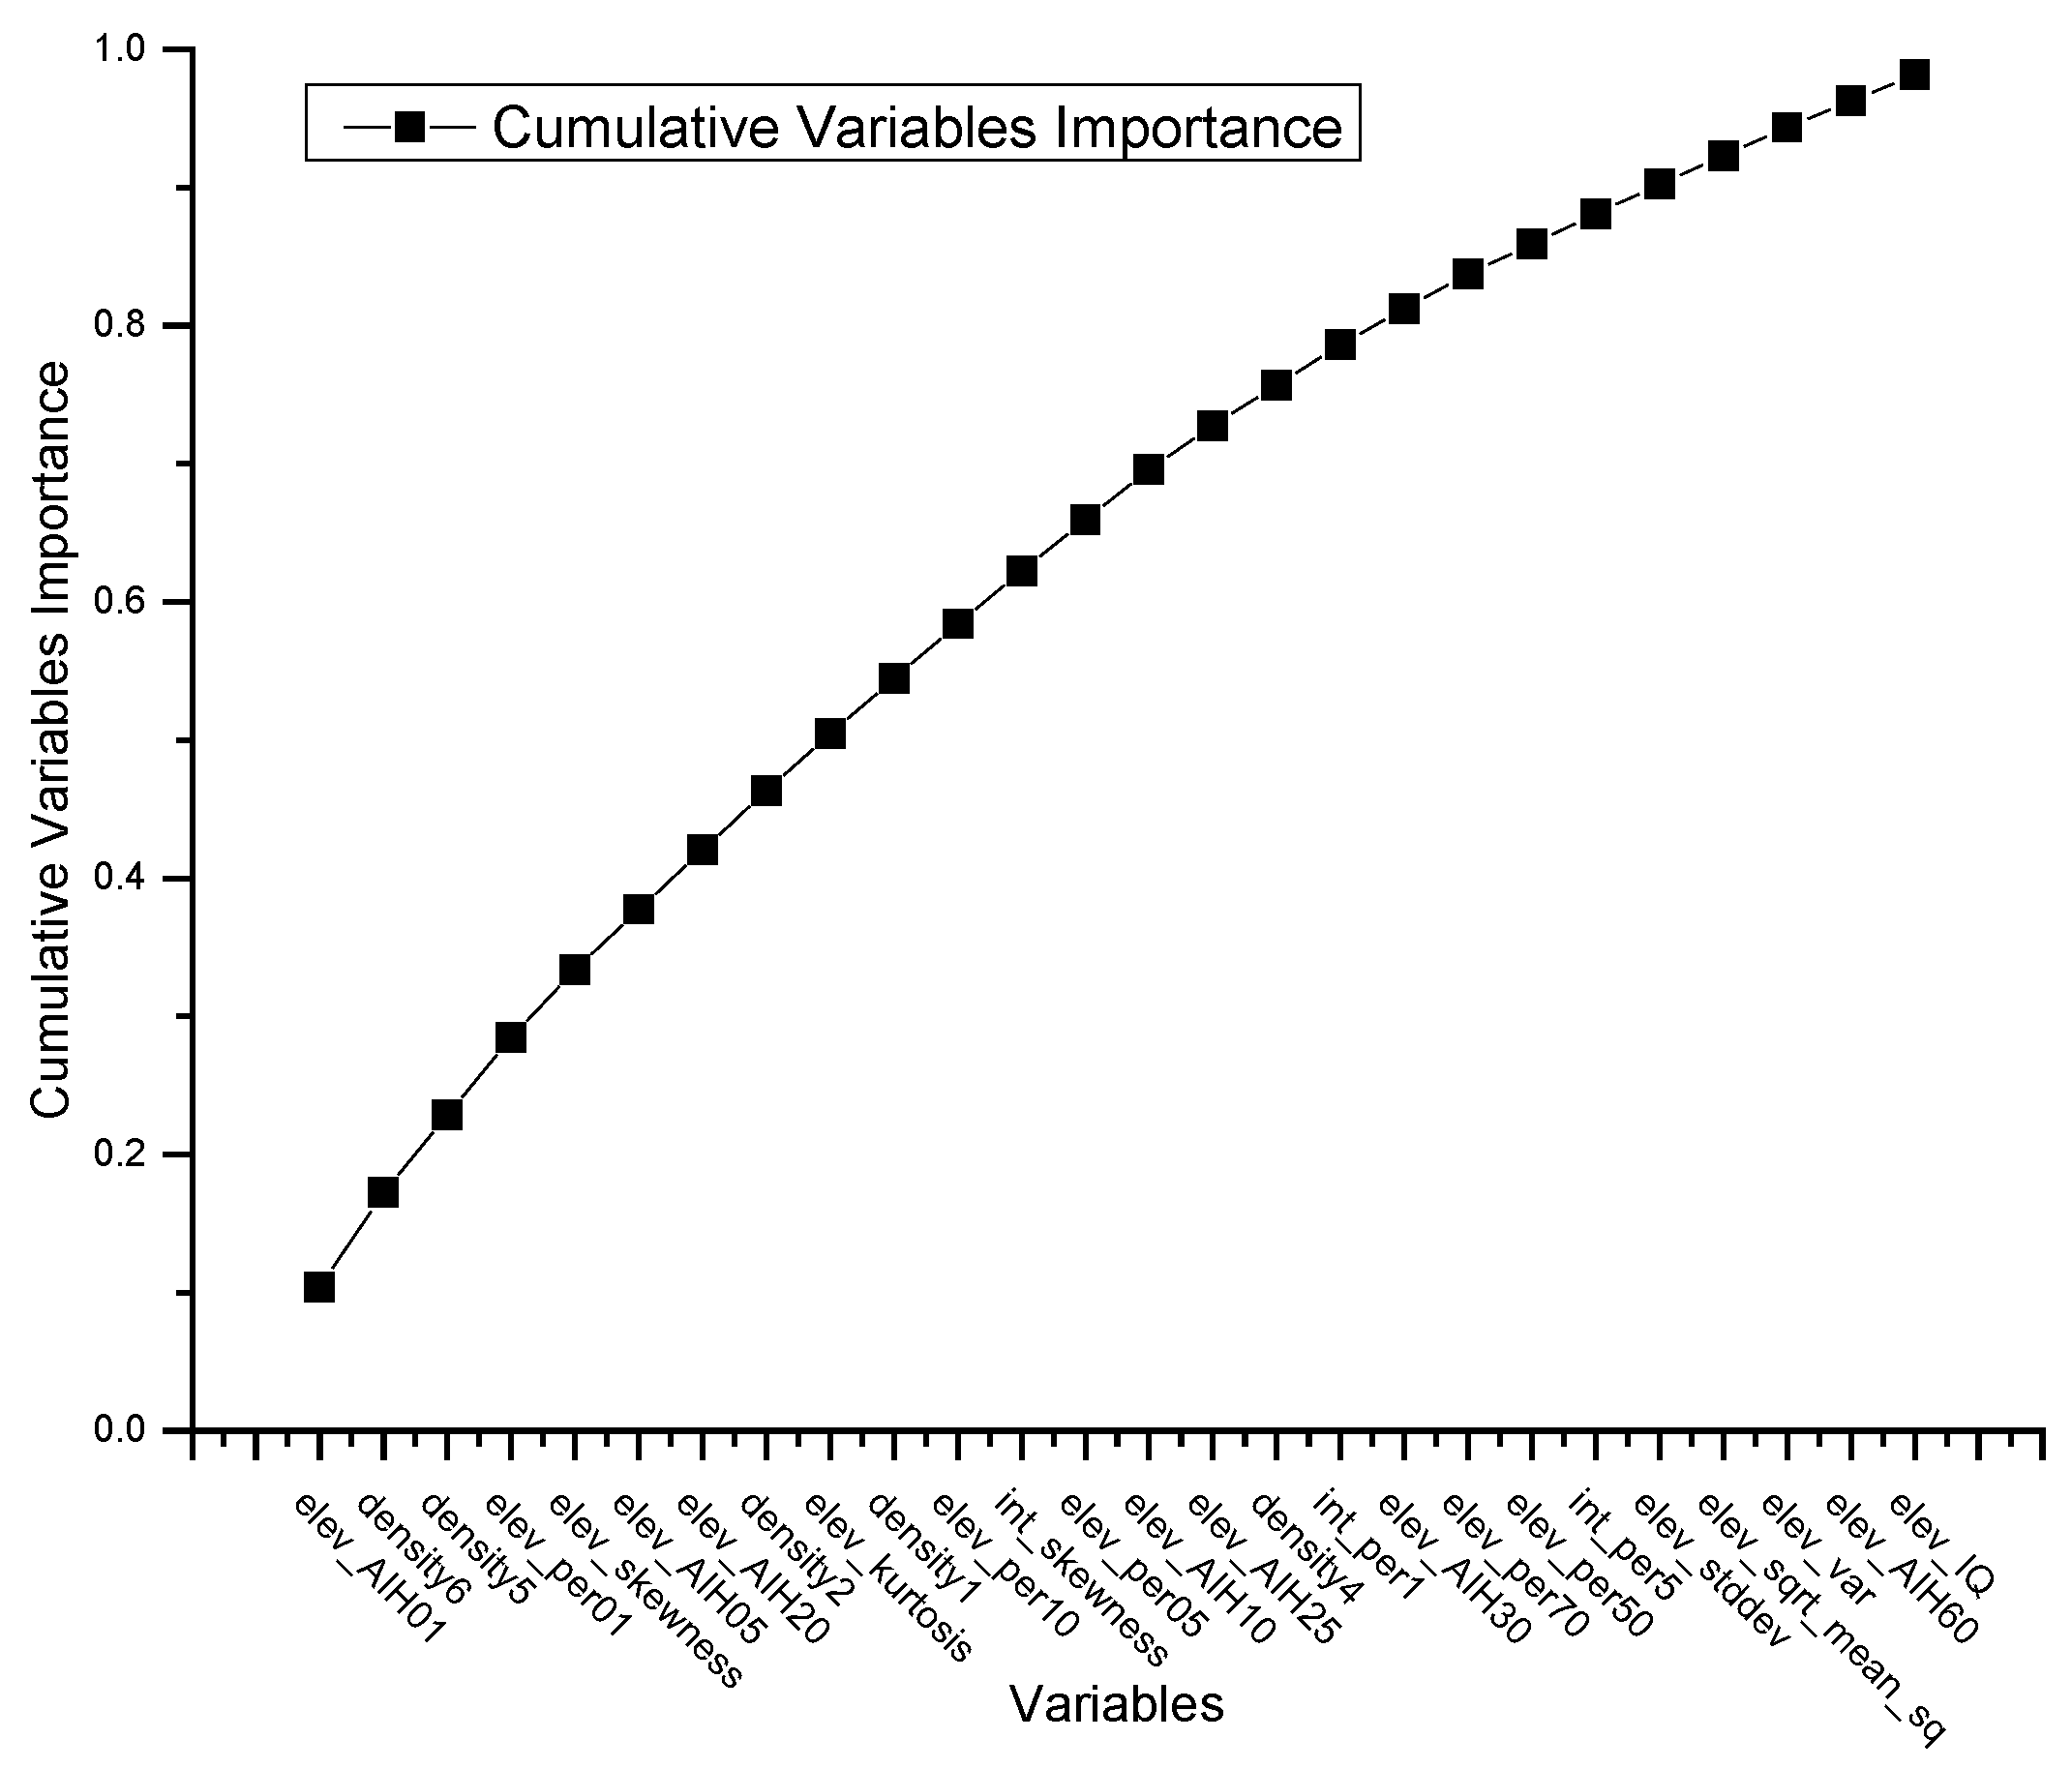
3.2. Assessment of the Importance of Variables
- Zero-Importance Feature Selection
- 2.
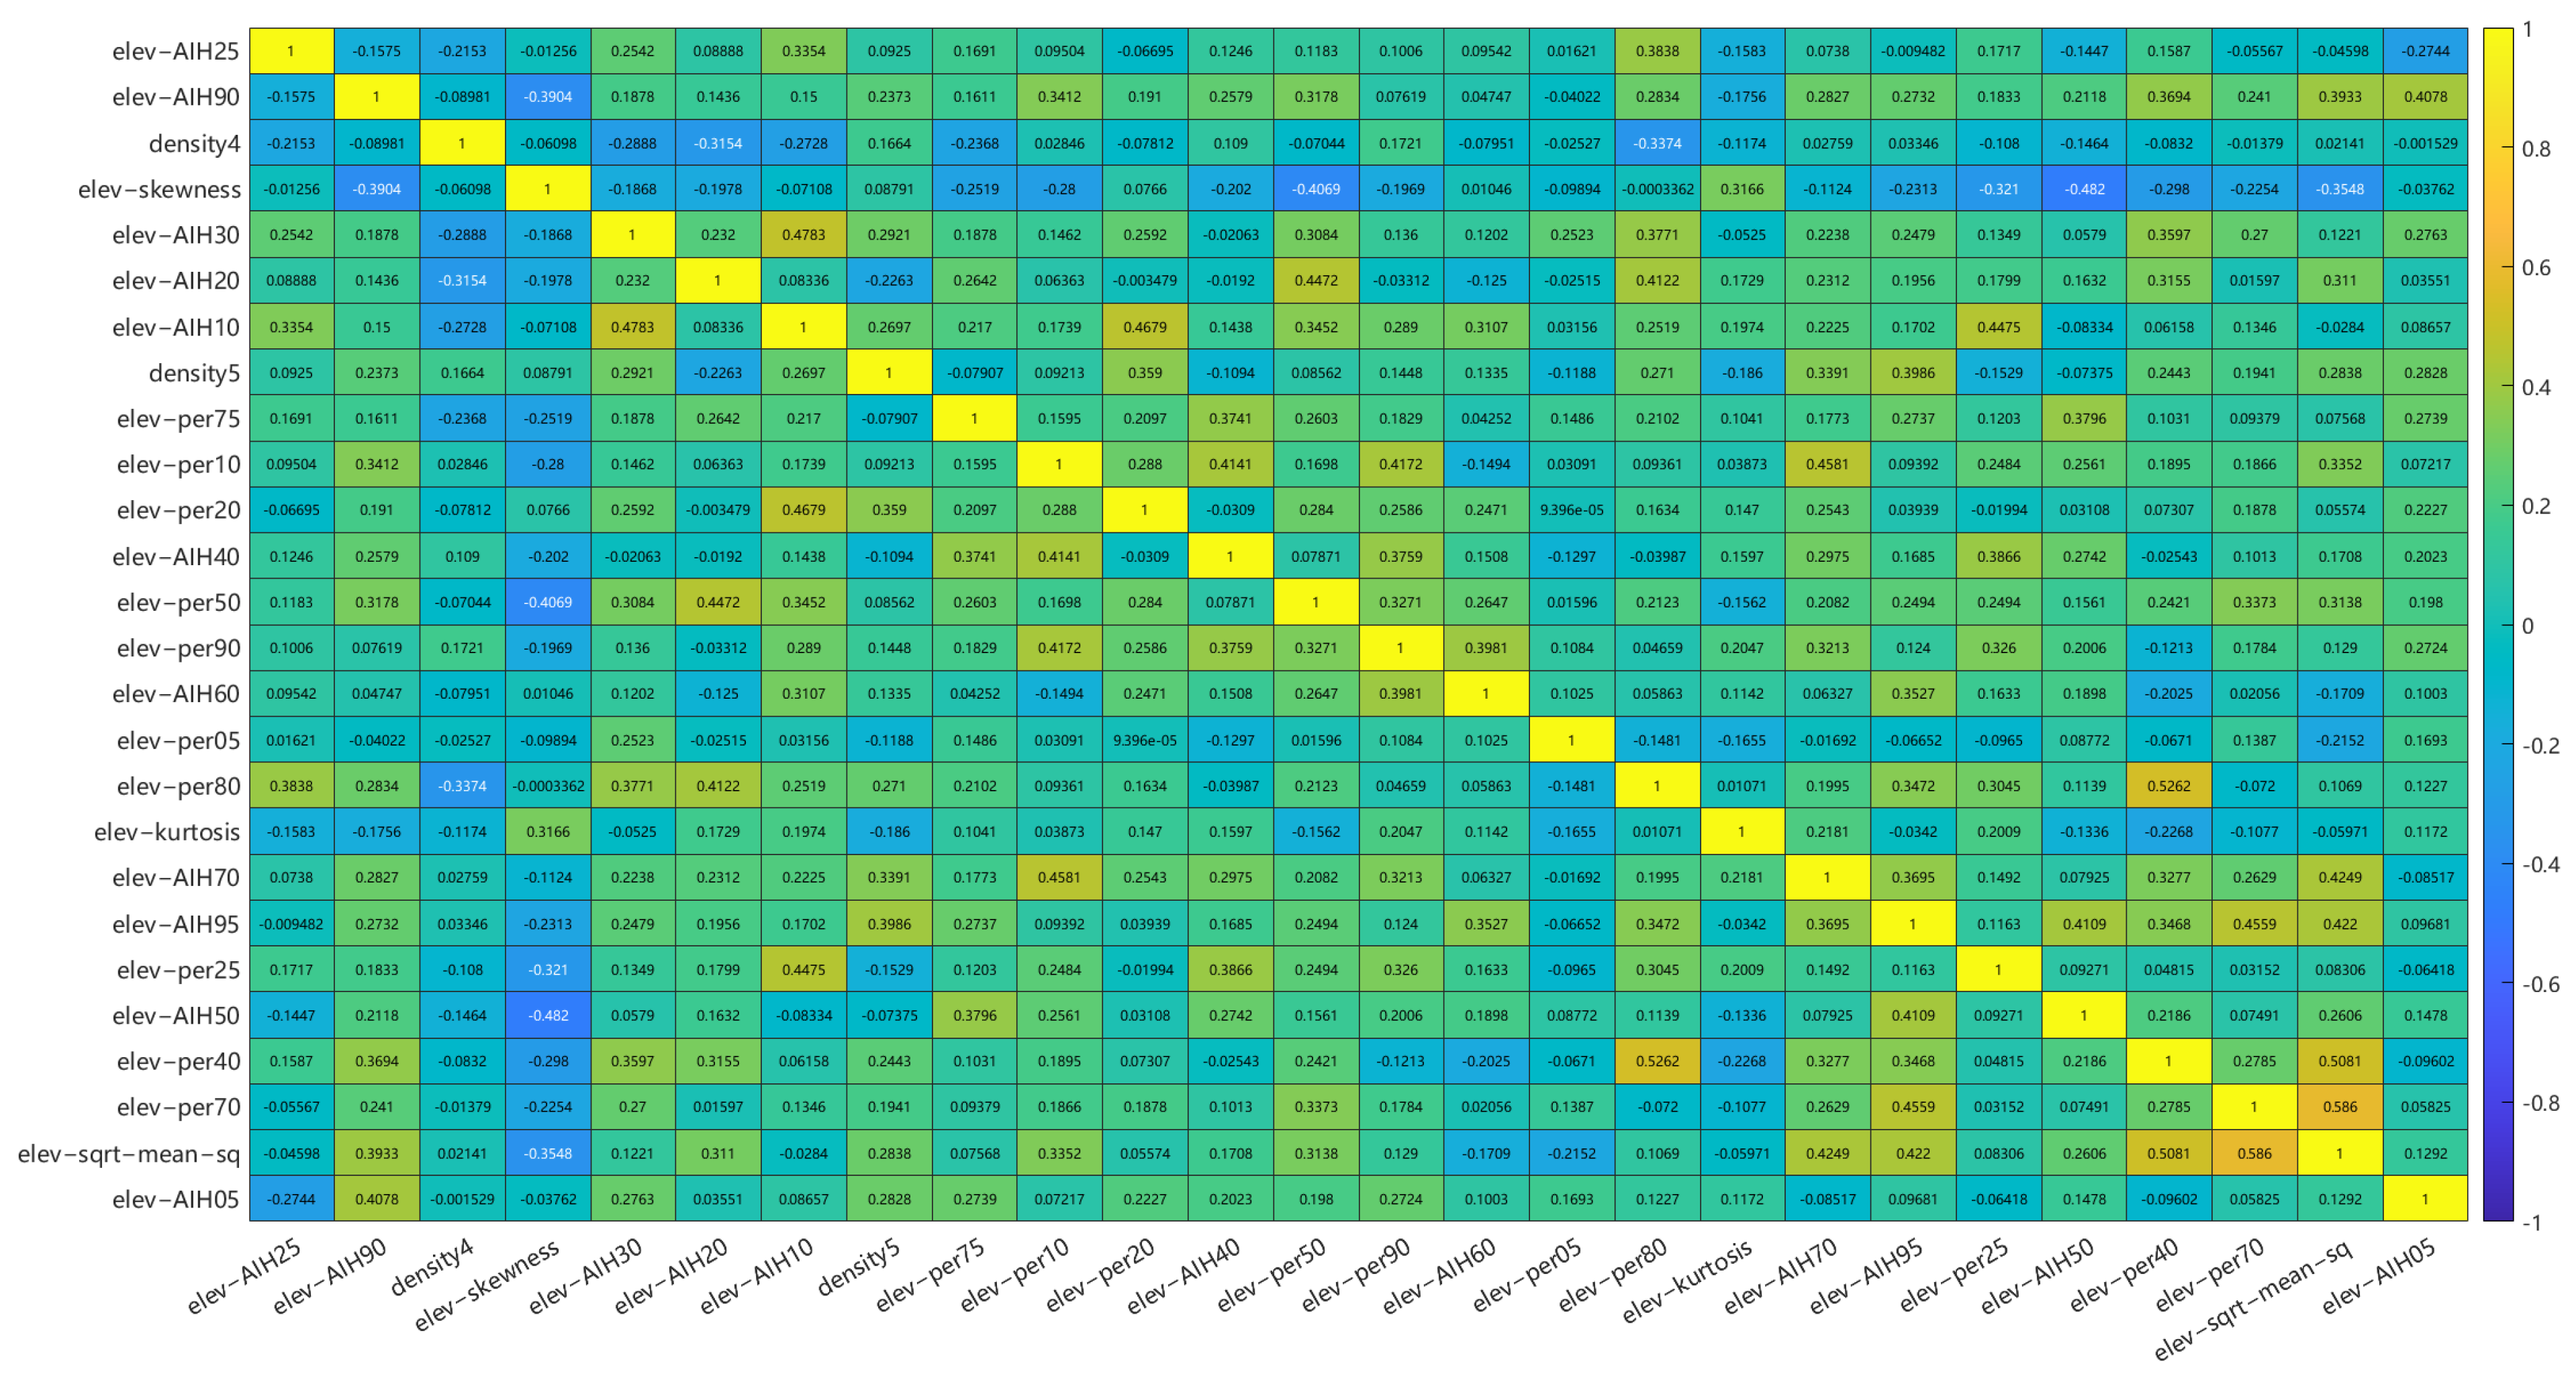
- Zero-Importance Feature Selection Based on Mutual Information
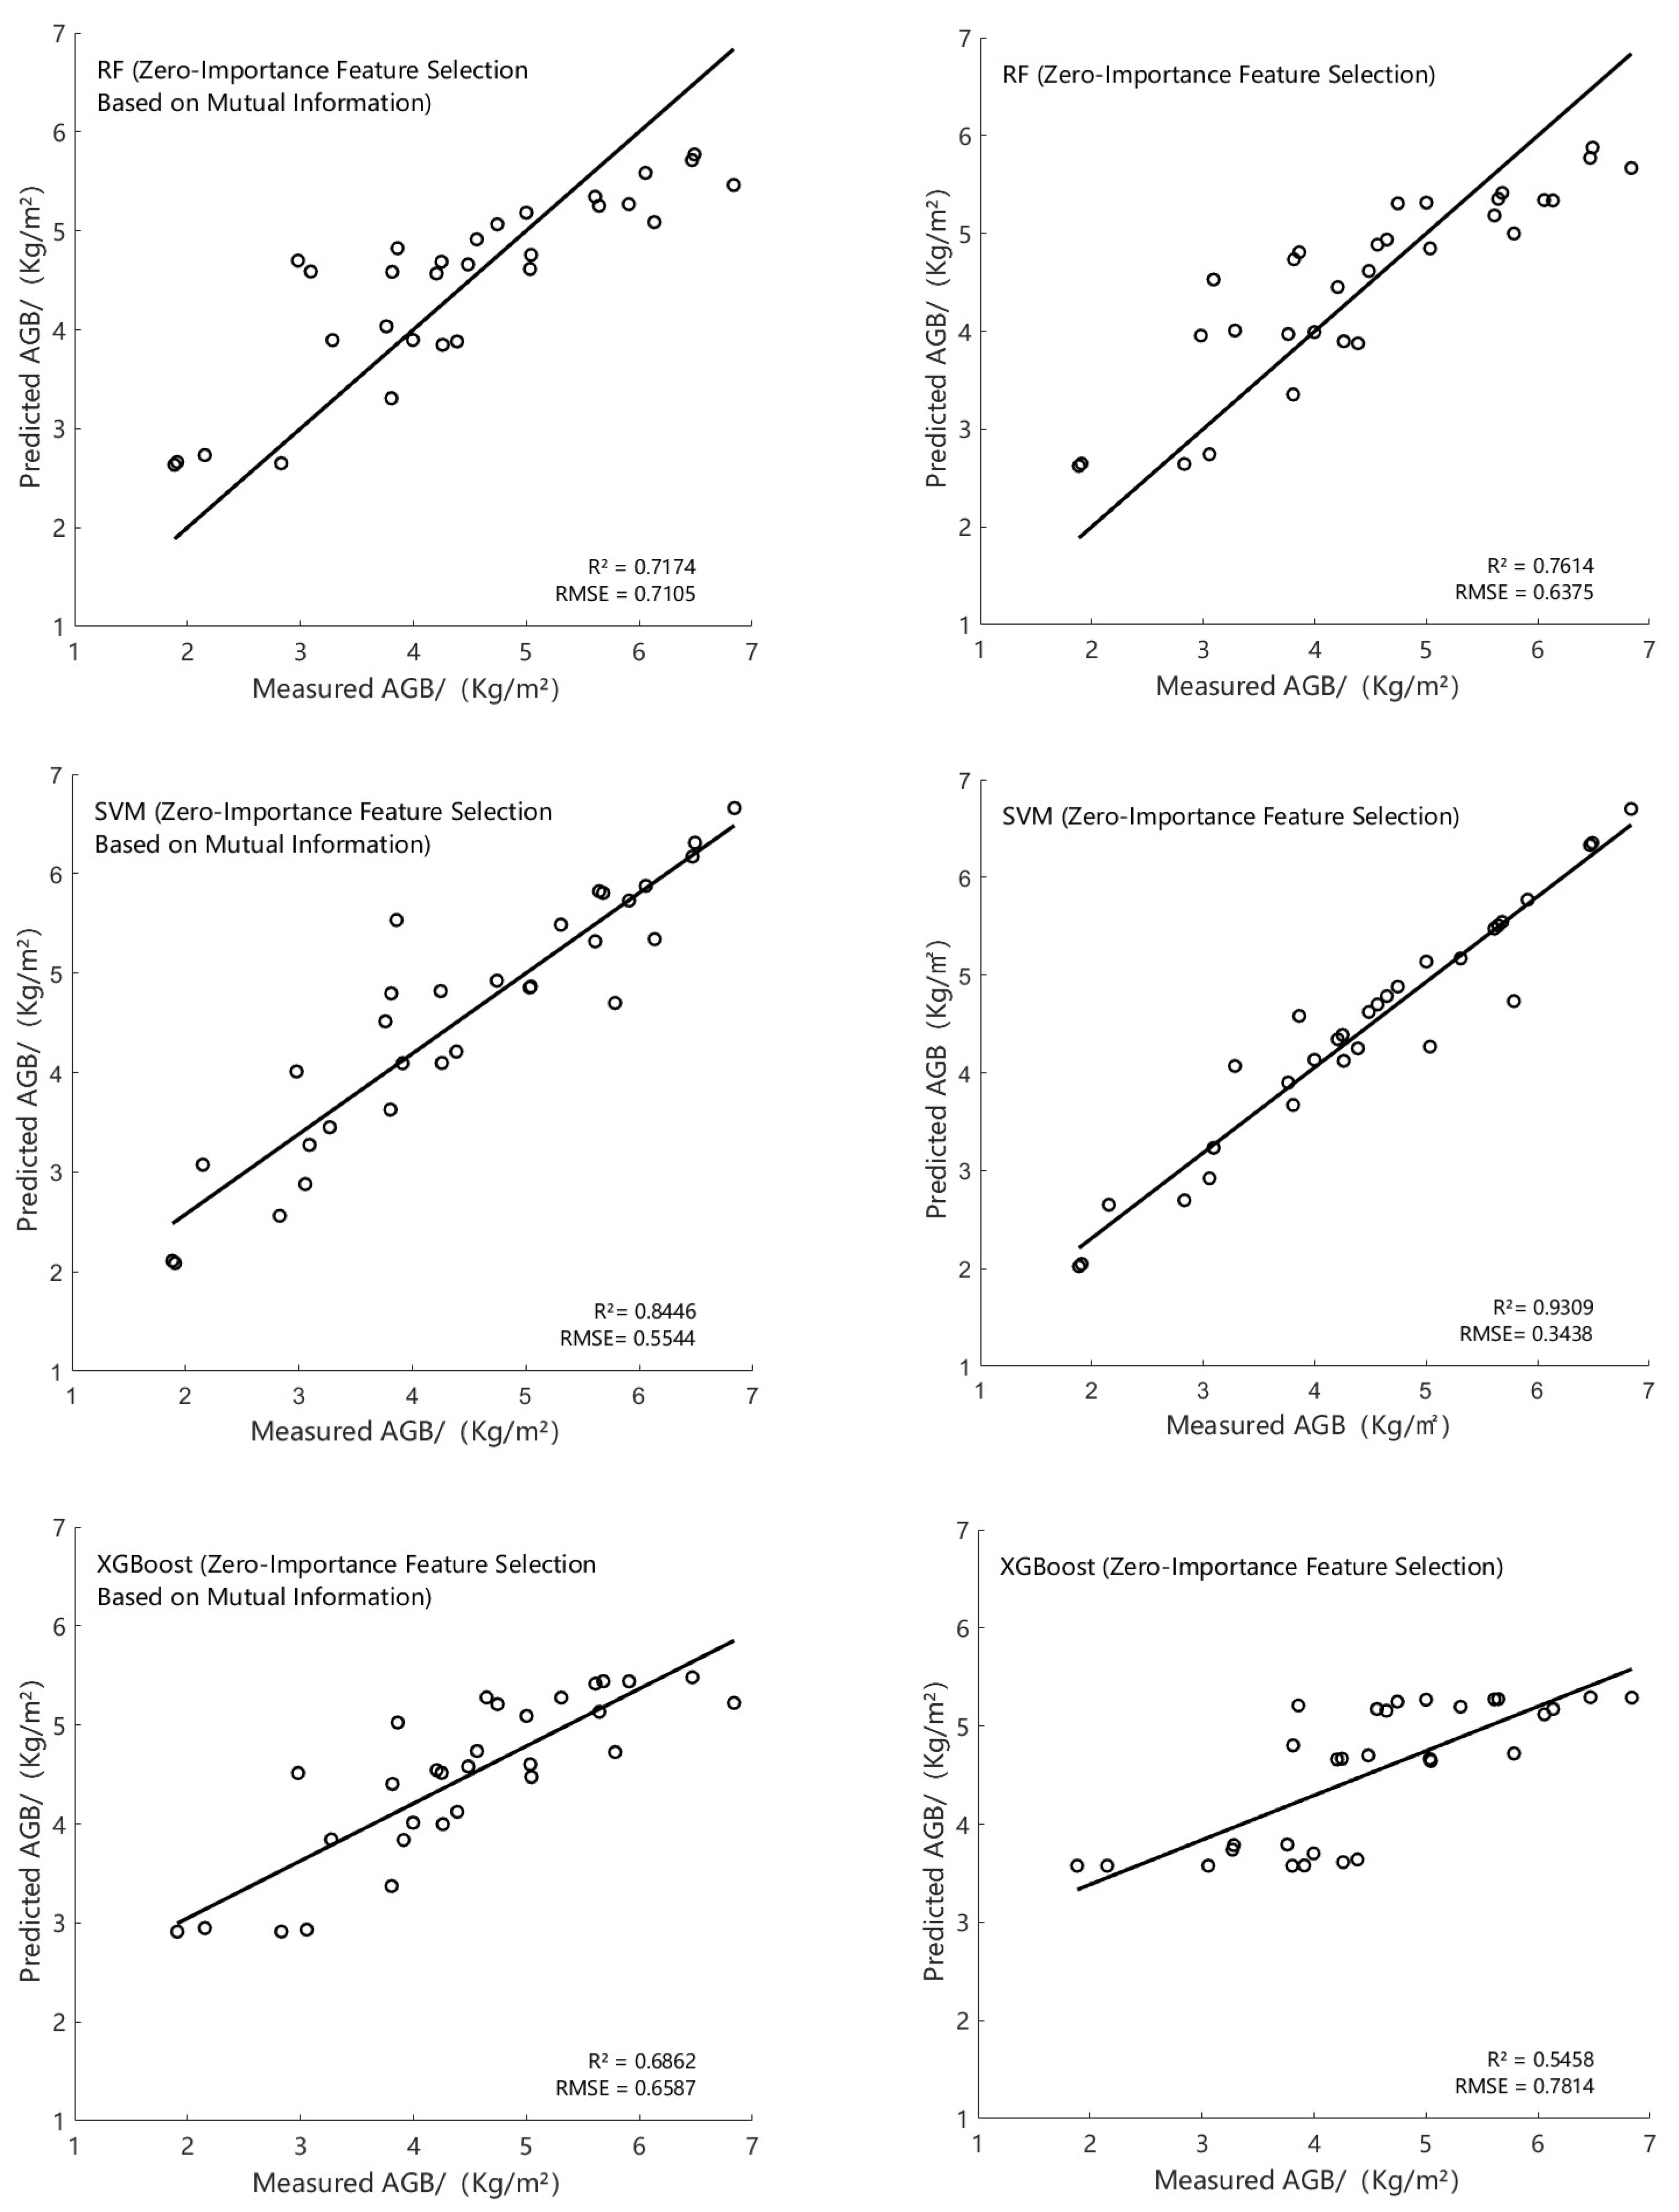
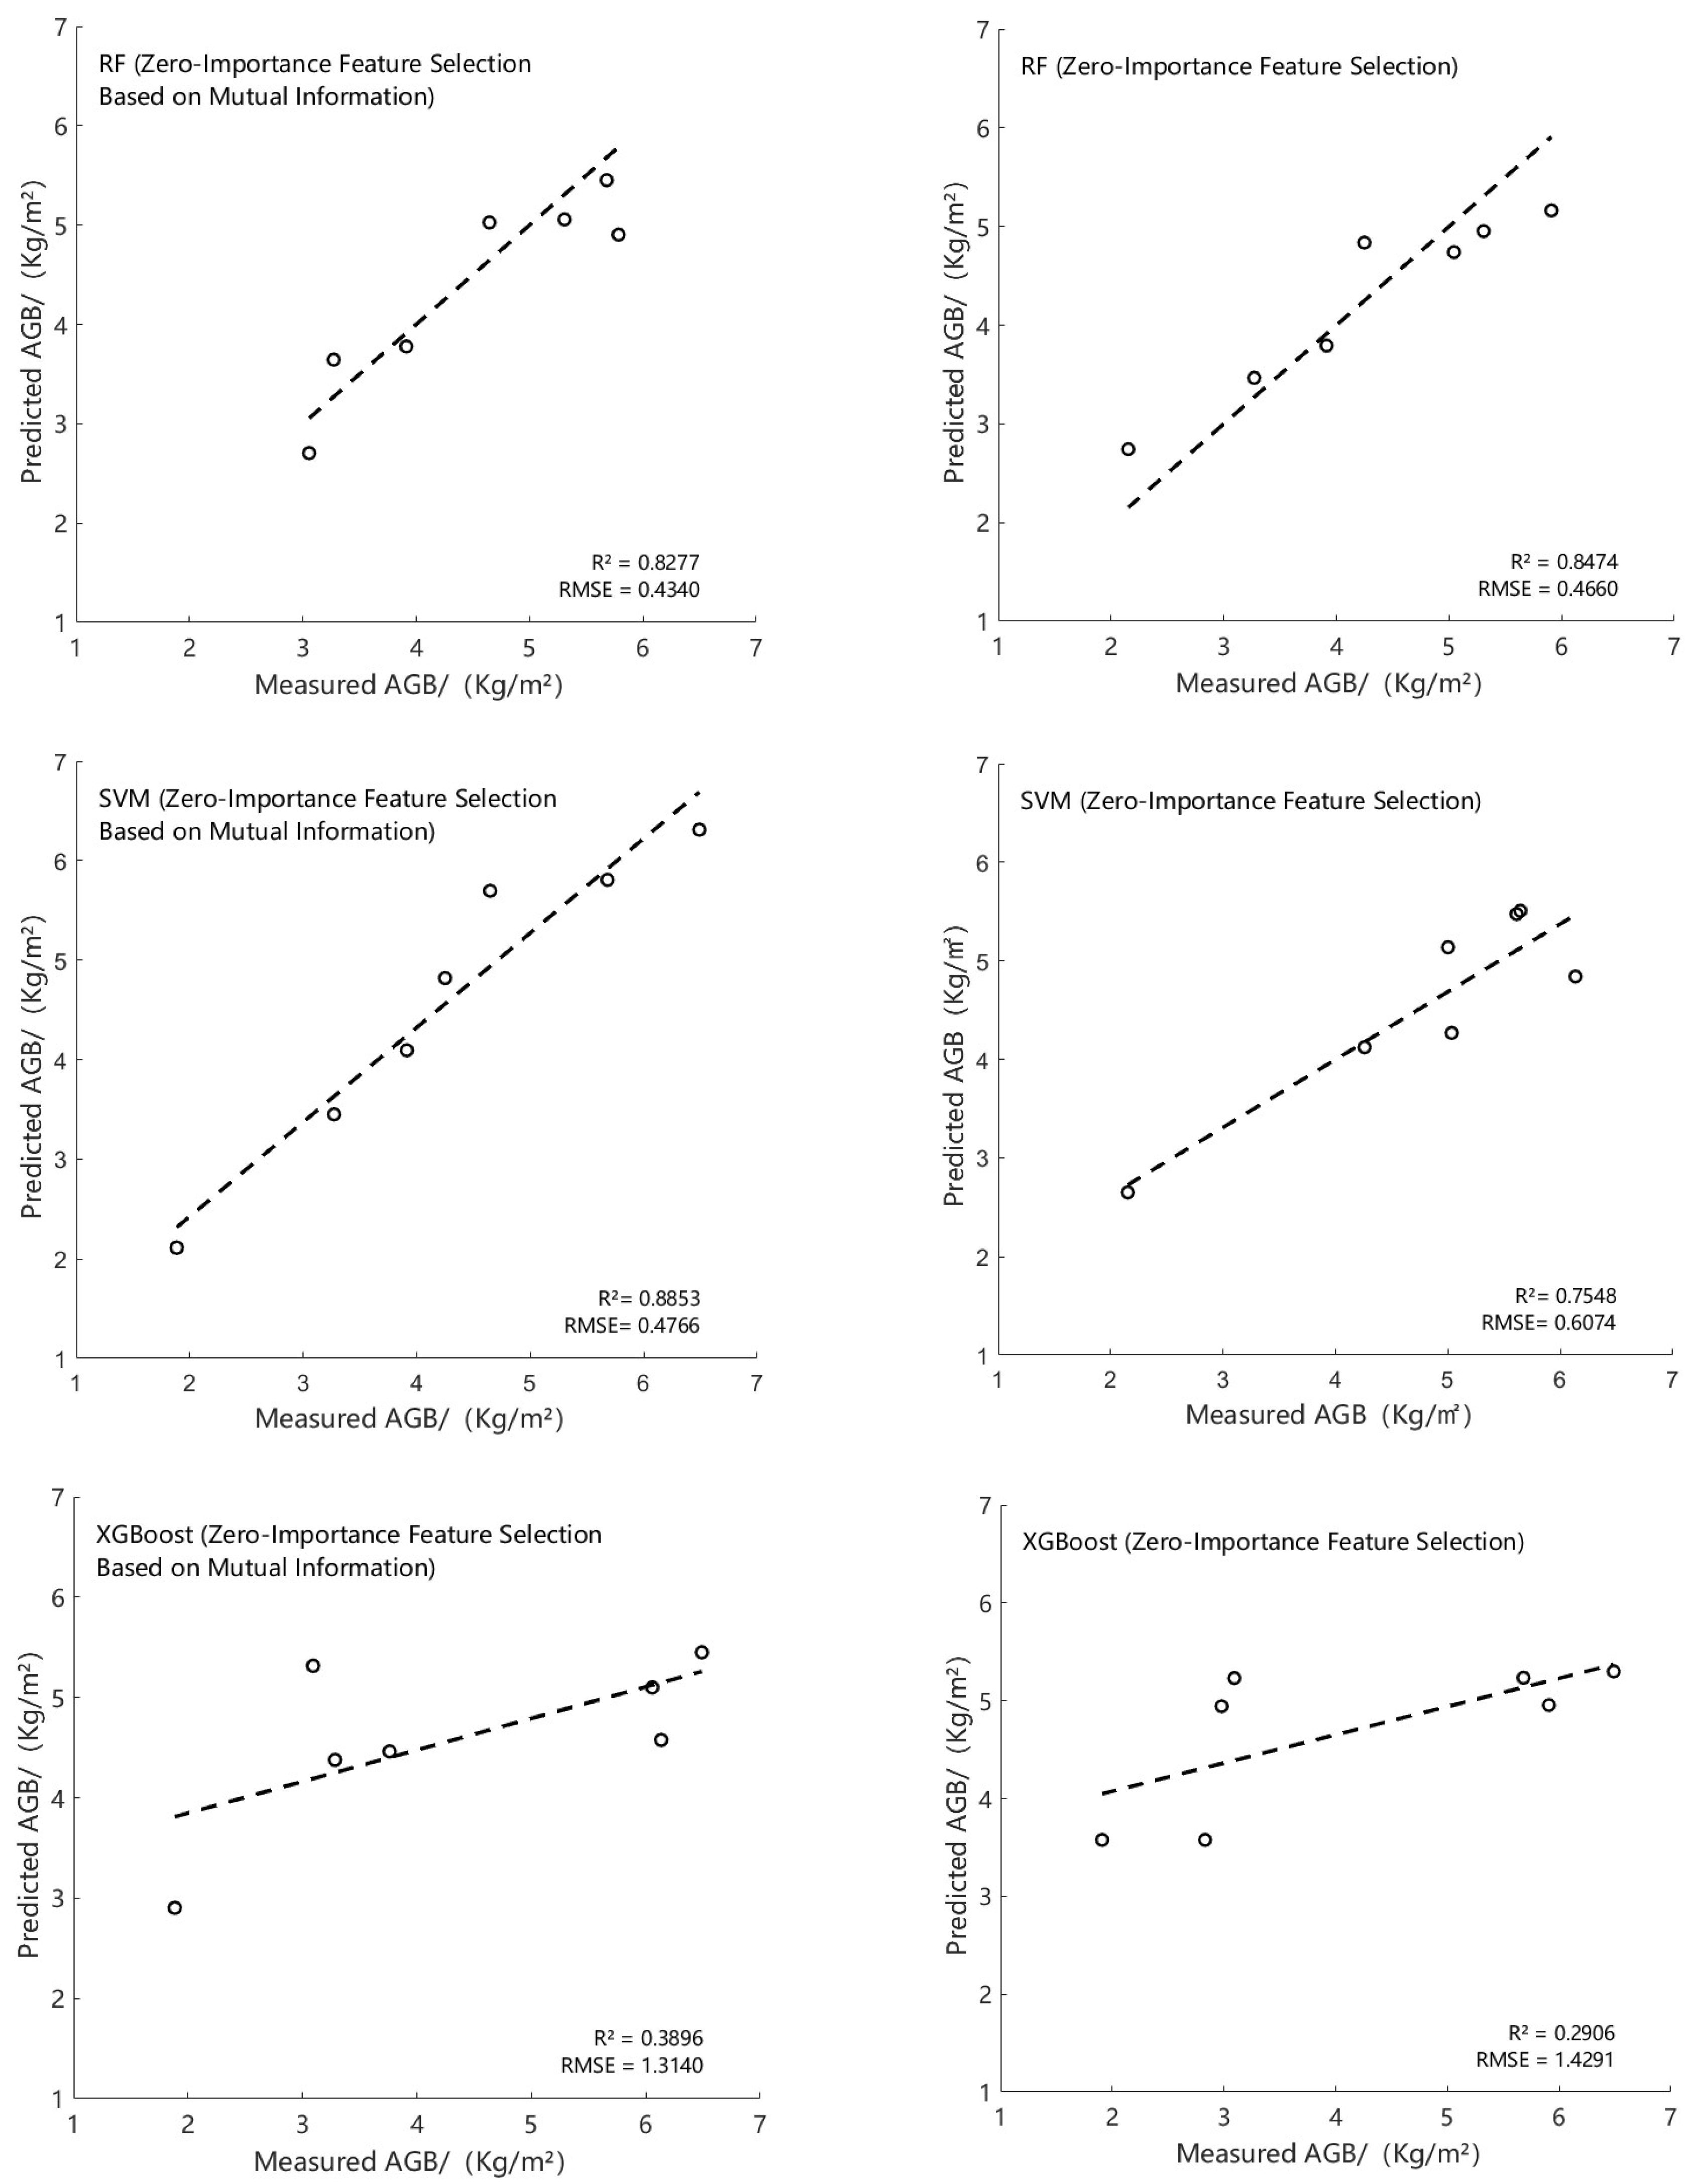
3.3. Modeling Accuracy Evaluation and Comparison
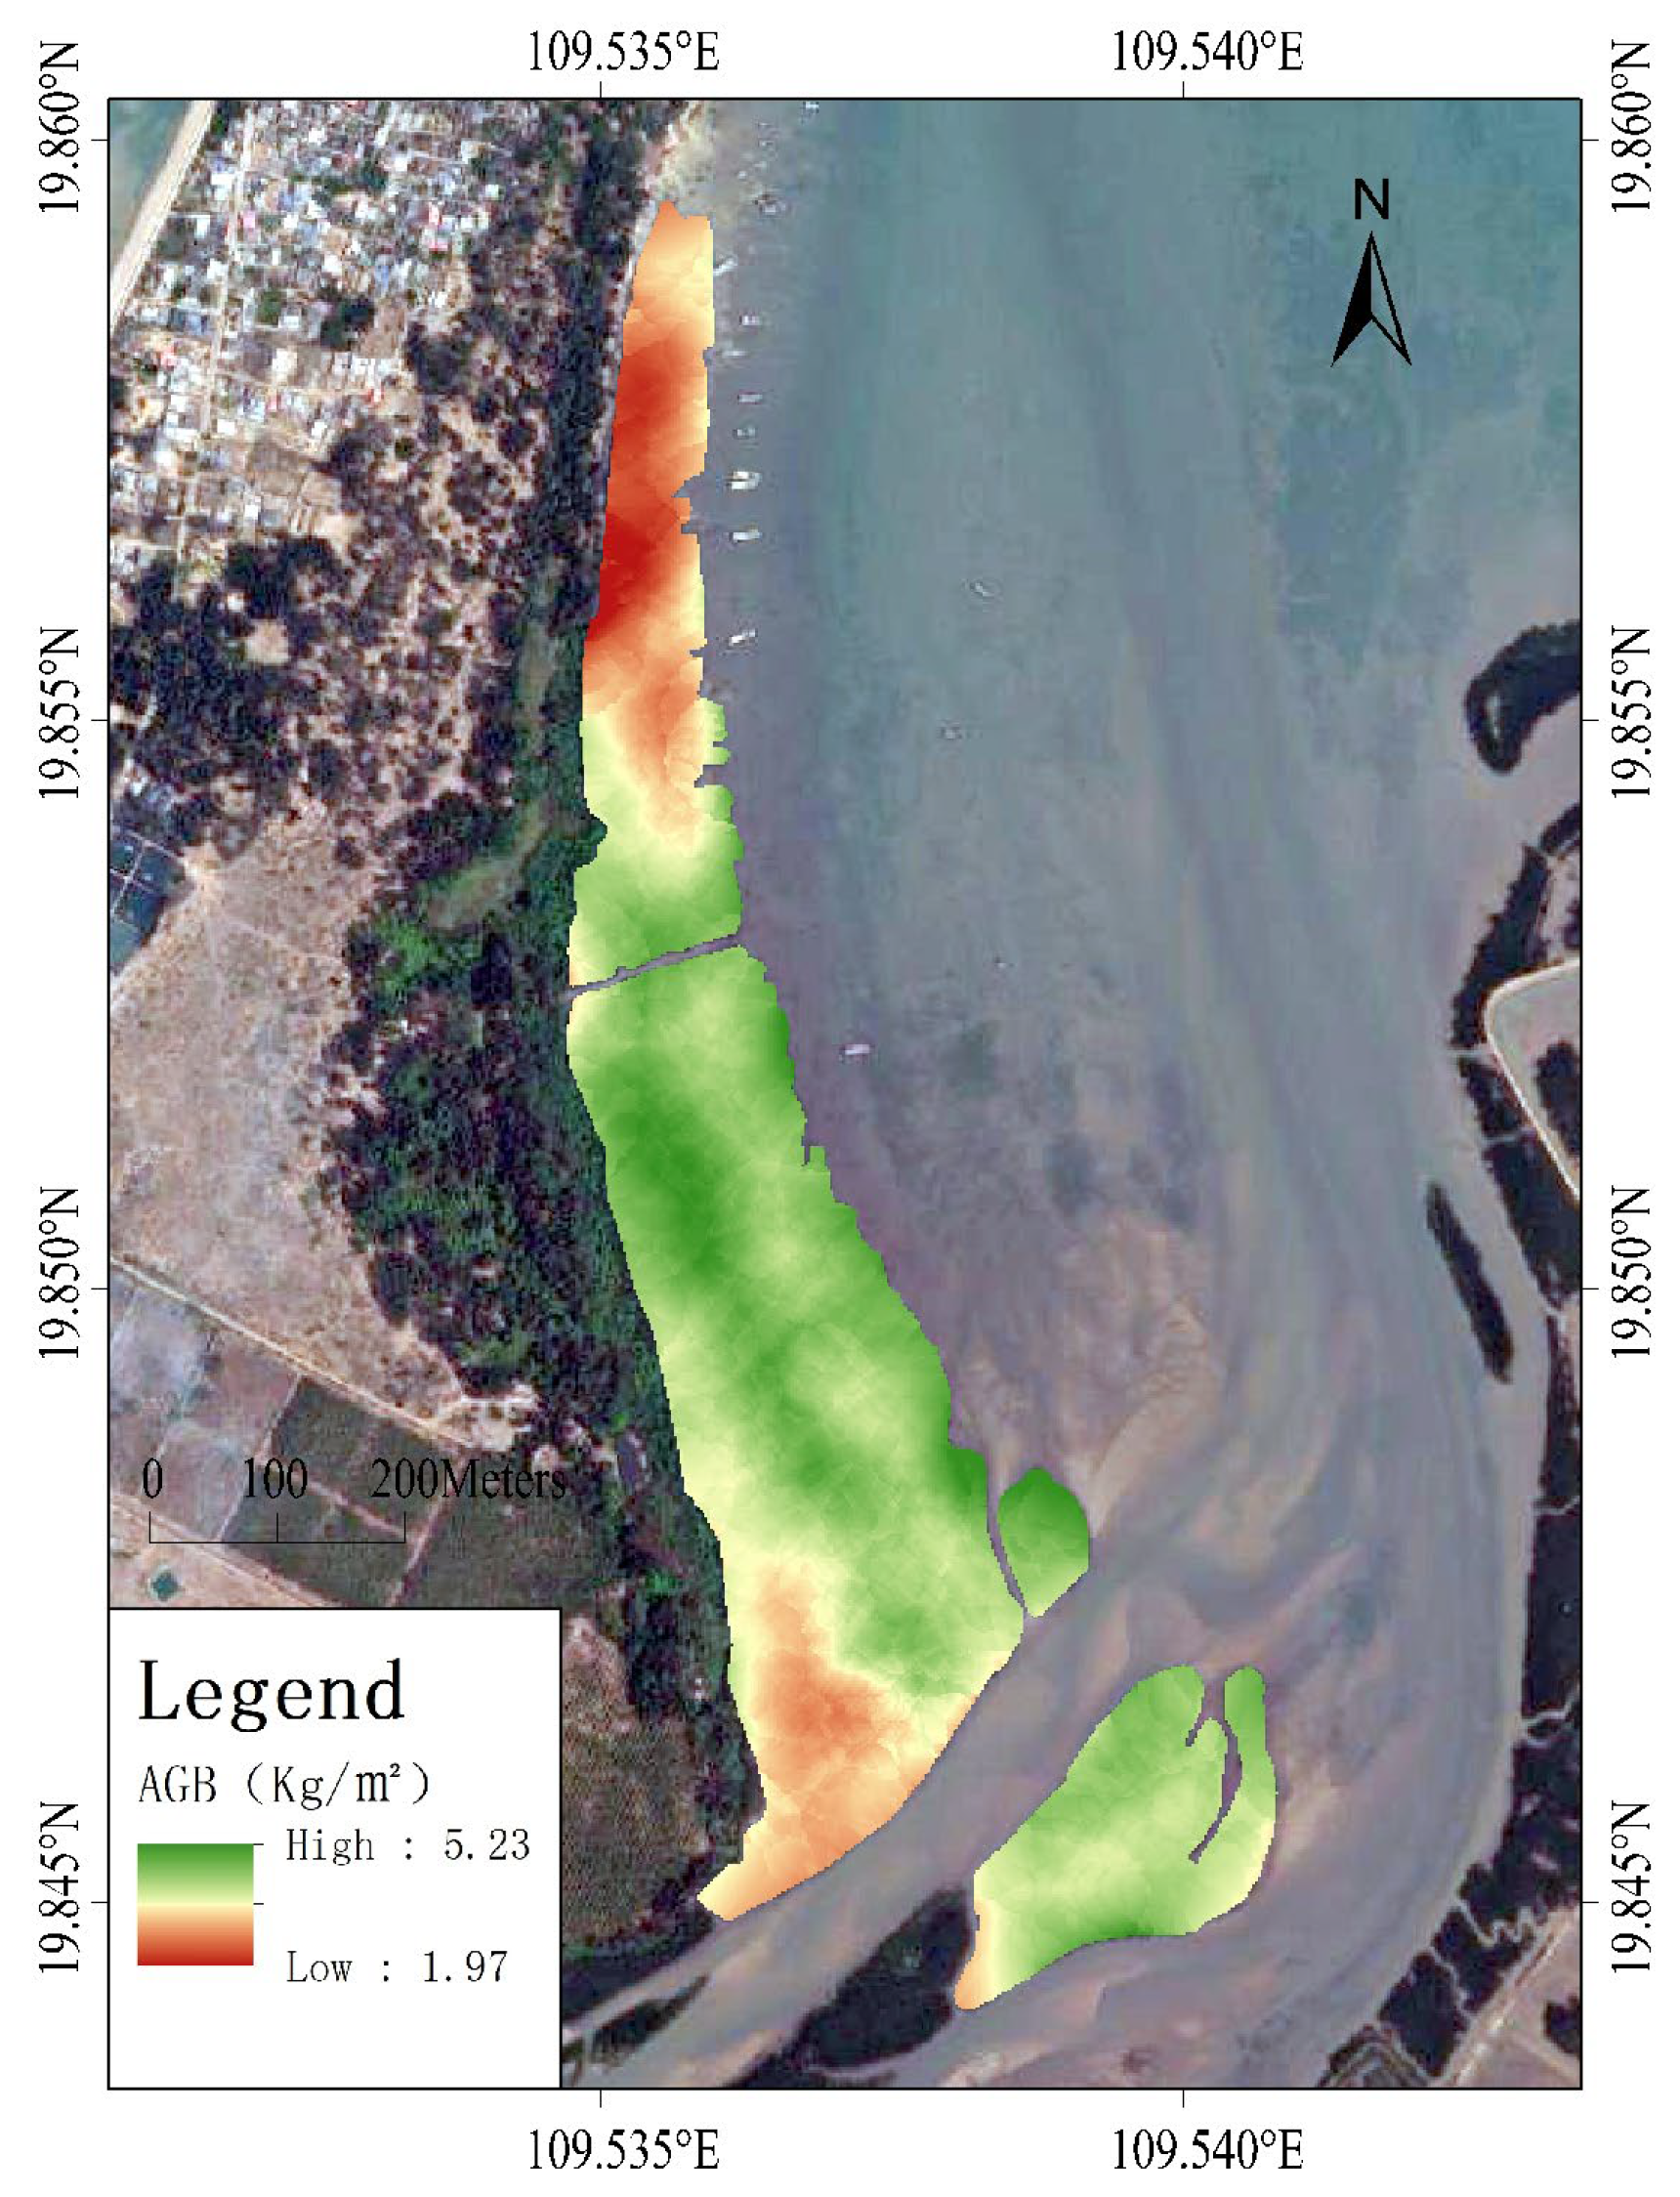
3.4. Spatial Distribution of Mangrove Aboveground Biomass
4. Discussion
4.1. Data Selection and Variable Screening Methods
4.2. Inversion Model Selection
4.3. Research Deficiencies and Future Research Directions
- (1)
- The zero-importance feature selection method based on mutual information has certain advantages in feature selection, but it also has some drawbacks and limitations. This method relies on accurate estimation of mutual information, which is sensitive to data distribution and sample size. Particularly in high-dimensional data or small sample scenarios, this can lead to inaccurate estimations, thereby affecting the reliability of feature selection. Furthermore, the method has a high computational complexity, especially when handling large-scale data, as the time and space costs of computing mutual information are substantial, which restricts its scalability in practical applications.
- (2)
- Current UAV-LiDAR-based AGB inversion studies are predominantly region-specific, with models optimized for particular areas. These models may not maintain comparable accuracy when applied to different regions due to variations in mangrove growth conditions, such as climate, soil properties, and nutrient availability, leading to potential declines in estimation precision during cross-regional applications.
5. Conclusions
- (1)
- The SVM model exhibited the highest fitting ability for mangrove AGB estimation; with the addition of a zero-importance feature selection method based on mutual information, the test set accuracy reached an R2 of 0.8853 and RMSE of 0.4766 kg/m2, while the test set accuracy was R2 of 0.7548 and RMSE of 0.6074 kg/m2 when combined with the zero-importance feature variable selection method. Application of the mutual information-based zero-importance feature selection method to the RF and XGBoost models resulted in less impressive test set accuracies. RF achieved R2 = 0.8277 and RMSE = 0.4340 kg/m2, while XGBoost resulted in R2 = 0.3896 and RMSE = 1.3140 kg/m2. Compared with SVM, the fitting capability is relatively less prominent, and the prediction accuracy indicates that XGBoost is less suitable for estimating mangrove AGB in this region. These results underscore the effectiveness of the mutual information-based zero-importance feature selection method in identifying key variables and highlight the superior performance of the SVM model for mangrove AGB estimation. This study substantially enhances accuracy of mangrove AGB inversion and provides innovative methods for future research.
- (2)
- Predicted AGB values for mangrove forests in the study area ranged from a low value of 1.97 kg/m2 to a high value of 5.23 kg/m2, with an average value of 3.83 kg/m2. This distribution reflects relatively uniform growth conditions in the study area, primarily due to the pristine state of the mangrove ecosystem and minimal human disturbance.
- (3)
- Canopy height, a key LiDAR-derived feature, played a critical part in improving the accuracy of mangrove AGB estimation. The inclusion of canopy height features in the model remarkably enhanced predictive capability compared with intensity features, also derived from LiDAR data. These results highlight the importance of vertical structure in accurately modeling AGB in mangrove ecosystems.
- (4)
- The estimation of aboveground biomass in mangrove forests provides crucial references for the protection and restoration of mangrove ecosystems in the region, contributing to the sustainable development of the local ecosystem.
Author Contributions
Funding
Institutional Review Board Statement
Informed Consent Statement
Data Availability Statement
Acknowledgments
Conflicts of Interest
References
- Zhu, K.; Liao, B.; Zhang, J. Studies on the Biomass of Mangrove Plantation of Sonneratia apetala and Bruguiera gymnorrhiza in the Wetland of Nansha in Guangzhou City. For. Res. 2011, 24, 531–536. [Google Scholar]
- Murdiyarso, D.; Purbopuspito, J.; Kauffman, J.B.; Warren, M.W. The potential of Indonesian mangrove forests for global climate change mitigation. Nat. Clim. Change 2015, 5, 1089–1092. [Google Scholar] [CrossRef]
- He, B.; Fan, H.; Wang, M.; Lai, T.; Wang, W. Species diversity in mangrove wetlands of China and its causation analyses. Acta Ecol. Sin. 2007, 27, 4859–4870. [Google Scholar]
- Sheng, N.; Xin, K.; Liao, B. Literature Analysis Concerning Studies of Ecological Functions and Values of Mangrove Wetland. Wetl. Sci. Manag. 2021, 17, 47–50. [Google Scholar]
- Dech, S.; Gebhardt, S.; Kuenzer, C.; Vo, T.Q.; Bluemel, A. Remote Sensing of Mangrove Ecosystems: A Review. Remote Sens. 2011, 3, 878–928. [Google Scholar] [CrossRef]
- Wang, F.; Tang, J.; Ye, S.; Liu, J. Blue Carbon Sink Function of Chinese Coastal Wetlands and Carbon Neutrality Strategy. Bull. Chin. Acad. Sci. 2021, 36, 241–251. [Google Scholar]
- Zhou, C.; Mao, T.; Xu, X.; Fang, C.; Luo, Y.; Li, B. Preliminary Analysis of C Sequestration Potential of Blue Carbon Ecosystems on Chinese Coastal Zone. Sci. Sin. (Vitae) 2016, 46, 475–486. [Google Scholar]
- Duarte, C.M.; Middelburg, J.J.; Caraco, N. Major role of marine vegetation on the oceanic carbon cycle. Biogeosciences 2005, 2, 1–8. [Google Scholar] [CrossRef]
- Mcleod, E.; Chmura, G.L.; Bouillon, S.; Salm, R. A blueprint for blue carbon: Toward an improved understanding of the role of vegetated coastal habitats in sequestering CO2. Front. Ecol. Environ. 2011, 9, 552–560. [Google Scholar] [CrossRef]
- Wang, F.; Sanders, C.J.; Santos, I.R.; Tang, J. Global blue carbon accumulation in tidal wetlands increases with climate change. Natl. Sci. Rev. 2021, 8, nwaa296. [Google Scholar] [CrossRef]
- Bouillon, S.; Borges, A.V.; Castañeda-Moya, E.; Diele, K.; Dittmar, T.; Duke, N.C.; Kristensen, E.; Lee, S.Y.; Marchand, C.; Middelburg, J.J.; et al. Mangrove production and carbon sinks: A revision of global budget estimates. Glob. Biogeochem. Cycles 2008, 22, GB2013. [Google Scholar] [CrossRef]
- Leal, M.; Spalding, M.D. The State of the World’s Mangroves 2022; Global Mangrove Alliance: Washington, DC, USA, 2022. [Google Scholar]
- Goldberg, L.; Lagomasino, D.; Thomas, N.; Fatoyinbo, T. Global declines in human-driven mangrove loss. Glob. Change Biol. 2020, 26, 5844–5855. [Google Scholar] [CrossRef]
- Polidoro, B.A.; Carpenter, K.E.; Collins, L.; Duke, N.C.; Ellison, A.M.; Ellison, J.C.; Farnsworth, E.J.; Fernando, E.S.; Kathiresan, K.; Koedam, N.E.; et al. The loss of species: Mangrove extinction risk and geographic areas of global concern. PLoS ONE 2010, 5, e10095. [Google Scholar] [CrossRef]
- Food and Agriculture Organization of the United Nations (FAO). The World’s Mangroves 2000–2020; FAO: Rome, Italy, 2023. [Google Scholar] [CrossRef]
- Zhao, N. “Ocean Guardian” Contributes to Carbon Neutrality. China Natural Resources News, 30 September 2021; p. 005. [Google Scholar]
- Hu, A. China’s Goal of Achieving Carbon Peak by 2030 and Its Main Approaches. J. Beijing Univ. Technol. (Soc. Sci. Ed.) 2021, 21, 1–15. [Google Scholar]
- Tan, Y.; Tian, Y.; Huang, Z.; Zhang, Q.; Tao, J.; Liu, H.; Yang, Y.; Zhang, Y.; Lin, J.; Deng, J. Aboveground biomass of Sonneratia apetala mangroves in Mawei Sea of Beibu Gulf based on XGBoost machine learning algorithm. Acta Ecol. Sin. 2023, 43, 4674–4688. [Google Scholar]
- Zhang, S. Application of UAV in Inversion of Aboveground Biomass and Carbon Storage of Dense Low Shrub Mangrove. Ph.D. Thesis, Guangxi University, Nanning, China, 2022. [Google Scholar]
- Zhao, T.; Yu, R.; Zhang, Z.; Bai, X.; Zeng, Q. Estimation of wetland vegetation aboveground biomass based on remote sensing data: A review. Chin. J. Ecol. 2016, 35, 1936–1946. [Google Scholar]
- Xu, F. Mangrove Extraction and Carbon Storage Estimation by Using Sentinel-2 Images. Ph.D. Thesis, Lanzhou Jiaotong University, Lanzhou, China, 2020. [Google Scholar]
- Zheng, D.; Rademacher, J.; Chen, J.; Crow, T.; Bresee, M.; Moine, J.L.; Ryu, R.S. Estimating aboveground biomass using Landsat 7 ETM+ data across a managed landscape in northern Wisconsin, USA. Remote Sens. Environ. 2004, 93, 402–411. [Google Scholar] [CrossRef]
- Cornejo, R.H.; Koedam, N.; Luna, A.R.; Troell, M.; Dahdouh-Guebas, F. Remote Sensing and Ethnobotanical Assessment of the Mangrove Forest Changes in the Navachiste-San Ignacio-Macapule Lagoon Complex, Sinaloa, Mexico. Ecol. Soc. 2005, 10, 16. [Google Scholar] [CrossRef]
- Hall, R.J.; Skakun, R.S.; Arsenault, E.J.; Case, B.S. Modeling forest stand structure attributes using Landsat ETM+ data: Application to mapping of aboveground biomass and stand volume. For. Ecol. Manag. 2006, 225, 378–390. [Google Scholar] [CrossRef]
- Cao, Q.; Xu, D.; Ju, H. Biomass Estimation of Five Kinds of Mangrove Community with the KNN Method Based on the Spectral Information and Textural Features of TM Images. For. Res. 2011, 24, 144–150. [Google Scholar]
- Hirata, Y.; Tabuchi, R.; Patanaponpaiboon, P.; Poungparn, S.; Yoneda, R.; Fujioka, Y. Estimation of aboveground biomass in mangrove forests using high-resolution satellite data. J. For. Res. 2014, 19, 34–41. [Google Scholar] [CrossRef]
- Pham, L.T.H.; Brabyn, L. Monitoring mangrove biomass change in Vietnam using SPOT images and an object-based approach combined with machine learning algorithms. ISPRS-J. Photogramm. Remote Sens. 2017, 128, 86–97. [Google Scholar] [CrossRef]
- Li, Q.; Xuan, C.; Tang, Z.; Zhang, T.; Song, Y.A. Review on Vegetation Biomass Inversion Based on Remote Sensing Technology. J. Inn. Mong. Agric. Univ. (Nat. Sci. Ed.) 2024, 1–13. [Google Scholar]
- Li, W.; Xue, Z.; Zhu, J.; Tian, Z. Estimation of carbon stock of the mangrove forests in Hainan Island based on multi-source remote sensing data from GEE platform. Remote Sens. Nat. Resour. 2024, 1–8. [Google Scholar]
- Zhang, S.; Hui, G.; Han, Z.; Sun, S.; Tian, X. Estimation of Large-scale Forest Above-ground Biomass based on Fast Optimizing Remotely Sensed Features from Pptical Multi-spectral and SAR Data. Remote Sens. Technol. Appl. 2019, 34, 925–938. [Google Scholar]
- Lucas, R.; Rebelo, L.M.; Fatoyinbo, L.; Rosenqvist, A.; Itoh, T.; Shimada, M.; Simard, M.; Souza-Filho, P.W.; Thomas, N.; Trettin, C.; et al. Contribution of L-band SAR to systematic global mangrove monitoring. Mar. Freshw. Res. 2014, 65, 589–603. [Google Scholar] [CrossRef]
- Bai, M.; Zhang, C.; Chen, Q.; Wang, J.; Li, H.; Shi, X.; Tian, X.; Zhang, Y. Study on the Extraction of Individual Tree Height Based on UAV Visual Spectrum Remote Sensing. For. Grassl. Resour. Res. 2021, 164–172. [Google Scholar]
- Li, X.; Wu, J.; Lin, W. Forest biomass estimation and mapping based on high resolution UAV images. J. Cent. S. Univ. For. Technol. 2020, 40, 50–56. [Google Scholar]
- Wang, D.; Wan, B.; Liu, J.; Su, Y.; Guo, Q.; Qiu, P.; Wu, X. Estimating aboveground biomass of the mangrove forests on northeast Hainan Island in China using an upscaling method from field plots, UAV-LiDAR data and Sentinel-2 imagery. Int. J. Appl. Earth Obs. Geoinf. 2020, 85, 101986. [Google Scholar] [CrossRef]
- Yu, C.; Gong, H.; Cao, J.; Liu, Y.; Liu, K. Individual Tree Crown Delineation and Aboveground Biomass Estimation of Sonneratia apetala Based on Unmanned Aerial Vehicle Remote Sensing Images. Trop. Geogr. 2023, 43, 12–22. [Google Scholar]
- Wu, P.; Ren, G.; Zhang, C.; Wang, H.; Liu, S.; Ma, Y. Fine identification and biomass estimation of mangroves based on UAV multispectral and LiDAR. Natl. Remote Sens. Bull. 2022, 26, 1169–1181. [Google Scholar] [CrossRef]
- Salum, R.B.; Robinson, S.A.; Rogers, K. A Validated and accurate method for quantifying and extrapolating mangrove above-ground biomass using LiDAR data. Remote Sens. 2021, 13, 2763. [Google Scholar] [CrossRef]
- Pereira, F.R.D.S.; Kampel, M.; Soares, M.L.G.; Estrada, G.C.D.; Bentz, C.; Vincent, G. Reducing uncertainty in mapping of mangrove aboveground biomass using airborne discrete return lidar data. Remote Sens. 2018, 10, 637. [Google Scholar] [CrossRef]
- Jia, Y.; Zhang, L.; Wu, D.; Song, C.; Yuan, W.; Li, L. Comparative analysis of grassland biomass inversion models based on unmanned aerial vehicle multispectral data. Acta Ecol. Sin. 2024, 44, 1–11. [Google Scholar]
- Luo, J.; Tian, Y.; Zhang, Q.; Tao, J.; Huang, Y.; Wang, J.; Zhang, Y.; Huang, Z.; Deng, J.; Tan, Y. Estimation of aboveground biomass of mangrove forest using UAV-LiDAR. Haiyang Xuebao 2023, 45, 108–119. [Google Scholar]
- Li, X.; Liu, X.; Sun, B.; Jiang, J.; Yu, H.; Wu, D.; Du, X.; Wang, H.; Jia, J.; Yang, H. Machine learning–based assessment of grassland aboveground biomass in Gansu Province. Pratacultural Sci. 2024, 41, 297–307. [Google Scholar]
- Mu, Z.; Zhang, Z.; Zhang, H.; Jiang, L. Applying Machine Learning Algorithm Models to Predict Aboveground Biomass of Larix gmelinii in Xing’an. J. Northeast. For. Univ. 2024, 52, 41–47. [Google Scholar]
- Wang, X.; Yang, X.; Zhao, F.; An, B.; Huang, X. Estimation of Aboveground Biomass in the Arid Oasis Based on the Machine Learning Algorithm. Ecol. Environ. Sci. 2023, 32, 1007–1015. [Google Scholar]
- Yang, Y.; Yang, D.; Sun, H.; Meng, H.; Tian, C.; Liu, C.; Lei, D. Estimation of cotton biomass in southern Xinjiang based on UAV multi-spectral remote sensing and machine learning algorithm. Jiangsu Agric. Sci. 2023, 51, 179–187. [Google Scholar]
- Zhang, Z.; Tian, Y.; Deng, J.; Yao, G.; Li, Y. Biomass inversion of typical mangrove forests in Qinzhou Bay based on LiDAR. Ecol. Sci. 2024, 43, 203–210. [Google Scholar]
- Zhang, P.; Ma, Q.; Lu, J.; Ji, J.; Li, Z. Application of machine learning algorithms in estimation of above-ground biomass of forest. Bull. Surv. Mapp. 2021, 28–32. [Google Scholar]
- Tian, Y.; Huang, H.; Zhou, G.; Zhang, Q.; Tao, J.; Zhang, Y.; Lin, J. Aboveground mangrove biomass estimation in Beibu Gulf using machine learning and UAV remote sensing. Sci. Total Environ. 2021, 781, 146816. [Google Scholar] [CrossRef]
- Jozdani, S.E.; Johnson, B.A.; Chen, D. Comparing Deep Neural Networks, Ensemble Classifiers, and Support Vector Machine Algorithms for Object-Based Urban Land Use/Land Cover Classification. Remote Sens. 2019, 11, 1713. [Google Scholar] [CrossRef]
- Hakkal, S.; Lahcen, A.A. XGBoost To Enhance Learner Performance Prediction. Comput. Educ. Artif. Intell. 2024, 7, 100254. [Google Scholar] [CrossRef]
- Wu, Z.; Yao, F.; Zhang, J.; Liu, H. Estimating Forest Aboveground Biomass Using a Combination of Geographical Random Forest and Empirical Bayesian Kriging Models. Remote Sens. 2024, 16, 1859. [Google Scholar] [CrossRef]
- Deb, D.; Deb, S.; Chakraborty, D.; Singh, J.P.; Singh, A.K.; Dutta, P.; Choudhury, A. Aboveground biomass estimation of an agro-pastoral ecology in semi-arid Bundelkhand region of India from Landsat data: A comparison of support vector machine and traditional regression models. Geocarto Int. 2020, 37, 1043–1058. [Google Scholar] [CrossRef]
- Tamai, S.; Lampa, P. Establishment and growth of mangrove seedling in mangrove forests of southern Thailand. Ecol. Res. 1988, 3, 227–238. [Google Scholar] [CrossRef]
- Fromard, F.; Puig, H.; Mougin, E.; Marty, G.; Betoulle, J.L.; Cadamuro, L. Structure, above-ground biomass and dynamics of mangrove ecosystems: New data from French Guiana. Oecologia 1998, 115, 39–53. [Google Scholar] [CrossRef]
- Li, N.; Wang, Y.; Zhou, L.; Zou, C.; Tian, Y.; Guo, N. DDoS Attack Random Forest Detection Method Based on Secondary Screening of Feature Importance. Comput. Sci. 2021, 48 (Suppl. S1), 464–467+476. [Google Scholar]
- Lv, X.; Li, Q.; Zhang, D.; Zeng, L.; Ling, L. Novel optimal sub-models selection algorithm for combination orecasting based on neighborhood mutual information. Comput. Eng. Des. 2024, 45, 1359–1367. [Google Scholar]
- Zhang, Q.; Liu, S.; Wang, J.; Li, Z.; Wen, C. Feature selection for multi-labeled data based on label enhancement technique and mutual information. Inf. Sci. 2024, 679, 121113. [Google Scholar] [CrossRef]
- Zhang, P.; Liang, Y.; Liu, B.; Ma, T.; Wu, M. Remote sensing estimation of forest aboveground biomass in Tibetan Plateau based on random forest model. Chin. J. Ecol. 2023, 42, 415–424. [Google Scholar]
- Jia, Z.; Zhang, Z.; Cheng, Y.; Buhebaoyin; Borjiginet, S.; Quan, Z. Grassland biomass spatiotemporal patterns and response to climate change in eastern Inner Mongolia based on XGBoost model estimates. Ecol. Indic. 2024, 158, 111554. [Google Scholar] [CrossRef]
- Shang, K. The Study of Grassland Above Ground Biomass Inversion based on Support Vector Machine Regression. Ph.D. Thesis, Southwest Forestry University, Kunming, China, 2015. [Google Scholar]

| Type | Variables | Variable Description |
|---|---|---|
| Height Metrics | elev_per/elev_AIH01, 05, 10, 20, 25, 30, 40, 50, 60, 70, 75, 80, 90, 95, 99 | Height percentile corresponding to all point clouds at 1%, 5%, 10%, 20%, 25%, 30%, 40%, 50%, 60%, 70%, 75%, 80%, 90%, 95%, and 99% quantile/cumulative height percentile |
| elev _mean, elev _median, elev _max, elev _min, elev _madmedian | Mean, median, maximum, minimum and median absolute deviation of heights | |
| elev_stddev, elev_var, elev_cv, elev_kurtosis, elev_skewness, elev_crr. | Standard deviation, variance, coefficient of variation, kurtosis, skewness, canopy undulation rate of height | |
| elev_sqrt_mean_sq, elev_curt_mean_cube, elev_IQ, elev_AIH_IQ | Generalized mean of quadratic and cubic (root mean square/cubic root of height), interquartile spacing of heights, cumulative interquartile spacing of heights | |
| Density Metrics | elev_density1, 2, 3, 4, 5, 6, 7, 8, 9,10 | Ratio of total number of point clouds in each layer of the point cloud from bottom to top |
| Intensity Metrics | int_per01, 05, 10, 20, 25, 30, 40, 50, 60, 70, 75, 80, 90, 95, 99 | Corresponding intensity percentiles at the 1%, 5%, 10%, 20%, 25%, 30%, 40%, 50%, 60%, 70%, 75%, 80%, 90%, 95%, and 99% quartiles of all point clouds |
| int _mean, int _median, int _max, int_min, int _madmedian | Mean, median, maximum, minimum and median absolute deviation of intensity | |
| int _std, int _var, int _cv,int_kurtosis, int _skewness, | Standard deviation, variance, coefficient of variation, kurtosis, skewness for intensity | |
| int_IQ | Intensity quartile spacing |
| Tree Species | Statistic | Plant Height (m) | Diameter at Breast Height (cm) | Single Plant AGB/(kg) |
|---|---|---|---|---|
| Rhizophora stylosa | Average value | 3.19 | 4.43 | 5.3 |
| Maximum values | 6 | 5.67 | 7.62 | |
| Minimum value | 1.8 | 3 | 2.39 |
| Variables | Overall Rating | Variables | Overall Rating | Variables | Overall Rating |
|---|---|---|---|---|---|
| elev_AIH25 | 0.9092 | elev_per10 | 0.8483 | elev_AIH70 | 0.8169 |
| elev_AIH90 | 0.8983 | elev_per20 | 0.8438 | elev_AIH95 | 0.8100 |
| density4 | 0.8935 | elev_AIH40 | 0.8433 | elev_per25 | 0.8038 |
| elev_skewness | 0.8836 | elev_per50 | 0.8388 | elev_AIH50 | 0.7992 |
| elev_AIH30 | 0.8696 | elev_per90 | 0.8289 | elev_per40 | 0.7990 |
| elev_AIH20 | 0.8681 | elev_AIH60 | 0.8283 | elev_per70 | 0.7953 |
| elev_AIH10 | 0.8662 | elev_per05 | 0.8278 | elev_sqrt_mean_sq | 0.7892 |
| density5 | 0.8501 | elev_per80 | 0.82676 | elev_AIH05 | 0.7873 |
| elev_per75 | 0.8491 | elev_kurtosis | 0.8182 |
Disclaimer/Publisher’s Note: The statements, opinions and data contained in all publications are solely those of the individual author(s) and contributor(s) and not of MDPI and/or the editor(s). MDPI and/or the editor(s) disclaim responsibility for any injury to people or property resulting from any ideas, methods, instructions or products referred to in the content. |
© 2025 by the authors. Licensee MDPI, Basel, Switzerland. This article is an open access article distributed under the terms and conditions of the Creative Commons Attribution (CC BY) license (https://creativecommons.org/licenses/by/4.0/).
Share and Cite
Huang, S.; Zhang, Z.; Sun, Y.; Song, W.; Meng, J. Enhancing Mangrove Aboveground Biomass Estimation with UAV-LiDAR: A Novel Mutual Information-Based Feature Selection Approach. Sustainability 2025, 17, 3004. https://doi.org/10.3390/su17073004
Huang S, Zhang Z, Sun Y, Song W, Meng J. Enhancing Mangrove Aboveground Biomass Estimation with UAV-LiDAR: A Novel Mutual Information-Based Feature Selection Approach. Sustainability. 2025; 17(7):3004. https://doi.org/10.3390/su17073004
Chicago/Turabian StyleHuang, Shan, Zhiwei Zhang, Yonggen Sun, Weilong Song, and Jianing Meng. 2025. "Enhancing Mangrove Aboveground Biomass Estimation with UAV-LiDAR: A Novel Mutual Information-Based Feature Selection Approach" Sustainability 17, no. 7: 3004. https://doi.org/10.3390/su17073004
APA StyleHuang, S., Zhang, Z., Sun, Y., Song, W., & Meng, J. (2025). Enhancing Mangrove Aboveground Biomass Estimation with UAV-LiDAR: A Novel Mutual Information-Based Feature Selection Approach. Sustainability, 17(7), 3004. https://doi.org/10.3390/su17073004