Article

Eco-Innovation in the Food and Beverage Industry: Persistence and the Influence of Crises

by
Antonio García-Sánchez
1,2 and
Ruth Rama
2,3,*
1
Department of Economics and Economic History, Universidad de Sevilla Avda Ramón y, Cajal 1, 41018 Sevilla, Spain
2
GRINEI (Research Group on Economics and Politics of Innovation), Instituto Complutense de Estudios Internacionales ICEI, Universidad Complutense de Madrid, 28223 Madrid, Spain
3
CSIC (National Research Council of Spain), IEGD (Instituto de Economía, Geografía y Demografía), Albasanz, 26–28, 28037 Madrid, Spain
*
Author to whom correspondence should be addressed.
Sustainability 2025, 17(7), 2971; https://doi.org/10.3390/su17072971
Submission received: 24 January 2025 / Revised: 19 March 2025 / Accepted: 19 March 2025 / Published: 27 March 2025
(This article belongs to the Section Economic and Business Aspects of Sustainability)

Abstract

This study explores the role of persistence in eco-innovative (EI) activities in enhancing firms’ resilience during crises, focusing on the Spanish food and beverage industry. It distinguishes between two types of eco-innovators: efficiency-focused eco-innovators, who aim to reduce material and energy usage, and environmental eco-innovators, who seek to minimize direct harm to the environment. Additionally, the analysis evaluates the impact of regulation and institutional interventions on fostering eco-innovation during economic downturns. Using panel data from Spanish food and beverage companies between 2004 and 2016, we adopt a longitudinal approach to study how long-term commitments to EI influence green technology adoption. We identify three distinct periods: 2004–2007 (boom), 2008–2013 (crisis), and 2014–2016 (recovery). Finally, the study analyses the most effective institutional interventions and corporate green strategies for fostering the green transition during challenging times. The analysis provides theoretical insights and tailored managerial and policy recommendations.

1. Introduction

The food and beverage processing industry (F&B industry) plays a crucial role in addressing global challenges, including meeting the demands of a growing population, adapting to shifting consumer preferences, and ensuring sustainable food production. However, the industry faces significant environmental criticism due to the substantial liquid and solid waste generated during food processing [1]. Additionally, it is widely recognized as energy-intensive, given its reliance on refrigeration, freezing, and thermal treatments such as baking and frying. In developing countries, the F&B industry often faces additional environmental challenges, such as a lack of traceability, inefficient recycling, improper disposal of packaging, and overextraction for processing, which leads to water depletion and pollution. These problems necessitate innovative solutions to enhance efficiency, reduce costs, and improve waste management [2].
Eco-innovation (EI) has emerged as a strategic response to these challenges, extending beyond regulatory compliance to deliver economic and competitive advantages. EI enables firms to reduce energy and material costs, differentiate products, and improve international competitiveness [3,4,5]. However, implementing EI is not without its difficulties. Green products often face higher production costs and consumer resistance, and firms must invest significantly in innovation and marketing to achieve commercial success, particularly in the traditionally conservative F&B industry [6,7,8]. While EI consistently benefits the environment and public health, its financial impact on firms is more uncertain and may even be negative in the short term [7,9,10,11].
Despite growing scholarly attention, research on EI remains largely focused on high-tech sectors, leaving resource-intensive industries such as F&B underexplored [12,13]. Moreover, most studies employ cross-sectional approaches, overlooking the dynamic nature of innovation. Scholars have called for long-term analyses to understand the persistence of EI and its evolution over time [3,7,14,15,16,17,18]. Recent literature also emphasizes the need to examine how crises influence EI, given the uncertainties they introduce for sustainability in agri-food firms [19]. As Stoneman (1995, p. 6) [20] pointed out, “clearly, the analysis of technological change must be dynamic and as such involve time”. A dynamic perspective is essential for assessing how eco-innovative firms adapt to changing economic conditions, particularly during crises [21,22].
Spain provides a compelling context for studying the evolution of EI due to its large and resource-intensive F&B sector. The industry accounts for 24% of Spain’s manufacturing turnover, with 97% of firms classified as small and medium sized enterprises (SMEs). (INE, Estadística Estructural de Empresas: Sector Industrial, 2021). Spain is also a competitive producer and exporter of olive oil, wines, and other foodstuffs, with the sector showing revealed technological advantages (RTAs) as indicated by patent data [23,24]. Other peripheral European countries and emerging economies may share a similar scenario. The 2008 financial crisis, which severely impacted Spain through a credit crunch, job losses, and R&D funding cuts, presents a unique opportunity to analyze how economic downturns shape EI. While crises often lead to procyclical reductions in innovation investment [25,26,27], they can also create opportunities for firms to innovate in response to new challenges [22,28,29]. Moreover, firms that develop strategic resilience and experience cultural changes from past crises may be better positioned to navigate future economic shocks and design long-term innovative solutions [30,31].
This study aims to fill key gaps in the literature by examining the persistence of green innovation and its role in strengthening firms’ green transition during crises. Using panel data from Spanish F&B firms between 2004 and 2016, we adopt a longitudinal approach to investigate how long-term commitments to EI influence green technology adoption. We analyze three distinct periods: 2004–2007 (boom), 2008–2013 (crisis), and 2014–2016 (recovery). We argue that past experience in EI enables firms to seize new opportunities for advancing the transition to green technologies during times of crisis. Furthermore, we assess the role of regulation and institutional interventions in supporting EI during economic stress, specifically in the case of Spain’s 2008 crisis and its prolonged, difficult recovery. Finally, we examine which corporate green strategies are most effective in fostering EI during these periods.
Our findings contribute to the literature in several ways. First, we provide empirical evidence that crises can generate opportunities for specific types of EI. Second, we demonstrate that persistence in innovation mitigates the adverse effects of economic downturns, reinforcing firms’ commitment to the green transition. Third, we demonstrate that, while certain institutional interventions effectively stimulate green technologies and accelerate their adoption during crises, others—such as the indiscriminate subsidization of all types of R&D—have limited impact. Finally, we find that firms’ strategies vary based on their specific green goals.
The remainder of this article is structured as follows. Section 2 defines key concepts and presents stylized facts regarding EI in the F&B sector. It also reviews the relevant literature and formulates our research hypotheses and research questions. Section 3 details the research methodology, while Section 4 provides contextual background and descriptive statistics. Section 5 presents our empirical results and discussion. Finally, Section 6 concludes by summarizing the study’s contributions and offering policy recommendations.

2. Literature Review

2.1. Definitions

In the Community Innovation Survey (CIS) of the European Union (EU), an innovation is defined as a new or significantly improved product (good or service) introduced to the market or the implementation of a new or significantly improved process within an enterprise (https://ec.europa.eu/eurostat/web/microdata/community-innovation-survey (accessed on 11 October 2024)). This is a relevant consideration, as our study relies on data from a CIS-type survey. In academic literature, eco-innovation, specifically, is often referred to by different terms such as “ecological”, “green”, or “sustainable” innovation [4]. In reviewing the literature, the aforementioned authors observe that most studies emphasize reducing negative environmental externalities and promoting the effective use of resources, such as energy. Similarly, this article emphasizes these EIs. The Eco-Innovation Observatory.(https://www.eea.europa.eu/data-and-maps/data-providers-and-partners/eco-innovation-observatory (accessed on 11 October 2024) defines EI as the “introduction of any new or significantly improved product (good or service), process, organizational change, or marketing solution that reduces the use of natural resources (including energy, water, and land) and decreases the release of harmful substances across the whole life-cycle”. The Measuring Eco-Innovation (MEI) project definition of eco-innovation refers to the “development and application of a new or significantly improved product (good or service), process, marketing method, or organizational method, with the primary goal of reducing environmental impacts or achieving a more sustainable use of resources”. For a compilation of the various definitions of EI found in the literature, see Díaz-García et al. (2015) [14].
After examining the literature, Hojnik and Ruzzier (2016) [15] characterize a driver of EI as a stimulus, which can function either as a motivation-based factor (such as regulatory pressure, anticipated benefits of adoption, competitive forces, and customer demand) or as a facilitating factor (such as the firm’s financial resources and technological capabilities). This article follows this methodological approach.

2.2. Theoretical Background and Continuing Review of Key Stylized Facts

Our topic sits at the intersection of several strands of research. Of primary interest are studies on the specificity of innovation—both green and non-green—within the F&B industry. This area has developed into a rich field of study, spanning several decades and establishing key stylized facts that contribute to a holistic understanding of innovation dynamics. A more specialized literature on EI in the F&B industry is now emerging. However, it is rarely anchored in the broader innovation literature mentioned above. Theoretically, this body of work aligns more closely with the general literature on EI across all sectors or within manufacturing. Beyond this specialized research, developing our topic also requires integrating insights from two additional theoretical strands: the literature on the persistence of innovation and the literature on the effects of crises on innovation.
We begin by outlining our theoretical background and highlighting key stylized facts on innovation—both green and non-green—within the F&B industry. Our analysis is grounded in the evolutionary theory of technological change, which emphasizes the complex, dynamic, and often unpredictable nature of technological advancement, shaped by diverse economic, social, and institutional factors. In this approach, technological evolution is typically cumulative, building on past innovations, and often incremental, involving small, continuous improvements rather than radical shifts [32]. This theory focuses on path dependency and the role of routines in shaping technological progress. While it emphasizes cumulative and incremental innovation independent of macroeconomic fluctuations, our study extends this perspective by examining how different phases of the business cycle—boom, crisis, and recovery—shape firms’ green strategies. Our analysis is grounded in the idea that the macroeconomic environment plays an active role in shaping the evolutionary processes driving the transition to green technology.
Evolutionary theory pays special attention to the specific characteristics of innovation in different sectors of the economy. Pavitt’s (1984) [33] taxonomy categorizes industries based on their sources of innovation and the nature of technological change within them. According to Pavitt, the F&B industry falls under the category of “supplier-dominated” sectors. This classification highlights that technological innovation in the F&B industry is largely driven by external suppliers. These include manufacturers of processing machinery, packaging equipment, and other industrial technologies. In Pavitt’s view, F&B firms typically have lower research and development (R&D) expenditures compared to high-tech sectors. Much of their innovation comes from adopting and adapting technologies developed by suppliers. In this theoretical context, Malerba (2005) [34] highlights the concept of sectoral innovation systems. Innovation characteristics, he argues, vary across sectors of an economy due to distinct sources of knowledge, varying levels of R&D investments, and different rates of technological advancement. Apparent inconsistencies in the economic literature on innovation frequently arise because the proposed theories aim to identify universal patterns. However, in practice, companies typically adhere to innovation patterns specific to their sectors [35,36]. The discussion justifies the interest in sectoral analyses of EI.
Contrary to the common and long-held belief that the F&B industry is low-tech, Galizzi and Venturini (2008) [37] argue that it is actually marked by significant and growing levels of product innovation. They attribute this characteristic to the fact that innovation in this industry is primarily incremental. In their view, using R&D intensity as a measure of innovative output is misleading and fails to accurately reflect the true importance of innovation in the F&B sector. In a previous study [8], they argue that the F&B industry is one of the most Schumpeterian sectors, where large companies are more conducive to innovation. According to them, the reluctance of SMEs in this industry to engage in innovation is not due to insufficient R&D resources, as these firms do not need to spend large amounts on formal R&D. Instead, the challenge lies in the need for substantial investment in advertising and marketing to profit from innovation. These sunk costs discourage F&B SMEs from innovating, and a “minimum size” is required to successfully access these activities.
In this sector, regulation is a major constraint that must be considered by any company undertaking any type of innovation. As noted by Gonard et al. (1991) [38] in their analysis of the sugar subsector, the regulatory environment is sometimes more influential than technological opportunities in determining technology adoption. However, innovation within the F&B sector has been shaped by an interplay of anticipatory influences from retailing and regulatory frameworks. Retailers have encouraged the adoption of new practices even beyond normative requirements, especially regarding innovations that promote the production of safe and high-quality food [39,40]. In some developing countries, modern retailing does not drive innovation in food and beverage production [41]. However, in most advanced and some emerging economies, modern retailers have helped improve food products and enable digital traceability across the food chain [40,42].
On the other hand, the link between food and non-food value chains plays a crucial role in influencing the food and drink SIS [43]. The F&B industry now relies on a broad range of sciences and techniques [2,44]. Innovation is increasingly driven not only by a company’s internal efforts but also by its interactions within a wider SIS [45,46,47,48]. Rising R&D costs, reflecting trends seen across other sectors, have increasingly driven collaboration [47], including green initiatives [49]. However, despite open innovation being widespread in the F&B sector [50], some companies remain closed due to concerns about knowledge spillovers, as innovations are easily imitated [51]. At the same time, the in-house development of food-related technological fields, such as biotechnology, appears to be on the rise in both large and small F&B firms as a means of improving interactions with suppliers [44,52].
Another key aspect is the role multinational enterprises (MNEs) play in driving innovation within the global F&B industry. In 2005, the world’s 100 largest F&B MNEs contributed to about a third of the global turnover in the processing industry and produced nearly half of the patented innovations, food-related technological fields included [53,54].
In conclusion, the literature on innovation in the F&B industry reveals a complex interplay between sector-specific characteristics, technological advancements, and external influences, such as regulation. This dynamic environment highlights the need for further research into the long-term interactions of these factors to gain a deeper understanding of the adoption of green innovation in the F&B sector.

2.3. Continuing the Review: Evolution and Drivers of Eco-Innovation

2.3.1. Evolution of Innovation

Given the longitudinal approach of our study, it is essential to examine the literature on the evolution of innovation, with particular attention to the limited studies on the progression of, specifically, EI. Most studies on innovation trends align with the view that innovation follows the business cycle, with R&D-related investment decreasing during downturns and increasing during upturns [25,26,27,55]. However, firms are not uniform in this regard. For example, during the 2008 financial crisis, high-tech sectors often pursued countercyclical innovation strategies, whereas low-tech industries, such as the F&B sector, displayed procyclical trends [56,57].
Little is known about the evolution of specifically EI, especially at the national level across different phases of the business cycle. However, the effects of crises on the numbers of eco-innovators have been explored. Certain studies show that their numbers generally declined after the 2008 financial crisis. Using CIS data, Ghisette (2017) [10] found that, in most EU countries (Spain excluded), the proportion of manufacturing firms adopting EI decreased between 2008 and 2014. The analysis by Aibar-Guzmán et al. (2022) [58], which examines panel data from 320 major global agro-industries between 2002–2017, reveals a 10% increase in the number of eco-innovators. Triguero et al. (2018) [18] observed a decline in EI adoption among F&B firms during the financial crisis in Spain (2008–2013), though their engagement increased again by 2014 as economic recovery began. During crises, firms often face challenges such as credit constraints, reduced demand, and rising energy costs, which can shift their focus away from environmental goals. Furthermore, policies supporting EI may lose social backing during recessions, as public concern for environmental issues tends to wane during harsh economic times [59]. Additionally, EI, particularly renewable energy technologies, often relies on strong political support, which is vulnerable during economic crises [60]. For example, during the energy price surges caused by the war in Ukraine and EU embargoes, European food producers resisted green regulations that further increased costs (https://www.theguardian.com/environment/2024/feb/02/why-are-farmers-protesting-across-the-eu-and-what-can-the-bloc-do-about-it (accessed on 9 July 2024)). The discussion suggests that EI trends in the F&B sector, like broader innovation trends, may exhibit procyclical behavior.
However, crises can also create opportunities for developing new types of innovation. Suárez (2014) [22], in a longitudinal study of Argentinean firms, observed that, during periods of economic instability, firms adapted their innovation activities to changing circumstances. For instance, currency devaluation spurred export-oriented innovation, even among firms without prior experience in this area. The study suggests that the widely accepted idea of a “virtuous circle”—where past innovation drives current innovation—is disrupted in unstable environments. Instead, new opportunities may emerge, highlighting the need for adaptive strategies during crises.
Firms’ persistence is another crucial factor affecting the evolution of innovations—green and non-green. A review of the literature identifies three key factors contributing to the persistence of innovative activities: the benefits of knowledge accumulation, the principle that “success breeds success”, and the sunk costs associated with initiatives such as establishing an R&D department [61]. Adding a new perspective to the debate, other studies highlight that persistence in innovation varies across sectors, with companies in low-tech industries generally displaying less persistence than those in high-tech sectors [62,63,64]. However, past innovation often serves as a driver for current innovation in the F&B sector, where large firms exhibit consistent patterns of technological accumulation. Alfranca et al. (2002) [54] noted that the world’s largest F&B multinationals frequently sustain innovation through gradual capability building. It is the established innovators who drive significant changes in foodstuffs and introduce new packaging methods among these MNEs. While the influence of past innovations—they note—tends to be lasting, other potential drivers of technological change may only have temporary effects on innovation. In their analysis of Spanish food and beverage firms from 1990 to 2008, Triguero et al. (2018) [18] found that specifically eco-innovative activities, particularly those related to industrial processes, exhibit persistence. However, persistence may also lock firms into pollution-intensive technologies, creating barriers to adopting cleaner alternatives. Cecere et al. (2014) [65] argued that entrenched reliance on existing knowledge, infrastructure, and capital perpetuates pollution-intensive practices.
Different types of innovations display varying patterns of persistence in EI. Le Bas and Poussing (2018) [21] found that, while eco-innovators seeking to reduce negative environmental impacts often exhibit persistence, those focused on resource efficiency (e.g., energy and material savings) are less consistent.
However, studies on the interaction between persistence and business cycles remain limited in the literature on EI, especially in the F&B sector. Most studies on persistence concentrate on periods of economic stability (pre-2008) or times of economic distress (such as the 2008 financial crisis). When studies span both favorable (pre-crisis) and challenging (crisis or post-crisis) economic periods, they often fail to distinguish between these business environments. An exception is Antonioli et al. (2013) [66], who analyze the pre-crisis and the 2008 crisis period, examining the continuity of intense firm-level innovation activities from 2006 to 2009. Their study investigates how manufacturing firms in Emilia-Romagna (Italy) responded to the 2008 crisis in terms of innovation and concludes that “innovation calls for innovation”; this phenomenon occurs even during a crisis. However, a later study found that the persistence of Italian firms that survived the 2008 crisis was only linked to process innovation and radical innovation [25]. García-Sánchez and Rama (2024) [67] identify distinct phases of the business cycle (boom, crisis, and recovery), observing that, although the 2008 crisis initially discouraged cooperative innovation among Spanish firms, companies eventually compensated by gradually acquiring experience. These studies refer to standard innovation, not to EI. However, the interplay between a firm’s persistence and macroeconomic conditions suggests that firms with a strong history of EI may also be better equipped to withstand downturns, maintaining their efforts despite adverse conditions.
Based on the previous discussion, we propose the following hypotheses:
H1: 
The crisis opens new opportunities to adopt eco-innovation for food and beverage firms.
H2: 
Past eco-innovation efforts positively influence the likelihood of future eco-innovation in the food and beverage industry, even in critical periods.
These hypotheses are tested for both efficiency and environmental EI.

2.3.2. Other Key Determinants of Eco-Innovation

To explore institutional interventions and firms’ green strategies during difficult economic times, we must consider factors influencing their adoption beyond past experiences and crises. The literature points to the following key drivers of EI:
Institutional intervention. Porter and van der Linde (1995) [68] introduced the “win–win” proposition, suggesting that environmental regulations could drive innovation by encouraging industries to recognize and take advantage of opportunities they might otherwise overlook. They argued that this process would yield both environmental gains and a boost in competitiveness. This idea has prompted extensive research into how environmental regulation affects innovation; however, empirical findings have remained inconclusive. Bossle et al. (2016) [3] and Hojnik and Ruzzier (2016) [15] highlight regulation and cost savings as major EI drivers, with policy stringency being particularly influential. However, other scholars [69] report mixed results. Regulation’s effectiveness may depend on public R&D funding [70] or alignment with broader policy goals [65]. Regional differences also matter: for instance, regulation appears more effective in promoting EI in Eastern Europe than in Western Europe [13].
In the F&B sector, previous studies suggest regulation and market-push factors are key to EI adoption. Avellaneda Rivera et al. (2018) [71] and Triguero et al. (2018) [18] show that stringent regulation, driven by health concerns, significantly influences EI in Spanish F&B firms. However, in the Spanish wine sector, Calle et al. (2022) [9] find that EI is primarily driven by firm-level decisions rather than regulation. The analysis of the effects of regulation across the business cycle has been rarely addressed in the literature on EI, as is carried out in this article.
While subsidies are important, the literature shows mixed results regarding their effectiveness. In Eastern Europe and China, subsidies are crucial for EI [7,13], but Jové-Llopis and Segarra-Blasco (2018) [72] found little effect in Spain. In their analysis of 301 SMEs in the F&B industry of Castilla-La Mancha (Spain), Cuerva et al. (2014) [73] found that subsidies enhance non-eco-innovations but not EI. These findings suggest that the impact of subsidies can vary significantly across regions, sectors, and types of innovation. Other types of institutional intervention, such as R&D contracts between the government and firms, are rarely addressed in the literature on EI, a gap we aim to tackle in this article. As noted in the Introduction, our primary focus is to understand the role of institutional intervention in influencing the likelihood of firms maintaining their EI activities during challenging economic periods.
Size. In their literature review, Hojnik and Ruzzier (2016) [15] observe that larger companies are more likely to adopt and extensively implement EI. This trend arises from the inherent advantages of large firms in the realm of innovation, such as greater access to financial resources and structured R&D departments. Additionally, because these companies are large and well-known, they must work to reduce their environmental impact to meet the expectations of environmental groups and regulators. In their review of the literature, Bossle et al. (2016) [3] also note that larger companies are more likely to adopt and extensively implement EI. This trend is confirmed in Spanish manufacturing [17] and F&B sectors [18,58,74]. However, some studies challenge the assumption that SMEs are less eco-innovative than large firms [14].
Knowledge base. While R&D is often seen as a key driver of EI in developed countries [75], in developing countries like Chile, R&D may have little effect due to the firms’ difficulties in accessing new knowledge [76]. Additionally, firms with a strong knowledge base in polluting technologies may struggle to transition toward EI [65]. Jové-Llopis and Segarra-Blasco (2018) [72] and Triguero et al. (2018) [18] find that R&D intensity, measured as R&D expenditure per employee, fosters EI in Spanish manufacturing firms, and specifically in the F&B sector. In contrast, Cuerva et al. (2014) [73], in their analysis of F&B companies within a Spanish region, conclude that, while R&D supports standard innovation, it does not necessarily drive EI. These findings highlight that the relationship between R&D and EI is context-dependent, influenced by factors such as industry and region.
Collaboration and external sources of information. Certain authors note that collaboration with external partners, such as clients and suppliers, can be a powerful driver of EI, particularly in the complex and cost-intensive F&B sector [3,18,77]. However, an overreliance on external sources or excessive collaboration can hinder innovation, as seen in a study on manufacturing Spanish firms [72]. Balancing cooperation with various partners is essential to avoid dependency and maximize innovation outcomes [71].
Ownership structure. Certain authors suggest that ownership affects a firm’s eco-innovation strategy. For instance, Aibar-Guzmán et al. (2022) [58] find that, within the group of large global agri-food firms, MNES are more likely to engage in EI due to their greater access to funding and resources, while family-owned firms tend to be more conservative in adopting green technologies. Jové-Llopis and Segarra-Blasco (2018) [72] note that, within the Spanish manufacturing sector, being part of a business group does not guarantee a firm will be a green innovator.
Market-push factors. Expanding market share is identified as a significant motivator for firms to invest in EI [3]. Triguero et al. (2018) [18] found that both market demand and regulatory pressures positively influenced EI adoption in the Spanish F&B industry from 2008 to 2014. However, the literature shows inconsistent results regarding the influence of market-push factors on EI. For instance, Jové-Llopis and Segarra-Blasco (2018) [72] found that market forces did not serve as a primary driver for EI in Spanish manufacturing firms.
To summarize, authors do not agree about the influence of many of these drivers, indicating the need for further research to better understand these dynamics. Table A1 recapitulates key findings on the main drivers of EI identified in selected studies.
Based on the previous discussion, we propose the following research questions:
RQ1:
Which institutional interventions are most effective in fostering eco-innovation during difficult times?
RQ2:
Which corporate green strategies are most effective in fostering eco-innovation during difficult times?
In our analysis, “difficult times” refers to the 2008 crisis and its prolonged and challenging recovery.

3. Methodology

3.1. Data

The PITEC database used in this study is a representative subsample of the Spanish Innovation Survey collected annually by the Spanish National Statistics Institute (INE). A structured questionnaire, following the guidelines of the Oslo Manual, is used for data collection. Both online surveys and telephone interviews are employed to gather the information. The survey serves as Spain’s contribution to the EU’s CIS (https://www.ine.es/dyngs/INEbase/es/operacion.htm?c=Estadistica_C&cid=1254736176755&menu=resultados&secc=1254736195616&idp=1254735576669#_tabs-1254736195616 (accessed on 20 December 2024). However, compared to most CIS-type surveys, PITEC offers the advantage of providing panel data and is based on a mandatory survey. The database provides anonymized micro-data at the firm level on the technological innovation activities across all major sectors of the Spanish economy. The panel employed in this study consists of data from F&B companies that remained continuously active throughout the 2004–2016 period for a total of 8699 observations and 871 F&B firms. As noted, the timeframe is divided into three subperiods reflecting the trajectory of Spanish GDP [78]: 2004–2007 (boom), 2008–2013 (crisis), and 2014–2016 (recovery). In the PITEC database, the concept of innovation is broadly defined, encompassing both innovations that are new to the market and those that are merely new to the firm, even if they already exist in the market. While the latter might be more accurately classified as technology adoption, we will use the term “innovation” to maintain consistency with our data source.
A limitation of the eco-innovator data provided by PITEC is the subjectivity inherent in firms’ self-reported perceptions, a common issue in similar studies. These data reflect firms’ stated considerations for green innovation, rather than the actual performance of their eco-innovations. For instance, we found that 40% of firms that reported saving materials and energy as a highly or moderately important goal had not innovated in the last two years (these firms may have been unsuccessful in their attempts to innovate, may have ongoing innovation projects, or may simply be drawn to the idea of EI without achieving practical outcomes during the analyzed period). To address this and adopt a more objective approach, we limited our sample to firms that had demonstrably innovated. Therefore, our approach is conservative: we define eco-innovators as firms that have innovated within the last two years (whether eco-innovations or non-eco-innovations) and additionally declare a high or moderate importance of green goals when innovating. Another difficulty, as highlighted by Horbach (2016) [13], is that CIS surveys do not provide specific data on R&D for eco-innovation, forcing researchers to depend on general R&D and innovation data. This limitation similarly affects the PITEC data analyzed in this study.
The correlation matrix indicates no significant multicollinearity problem (available upon request).

3.2. Model and Variables

Our research strategy involves an iterative estimation of ten logit models using panel data, with inferences derived from robust panel standard errors. The initial set of models jointly examines the effects of business cycle phases and EI persistence, while controlling for the influence of drivers and other relevant variables:
P E c o E f f i c _ i n n o v = 1   | X i t 1 T , β 1 T , α i = Λ α i + X i t 1 T β 1 T
P E c o E f f i c _ i n n o v = 1   | X i t 2 T , β 2 T , α i = Λ α i + X i t 2 T β 2 T
P E c o E n v i r o n _ i n n o v = 1   | X i t 1 T , β 1 T , α i = Λ α i + X i t 1 T β 1 T
P E c o E n v i r o n _ i n n o v = 1   | X i t 2 T , β 2 T , α i = Λ α i + X i t 2 T β 2 T
In models 1 and 3, X i t 1 T includes the full set of EI drivers and control variables listed in Appendix A (Table A2) and the categorical variable crisis; the corresponding parameters are denoted by β 1 T . In models (2) and (4), X i t 2 T includes the variables identifying the persistence in both EI types in addition to X i t 1 T , β 2 T representing the corresponding parameters.
The second set aims to identify differences in the influence of drivers across various phases of the business cycle, while controlling for other variables. To achieve this, we segmented our sample into three periods: boom (2004–2007), crisis (2008–2013), and recovery (2014–2016). We then estimated six models ((5)–(10)): models (5)–(7) focused on eco-efficiency innovations during the boom, crisis, and recovery periods, respectively, while models (8)–(10) addressed eco-environmental innovations across the same business cycle phases. In other words, each EI type was analyzed using three models, one for each phase of the business cycle.
P E c o E f f i c _ i n n o v = 1   | X i t 3 T 0 , β 3 T 0 , α i = Λ α i + X i t 3 T 0 β 3 T 0
P E c o E f f i c _ i n n o v = 1   | X i t 3 T 1 , β 3 T 1 , α i = Λ α i + X i t 3 T 1 β 3 T 1
P E c o E f f i c _ i n n o v = 1   | X i t 3 T 2 , β 3 T 2 , α i = Λ α i + X i t 3 T 2 β 3 T 2
P E c o E n v i r o n _ i n n o v = 1   | X i t 3 T 0 , β 3 T 0 , α i = Λ α i + X i t 3 T 0 β 3 T 0
P E c o E n v i r o n _ i n n o v = 1   | X i t 3 T 1 , β 3 T 1 , α i = Λ α i + X i t 3 T 1 β 3 T 1
P E c o E n v i r o n _ i n n o v = 1   | X i t 3 T 2 , β 3 T 2 , α i = Λ α i + X i t 3 T 2 β 3 T 2
Our independent variable sets denoted as X i t 3 T j include the whole set of EI drivers, the control variables set, and the variables capturing persistence in both EI types. The business cycle phases are represented by j = 0 ,   1 ,   2 , with the corresponding parameters denoted as β 3 T j .
To address arbitrary autocorrelation and heteroskedasticity, we apply robust panel standard errors. Additionally, we use “persistence adjustment” as an instrument to correct the effects of autocorrelation. Lastly, alternative model specifications incorporating lags in “persistence variables” and additional lagged independent variables were tested, with no significant changes in the results’ significance.

3.3. Dependent Variables

The questionnaire measures the degree of importance a firm assigns to saving materials and energy, as well as avoiding environmental harm during the innovation process, using a 4-point Likert scale. We classify as eco-innovators those innovative firms that indicated green considerations were either very important or moderately important in their innovation processes (corresponding to responses 4 and 3 on the Likert scale).
EcoEffic_innov is a dummy variable that equals 1 if the firm’s innovation goal is primarily or moderately focused on saving materials or energy per unit of output in the two previous years. This variable indicates whether the firm engaged in efficiency EI in both of the previous two years, not just one.
EcoEnviron_innov is a dummy variable set to 1 if the firm’s innovation goal is primarily or moderately focused on reducing environmental impact in the two previous years. This variable indicates whether the firm engaged in environmental EI in both of the previous two years, not just one.

3.4. Independent Variables

Only the variables of primary interest are presented below. Table A2 provides a description of the complete set of variables and their frequencies.
The variables of primary interest are those that delineate the effects of the 2008–2013 crisis and the firm’s past eco-innovation on current eco-innovation.
Crisis: 2004–2007 is our base category; crisis 2008–2013; recovery 2014→
PersistEcoEffic: Dummy variable that equals 1 if the firm performed efficiency eco-innovation in t 1 and t 2 .
PersistEcoEnvIron: Dummy variable that equals 1 if the firm performed environmental eco-innovation in t 1 and t 2 .
The variables are constructed as dichotomous indicators, taking the value 1 if both lag 1 and lag 2 are equal to 1 (indicating effective persistence). In this sense, they can be considered “double-lagged” variables, as they are derived from the combination of lag 1 and lag 2. However, they are not directly lagged values; instead, they are composite variables that take the value 1 when both corresponding lagged values are 1 and 0 otherwise.
Building on the methodology of Hojnik and Ruzzier (2016) [15], we classify our set of EI drivers into motivation-based and facilitating factors.
Motivation-based drivers of EI include regulation, which is also a variable of interest, competitive forces, the anticipation of innovation benefits, and market factors that either encourage or hinder innovation.
Regulation. The questionnaire asks firms whether they consider environmental, health, and safety regulations when innovating, with responses on a 4-point Likert scale (high, moderate, reduced, not relevant). The “reduced” response serves as the base category, as we expect a positive effect associated with a stronger perception, which turns negative when associated with “not relevant”.
Facilitating factors include financial resources (such as private and public funds, contracts, and subsidies), technological capabilities (including innovative efforts, cooperative behavior, and spillovers), and the innovation class (product innovator, process innovator, or both).
As control variables, size is controlled using a categorical variable. Instead of employing a VIF size index, we classify firms into size categories: micro-firms (<10 employees), medium firms (50–249 employees), medium–large firms (250–999 employees), and large firms (≥1000 employees). Small firms (11–49 employees) serve as the base category. This approach aims to address concerns of multicollinearity and aligns with the concept of a threshold for engaging in innovation in this industry [8]. The results remain congruent and robust across these classes. Ownership identifies domestic and foreign capital (multinational), and group belonging is accounted for (independent). Industry effects are controlled by using dummy variables to compare a firm’s data with the Spanish F&B industry average.

4. Contextual Setting and Descriptive Statistics

4.1. Contextual Setting

According to European Innovation Scoreboard, Spain is categorized as a moderate innovator. It is also a medium adopter of environmental regulation, positioned behind Denmark but ahead of Italy [16]. Moreover, Spain produces a substantial volume of environmental regulations, surpassing France [79]. As a member country of the EU, Spain is subject to stringent environmental regulations regarding specifically F&B and packaging.
In 2012, at the height of the crisis, the carbon intensity of the Spanish economy was already below the Organisation for Economic Co-operation and Development (OECD) average, reflecting the increasing share of renewables. Leveraging its abundant solar and wind resources, Spain has since made significant strides in renewable energy development, particularly during the ongoing European energy crisis. Efforts have focused on expanding capacity, attracting investments, and establishing regulatory frameworks to ensure sustainable growth. Spain is actively working to position itself as a leading producer of green hydrogen in Europe. By 2024, approximately 52% of Spain’s electricity production came from renewable sources, with ongoing projects targeting an increase to 81% by 2030. Unlike other European countries, Spain has not reverted to using coal during the current energy crisis (information on the evolution of EI in different economies and regulatory environments beyond Spain can be found in OECD environmental reports, which primarily focus on developed countries. https://www.oecd.org/en/topics/environmental-country-reviews.html (accessed on 7 January 2025)). The perceptions of firms regarding the importance of EI and their views on green regulation, as analyzed in this article, provide insights into their preparedness to confront future crises.
Austerity policies, high unemployment rates, precarious jobs, and a growing population affected by poverty all influenced food consumption patterns during the Spanish 2008 crisis [80]. Using data from the National Health Survey and the European Health Survey in Spain, the aforementioned authors found that the Mediterranean diet (characterized by an abundant consumption of fruits, vegetables, bread and other cereals, olive oil as the main source of fat, moderate wine intake, low to moderate consumption of dairy products, fish, poultry, and eggs, and low consumption of meat and cured meats) remained largely unchanged during the 2008 crisis. The notable exceptions were a decrease in the consumption of fruit and fish and an increase in the consumption of more affordable pulses. In their view, solid cultural traditions and cooking skills helped maintain dietary stability despite the harsh macroeconomic conditions. However, they also noted that the crisis led to a preference for cheaper brands, a reduction in household food waste, and a greater focus on cooking at home.
Additionally, during the 2008 global crisis, Eurobarometer data indicated a shift in environmental concern among both the Spanish population and the wider EU population. As noted by Cicuéndez-Santamaria (2024) [59], this concern generally declined, likely because economic issues took precedence during that challenging period. Eurobarometer data show that, in 2007, just before the onset of the global crisis, 64% of Spaniards considered the environment very important. However, this percentage fell to 56% at the peak of the crisis in 2011 [59]. By 2020, this figure had risen again to 63%, illustrating the impact of economic cycles on environmental perceptions. The discussion highlights the need to investigate the influence of market factors, particularly during critical periods, due to their potential impact on shaping EI. The 2008 financial crisis also significantly impacted Spain in other ways, leading to a decline in innovation investment and reductions in public R&D spending [30,81]. Spanish annual green expenditures—including those by the state, firms, and households—dropped significantly following the onset of the 2008 crisis and only began to increase again with the economic recovery starting in 2014 (Figure 1).

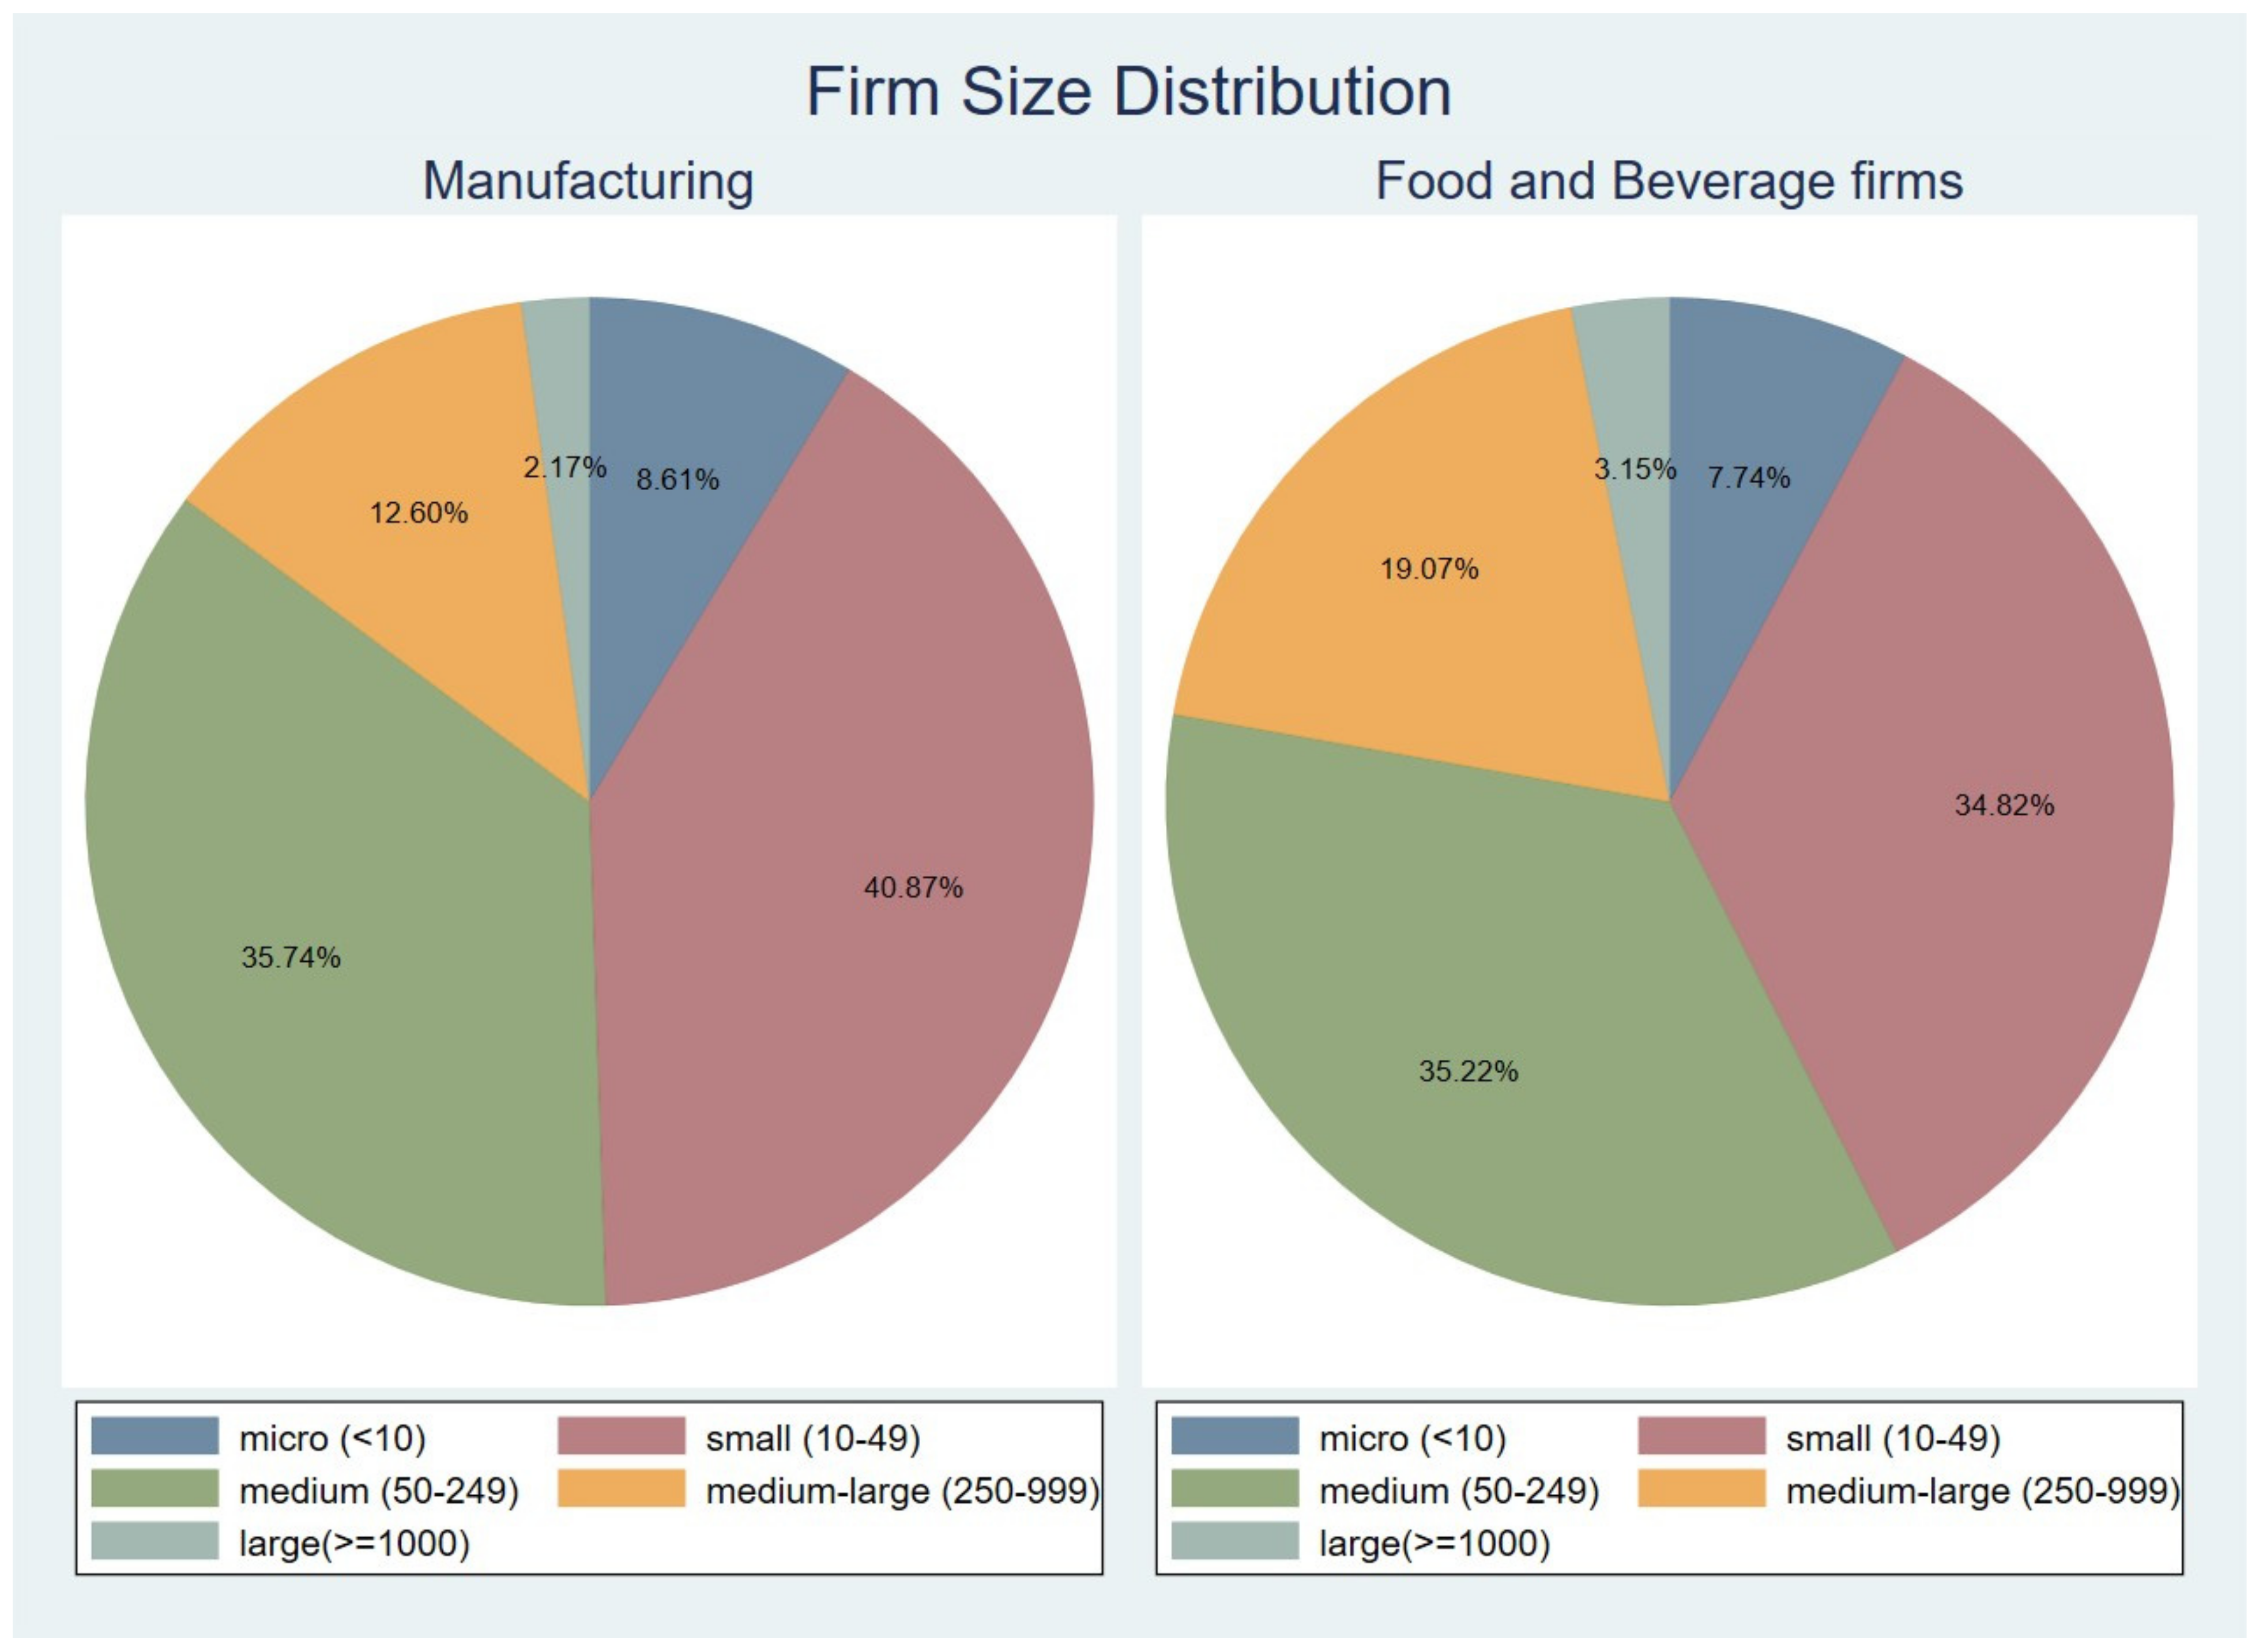
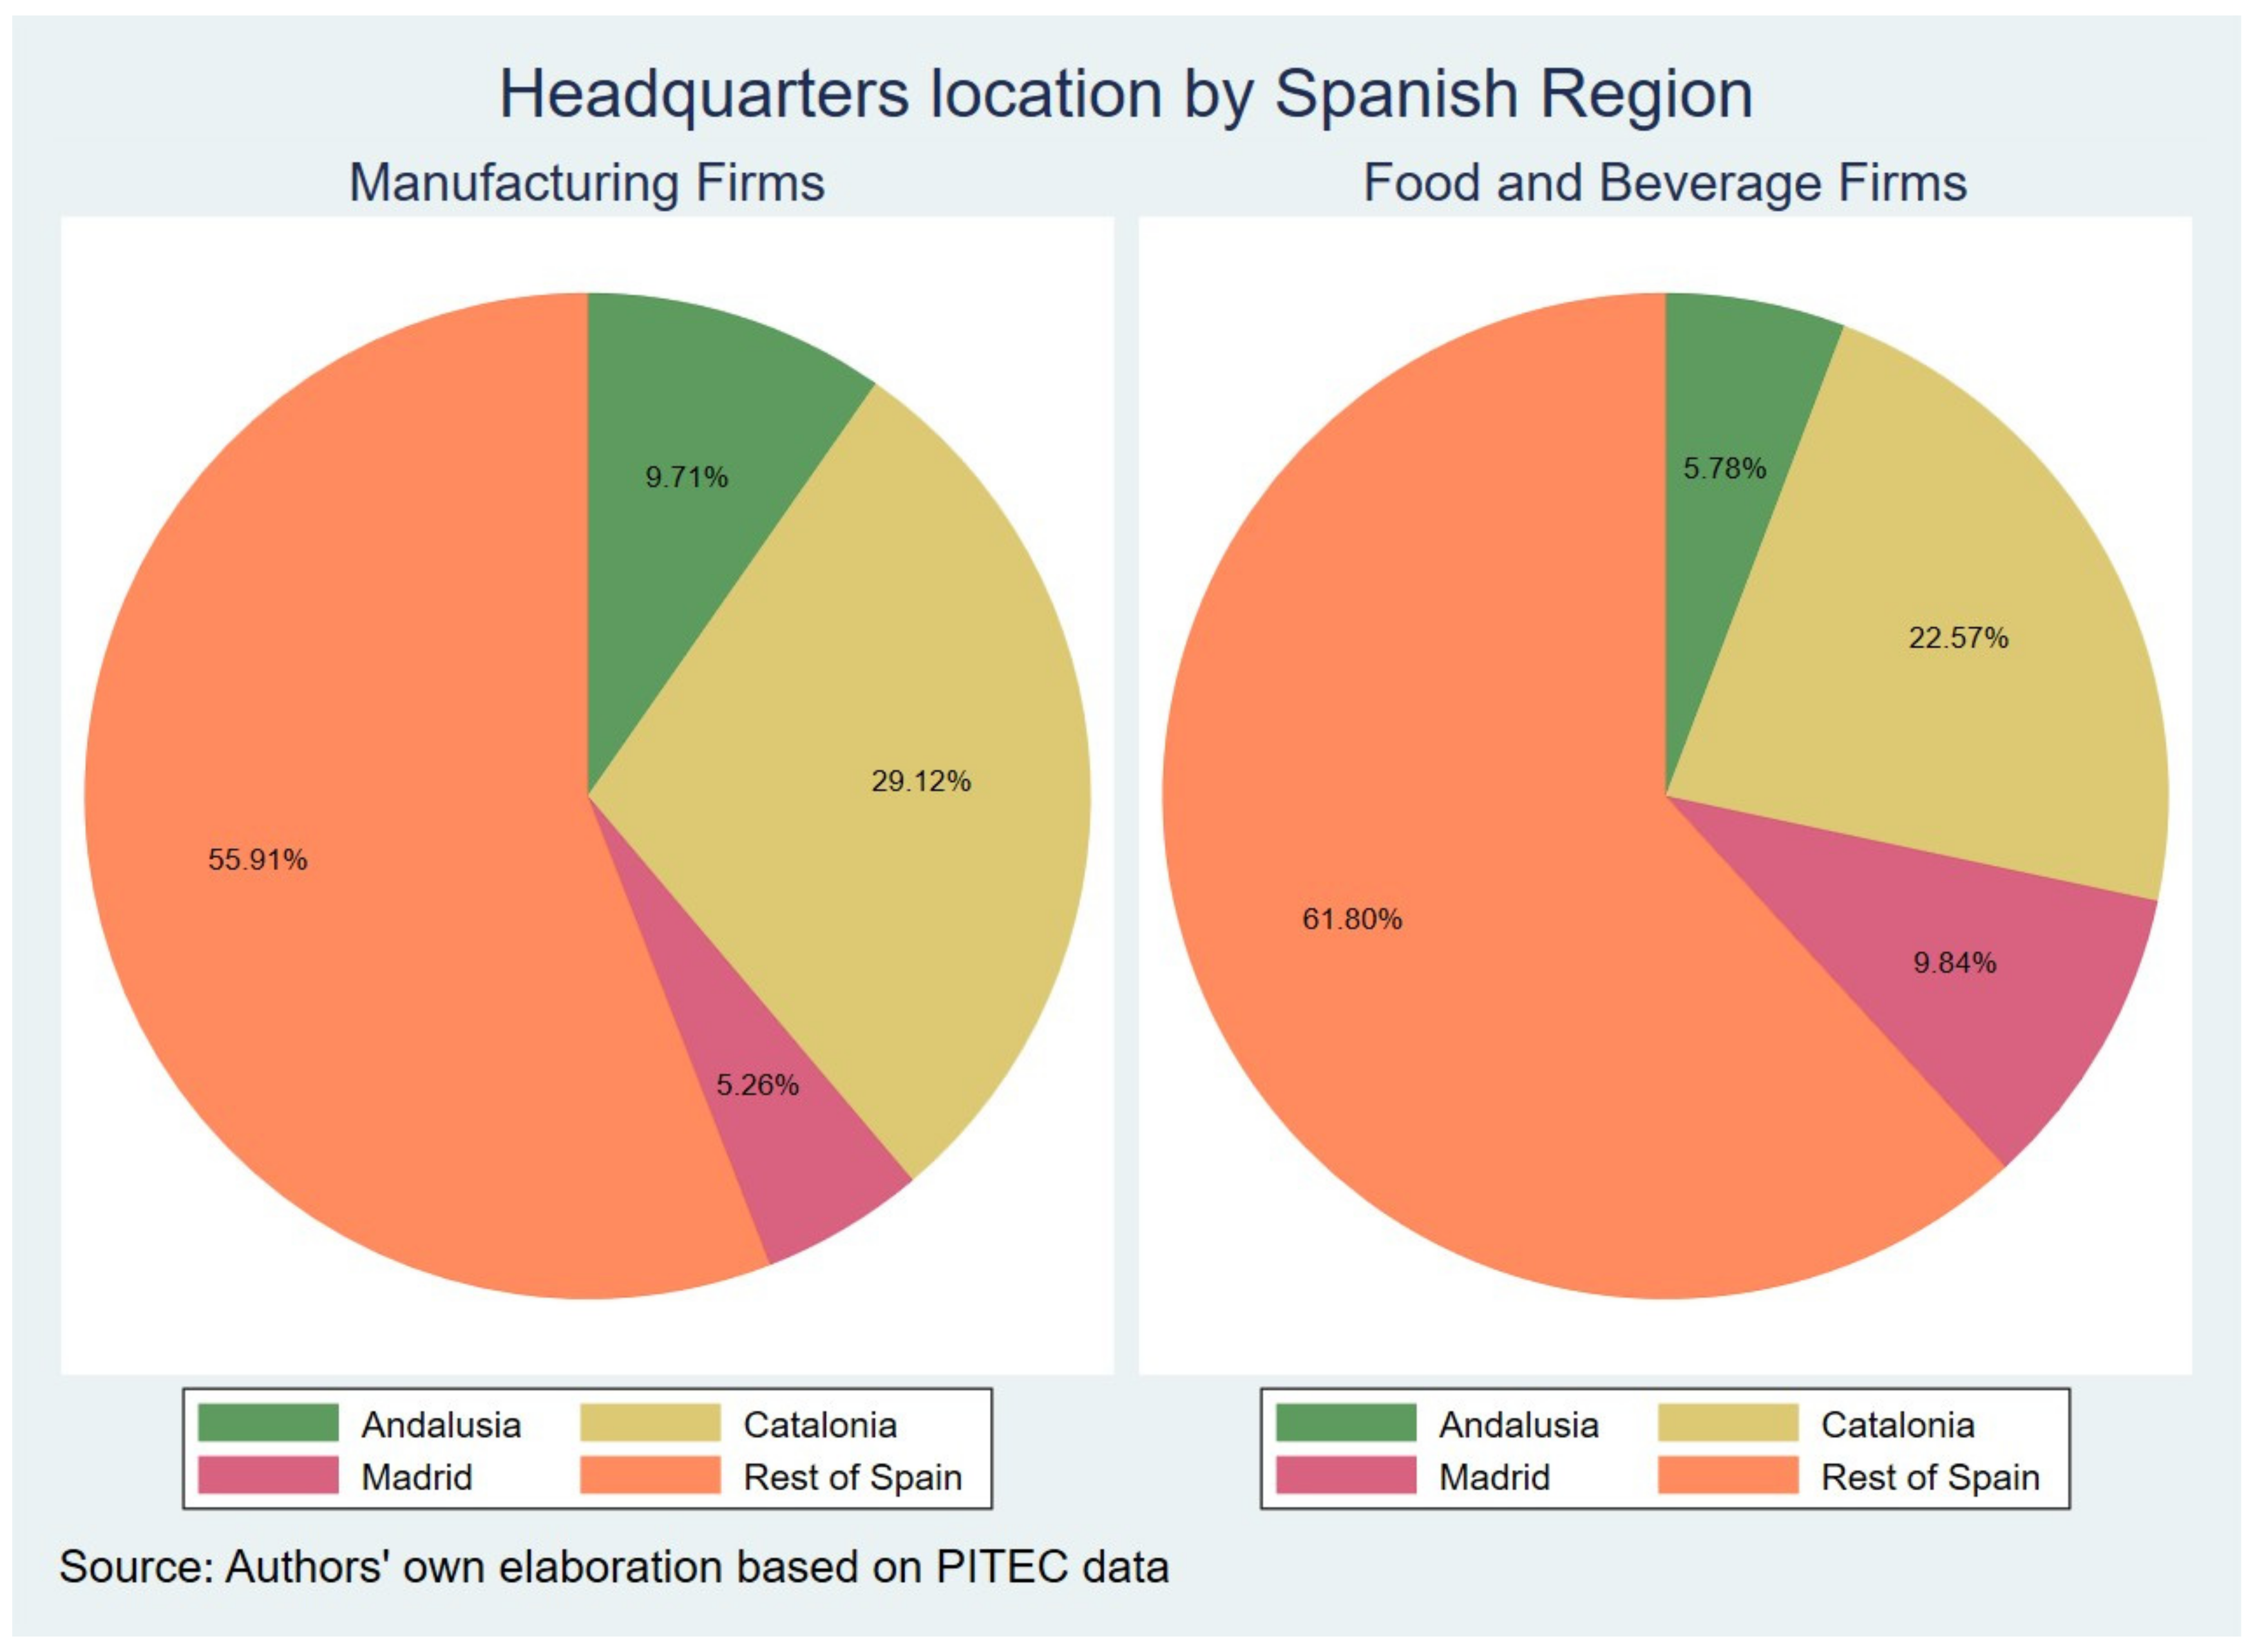
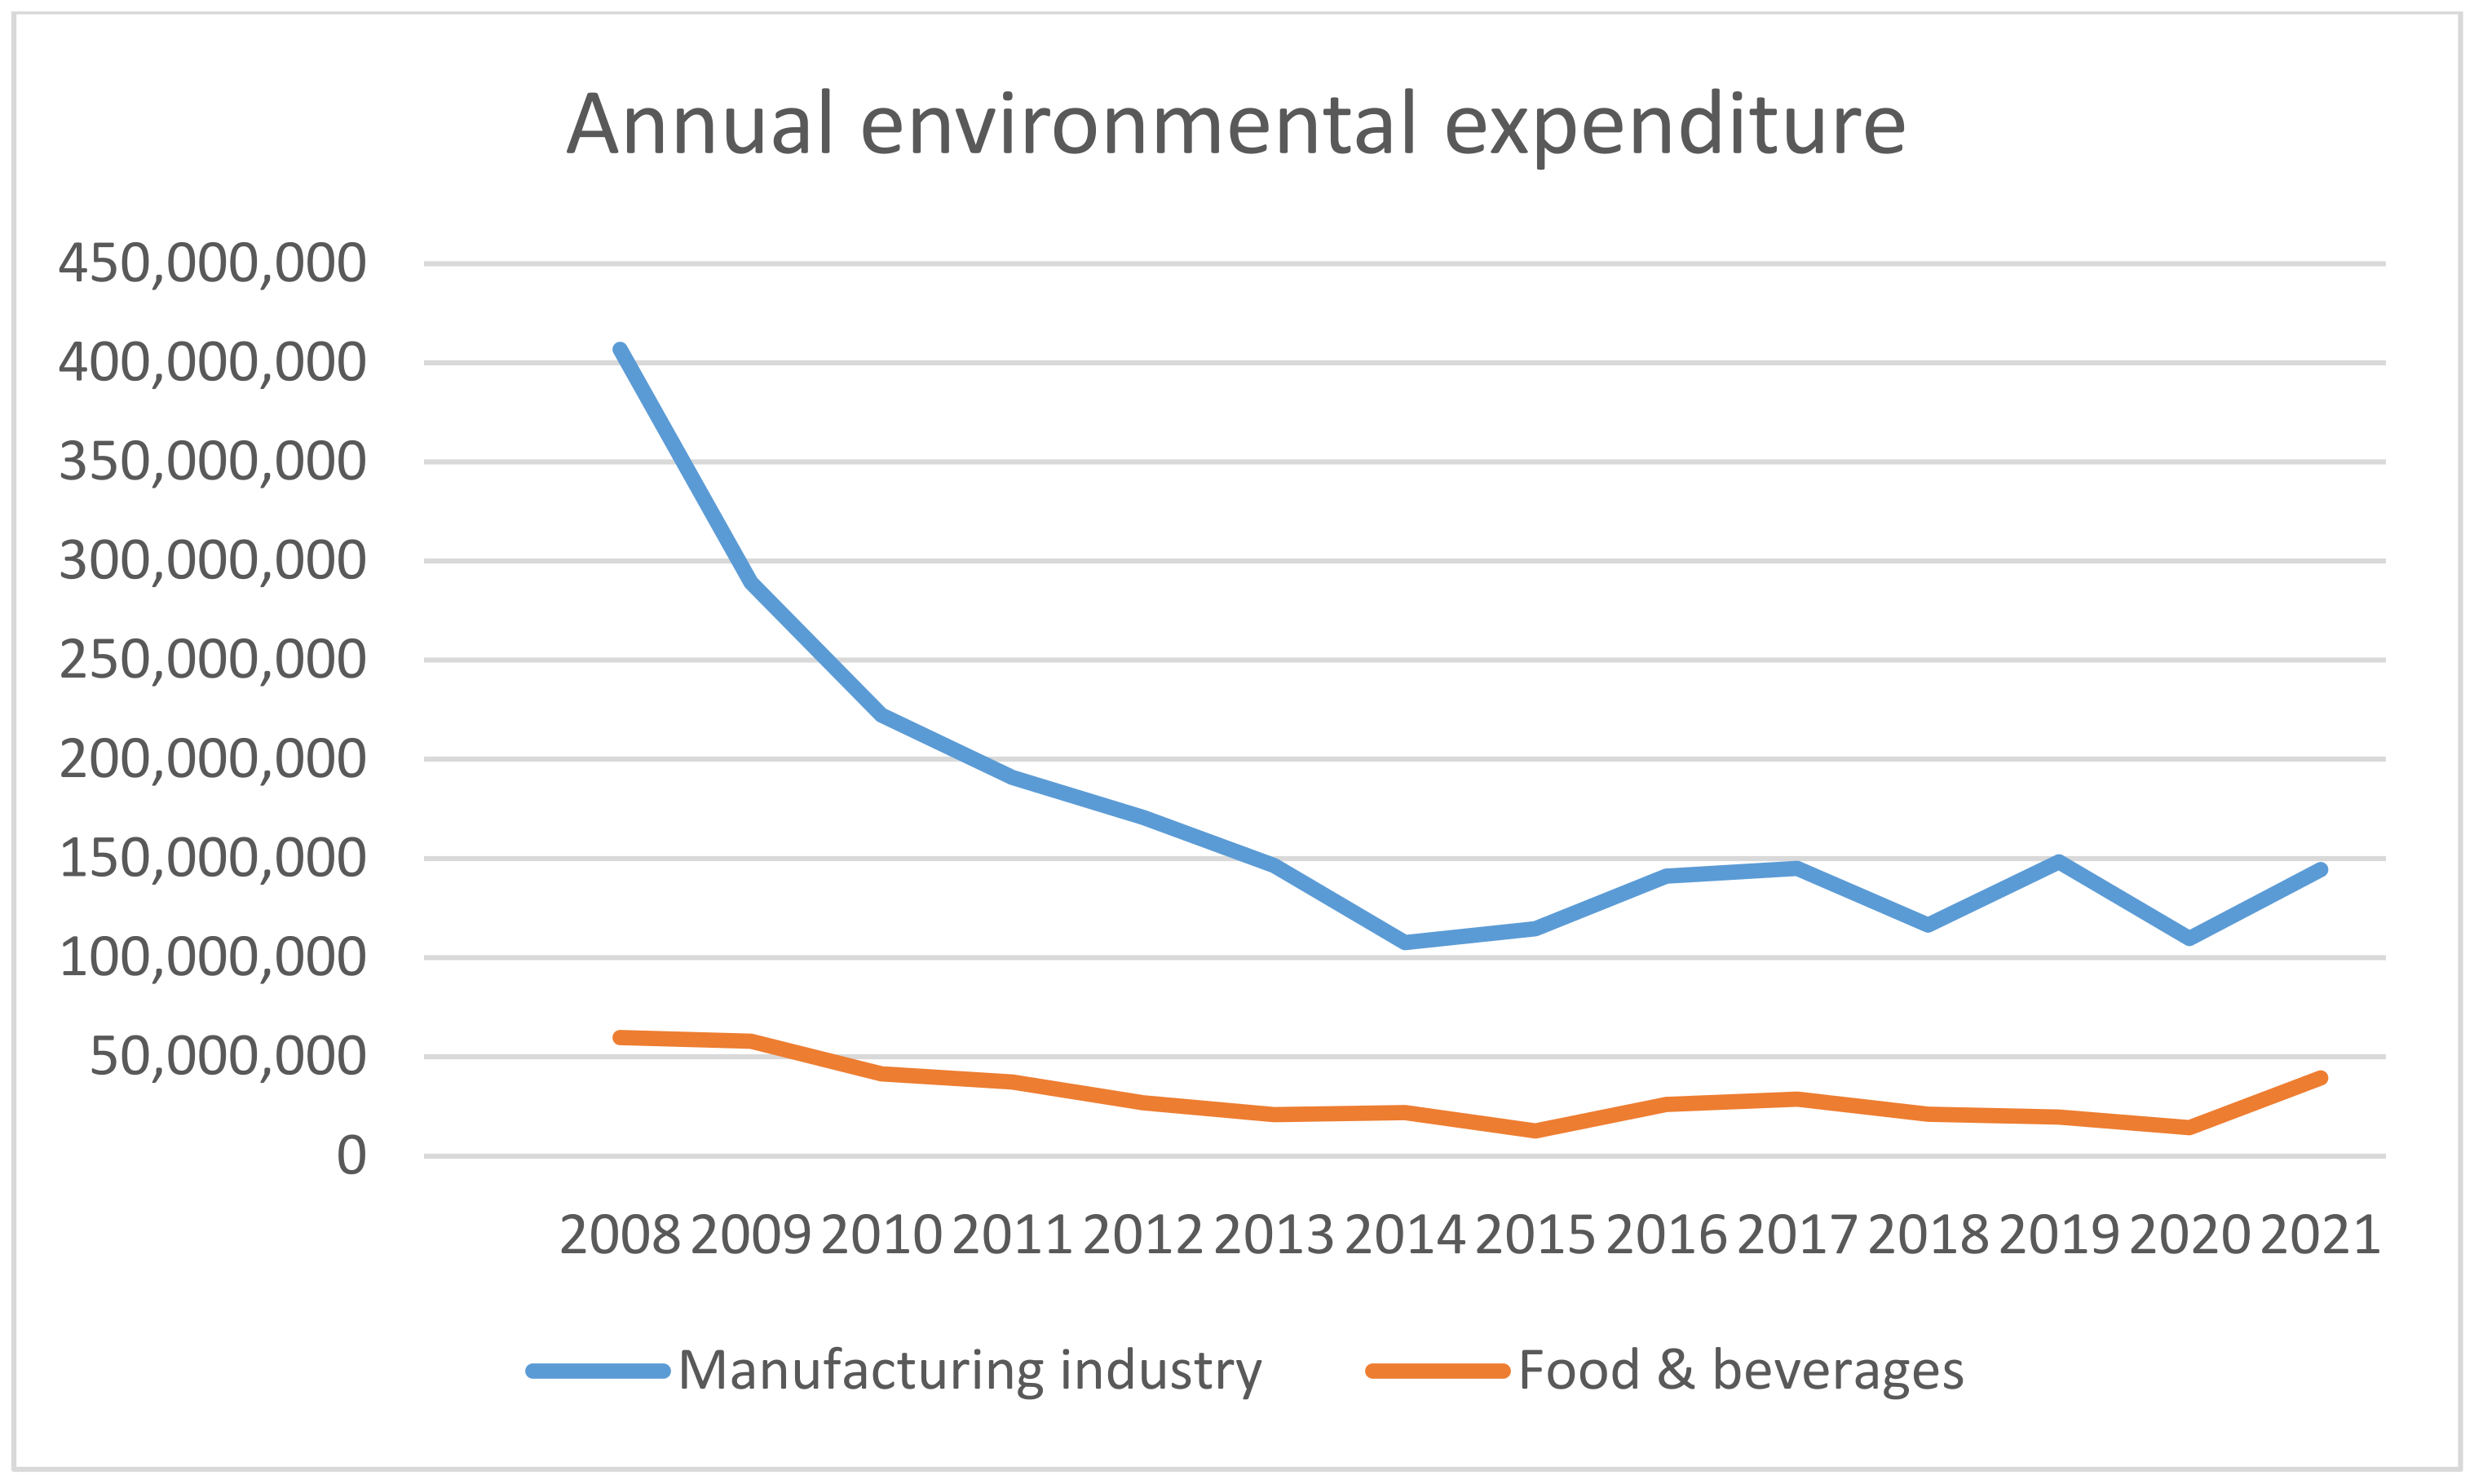
4.2. Descriptive Analysis: Key Trends in Innovation and Sustainability

Table A2 presents the frequencies of the variables employed in the econometric analysis. The following section provides descriptive statistics for the period 2004–2016, offering insights into the characteristics of the sample.
Firm Size Distribution
Figure A1 illustrates the distribution of firms by size, highlighting the predominance of SMEs. This pattern is consistent with the overall structure of the Spanish manufacturing sector, where SMEs constitute the majority of firms.
Geographic Distribution
Figure A2 depicts the geographic distribution of the sample based on company headquarters. The findings indicate that F&B firms exhibit a more dispersed presence across Spain compared to the broader manufacturing sector. However, Catalonia remains a major hub, concentrating a significant share of both F&B firms and manufacturing companies overall.
Innovation and R&D: Distinct but Interconnected
In the sample, 51% of firms reported conducting internal R&D over the past two years. However, the proportion of firms identifying as innovators is considerably higher, at 89%, suggesting that innovation frequently extends beyond formal R&D activities.
Environmental Considerations
Firms demonstrate varying levels of commitment to environmentally driven innovation. While 54% assign high or medium importance to compliance with environmental regulations, approximately 30% indicate that regulatory factors do not influence their innovation activities. Notably, the likelihood of prioritizing environmental compliance increases with firm size, as evidenced by a statistically significant relationship (chi2 = 158.1058; Pr = 0.000; Cramér’s V = 0.0890).
Beyond regulatory compliance, resource efficiency emerges as a key driver of innovation. A substantial 60% of firms consider reducing material and energy consumption per unit of production to be a highly or moderately important objective, whereas only 14% regard it as unimportant. Firm size plays a role in shaping these priorities: 34% of medium–large firms and 45% of large firms emphasize resource efficiency in their innovation strategies. A Pearson chi2 test confirms a positive association between firm size and the prioritization of energy and material efficiency in innovation (chi2 = 247.9819; Pr = 0.000; Cramér’s V = 0.0973). However, smaller firms are also engaged in such efforts, with 59% of micro-firms reporting that they consider this objective important.
Environmental Harm Reduction: A Secondary Concern?
Regarding efforts to minimize environmental harm through innovation, 52% of firms assign this goal high or moderate importance. Although firm size appears to be a factor, the statistical association remains relatively weak (chi2 = 211.9720; Pr = 0.000; Cramér’s V = 0.1031).
The Influence of Location and Market Scope
The geographical location of firms and the scope of their markets appear to shape their environmental priorities. Firms in Andalucía, for example, place particular emphasis on resource efficiency, with 46% considering it a highly important innovation objective—substantially above the national average of 36%. However, regional differences are less pronounced regarding the goal of minimizing environmental harm. Instead, market scope appears to be a more significant determinant. Firms operating primarily in local or regional markets are more likely to prioritize material and energy savings in their innovation strategies, with 55% rating this goal as highly important, compared to 35% across all firms. Conversely, these firms are less inclined to prioritize environmental protection (17% vs. 24%) or regulatory compliance (24% vs. 28%). This pattern suggests that firms operating within geographically restricted markets, often with limited resources and cost constraints, emphasize efficiency-driven sustainability over broader environmental objectives.
Eco-Innovation Across Business Cycles: Patterns of Adoption and Persistence
An analysis of eco-innovation trends across different phases of the business cycle reveals a shift in firm behavior. The share of efficiency-driven eco-innovators increased from 32% during the economic boom (2004–2007) to 35% during the 2008 crisis, maintaining this level throughout the recovery period. Statistical tests confirm an association between these variables (Pearson chi2(2) = 7.6135, Pr = 0.022, Cramér’s V = 0.0296). A similar pattern emerges for environmental eco-innovators, whose prevalence rose from 45% in the boom years to 50% during both the crisis and recovery phases (Pearson chi2(2) = 14.5062, Pr = 0.001, Cramér’s V = 0.0468). These findings diverge from those of Ghisetti (2017) [10], who observed different trends in other countries and sectors. However, they align with those of Jové-Llopis and Segarra Blasco (2018) [72], who documented a rising ecological awareness among Spanish manufacturing firms between 2008 and 2014. The increase in EI rates during the crisis and recovery suggests that firms adopted a countercyclical strategy, using innovation as a tool for resilience rather than retreating to pre-crisis practices. This may reflect a broader cultural shift towards sustainability in the industry, where firms not only responded to short-term pressures but also integrated long-term environmental considerations into their business models.
Persistence in Eco-Innovation: A Snowball Effect?
While overall eco-innovation rates rose moderately, persistent eco-innovators—those engaging in eco-innovation in both t − 1 and t − 2—remained a minority compared to the broader eco-innovator group, which includes both sporadic and continuous innovators. During the boom period, only 12% of firms qualified as persistent efficiency eco-innovators, and a mere 7% as persistent environmental eco-innovators (Figure A3).
However, as the crisis unfolded, the percentage of persistent eco-innovators grew at a much faster rate than the overall eco-innovator group. In fact, the share of both persistent efficiency and persistent environmental eco-innovators more than doubled during the crisis and recovery, suggesting a snowball effect—firms that remained committed to eco-innovation likely reinforced their competitive advantages, deepening their engagement over time. This trend contrasts with findings from Antonioli and Montresor (2021) [25] for Italian firms from 2005–2013, where persistent EI was limited among companies that survived the 2008 crisis. A potential explanation for our results is that the sample consists exclusively of surviving firms—those that ceased operations due to the crisis are not included, a limitation shared with previous studies [25]. Firms that struggled to adopt eco-innovation strategies may have been disproportionately affected by the crisis and subsequently exited the market. This could mean that the observed rise in persistent eco-innovation is partly a survivor effect, where firms already committed to sustainability were better equipped to endure economic turbulence. However, our data do not allow us to test this hypothesis directly.

5. Results and Discussion

5.1. Persistence and Crisis

Table 1 presents the drivers of EI over the full 2004–2016 period, reporting only the marginal effects (dy/dx) of statistically significant variables. Models 1 and 3 exclude persistence variables and examine the probability that a firm engages in efficiency EI and environmental EI, respectively. Models 2 and 4 introduce persistence variables—PersistEcoEffic and PersistEcoEnvIron—to account for firms’ historical innovation tendencies. Models that exclude the persistence variable are referred to as apparent models, whereas those that include it are termed persistence-adjusted models.
Table 2 breaks down the marginal effects of EI drivers across three distinct periods: 2004–2007 (boom), 2008–2013 (crisis), and 2014–2016 (recovery). Both tables distinguish between efficiency EI (reducing materials and energy use per unit produced) and environmental EI (avoiding harm to the environment).
A statistically significant coefficient, negative or positive, indicates that the variable’s associated driver has either a negative or positive impact on the probability that a firm engages in EI. Marginal effects, in turn, reflect the likelihood—whether high or low—of this probability. The comparisons below focus on the marginal effects of statistically significant variables.
In Table 1, the variable crisis 2008–2013 has a positive and statistically significant coefficient in models 1 and 3. This suggests that the crisis period apparently increased the likelihood of firms engaging in both types of EI compared to the pre-crisis period. However, these results do not clarify whether firms adopted EI as a strategic response to economic hardship or whether other factors contributed to this increase. We explore this issue further below.
When the PersistEcoEffic variable is included in model 2 (Table 1), the crisis coefficient remains positive and significant, but its marginal effect decreases. This indicates that persistent efficiency EI partially accounts for the effect initially attributed to the crisis. Specifically, during the crisis, the likelihood of engaging in efficiency EI increases by 9% compared to the pre-crisis period in model 1. With PersistEcoEffic included, this likelihood rises by only 5%. This suggests that broader trends in persistent innovation, rather than crisis-specific strategies alone, influenced firms’ efficiency EI during this period. Persistence thus moderates the impact of the crisis, reducing the emphasis on crisis-driven strategies. The situation differs for environmental EI. During the crisis, the likelihood of environmental EI apparently increased by 4% compared to the base period (model 3). However, when the PersistEcoEnvIron variable is included in model 4, the coefficient for the 2008–2013 period becomes statistically insignificant. This indicates that persistence is a critical driver of firms’ environmental innovation efforts, while the crisis itself is not significant.
In summary, the crisis primarily stimulated the adoption of material- and energy-saving technologies, likely as cost-control measures during economic hardship. However, the crisis had a neutral effect on environmental innovations, which depend more on consumer demand than efficiency-focused EI. Notably, despite the economic downturn, firms maintained their commitment to environmental EI. This neutrality may reflect opposing consumer trends during the crisis, which effectively cancelled each other out. We are unable to test this interpretation since the database does not provide data on the sales of green products. However, secondary information clearly supports it (Section 4.1). Rising price sensitivity during the crisis led more consumers to opt for lower-priced items (Ministerio de Medioambiente y de Medio Ambiente Rural y Marino, Observatorio de Comsumo y Distribución Alimentaria), likely reducing demand for costlier green products [80,82]. However, a growing emphasis on quality, with informed consumers prioritizing food standards, may have simultaneously supported green consumption. In Spain, consumer focus on product quality increased from 57% to 70% in 2010 (ibidem). These contrasting trends suggest a complex consumer landscape, where both cost-consciousness and quality awareness influenced the demand for green products. Stable demand for green products in premium domestic markets or affluent international markets may also help explain this trend of environmental EI. We return to this question below.
Hypothesis 1, which posits that the crisis creates new opportunities for F&B firms to adopt EI, is only partially supported. While the crisis drove the adoption of material- and energy-saving technologies, it did not significantly encourage environmental EI. Our findings align with Suárez (2014) [22], suggesting that crises can create new opportunities—in this case, opportunities for eco-innovation. However, the effect is only noticeable for efficiency-focused EI.
How do persistent green innovators perform during a crisis? Table 2 demonstrates that the positive effect of PersistEcoEffic remains consistent during challenging periods—crisis and recovery. Despite the challenges Spanish firms faced during the 2008 crisis (Introduction), F&B companies with a history of EI were 18% more likely to adopt efficiency-driven EI during the crisis and 28% more likely during the recovery—a particularly difficult period for Spain (Table 2). Similarly, PersistEcoEnviron, the variable indicating persistence in environmental EI, also has a consistent effect across the business cycle (Table 2). Firms persistent in environmental EI are 9% to 13% more likely to engage in this type of innovation than non-persistent firms throughout the business cycle. In summary, firms in the Spanish F&B industry with a history of EI are more likely to maintain or increase their EI activities during economic downturns compared to firms without such a history. These results support Hypothesis 2 (Past eco-innovation efforts positively influence the likelihood of future eco-innovation in the food and beverage industry, even in critical periods). In other words, past eco-innovative investments increase the likelihood that a firm will adopt green production practices in the future, even during periods of economic decline. This may be attributed to accumulated expertise and well-established EI practices. Our findings align with Alfranca et al. (2002) [54] regarding patterns of technological change in the F&B industry, highlighting the enduring influence of past innovations compared to other drivers of innovation.

5.2. Motivation-Based Drivers of Eco-Innovation

Let us now begin analyzing motivation-based drivers, following the methodology of Hojnik and Ruzzier (2016) [15].
Regulation has the stronger effect. The coefficient of the non-relevant-regul category is consistently negative and statistically significant during the 2004–2016 period (Table 1). Firms that consider regulation irrelevant to their innovation efforts are consistently less likely than their counterparts to engage in any form of EI. Conversely, high-regul has a positive and statistically significant coefficient in models 2 and 4 (Table 1). This indicates that, over the entire period, firms that reported placing high importance on regulation when engaging in innovation were more likely to perform EI. Specifically, firms that declared regulation as highly important were 23% and 49% more likely to engage in efficiency EI and environmental EI, respectively. A similar pattern is observed with the medium-regul variable, which represents firms attributing moderate importance to regulation in their innovation activities. These findings align with Ben Amara and Chen’s (2022) [12] analysis of Tunisian agri-food firms, as well as Bossle et al. (2016) [3]. Notably, they are consistent with Avellaneda Rivera et al. (2018) [71] and Triguero et al. (2018) [18], who emphasize the significant role of regulation in driving EI in Spanish F&B firms.
The comparison of marginal effects for the high-regul and medium-regul variables suggests that the relationship between regulation and a firm’s likelihood of pursuing EI is stronger for environmental EI than for efficiency-oriented EI (Table 1, models 2 and 4). Analysis by business cycle phase further supports this observation (Table 2). Firms that highly consider regulation when innovating have a 21% to 27% higher likelihood of engaging in efficiency EI throughout the business cycle, while their probability of engaging in environmental EI is significantly higher—ranging from 44% to 70% compared to their counterparts. A similar trend is evident for firms that moderately value regulation. This disparity likely shows that firms adopt cost-saving technologies to reduce material and energy use at different business cycle stages. Although regulations also play a role, the adoption of efficiency EI is primarily driven by company decisions. Our findings align with Caravella and Crespi (2020) [83], who examined Italian manufacturing firms and found that cost-saving motivations are stronger drivers of EI than green state interventions. Notably, neither Spain nor Italy is self-sufficient in energy production. (Spain’s energy imports rose from 1.3% of its GDP in 1995 to 3% in 2019. This growth in energy imports has made Spain increasingly reliant on external energy sources. https://www.bde.es/f/webbe/SES/Secciones/Publicaciones/PublicacionesSeriadas/DocumentosOcasionales/24/Files/do2424e.pdf, EU Policies for the Green Transition, Banco de España, 2024 (accessed on 4 March 2025)).
In contrast, environmental EI appears to be more strongly driven by green regulation. This type of innovation is often riskier, making firms less likely to pursue it independently. However, green regulations may have encouraged firms to capitalize on opportunities they might otherwise overlook, such as exporting green products, as suggested by Porter and Linde (1995) [68]. Our findings support previous studies in observing that the current trend toward EI extends beyond mere compliance with green regulation [3,60]. However, our results indicate that this observation is especially applicable to efficiency-oriented EI, particularly in energy-scarce countries like Spain.
The subjective importance firms assigned to regulation (both high-regul and medium-regul) decreased slightly during the crisis but increased significantly during the recovery that followed. This pattern may be explained by a general decline in environmental concerns in Spain during the crisis, as more immediate issues took precedence, and a resurgence of these concerns during the recovery [59]. Another explanation is that governments might implement less ambitious green policies during times of crisis, as suggested by the study of Mora-Sanguinetti and Atienza-Maeso (2024) [79] for energy regulation in Spain. However, our data do not allow us to test this hypothesis directly, since, as stated, PITEC provides information based on the subjective perceptions of firms rather than objective data on regulation
Market-push factors are also considered motivation-based drivers, encompassing a firm’s market orientation, including the market’s scope, and the certainty or uncertainty of demand. In our sample, exporters (EU & EFTA and rest of the world) are approximately 5% more likely than non-exporters to implement environmental EI, a strategy more closely aligned with market orientation than efficiency EI, which is primarily cost-focused (Table 1). Exporters are often better positioned to adopt EI due to higher customer expectations, compliance with international standards, and competitive differentiation. Our findings align with those of Arranz et al. (2019) [6] for Spanish firms and with the literature review by Galera-Quiles et al. (2021) [4]. Moreover, Spanish F&B companies employed various strategies to navigate the crisis. One significant approach was increasing exports, which grew by 125% from 2009 at the onset of the crisis to the recovery period before the COVID-19 pandemic, underscoring the competitiveness of these firms. Table 2 shows that the greatest impact of market scope occurs among firms exporting to other European countries (EU28+EFTA) during the recovery. These firms are 15% more likely to adopt environmental EI compared to their non-exporting counterparts. Regulatory requirements for food safety and environmental sustainability in many other countries may be less stringent compared to European markets. This could reduce the external push for exporters to adopt environmental EI when targeting these markets. Sample exporters responded at a time when European consumers were likely more receptive to green products, as many of these countries had recovered from the economic crisis earlier than Spain. Additionally, the increase in green innovation expenditures in Spain since 2014 may have also contributed to this trend (Figure 1) by supporting greater investment in EI.
Expected benefits. Among the market strategies that firms aimed to implement through innovation, the only one noteworthy as a driver of EI is the strategy focused on improved quality (h_objectqualit) (Table 1). This observation is confirmed by the data segmented by phase of the business cycle (Table 2). As shown by the marginal effects, during the crisis, firms that prioritized substantial quality improvement when innovating were more likely to engage in efficiency and environmental EI compared to their counterparts.
Certain market features can either encourage or discourage prospective innovators. Above-average difficulties in innovation, due to existing innovations (h_prev_innov) or uncertain demand (h_DemandUncertainty), are likely to reduce the probability of a firm engaging in EI during periods of crisis and recovery but not during economic booms (Table 2). Our findings on the effects of uncertain demand during the crisis align with Arranz et al. (2019) [6], who specifically examine this period. Uncertainty could hinder the sales of new products, such as green foodstuffs or items in recycled packaging, within this conservative industry —especially when consumers become more risk-averse during downturns. Our detailed analysis of market dynamics helps clarify why some studies identify a market influence on EI adoption [3,18], while others do not [72]. Our findings indicate that specific aspects of firms’ market strategies—such as expansion, quality, and geographic scope —stimulate EI adoption, whereas others, like diversification, do not. In summary, regulation emerges as the most significant motivation-based driver of EI.
Other forms of institutional intervention, such as subsidies, can be seen as both motivation-based factors—acting as accelerators or dampeners of EI during a crisis—and as facilitating factors from the perspective of the receiving company. Firms that received EU R&D funding (RD_EU_funding) were no more likely than those without it to engage in efficiency-oriented EI. However, they were 14% more likely to adopt environmental EI over the full period, with this probability increasing to 21% during the recovery (Table 1 and Table 2). Once again, firms’ cost-reduction motivations, rather than institutional intervention, may be the driving factor behind efficiency EI. Subsidies from central (RDGovSubs_funding) or regional governments (RD_RegSubs_funding) had no significant effect on EI (Table 1), which is consistent with the findings of Cuerva et al. (2014) [73] and Jové-Llopis and Segarra-Blasco (2018) [72] for Spanish firms. Note that we examine the potential effects on EI of the indiscriminate subsidization of all types of R&D. R&D funding from contracts with regional governments (RD_RegSubs_funding) had no effect on EI from 2004 to 2016. However, funding from central government contracts (RD_GovContrFunding) increased the likelihood of firms performing EI by 13% during the full period (Table 1) and by 25% specifically during the crisis (Table 2). Contracts may be highly target-oriented, driving firms to perform and implement EI, while subsidies often support broader objectives at lower technology readiness levels (TRLs), aligning with firms’ long-term innovation strategies (as in other EU countries, the Spanish government generously supported renewables, particularly wind and solar energy, during their early stages. OECD Economics Department Working Papers No. 1777, 2023, https://www.oecd.org/en/publications/accelerating-the-eu-s-green-transition_bed2b6df-en.html (accessed on 20 February 2025). However, the database lacks specific information on subsidies for the green transition. This absence of data may be another reason why subsidies appear to have no effect in our models. In our sample, contracts, which have been rarely investigated in previous studies, significantly impact environmental EI, especially in times of crisis. However, they had no effect on efficiency-oriented EI. A possible reason is that these contracts likely pertain to F&B services for institutions such as schools, hospitals, and the military, ensuring the quality of the food and packaging themselves. In contrast, in Spain, the criterion for reducing energy usage in government F&B purchases appears to focus on the proximity between producers and end-users, such as schools, rather than on the technology employed in industrial plants [84]. The marginal effects suggest that the interventions most likely to support firms’ resilience from an EI perspective during the crisis and the recovery were, in order of effectiveness, R&D funding from government contracts and EU R&D funding (Table 2). Other interventions showed no significant impact during these periods. This addresses RQ1: Which institutional interventions are most effective in promoting eco-innovation during challenging periods?

5.3. Facilitating Factors

We now turn to the potential effects of facilitating factors, such as financing for R&D and a firm’s knowledge resources. Note that an “i” preceding the variable name denotes intensity, indicating, for example, that the firm undertakes an R&D effort above the Spanish F&B industry average. Firms with high R&D personnel intensity do not exhibit a clear tendency to adopt EI, consistent with the findings of Aibar-Guzmán et al. (2022) [58], Cuerva et al. (2014) [73], and Fernández et al. (2021) [76]. Our finding is supported by the results for i_RD_Effort, which reflects above-average effort in both internal and external R&D. Firms with prior experience in both product and process innovation (product & process) had a 5% higher likelihood of adopting efficiency-related EI innovations and a 6% higher likelihood of adopting environmental EI overall throughout the study period, compared to firms that had engaged in either product or process innovation alone (Table 1). Innovative firms, even if not focused on ecological fields, are more likely to engage in EI. While prior research [8] indicates that many innovations in this industry occur at the operational level of industrial plants, outside formal R&D departments, our findings suggest that this is particularly true for EI.
i_Machine_Effort, which reflects above-average effort in acquiring machinery, equipment, and software, increased the likelihood of efficiency-oriented EI by 13% during the recovery (Table 2). Spanish F&B companies responded to stagnant demand and heightened competition following the 2008 crisis by adopting new technologies and machinery that emphasized energy and material savings [85]. These included innovations like residue recycling and improved hygiene systems. EI adoption in this sector likely depends, at least in part, on technological advancements across the food production chain, aligning with our holistic perspective on innovation in this field. The acquisition of new machinery aimed at material and energy savings, as well as the benefits derived from supplier spillovers, were facilitated by Spain’s status as a competitive producer and exporter of food machinery. During the recovery, the sampled firms increased their investment in machinery. This boost was likely due to better access to credit, higher green spending (see Figure 1), and renewed consumer demand—especially for quality products from other European countries—after the crisis. Similarly, i_TrainingEffort contributed during the crisis by increasing the likelihood of environmental EI by 7%.
The ability of a firm to profit from externalities is also part of its knowledge resources. The coefficient for i_KnowAcqEffort during the crisis shows a statistically significant negative relationship with EI. This suggests that, as firms adopt EI, they tend to rely less on external knowledge sources, such as patent acquisitions, during harsh economic times probably due to cost constraints, likely prioritizing internal resources instead (Table 2). Continuous collaboration with clients or suppliers does not necessarily foster environmental EI. Since theoretical models highlight the importance of technology suppliers [33], this result may seem counterintuitive at first. One reason could be that F&B companies, including SMEs, are increasingly focused on staying ahead in food-related technologies [44,52,86]. For instance, SMEs in Spain’s agri-food sector are embracing digitalization [87], suggesting that the industry is not entirely dependent on external technology suppliers. In fact, a study of European firms shows a strong link between digitalization and eco-innovation [88], emphasizing the role of auxiliary technologies in adopting green practices. Biotechnology, for example, can reduce waste and promote sustainability. In the sample, no significant correlation is found between the goal of reducing material or energy consumption and direct engagement in biotechnology. In contrast, companies with a focus on reducing environmental harm are more likely to incorporate biotechnology (34%) compared to those without this focus (23%) (Pearson chi2(3) = 70.7662; p = 0.000; Cramér’s V = 0.1031). This suggests that biotechnology is often used to mitigate environmental damage, with many firms integrating these techniques into their operations.
Our findings contrast with Bossle et al.’s (2016) [3] review of EI, where cooperation was seen as a key driver. This discrepancy may reflect the varying capacities of F&B industries across countries to develop in-house upstream technology, which can reduce the need for cooperation. As we highlighted in the Introduction, the Spanish F&B industry’s RTA may explain its stronger in-house technology development. On the other hand, our results are consistent with Jové-Llopis and Segarra-Blasco’s (2018) [72] findings for the broader Spanish manufacturing sector. While previous research suggests that while cooperation is crucial for formal agreements driving radical EI [18] or addressing specific challenges, such as green packaging [74], it is not always the primary catalyst for EI.
As shown in Annex Table 1, 62% of the sampled firms report spillovers from suppliers as a source of knowledge for innovation. Employing these spillovers increases the probability of generating efficiency or environmental EI by 6% (Table 1). These spillovers are particularly significant for efficiency EI during recovery periods, where the probability increases by 12% and aligns with the timing of equipment and software acquisition, suggesting a complementarity between the two (Table 2). Spillovers from competitors increase the likelihood of efficiency EI by 7% but have no effect on environmental EI. Competitors may be more willing to share knowledge on saving energy or materials than on marketable products. Another possible interpretation is that F&B firms may have a stronger capacity to profit from spillovers through interactions with competitors in terms of efficiency, rather than product development, due to lower restrictions related to industrial property rights, industrial secrecy, etc. On the other hand, spillovers from professional associations positively influence the probability of producing environmental EI by 9%, proving particularly useful for eco-innovators during periods of crisis (Table 2). As noted by evolutionary theory, technological change is influenced by social factors. Qi et al. (2021) [89] observe that firms tend to adopt green innovations through imitation when their peers do, especially during uncertain times. Thus, our results may be explained by firms identifying their peers within professional associations. Additionally, as is the case with other Spanish sectors [90], professional associations in the F&B sector may act as catalysts or knowledge hubs, identifying opportunities and disseminating inherent knowledge.
Our results align with previous studies on the importance of the technological value chain and external knowledge for this industry (Section 2.2). However, we observe that in this industry sources of new ideas for the green transition appear to be shaped more by innovation history, internal capabilities, and strategic spillovers than by direct cooperation and patent or license acquisitions.

5.4. Control Variables

Size. During prosperous times, micro-firms behave similarly to small firms, our base category. However, during crises, micro-firms are 12% less likely to engage in environmental EI, probably due to increased credit constraints (Table 2). In contrast, their motivation to save materials and energy remains comparable to that of small firms, aligning with the descriptive statistics. Once again, the results underscore the importance of self-motivation in achieving material and energy savings, even among micro-firms.
Medium-sized firms generally exhibit eco-behavior similar to small firms (Table 1). However, a phase-by-phase analysis of the business cycle shows that medium-sized firms outperform small firms in saving materials and energy during crises and recoveries (Table 2). Conversely, their environmental EI performance declines relative to small firms during crises. As firm size increases, the likelihood of EI also rises. Nevertheless, large firms, despite their significant resources, demonstrate superior environmental EI performance primarily during economic booms, while their performance falters during challenging economic periods. Our results align with those of Díaz-García et al. (2015) [14], but only during periods of economic growth, highlighting how EI drivers shift throughout the business cycle. Actually, our results reveal nuanced patterns regarding size (see Section 2.2): across the entire panel, medium–large and large companies favor efficiency-oriented EI, with no notable differences in reducing environmental impact. However, when segmented by business cycle phases, medium–large companies maintain their focus on efficiency-oriented EI, while smaller companies exhibit a procyclical tendency toward reducing environmental impact, particularly during the crisis period. The effect of size on EI appears to be contextually influenced by the phase of the business cycle and the type of EI.
Ownership. Over the full period, independent firms not affiliated with any business group—whether national or multinational—perform similarly to domestic business groups (DBGs) (our base category) in terms of efficiency EI (Table 1). They also exhibit similar performance in environmental EI. Our results are in line with those of Jové-Llopis and Segarra-Blasco (2018) [72] and Marzucchi and Montresor (2017) [17]. Throughout the period, multinationals were 8% more likely than DBGs to engage in efficiency-related EI but showed no significant difference in environmental EI (Table 1). Phase-specific analysis of the business cycle suggests that this advantage was evident primarily during the crisis, when multinationals exhibited a countercyclical effect (Table 2). This is likely due to their better access to international financing, while domestic firms were disproportionately affected by the Spanish credit crunch—rather than being driven by the intrinsic innovativeness of multinationals. One possible explanation for the discrepancy with the theoretical expectations regarding the innovativeness of F&B multinationals (Section 2.2) is that these companies often introduce novelty to host countries in areas such as standard innovation, design, and packaging but not necessarily in EI. A contributing factor may be that many multinationals operating in the Spanish F&B industry originate from energy-rich countries or nations with less stringent environmental regulations than those of the EU, such as Spain. As a result, they may lack a solid foundation in EI technology. Space constraints prevent us from exploring this interpretation further here.

5.5. Drivers of EI Shifts and Considerations for Firms’ Strategies

The analysis reveals that the drivers of EI shift throughout the business cycle. For example, firms’ exporting activities become significant drivers of EI when rising demand in other European countries signals an early recovery. This finding may help reconcile contradictory results in the literature, which are based on analyses conducted at different stages of the business cycle (see Section 2.2). Over the entire period, the key drivers encouraging EI in this industry were stringent regulations and the firm’s sustained commitment to EI activities, followed by market-push factors and certain externalities.
The results in Table 2, as discussed in the previous subsections, suggest that no single strategy exists for adopting green technology during harsh economic times—economic crises and recovery periods. In fact, efficiency eco-innovators and environmental eco-innovators adopt significantly different strategies. Efficiency-focused eco-innovators often invest in new machinery and complement this by acquiring knowledge from suppliers, likely to adapt the new equipment to their specific needs. In contrast, environmentally focused eco-innovators tend to pursue a multifaceted strategy. This includes enhancing their capabilities by training their workforce and sourcing new knowledge from professional associations and suppliers. Their financial strategy involves securing EU R&D funding and obtaining government R&D contracts. Additionally, their market strategy focuses on expanding exports to European markets and emphasizing quality-based approaches. This directly addresses RQ2 (Which corporate strategies are most effective in fostering eco-innovation during difficult times?).

6. Conclusions

This article examines the persistence of eco-innovative activities and their role in enhancing firms’ resilience during times of crisis. A longitudinal approach is employed, using panel data from Spanish food and beverage companies from 2004 to 2016, to analyze how long-term commitments to eco-innovation influence green technology adoption. Three distinct periods are identified: 2004–2007 (boom), 2008–2013 (crisis), and 2014–2016 (recovery).
The hypothesis that crises can drive new opportunities for eco-innovation is supported for efficiency-focused innovations. This pattern is likely to extend to other resource-scarce countries during economic recessions, where efficiency-focused eco-innovators are more likely to adopt countercyclical strategies as a cost-saving measure, compared to environmental eco-innovators.
The hypothesis that past eco-innovation efforts positively influence the likelihood of future eco-innovation, even during periods of economic adversity, is supported. In other words, the effects of crises are tempered by persistence. A significantly higher likelihood of continuing or expanding green activities was observed in firms with a consistent history of efficiency-related eco-innovation. This underscores the strategic advantage gained from accumulated expertise and established eco-innovation practices.
The study also examines the most effective institutional interventions for sustaining the green transition in the sector despite challenging times. No evidence was found that subsidies provided to firms for general R&D purposes promote eco-innovation or strengthen green resilience during challenging times. In contrast, other institutional interventions served as accelerators of green technology adoption. A consistently positive effect throughout the business cycle was observed for regulation. For environmental eco-innovation, significant encouragement was provided by government R&D contracts during the crisis, and a positive impact was observed for European Union R&D funding during the recovery period. However, a limited impact was observed for these interventions on efficiency-related eco-innovation, which is typically driven by firm-level decisions. Parsimonious use of materials and energy appears to be a natural inclination of firms, including small and regionally focused ones.
The strategies used by firms to maintain or improve their green transition in difficult times were also explored. It was found that the two types of eco-innovators studied employ distinct strategies. Investment in new machinery and the acquisition of supplier knowledge for adaptation to specific needs characterize the approach of efficiency-focused eco-innovators. In contrast, a multifaceted approach is pursued by environmentally focused eco-innovators, including workforce skill enhancement, knowledge acquisition from professional associations, securing of European Union and government R&D contract funding, and expansion of exports to other European markets with a focus on quality.
For both policymakers and managers, the study underscores the importance of institutionalizing persistence as a strategy for navigating macroeconomic volatility. As noted by Cefis (2003) [91], “persistence rather than the size of firms or the size of investments in innovative activities per se might be an appropriate target for economic policies supporting innovation”. Recommendations for policymakers are as follows. (i) Prioritize support for energy- and material-efficient processing equipment, particularly in countries with a strong food equipment sector like Spain. In regions lacking such capabilities, foster partnerships at national or supranational levels to strengthen food technology linkages and reduce reliance on imported machinery. (ii) Promote workforce training to enhance eco-innovation capabilities. (iii) Encourage collaboration with suppliers for efficiency-focused eco-innovation and with professional associations for environmental eco-innovation. For entrepreneurs aiming to pursue a green transition during economic downturns there are also some recommendations based on the findings. (i) Maintain consistent eco innovation practices. (ii) Prioritize efficiency-focused innovation in resource-scarce countries and invest in energy-efficient machinery. (iii) Invest in workforce training and collaborate with suppliers, professional associations, and industry peers to access valuable insights and ideas. (iv) Diversifying into new markets, especially quality-driven European markets, can provide growth opportunities while sustaining green initiatives.
The analysis has implications for the long-run evolution of environmental innovation in Spain. The proactive and adaptive behavior exhibited by the sampled firms during both the 2008 crisis and a difficult recovery period contributed to the establishment of a foundation of efficiency, cultural change, and regulatory alignment that has undoubtedly supported Spain’s ability to mitigate inflationary pressures and accelerate its shift to renewable energy during the current European energy crisis. Furthermore, strategic preparedness is demonstrated by both efficiency and environmental innovators. This long-term focus has likely positioned these firms to align more easily with Spain’s recent renewable energy policies and incentives.
The study also presents theoretical implications, as persistence can be framed as a dynamic capability that interacts with macroeconomic volatility to sustain eco-innovation. Secondly, to the best of our knowledge, this study is the first to uncover that the drivers of eco-innovation evolve over the business cycle—a contribution that may help explain discrepancies in the literature among authors analyzing different time periods. Finally, while the traditional evolutionary theory of technological change emphasizes the cumulative and path-dependent nature of innovation, it largely overlooks how different phases of the business cycle—boom, crisis, and recovery—affect innovative activities. By examining these different phases, this study introduces a novel perspective, suggesting that the macroeconomic environment plays a crucial role in shaping the strategies, resources, and opportunities available to eco-innovative firms.
The unique characteristics of the food and beverage industry (e.g., reliance on raw materials and sensitivity to consumer preferences) may influence the observed outcomes, limiting the generalizability of the study to other sectors. Nevertheless, the trend identified for efficiency-oriented eco-innovation is likely to be consistent in other energy-scarce countries and possibly in other industries. Within the EU, key producers of food and food technology that rely wholly or partially on energy imports—such as Italy, Denmark, and the Netherlands—are likely comparable to the case of Spain studied here.
Certain limitations are present in this study. As mentioned, only firms that survived the full period were included in the sample, which may introduce bias—a limitation shared with other studies based on Community Innovation Survey data. On the other hand, the study reports firms’ self-perceptions, which may introduce a subjective bias in evaluating eco-innovation adoption. To mitigate the limitations of relying on such data, we compared firms’ self-perceptions of eco-innovation with their actual innovation performance over the previous two years. This approach helps filter out subjective biases and provides a more objective measure of innovation activity, reducing the potential for overestimation or misrepresentation of eco-innovation efforts. When available, more objective measures of adoption should be considered in future research. Additionally, as noted by previous researchers using similar datasets, specific data on eco-innovation, such as information on R&D, subsidies, and other knowledge resources of firms, are lacking in these surveys. Improved data collection on green-focused R&D, subsidies, and sales is recommended since the availability of such data could enable more accurate analyses in the future.
Despite these limitations, a contribution to the understanding of eco-innovation in this sector is made by this study, particularly regarding the effects of firms’ prior eco-innovation experience and the impact of crises.

Author Contributions

Conceptualization: A.G.-S. and R.R.; Data: A.G.-S. and R.R.; Methodology: A.G.-S. and R.R.; Draft Preparation: A.G.-S. and R.R.; Writing: A.G.-S. and R.R.; Review and Editing: A.G.-S. and R.R. All authors have read and agreed to the published version of the manuscript.

Funding

This research received no external funding.

Institutional Review Board Statement

Not applicable.

Informed Consent Statement

Not applicable.

Data Availability Statement

Acknowledgments

The authors thank four anonymous referees for their useful comments and suggestions on an early draft. Ruth Rama gratefully acknowledges support from project PTI Agroambio, “Mejora adaptativa de la eficacia socioambiental de la Política Agrícola Común (PAC) en España” (Adaptive Improvement of the Socio-environmental Effectiveness of the Common Agricultural Policy, CAP, in Spain), CSIC-Ministerio de Agricultura, Pesca y Alimentación (Spain).

Conflicts of Interest

The authors declare no conflicts of interest.

Abbreviations

The following abbreviations are used in this article:
DBG: domestic business group, EI: eco-innovation, EU: European Union, F&B industry: food and beverage processing industry, INE: National Statistics Institute (Instituto Nacional de Estadística), MNE: multinational enterprise, PITEC: Technological Innovation Panel (Panel de Innovación Tecnológica), R&D: Research and Development, RTA: revealed technological advantage, SME: small and medium-sized enterprise.

Appendix A

Table A1. Key Drivers of Eco-Innovation (EI) in Selected Studies.
DriverKey FindingsSelected Studies
Institutional interventionEnvironmental regulations can drive EI by encouraging innovation and competitiveness (win–win proposition), though empirical findings are mixed. Regulation is more effective in Eastern Europe than Western Europe. Subsidies show varied effectiveness across regions and sectors. R&D contracts with the government remain underexplored.Porter and van der Linde (1995) [68], Bossle et al. (2016) [3], Hojnik and Ruzzier (2016) [15], Cuerva et al. (2014) [73], Jové-Llopis and Segarra-Blasco (2018) [72], Avellaneda Rivera et al. (2018) [71], Triguero et al. (2018) [18], Calle et al. (2022) [9]
SizeLarger firms are more likely to engage in EI due to financial resources and R&D capacity. Some studies challenge the assumption that SMEs are less eco-innovative.Hojnik and Ruzzier (2016) [15], Bossle et al. (2016) [3], Triguero et al. (2018) [18]. Spanish manufacturing studies [17,58,74]. Contradictory findings [14]
Knowledge baseR&D intensity is generally associated with EI, but findings vary. In Spain, R&D promotes EI, while in Chile, limited knowledge access hinders its effect. Firms with a strong background in polluting tech may struggle to transition to EI.Jové-Llopis and Segarra-Blasco (2018) [72], Triguero et al. (2018) [18], Cuerva et al. (2014) [73], Developing countries [75,76]. Polluting technology challenges [65]
Collaboration and external information sourcesCollaboration with clients and suppliers can drive EI in cost-intensive industries, but excessive collaboration may hinder innovation. Balancing partnerships is essential.Bossle et al. (2016) [3], Triguero et al. (2018) [18], Spanish firms [72], Avellaneda Rivera et al. (2018) [71]
Ownership structureMultinational firms are more likely to engage in EI due to better funding and resources, whereas family-owned firms are more conservative. Being part of a business group does not guarantee EI adoption.Aibar-Guzmán et al. (2022) [58], Jové-Llopis and Segarra-Blasco (2018) [72]
Market-push factorsMarket expansion is a motivator for EI. In Spanish F&B, market demand and regulations positively influence EI, but results remain inconsistent across sectors.Bossle et al. (2016) [3], Triguero et al. (2018) [18], Jové-Llopis and Segarra-Blasco (2018) [72]
Overall conclusionNo universal consensus on EI drivers exists, highlighting the need for further research.Various authors
Table A2. Description of variables and main descriptive statistics.
VariablesDescriptive Statistics
NameTypeDescription(Relative frequencies in parenthesis for dummy and categorical variables)
Dependent variables
EcoEffic_innovDummyInnovative firm with efficiency-oriented innovation targets (high or medium relevance)1 = yes (33.5%)
0 = no
N = 8699; n = 871
EcoEnviron_innovDummyInnovative firm with environmental innovation targets (high or medium relevance)1 = yes (47.9%)
0 = no
N = 6627; n = 808
Primary interest variables
CrisisCategoricalBusiness cycle phase based on the Spanish GDP path0 = boom (2004–2007): 34.1%
1 = crisis (2008–2013): 48.1%
2 = recovery (2014–2016): 17.8%
N = 8699; n = 871
PersistEcoEfficDummyPersistence in efficiency-oriented eco-innovation1 = yes (22.5%)
0 = no
N = 8054; n = 855
PersistEcoEnvironDummyPersistence in environmental impact reduction eco-innovation1 = yes (13.9%)
0 = no
N = 6159; n = 792
Motivation-based factors
RegulationCategoricalRelevance of environmental regulation for innovation1 = high: 28.4%
2 = medium: 26.1%
3 = low: 15.6%
4 = non-relevant: 29.9%
N = 6627; n = 808
MktbreadthCategoricalMarket breadth (local/regional/national/EU/rest of the world)1 = local/regional: 6.7%
2 = national: 16.5%
3 = EU: 18.9%
4 = other international (outside EU): 57.9%
N = 8699; n = 871
h_objectmarketDummy“High” priority of market penetration or market share increase through innovation1 = yes (51.7%)
0 = no
N = 8699; n = 871
h_incumb_domDummy“High” relevance of market dominated by incumbent firms as a barrier to innovation1 = yes (17.6%)
0 = no
N = 8699; n = 871
h_objectrangeDummy“High” priority on expanding product range through innovation1 = yes (45.4%)
0 = no
N = 6627; n = 808
h_objectqualitDummy“High” priority of increasing product quality through innovation1 = yes (49.7%)
0 = no
N = 6627; n = 808
h_DemandUncertaintDummy“High” relevance of uncertain demand for innovative products as a barrier to innovation1 = yes (20.9%)
0 = no
N = 8699; n = 871
h_prev_innovDummy“High” relevance of prior innovations in the market as a barrier to innovation1 = yes (4.8%)
0 = no
N = 8699; n = 871
Other institutional interventions (motivating and facilitating)
RD_EU_fundingDummyReceived R&D EU funding1 = yes (12.6%)
0 = no
N = 8699; n = 871
RD_GovContr_fundingDummyReceived R&D funding through contracts from the Spanish central government1 = yes (17.1%)
0 = no
N = 8699; n = 871
RD_GovSubs_fundingDummyReceived R&D subsidy funding from the Spanish central government1 = yes (22.8%)
0 = no
N = 8699; n = 871
RD_RegContrfundingDummyReceived R&D funding through contracts from regional/local government1 = yes (16.5%)
0 = no
N = 8699; n = 871
RD_RegSubs_fundingDummyReceived R&D subsidy funding from regional/local government1 = yes (22.4%)
0 = no
N = 8699; n = 871
Facilitating factors
i_invest_pwDummyGross investment in tangible assets per 1000 workers above F&B industry average1 = yes (4.6%)
0 = no
N = 8699; n = 871
i_RDownfundsDummyPercentage of own funds financing R&D above F&B industry average1 = yes (38.3%)
0 = no
N = 8699; n = 871
i_RD_EffortgDummyEffort in R&D activities (internal + external) above F&B industry average1 = yes (37.1%)
0 = no
N = 8699; n = 871
i_Machine_EffortDummyEffort in acquisition of machinery, equipment, and software above F&B industry average1 = yes (12.6%)
0 = no
N = 8699; n = 871
i_KnowAcqEffortDummyEffort in external knowledge acquisition (patents) above F&B industry average1 = yes (13.8%)
0 = no
N = 8699; n = 871
i_TrainingEffortDummyEffort in workforce training above F&B industry average1 = yes (8.8%)
0 = no
N = 8054; n = 855
i_RDpers_pwDummyNumber of R&D employees per 1000 employees above F&B industry average1 = yes (39.3%)
0 = no
N = 8699; n = 871
CoopvarCountVariety of cooperation partners(min.: 0, max.: 6)0: 62.3%
1: 15.6%
2: 9.3%
3: 5.2%
4: 3.6%
5: 2.4%
6: 1.6%
N = 6627; n = 808
CoopcontsupplDummyPersistence in cooperation with suppliers1 = yes (12.6%)
0 = no
N = 6139; n = 792
CoopcontcliDummyPersistence in cooperation with clients1 = yes (5.4%)
0 = no
N = 6123; n = 792
Spill_supplDummySpillovers from suppliers have high/medium relevance for innovation1 = yes (62.4%)
0 = no
N = 6627; n = 808
Spill_competDummySpillovers from competitors have high/medium relevance for innovation1 = yes (39.6%)
0 = no
N = 6627; n = 808
Spill_profassocDummySpillovers from professional associations have high/medium relevance for innovation1 = yes (27.7%)
0 = no
N = 6627; n = 808
InnovclassCategoricalInnovation class: product innovation, process innovation, or both1 = product: 14.1%
2 = process: 26.8%
3 = both product and process: 59.1%
N = 5880; n = 783
NoveltyDummyIntroduced products new-to-the-market1 = yes (55.4%)
0 = no
N = 4325; n = 674
NoveltentDummyIntroduced products new-to-the-firm1 = yes (81.2%)
0 = no
N = 4325; n = 674
Source: Authors’ own from PITEC data.
Figure A1. Firm Size Distribution. Source: Authors’ own elaboration based on PITEC data.
Sustainability 17 02971 g0a1
Figure A2. Headquarters location by Spanish Region. Source: Authors’ own elaboration based on PITEC data.
Sustainability 17 02971 g0a2
Figure A3. Percentage of Persistent Eco-innovators and business cycle in F&B industry. Source: Authors’ own elaboration based on PITEC data.
Sustainability 17 02971 g0a3

References

  1. Galanakis, C.M. Innovation Strategies in the Food Industry: Tools for Implementation; Elsevier Inc.: Amsterdam, The Netherlands, 2016; pp. 293–304. ISBN 9780128037935. [Google Scholar]
  2. Acosta, M.; Coronado, D.; Toribio, M.R. The Use of Scientific Knowledge by Spanish Agrifood Firms. Food Policy 2011, 36, 507–516. [Google Scholar] [CrossRef]
  3. Bossle, M.B.; Dutra de Barcellos, M.; Vieira, L.M.; Sauvée, L. The Drivers for Adoption of Eco-Innovation. J. Clean. Prod. 2016, 113, 861–872. [Google Scholar]
  4. Galera-Quiles, M.C.; Piedra-Muñoz, L.; Galdeano-Gómez, E.; Carreño-Ortega, A. A Review of Eco-Innovations and Exports Interrelationship, with Special Reference to International Agrifood Supply Chains. Sustainability 2021, 13, 1378. [Google Scholar] [CrossRef]
  5. Losada, R.; Gómez-Ramos, A.; Rico, M. Rural Areas Receptivity to Innovative and Sustainable Agrifood Processes. A Case Study in a Viticultural Territory of Central Spain. Reg. Sci. Policy Pract. 2019, 11, 307–327. [Google Scholar] [CrossRef]
  6. Arranz, N.; Arroyabe, M.F.; Molina-García, A.; Fernandez de Arroyabe, J.C. Incentives and Inhibiting Factors of Eco-Innovation in the Spanish Firms. J. Clean. Prod. 2019, 220, 167–176. [Google Scholar] [CrossRef]
  7. Cai, W.; Li, G. The Drivers of Eco-Innovation and its Impact on Performance: Evidence from China. J. Clean. Prod. 2018, 176, 110–118. [Google Scholar] [CrossRef]
  8. Gallizi, G.; Venturini, L. Product Innovation in the Food Industry: Nature, Characteristics and Determinants. In Economics of Innovation: The Case of the Food Industry; Galizzi, G., Venturini, L., Eds.; Physica-Verlag HD: Heidelberg, Germany, 1996. [Google Scholar]
  9. Calle, F.; Carrasco, I.; González-Moreno, Á.; Córcoles, C. Are Environmental Regulations to Promote Eco-Innovation in the Wine Sector Effective? A Study of Spanish Wineries. Agronomy 2022, 12, 21. [Google Scholar] [CrossRef]
  10. Ghisetti, C. Demand-Pull and Environmental Innovations: Estimating the Effects of Innovative Public Procurement. Technol. Forecast. Soc. Change 2017, 125, 178–187. [Google Scholar] [CrossRef]
  11. Blind, K. The Influence of Regulations on Innovation: A Quantitative Assessment for OECD Countries. Res. Policy 2012, 41, 391–400. [Google Scholar] [CrossRef]
  12. Ben Amara, D.; Chen, H. Driving Factors for Eco-Innovation Orientation: Meeting Sustainable Growth in Tunisian Agribusiness. Int. Entrep. Manag. J. 2022, 18, 713–732. [Google Scholar] [CrossRef]
  13. Horbach, J. Empirical Determinants of Eco-Innovation in European Countries Using the Community Innovation Survey. Environ. Innov. Soc. Transit. 2016, 19, 1–14. [Google Scholar] [CrossRef]
  14. Díaz-García, C.; González-Moreno, Á.; Sáez-Martínez, F.J. Eco-Innovation: Insights from a Literature Review. Innov. Manag. Policy Pract. 2015, 17, 6–23. [Google Scholar] [CrossRef]
  15. Hojnik, J.; Ruzzier, M. What Drives Eco-Innovation? A Review of an Emerging Literature. Environ. Innov. Soc. Transit. 2016, 19, 31–41. [Google Scholar] [CrossRef]
  16. Park, M.S.; Bleischwitz, R.; Han, K.J.; Jang, E.K.; Joo, J.H. Eco-Innovation Indices as Tools for Measuring Eco-Innovation. Sustainability 2017, 9, 2206. [Google Scholar] [CrossRef]
  17. Marzucchi, A.; Montresor, S. Forms of Knowledge and Eco-Innovation Modes: Evidence from Spanish Manufacturing Firms. Ecol. Econ. 2017, 131, 208–221. [Google Scholar] [CrossRef]
  18. Triguero, A.; Fernández, S.; Sáez-Martinez, F.J. Inbound Open Innovative Strategies and Eco-Innovation in the Spanish Food and Beverage Industry. Sustain. Prod. Consum. 2018, 15, 49–64. [Google Scholar] [CrossRef]
  19. Follmann, A.; Dannenberg, P.; Baur, N.; Braun, B.; Walther, G.; Bernzen, A.; Franz, M.; Hornidge, A.; Hulke, C.; Jaghdani, T.J.; et al. Conceptualizing Sustainability and Resilience in Value Chains in Times of Multiple Crises—Notes on Agri-Food Chains. Die Erde 2024, 155, 29–48. [Google Scholar]
  20. Stoneman, P. Introduction. In Handbook of the Economics of Innovation and Technological Change; Stoneman, P., Ed.; Blackweel: Oxford, UK, 1995. [Google Scholar]
  21. Le Bas, C.; Poussing, N. Are Environmental Innovators Persistent? J. Environ. Plan. Manag. 2018, 61, 1955–1972. [Google Scholar] [CrossRef]
  22. Suárez, D. Persistence of Innovation in Unstable Environments: Continuity and Change in the Firm’s Innovative Behavior. Res. Policy 2014, 43, 726–736. [Google Scholar] [CrossRef]
  23. Molero, J.; García, A. The Innovative Activity of Foreign Subsidiaries in the Spanish Innovation System: An Evaluation of Their Impact from a Sectoral Taxonomy Approach. Technovation 2008, 28, 739–757. [Google Scholar]
  24. Torrecillas, C.; Martínez, C. Patterns of Specialisation by Country and Sector in Olive Applications. Technol. Soc. 2022, 70, 102003. [Google Scholar] [CrossRef]
  25. Antonioli, D.; Montresor, S. Innovation Persistence in Times of Crisis: An Analysis of Italian Firms. Small Bus. Econ. 2021, 56, 1739–1764. [Google Scholar] [CrossRef]
  26. Archibugi, D.; Filippetti, A.; Frenz, M. The Impact of the Economic Crisis on Innovation: Evidence from Europe. Technol. Forecast. Soc. Change 2013, 80, 1247–1260. [Google Scholar] [CrossRef]
  27. Geroski, P.A.; Walters, C.F. Innovative Activity over the Business Cycle. Econ. J. 1995, 105, 916. [Google Scholar] [CrossRef]
  28. Friz, K.; Günther, J. Innovation and Economic Crisis in Transition Economies. Eurasian Bus. Rev. 2021, 11, 537–563. [Google Scholar] [CrossRef]
  29. Holl, A.; Rama, R.; Hammond, H. COVID-19 and Business Digitalization: Unveiling the Effects of Concurrent Strategies. J. Knowl. Econ. 2024. [Google Scholar] [CrossRef]
  30. Holl, A.; Rama, R. Persistence of Innovative Activities in Times of Crisis: The Case of the Basque Country. Eur. Plan. Stud. 2016, 24, 1863–1883. [Google Scholar] [CrossRef]
  31. Klyver, K.; Nielsen, S.L. Preparedness Shapes Tomorrow: Crisis Preparedness and Strategies among SMEs amid External Crises. Entrep. Reg. Dev. 2024, 36, 1363–1384. [Google Scholar] [CrossRef]
  32. Nelson, R.; Winter, S. An Evolutionary Theory of Economic Change; Harvad University Press.: Cambridge, MA, USA, 1982. [Google Scholar]
  33. Pavitt, K. Sectoral Patterns of Technical Change: Towards a Taxonomy and a Theory. Res. Policy 1984, 13, 343–373. [Google Scholar] [CrossRef]
  34. Malerba, F. Sectoral Systems: How and Why Innovation Differs across Sectors. In The Oxford Handbook of Innovation; Fagerberg, J., Mowery, D.C., Nelson, R.R., Eds.; Oxford University Press: Oxford, UK, 2005; pp. 380–406. [Google Scholar]
  35. Avermaete, T.; Viaene, J.; Morgan, E.J.; Crawford, N. Determinants of Innovation in Small Food Firms. Eur. J. Innov. Manag. 2003, 6, 8–17. [Google Scholar] [CrossRef]
  36. Oltra, V.; Saint Jean, M. Sectoral Systems of Environmental Innovation: An Application to the French Automotive Industry. Technol. Forecast. Soc. Change 2009, 76, 567–583. [Google Scholar] [CrossRef]
  37. Galizzi, G.; Venturini, L. Nature and Determinants of Product Innovation in a Competitive Environment of Changing Vertical Relationships. In Handbook of Innovation in the Food and Drink Industry; Rama, R., Ed.; Routledge Taylor & Francis Group: New York, NY, USA; London, UK, 2008; pp. 51–80. [Google Scholar]
  38. Gonard, T.; Green, R.H.; Malerbe, A.; Requillart, V. Changement technique et stratégie des acteurs dans le secteur de la chimie du sucre. Econ. Sociol. Rural. 1991, 7, 19–31. [Google Scholar]
  39. Pérez-Mesa, J.; Galdeano-Gómez, E. Agrifood Cluster and Transfer of Technology in the Spanish Vegetables Exporting Sector: The Role of Multinational Enterprises. Agric. Econ. (Zemědělská Ekon.) 2010, 56, 478–488. [Google Scholar] [CrossRef]
  40. Ménard, C.; Valceschini, E. New Institutions for Governing the Agri-Food Industry. Eur. Rev. Agric. Econ. 2005, 32, 421–440. [Google Scholar] [CrossRef]
  41. Nandonde, F.A. Factors Limiting the Flow of Food Innovation Ideas from Modern Food Retailers to Local Food Suppliers in Tanzania. Transnatl. Corp. Rev. 2018, 10, 233–243. [Google Scholar] [CrossRef]
  42. Belik, W.; Rocha dos Santos, R. Regional Market Strategies of Supermarkets and Food Processors in Extended MERCOSUR. Rev. Dev. Policy 2002, 20, 515–528. [Google Scholar]
  43. Spendrup, S.; Fernqvist, F. Innovation in Agri-Food Systems—A Systematic Mapping of the Literature. Int. J. Food Syst. Dyn. 2019, 10, 402–427. [Google Scholar] [CrossRef]
  44. Alfranca, O.; Rama, R.; von Tunzelmann, N. Combining Different Brands of In-House Knowledge: Technological Capabilities in Food, Biotechnology, Chemicals and Drugs in Agri-Food Multinationals. Sci. Public Policy 2004, 31, 227–244. [Google Scholar] [CrossRef]
  45. Bayona-Saez, C.; Cruz-Cázares, C.; García-Marco, T.; Sánchez García, M. Open Innovation in the Food and Beverage Industry. Manag. Decis. 2017, 55, 526–546. [Google Scholar] [CrossRef]
  46. Bigliardi, B.; Galati, F. Models of Adoption of Open Innovation within the Food Industry. Trends Food Sci. Technol. 2013, 30, 16–26. [Google Scholar]
  47. García Martinez, M.; Lazzarotti, V.; Manzini, R.; Sánchez García, M. Open Innovation Strategies in the Food and Drink Industry: Determinants and Impact on Innovation Performance. Int. J. Technol. Manag. 2014, 66, 212–242. [Google Scholar] [CrossRef]
  48. García Sánchez, A.; Molero, J.; Rama, R. Local cooperation for innovation: Food and beverage multinationals in a peripheral European country. Int. J. Multinatl. Corp. Strategy 2016, 1, 107–132. [Google Scholar]
  49. Arcese, G.; Flammini, S.; Lucchetti, M.C.; Martucci, O. Evidence and Experience of Open Sustainability Innovation Practices in the Food Sector. Sustainability 2015, 7, 8067–8090. [Google Scholar] [CrossRef]
  50. Sarkar, S.; Costa, A.I.A. Dynamics of Open Innovation in the Food Industry. Trends Food Sci. Technol. 2008, 19, 574–580. [Google Scholar] [CrossRef]
  51. Manzini, R.; Lazzarotti, V.; Pellegrini, L. How to Remain as Closed as Possible in the Open Innovation Era: The Case of Lindt & Sprüngli. Long Range Plan. 2017, 50, 260–281. [Google Scholar] [CrossRef]
  52. Rama, R.; von Tunzelmann, N. Empirical Studies of Innovation in the Food and Beverage Industry. In Handbook of Innovation in the Food and Drink Industry; Rama, R., Ed.; Routledge Taylor & Francis Group: New York, NY, USA; London, UK, 2008; pp. 13–49. [Google Scholar]
  53. Rastoin, J.-L. Les Multinationales dans Le Système Alimentaire. Rev. Proj. 2008, 6, 61–69. [Google Scholar]
  54. Alfranca, O.; Rama, R.; von Tunzelmann, N. A Patent Analysis of Global Food and Beverage Firms: The Persistence of Innovation. Agribusiness 2002, 18, 349–368. [Google Scholar] [CrossRef]
  55. Cincera, M.; Cozza, C.; Tübke, A.; Voigt, P. Doing R&D or Not (in a Crisis), That Is the Question. Eur. Plan. Stud. 2012, 20, 1525–1547. [Google Scholar] [CrossRef]
  56. Brzozowski, J.; Cucculelli, M. Proactive and Reactive Attitude to Crisis: Evidence from European Firms. Entrep. Bus. Econ. Rev. 2016, 4, 181–191. [Google Scholar] [CrossRef]
  57. Zouaghi, F.; Sánchez, M.; García Martínez, M. Did the Global Financial Crisis Impact Firms’ Innovation Performance? The Role of Internal and External Knowledge Capabilities in High and Low Tech Industries. Technol. Forecast. Soc. Change 2018, 132, 92–104. [Google Scholar] [CrossRef]
  58. Aibar-Guzmán, B.; García-Sánchez, I.M.; Aibar-Guzmán, C.; Hussain, N. Sustainable Product Innovation in Agri-Food Industry: Do Ownership Structure and Capital Structure Matter? J. Innov. Knowl. 2022, 7, 100160. [Google Scholar] [CrossRef]
  59. Cicuéndez-Santamaría, R. Who Cares and How Much Do They Care About the Environment? The Evolution of Environmental Concern in Spain and the European Union. Rev. Española de Investig. Sociol. 2024, 188, 55–80. [Google Scholar] [CrossRef]
  60. Karakaya, E.; Hidalgo, A.; Nuur, C. Diffusion of Eco-Innovations: A Review. Renew. Sustain. Energy Rev. 2014, 33, 392–399. [Google Scholar]
  61. Arenas, J.J.; Gómez, J.E.; Ortiz, E.; Paz, F.; Parra, C. Elements of the Persistence in Innovation: Systematic Literature Review. Adm. Sci. 2020, 10, 83. [Google Scholar] [CrossRef]
  62. Raymond, W.; Mohnen, P.; Palm, F.; Van der Loeff, S.S. Persistence of Innovation in Dutch Manufacturing: Is It Spurious? Rev. Econ. Stat. 2010, 92, 495–504. [Google Scholar]
  63. Triguero, Á.; Córcoles, D.; Cuerva, M.C. Differences in Innovation between Food and Manufacturing Firms: An Analysis of Persistence. Agribusiness 2013, 29, 273–292. [Google Scholar] [CrossRef]
  64. Triguero, Á.; Córcoles, D. Understanding Innovation: An Analysis of Persistence for Spanish Manufacturing Firms. Res. Policy 2013, 42, 340–352. [Google Scholar] [CrossRef]
  65. Cecere, G.; Corrocher, N.; Gossart, C.; Ozman, M. Lock-in and Path Dependence: An Evolutionary Approach to Eco-Innovations. J. Evol. Econ. 2014, 24, 1037–1065. [Google Scholar] [CrossRef]
  66. Antonioli, D.; Bianchi, A.; Mazzanti, M.; Montresor, S.; Pini, P. Innovation Strategies and Economic Crisis: Evidence from Firm-Level Italian Data. Econ. Politica 2013, 30, 33–68. [Google Scholar] [CrossRef]
  67. García-Sánchez, A.; Rama, R. New Challenges in European Innovation Partnerships. SOEs, POEs and Foreign MNEs during Crises. Eurasian Bus. Rev. 2024, 14, 1053–1092. [Google Scholar] [CrossRef]
  68. Porter, M.; van der Linden, C. Green and Competitive: Ending the Stalemate. The Dynam GCS of the Eco-Efficient Economy: Environmental Regulation and Competitive Advantage. Harv. Bus. Rev. 1995, 33, 129–134. [Google Scholar]
  69. Ling Guo, L.; Qu, Y.; Tseng, M.L. The Interaction Effects of Environmental Regulation and Technological Innovation on Regional Green Growth Performance. J. Clean. Prod. 2017, 162, 894–902. [Google Scholar] [CrossRef]
  70. Guo, Y.; Xia, X.; Zhang, S.; Zhang, D. Environmental Regulation, Government R & D Funding and Green Technology Innovation: Evidence from China Provincial Data. Sustainability 2018, 10, 940. [Google Scholar] [CrossRef]
  71. Avellaneda Rivera, L.M.; González Moreno, Á.; Sáez Martínez, F.J. The Pursuit of External Knowledge in Eco-Innovation. Analysis of the Agri-Food Sector in Spain. J. Bus. 2018, 10, 70–92. [Google Scholar] [CrossRef]
  72. Jové-Llopis, E.; Segarra-Blasco, A. Eco-Innovation Strategies: A Panel Data Analysis of Spanish Manufacturing Firms. Bus. Strategy Environ. 2018, 27, 1209–1220. [Google Scholar] [CrossRef]
  73. Cuerva, M.C.; Triguero-Cano, Á.; Córcoles, D. Drivers of Green and Non-Green Innovation: Empirical Evidence in Low-Tech SMEs. J. Clean. Prod. 2014, 68, 104–113. [Google Scholar] [CrossRef]
  74. García-Granero, E.M.; Piedra-Muñoz, L.; Galdeano-Gómez, E. Multidimensional Assessment of Eco-Innovation Implementation: Evidence from Spanish Agri-Food Sector. Int. J. Environ. Res. Public Health 2020, 17, 1432. [Google Scholar] [CrossRef]
  75. Cainelli, G.; De Marchi, V.; Grandinetti, R. Does the Development of Environmental Innovation Require Different Resources? Evidence from Spanish Manufacturing Firms. J. Clean. Prod. 2015, 94, 211–220. [Google Scholar] [CrossRef]
  76. Fernández, S.; Torrecillas, C.; Labra, R.E. Drivers of Eco-Innovation in Developing Countries: The Case of Chilean Firms. Technol. Forecast. Soc. Change 2021, 170, 120902. [Google Scholar] [CrossRef]
  77. Rabadán, A.; González-Moreno, A.; Sáez-Martínez, F.J. Improving Firms’ Performance and Sustainability: The Case of Eco-Innovation in the Agri-Food Industry. Sustainability 2019, 11, 5590. [Google Scholar] [CrossRef]
  78. García Sánchez, A.; Montes Luna, M. Resiliencia Económica de las Regiones Españolas ante la Crisis Financiera de 2008. Rev. De Estud. Empres. Segunda Época 2022, 1, 4–22. [Google Scholar] [CrossRef]
  79. Mora-Sanguinetti, J.S.; Atienza-Maeso, A. “Green Regulation”: A Quantification of Regulations Related to Renewable Energies and Climate Change in Spain and France; WP #937; Banque de France: Paris, France, 2024. [Google Scholar]
  80. Díaz Méndez, C.; García Espejo, I. Inequalities in the Patterns of Consumption of Healthy Food during the Great Recession of 2008. In Inequality and Nutritional Transition in Economic History. Spain in the 19th-21st Century; Medina-Albadalejo, J.M., Martínez-Carrión, S., Eds.; Routledge Taylor & Francis Group: New York, NY, USA, 2023; pp. 236–250. [Google Scholar]
  81. Cruz-Castro, L.; Holl, A.; Rama, R.; Sanz-Menéndez, L. Economic Crisis and Company R&D in Spain: Do Regional and Policy Factors Matter? Ind. Innov. 2018, 25, 729–751. [Google Scholar] [CrossRef]
  82. Carbonell Ureña, F. La Industria Alimentaria Española: Situación y Previsiones Futuras. (The Spanish Food Industry: Actual Situation and Future Forecasts), SSRN 2012. Available online: https://ssrn.com/abstract=2136876 (accessed on 20 February 2024).
  83. Caravella, S.; Crespi, F. Unfolding Heterogeneity: The Different Policy Drivers of Different Eco-Innovation Modes. Environ. Sci. Policy 2020, 114, 182–193. [Google Scholar] [CrossRef]
  84. Ramos-Truchero, G. Alimentación Escolar y Compra Pública Sostenible. Estudio sobre la Presencia de la Alimentación Procedente de la Agricultura Familiar en los Menús Escolares. Rev. De Sociol. De La Educ.-RASE 2023, 16, 101–120. [Google Scholar] [CrossRef]
  85. Cruz, J. La tecnología alimentaria española se adapta a las exigencias del consumidor y busca crecer en el exterior. Eurocarne. La Rev. Int. del Sect. Cárnico 2012, 205, 66–70. [Google Scholar]
  86. Lavarello, P.; Gutmang, G.; Filipetto, S. Biotecnología en la Industria Vitivinícola en Argentina ¿Nuevas Modalidades de Innovación en una Actividad Tradicional? J. Technol. Manag. Innov. 2011, 6, 176–188. [Google Scholar] [CrossRef]
  87. Calafat-Marzal, C.; Sánchez-García, M.; Marti, L.; Puertas, R. Agri-Food 4.0: Drivers and Links to Innovation and Eco-Innovation. Comput. Electron. Agric. 2023, 207, 107700. [Google Scholar] [CrossRef]
  88. Montresor, S.; Vezzani, A. Digital Technologies and Eco-Innovation. Evidence of the Twin Transition from Italian Firms. Ind. Innov. 2023, 30, 766–800. [Google Scholar] [CrossRef]
  89. Qi, G.; Jia, Y.; Zou, H. Is Institutional Pressure the Mother of Green Innovation? Examining the Moderating Effect of Absorptive Capacity. J. Clean. Prod. 2021, 278, 123957. [Google Scholar] [CrossRef]
  90. Álvaro-Moya, A. The Globalization of Knowledge-Based Services: Engineering Consulting in Spain (1953–1975). Bus. Hist. 2015, 8, 681–707. [Google Scholar] [CrossRef]
  91. Cefis, E. Is There Persistence in Innovative Activities? Int. J. Ind. Organ. 2003, 21, 489–515. [Google Scholar] [CrossRef]
Figure 1. Spain. Annual environmental expenditure in EUR million. Source: INE. Note: Includes expenditures on R&D for environmental purposes, management of waste residuals, management of wastewater, protection of air and soil, as well as conservation efforts for biodiversity and landscape preservation.
Sustainability 17 02971 g001
Table 1. Determinants of Propensity to Eco-Innovate by Phase of the Business Cycle and Type of Eco-Innovation: Apparent Results and Persistence-Corrected Results (1).
ECO-EfficientialECO-Environmental
ModelsApparentPersistence-AdjustedApparentPersistence-Adjusted
DeterminantsCoef./seMarginsSig.Coef./seMarginsSig.Coef./seMarginsSig.Coef./seMarginsSig.
Micro (<10)−0.46975 −0.33509 −0.42405 −0.39384
(0.361) (0.325) (0.420) (0.401)
Medium (50–249)0.21093 0.14694 −0.23286 −0.25428
(0.200) (0.176) (0.229) (0.219)
Medium-large (250–999)0.891680.11143***0.773000.10172***−0.45162 −0.46388−0.04324+
(0.254) (0.224) (0.290) (0.280)
Large(>=1000) 1.111930.13796*0.931890.12193*0.62002 0.57956
(0.486) (0.428) (0.549) (0.526)
Independent 0.317760.03902+0.312470.04049*0.03519 0.03442
(0.172) (0.155) (0.198) (0.191)
Multinational 0.559680.06841*0.612060.07874**0.22604 0.21723
(0.260) (0.235) (0.301) (0.290)
Crisis 2008–20130.705450.08783***0.405890.05304**0.395740.03715**0.24894
(0.132) (0.130) (0.153) (0.154)
Recovery 2014-> 0.456160.05700**0.10405 0.20951 0.04893
(0.170) (0.168) (0.200) (0.201)
PersistEcoEffic 1.399770.18176*** 0.359530.03354*
(0.133) (0.153)
PersistEcoEnviron −0.26879 1.295820.12087***
(0.178) (0.264)
High-regul1.698950.23476***1.549510.23012***4.043570.50376***3.839830.48929***
(0.173) (0.167) (0.229) (0.225)
Medium-regul1.516260.21045***1.400810.20893***2.971540.39339***2.898080.39094***
(0.170) (0.163) (0.201) (0.196)
Non-relevant-regul−0.64165−0.08443***−0.64333−0.09135***−1.11992−0.12399***−1.12925−0.12945***
(0.187) (0.179) (0.217) (0.213)
Local/regional−0.19625 −0.23193 0.64160 0.67733
(0.409) (0.373) (0.457) (0.443)
EU & EFTA −0.11219 −0.08373 0.537020.05081*0.510440.04827*
(0.228) (0.213) (0.261) (0.253)
Rest of the world −0.04899 −0.01772 0.500530.04741*0.481580.04559*
(0.215) (0.195) (0.248) (0.238)
h_objectmarket0.415730.05124**0.397970.05168**0.339150.03165*0.312090.02911*
(0.129) (0.124) (0.155) (0.152)
h_incumb_dom0.324780.04003+0.344720.04476*0.00576 0.00070
(0.167) (0.157) (0.191) (0.187)
h_objectrange 0.07099 0.03952 −0.08253 −0.11229
(0.131) (0.125) (0.157) (0.154)
h_objectqualit0.898480.11074***0.828490.10758***0.412470.03849**0.373730.03486**
(0.126) (0.121) (0.147) (0.144)
h_DemandUncertainty 0.05656 0.04047 −0.10774 −0.10162
(0.152) (0.144) (0.177) (0.173)
h_prev_innov −0.83547−0.10297*−0.71131−0.09236+−1.14861−0.10717*−1.05626−0.09853*
(0.402) (0.384) (0.491) (0.482)
i_invest_pw 0.06361 0.08476 0.309550.02888+0.325270.03034*
(0.134) (0.129) (0.160) (0.157)
i_RDownfunds0.21439 0.21796 −0.05591 −0.01689
(0.148) (0.141) (0.178) (0.175)
RD_EU_funding −0.38348 −0.28012 1.479230.13802*1.527410.14248*
(0.405) (0.404) (0.631) (0.624)
RD_GovContrFunding0.06714 0.14569 1.441710.13452*1.396040.13022*
(0.407) (0.402) (0.592) (0.589)
RD_GovSubs_funding0.18677 0.21216 0.28244 0.31550
(0.199) (0.194) (0.247) (0.245)
RD_RegContrFunding−0.35682 −0.50157 −1.24742−0.11639+−1.29627−0.12091*
(0.468) (0.459) (0.661) (0.658)
RD_RegSubs_funding0.24189 0.25460 −0.16016 −0.13021
(0.197) (0.190) (0.244) (0.240)
i_RD_Effort0.00780 −0.00811 0.09448 0.08717
(0.152) (0.144) (0.180) (0.177)
i_Machine_Eff 0.16116 0.18490 −0.11245 −0.08515
(0.144) (0.139) (0.172) (0.170)
i_KnowAcqEffort 0.09862 0.07088 0.13011 0.12430
(0.436) (0.404) (0.482) (0.473)
i_TrainingEffort0.12488 0.04541 0.551080.05142**0.530380.04947**
(0.163) (0.159) (0.199) (0.197)
i_RDpers_pw 0.07938 −0.00104 0.15726 0.16879
(0.170) (0.162) (0.203) (0.199)
Coopvar 0.142230.01753**0.136630.01774**0.101880.00951+0.103860.00969+
(0.046) (0.044) (0.055) (0.054)
Coopcontsuppl 0.366310.04515*0.03496 0.35193 0.17646
(0.182) (0.183) (0.217) (0.218)
Coopcontcli −0.51596−0.06359*−0.72915−0.09468**0.696860.06502*0.546560.05098+
(0.260) (0.259) (0.326) (0.324)
Spillsuppl0.507400.06254***0.480960.06245***0.703340.06563***0.679960.06343***
(0.131) (0.125) (0.154) (0.151)
Spillcompet 0.561300.06918***0.513480.06667***−0.08519 −0.09686
(0.122) (0.116) (0.147) (0.144)
Spillprofassoc0.09881 0.07331 0.463530.04325**0.432350.04033**
(0.131) (0.125) (0.160) (0.157)
Process 2.092840.24785+1.960310.24324+1.36747 1.37952
(1.259) (1.165) (1.497) (1.441)
Product & Process0.505920.06335***0.414110.05464**0.651850.06265***0.610850.05864***
(0.154) (0.147) (0.179) (0.177)
Novelty −0.01307 −0.01607 0.09210 0.09700
(0.132) (0.126) (0.154) (0.152)
Noveltent 0.06797 0.07408 0.11385 0.07311
(0.160) (0.153) (0.188) (0.185)
Constant−3.95896 ***−3.70083 ***−3.93889 ***−3.82309 ***
(0.398) (0.369) (0.460) (0.447)
/
lnsig2u 1.22829 ***0.66757 ***1.38187 ***1.19217 ***
(0.119) (0.150) (0.126) (0.134)
Prob > chi2 0.000 0.000 0.000 0.000
N. of cases 3974 3974 3974 3974
sigma_u 1.84807 1.39624 1.99558 1.81500
rho 0.50936 0.37209 0.54761 0.50033
Source: Self-elaboration based on data from PITEC, provided by te Spanish National Institute of Statistics (INE). (1) Coefficients (Standard Errors in parenthesis) and statistically significant Marginal Effects. + p < 0.10, * p < 0.05, ** p < 0.01, *** p < 0.001.
Table 2. Determinants of Propensity to Eco-Innovate by Phase of the Business Cycle (1): Efficiency Eco-Innovation and Environmental Eco-Innovation.
ECO-EfficientialECO-Environmental
ModelsBoomCrisisRecoveryBoomCrisisRecovery
DeterminantsMargins Margins Margins Margins Margins Margins
Micro (<10) −0.11798*
Medium (50–249) −0.06214+
Medium-large (250–999) 0.11965**0.13657* −0.08478*
Large(>=1000) 0.18446*
Independent
Multinational 0.10135*
Persistecoeffic 0.17753***0.28438***0.05871+0.03603*
Persistecoenviron 0.14541*0.12508***0.08978*
High-regul 0.20822***0.21036***0.26996***0.46259***0.44143***0.69854***
Medium-regul 0.18442***0.18885***0.21260***0.36752***0.35252***0.59996***
Non-relevant-regul −0.08544*−0.13407*** −0.14137***−0.14390***
Local/regional 0.20349+
EU & EFTA 0.11358+ 0.15218*
Rest of the world
h_objectmarket 0.05527+0.04322+0.07087* 0.06499+
h_incumb_dom
h_objectrange−0.07426*0.04397+
h_objectqualit 0.15030***0.10396***0.07441* 0.07720***
h_DemandUncertainty −0.09424*
h_prev_innov −0.15535* −0.13464*
i_invest_pw 0.04514+
i_RDownfunds 0.05755+
RD_EU_funding 0.21056+
RD_GovContrFunding 0.27505*0.24978*
RD_GovSubs_funding
RD_RegContrFunding
RD_RegSubs_funding 0.07324+
i_RD_Effort
i_Machine_Effort 0.12543**
i_KnowAcqEffort0.13566+ −0.30207**
i_TrainingEffort 0.07168**
i_RDpers_pw
Coopvar0.02391*0.01634* 0.01267+
Coopcontsuppl 0.06960+
Coopcontcli−0.14775+−0.10453*
Spillsuppl 0.05314+ 0.11573**0.10841***0.06795***
Spillcompet0.09958***0.06847**
Spillprofassoc 0.05777+ 0.05120*0.08935**
Process
Product & Process 0.07166+ 0.05213*0.06849+
Novelty
Noveltent
Prob > chi20.000 0.000 0.000 0.000 0.000 0.016
N. of cases1275 1978 721 1260 1978 721
sigma_u2.54089 1.68256 1.10854 2.56360 2.53280 3.62070
rho0.66244 0.46252 0.27195 0.66641 0.66101 0.79939
Source: Self-elaboration based on data from PITEC, provided by the Spanish National Institute of Statistics (INE). (1) Statistically significant Marginal Effects. + p < 0.10, * p < 0.05, ** p < 0.01, *** p < 0.001.
Disclaimer/Publisher’s Note: The statements, opinions and data contained in all publications are solely those of the individual author(s) and contributor(s) and not of MDPI and/or the editor(s). MDPI and/or the editor(s) disclaim responsibility for any injury to people or property resulting from any ideas, methods, instructions or products referred to in the content.

