Article

Comparison of Crude Soybean Urease- and Pure Urease-Induced Carbonate Precipitation on Wind-Induced Erosion Resistance of Desert Sand

1
Center for Hypergravity Experiment and Interdisciplinary Research, Zhejiang University, No. 866, Yuhangtang Road, Hangzhou 310058, China
2
Key Laboratory of Ministry of Education for Geomechanics and Embankment Engineering, Hohai University, No. 1, Xikang Road, Nanjing 210098, China
3
College of Civil and Transportation Engineering, Hohai University, No. 1, Xikang Road, Nanjing 210098, China
4
Key Laboratory of Roads and Railway Engineering Safety Control, Shijiazhuang Tiedao University, Ministry of Education, Shijiazhuang 050043, China
5
Beijing Engineering Corporation Limited, No. 1, Dingfuzhuang West Street, Beijing 100024, China
*
Author to whom correspondence should be addressed.
Sustainability 2025, 17(7), 2968; https://doi.org/10.3390/su17072968
Submission received: 23 February 2025 / Revised: 24 March 2025 / Accepted: 25 March 2025 / Published: 27 March 2025

Abstract

:
Enzyme-induced carbonate precipitation has been studied for wind erosion control in arid areas. A comparative study was conducted between the pure urease- and crude soybean urease-induced carbonate precipitation methods with the same enzyme activity for enhancing the wind erosion resistance of desert sand. Tube tests were carried out to monitor the amount of organic matter and CaCO3 precipitates at different reaction times. Two groups of sand specimens received several cycles of treatment with soybean urease (SU) and pure urease (PU), respectively, with urea or without urea. The treated specimens were exposed to wind-blown sand flow to evaluate erosion resistance. The results showed that SU induced more organic precipitation under the salting-out effect, which was 9.88 times higher than that from PU. Under the one-cycle treatment, SU-treated specimens with higher contents of CaCO3 and organic matter exhibited lower erosion mass. Under the multiple-cycle treatment, the high viscosity of SU and rapid precipitation of organic matter resulted in the inhomogeneous distribution of CaCO3 (more precipitation at the top). Once the top of SU-treated specimens was eroded, the sand below the top layer was lost rapidly, causing the erosion mass of PU-treated specimens to be 95% lower than that of SU-treated specimens.

1. Introduction

Severe wind-induced erosion and desert invasion have caused serious desertification in China, hindering sustainable development in environmental, resource, and economic sectors. The government is actively seeking innovative materials and technologies for desertification control [1]. Current efforts, such as afforestation and chemical solidification, have shown limited success. Recently, biological techniques have been actively investigated as a sustainable approach to improve soil properties [2,3,4,5,6]. Enzyme-induced carbonate precipitation (EICP) is an effective soil improvement technique that utilizes the urease enzyme to facilitate calcium carbonate (CaCO3) precipitation. [7,8]. By applying the treatment solution to the soil, CaCO3 crystals rapidly form within the pore spaces, creating structural bonds that stabilize sand particles and reduce their erodibility [9,10,11,12,13].
Some work has been conducted to demonstrate the effectiveness of EICP using pure urease in increasing soil resistance against wind erosion [14,15]. Unfortunately, its complex purification with high costs limits the engineering applications of pure urease [7,16]. Therefore, crude extracts with low purity from different plant sources, such as soybean, jack bean meal, and watermelon seeds, were considered as promising alternatives [17,18]. In particular, soybean urease has attracted broad attention both in laboratory research and field applications due to its low cost and availability [19,20,21]. Unlike pure urease, crude urease extracted from plants contains some organic impurities, such as amino acids, proteins, and polysaccharides [22,23]. Some organic matter has salting-out characteristics, which is primarily the consequence of the decreasing solubility of organic matter induced by the addition of salts [24,25]. It may lead to the flocculation and precipitation of organic matter when CaCl2 solution is mixed into crude urease extract [26]. The organic matter may further improve soil properties by forming chemical bonds between soil particles, thereby enhancing erosion resistance [27,28,29]. However, little attention was paid to the effect of organic matter from pure urease and crude soybean urease on the wind erosion resistance of EICP-treated soil.
The wind erosion resistance of bio-treated soil is mainly due to particle binding by CaCO3 precipitation, which strengthens inter-particle bonds, thereby making the movement of particles more difficult [30,31,32]. Studies have shown that the organic impurities in crude urease may influence the micromorphology of CaCO3, potentially affecting bio-cementation efficacy. Liu et al. [26] found that the content of organic matter in pure urease and crude soybean urease can vary substantially, and the high organic matter content in crude soybean urease can precipitate in soil and significantly affect the spatial distribution of CaCO3. There have been some studies on the wind erosion resistance of EICP-treated soil induced by pure urease or crude soybean urease [14,15,33]. However, a comparison of the performance of these two ureases is not much reported.
In this paper, a comparative study was conducted between the pure urease- and crude soybean urease-induced carbonate precipitation methods for wind erosion control. Crude soybean urease and pure urease were tested at the same enzyme activity of 5 mmol·L−1·min−1. Tube tests were carried out to monitor the masses of organic matter and calcium carbonate precipitates over time. Subsequently, two groups of sand specimens received several cycles of treatment with crude soybean urease and pure urease, respectively, with urea or without urea. Specimens were exposed to wind-blown sand flow to evaluate erosion resistance. Additionally, the spatial distribution of organic matter and CaCO3 contents and microscale analysis (XRD and SEM) were performed to interpret the measured erosion rate of each specimen.

2. Materials and Methods

2.1. Urease Solution

The crude soybean urease was crudely extracted in the following steps, as adopted from Gao et al. [17]: (1) grinding the soybean into fine powder (<0.15 mm), (2) mixing the soybean powder in deionized water at a specific concentration to obtain a homogeneous suspension, and (3) centrifuging the suspension at 4 °C and 3000 r·min−1 for 15 min. The supernatant containing the urease enzyme was the crude soybean urease for subsequent experiments. Commercial urease powder (Sigma-Aldrich, St. Louis, MO, USA) was mixed with deionized water to obtain the pure urease solution [26].
Enzyme activity is a critical factor affecting the microstructure of the produced CaCO3, uniformity of treatment, and mechanical behavior of bio-treated soil [34,35,36]. In this study, the urease activity was determined by measuring the urea hydrolysis rate, as proposed by Tirkolaei et al. [23]. A 10 mL volume of the urease solution was added to an equal volume of 0.2 M urea solution in three tubes. The tubes were promptly sealed and gently shaken until the reaction was brought to a halt via the introduction of 10 mL of 15% trichloroacetic acid. Specifically, the first tube was subjected to the acid after 2 min, the second tube after 5 min, and the third tube after 10 min. The concentration of ammonium, a product of urea hydrolysis, was assessed using the Nessler method for the calculation of urease activity [37]. Based on previous studies, enzyme activity for soil treatment typically ranges from 0.5 to 10 mmol·L−1·min−1 [17,38,39]. To ensure a fair comparison, both crude soybean urease and pure urease were prepared with an identical enzyme activity of 5 mmol·L−1·min−1. At this activity, the concentrations of crude soybean urease and pure urease were 46 g·L−1 and 11.7 g·L−1 according to actual measurements, respectively. At these concentrations, the viscosity coefficients of the two urease solutions were measured using the NDJ-5S digital rotational viscometer (uncertainty = 2% at a 95% confidence level), following the method by Fu et al. [40]. The viscosity coefficients of the crude soybean urease and pure urease solutions at 20 °C were 1.4 and 1.1 mPa·s, respectively. The compositions of the organic matter (including total protein, amino acids, and soluble polysaccharides) in crude soybean urease and pure urease were measured using the Bradford method, ion-exchange chromatography combined with post-column derivatization and the ninhydrin reagent method, and the phenol–sulfuric acid method [41], as shown in Table 1.

2.2. Desert Sand

Desert sand was collected from the Tengger Desert in Shapotou, Ningxia, China. The sampling site has an arid climate, and the average annual wind speed is roughly 2.8 m·s−1, with maximum wind speeds exceeding 17.2 m·s−1 [42]. The ground surface is extensively covered with bare desert sand, which is prone to wind erosion, posing a great threat to the local ecosystem. The desert sand was classified as poorly graded sand (SP) according to the Unified Soil Classification System [43]. Table 2 summarizes the basic properties of the desert sand.

2.3. Test Program and Sample Preparation

The organic matter in the urease extract would precipitate under the salting-out effect, which may influence the distribution of CaCO3 and organic matter contents, as well as the wind erosion of treated sand mediated through crude soybean urease and pure urease. To verify this, the test program was divided into two sets. In the first set of tests, performed in test tubes, soybean urease and pure urease were mixed with 0.2 mol·L−1 calcium chloride-urea (purity of 99%, Sinopharm Chemical Reagent Co., Ltd., Shanghai, China) solution, respectively, to compare the amount of CaCO3 and organic matter precipitation during the EICP process. In the second set of tests, two group desert sand specimens were prepared: (1) sand treated with crude soybean urease and 0.2 mol·L−1 calcium chloride solution, and (2) sand treated with pure urease and 0.2 mol·L−1 calcium chloride solution. The non-urea group was investigated as a control to independently analyze the effect of salting-out on the biotreatment effectiveness. In addition, another two groups of desert sand specimens were treated with the treatment solutions, as in the tube tests, to evaluate the effect of organic matter precipitation induced by the two ureases on the CaCO3 distribution and wind erosion resistance of EICP-treated sand. Each group underwent 1, 2, and 3 treatment cycles, and each cycle consisted of spraying the treatment solution onto the specimens followed by 24 h of curing at room temperature. The detailed test program is shown in Table 3.
To obtain the amount of CaCO3 and organic matter precipitation with time, 25 mL of urease solution was mixed with 25 mL of 0.2 mol·L−1 calcium chloride-urea solution in test tubes at a constant temperature of 25 °C. The precipitates were filtered, weighed, and the amount of CaCO3 and organic matter precipitation was measured at regular intervals. The procedure consisted of the following steps: (a) the treatment solution was filtered through the filter paper to collect the total precipitates in a certain period; (b) the precipitates on the filter paper were rinsed using deionized water to remove residual soluble chemicals; (c) the filter paper and the precipitates were dried and weighed, wherein the dry filter paper had been pre-weighed, and the mass of total precipitates was the difference between them; and (d) 1 mL sample of the filtered treatment solution was taken for calcium ion testing according to the ethylenediaminetetraacetic acid (EDTA) titration method [44]. The amount of CaCO3 precipitation at a specific time could be calculated from the concentration of calcium ions in the sample. The amount of organic matter precipitation was calculated as the difference between the masses of total precipitates and calcium carbonate. The filtered treatment solution was allowed to continue reacting, and the above steps were repeated at regular intervals to obtain the amount of CaCO3 and organic matter precipitation in the corresponding period. Three groups of parallel tests were carried out to guarantee the reliability of the test results.
The soil specimen preparation was performed in reference to the study by Fattahi et al. [45]. Soil specimens were prepared in stainless-steel pans with internal dimensions of 24 cm × 17 cm × 4 cm. Each pan had small drainage holes (5 mm diameter) at the bottom, covered with a 300-mesh nylon net as a filter. The pre-weighed desert sand was placed into the pan to achieve a dry density of 1.51 g·cm−3, and the surface of the specimen were smoothed by a roller. The treatment solution contained each urease and 0.2 mol·L−1 calcium chloride solution or calcium chloride-urea solution at a volume ratio of 1:1 (Table 3). The treatment solution was evenly sprayed onto the soil surface at a dosage of 4 L·m−2 [20,33]. For multi-treated specimens, the time interval between each spray was 24 h to ensure that the reaction was fully completed. After the above treatment was completed, all of the specimens were oven-dried for subsequent wind erosion tests. Triplicate specimens for both crude soybean urease- and pure urease-treated sands were prepared to ensure the repeatability of the tests.

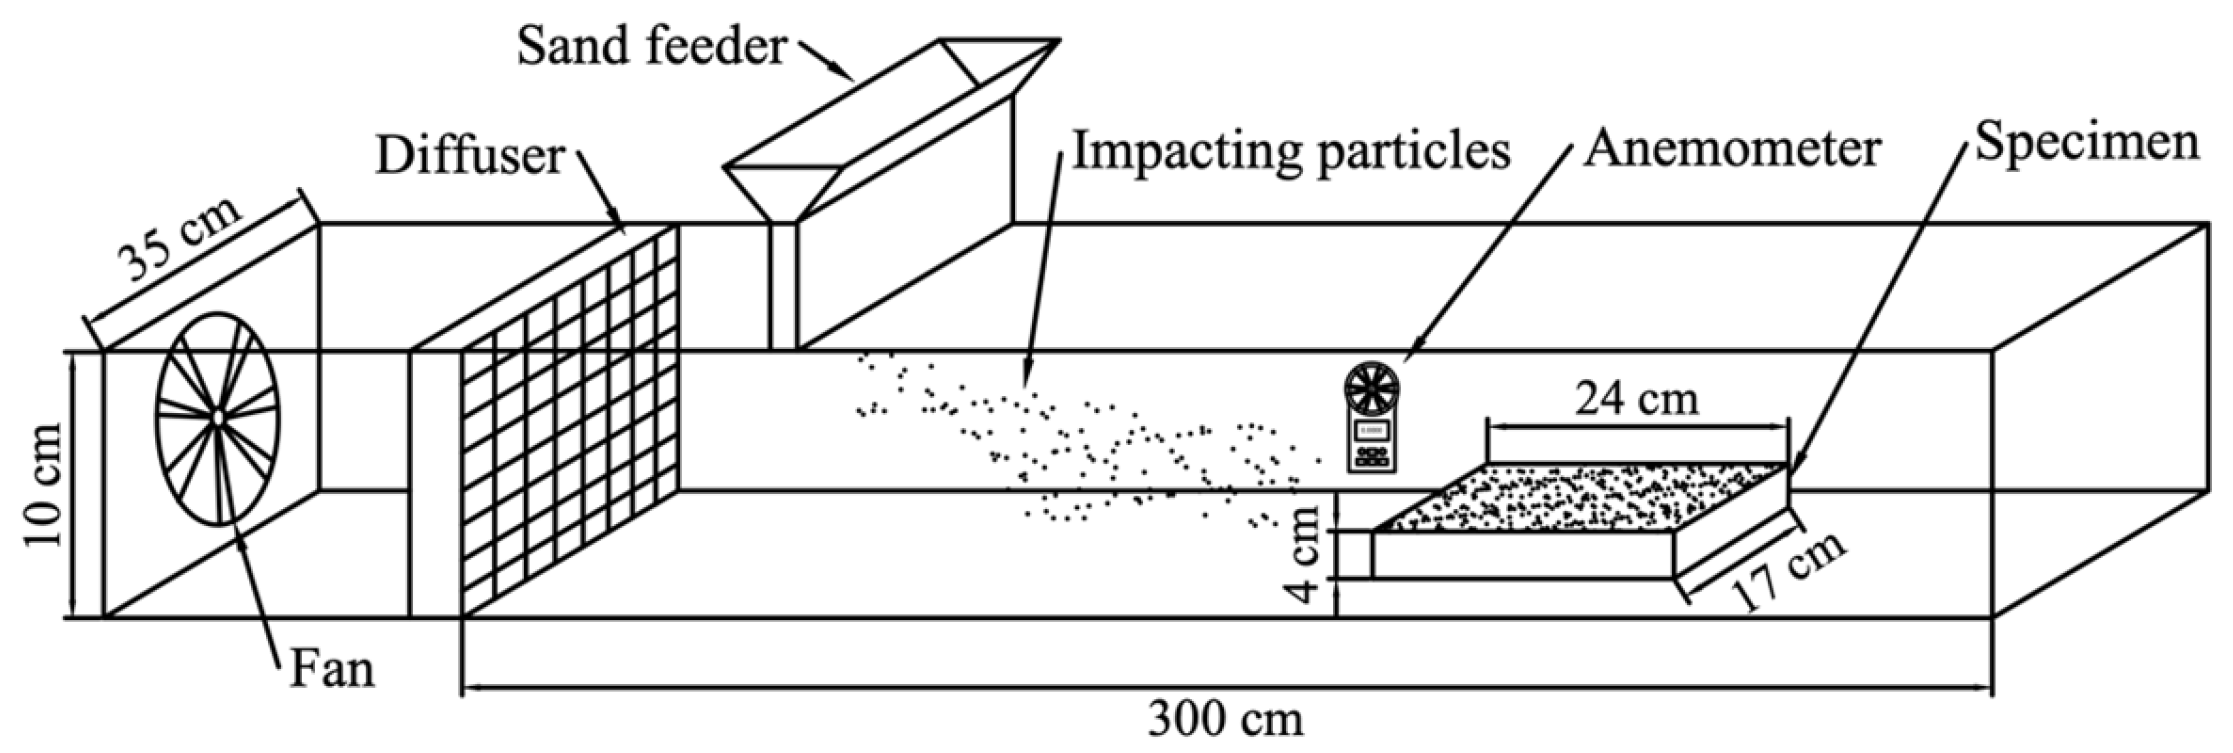
2.4. Wind Erosion Test

Previous studies have employed various wind erosion devices, such as wind blowers [46] and sirocco fans [47]. The results showed a consistent trend with those obtained using professional wind tunnels [14,48], demonstrating the availability of these erosion devices. In this study, the test equipment (Figure 1) and wind-sand flow simulation method followed the approach described by Liu et al. [33]. The air current was generated using a 1000 W fan and passed through a diffuser to minimize turbulence. An anemometer (AS386, Smart Senor Co., Ltd., Hongkong, China) was used to measure the wind velocity at the sand surface. Desert sand particles were introduced into the airflow through a sand feeder to simulate wind-blown sand flow with a steady flux. The sand supply rate was calculated as the amount that the airflow at a given velocity could carry, which was approximately consistent with the measured value [33,49]. In this study, soil mass loss was adopted as the indicator to evaluate the wind erosion resistance of specimens, which refers to the loss of soil mass per unit time and unit area at a certain wind velocity [50,51]. The treated specimens were weighed per minute using a 0.01 g accurate balance under 10 m·s−1 wind velocity for 12 min.

2.5. Measurement of CaCO3 and Organic Matter Contents in the Soil

Sand samples (5 g each) from the top (5 mm from the surface), middle (20 mm from the surface), and bottom (35 mm from the surface) regions were collected to measure the CaCO3 content, respectively. The samples were rinsed with deionized water to wash away residual reaction substrates, followed by the dissolution of CaCO3 using 2 mol·L−1 hydrochloric acid. The calcium ion concentration in the acid solution was determined using the EDTA titrimetric method [44]. The measured calcium ion concentration corresponded to the amount of CaCO3 precipitation in the soil.
The organic matter (carbon) content in the treated specimens was determined using a Vario TOC Select (Elementar, Langenselbold, Germany) total carbon analyzer [52,53]. Approximately 150 mg of soil sample taken from the top, middle, and bottom regions (same regions as the sample collection for CaCO3 measurement) was subjected to total carbon analysis after high-temperature combustion and inorganic carbon analysis after acidification. The organic matter content was obtained by subtracting the inorganic carbon from the total carbon and then multiplying it with a conversion factor. The conversion factors for soybean urease-treated specimens and pure urease-treated specimens were 2.079 and 2.514, respectively [26].

3. Results

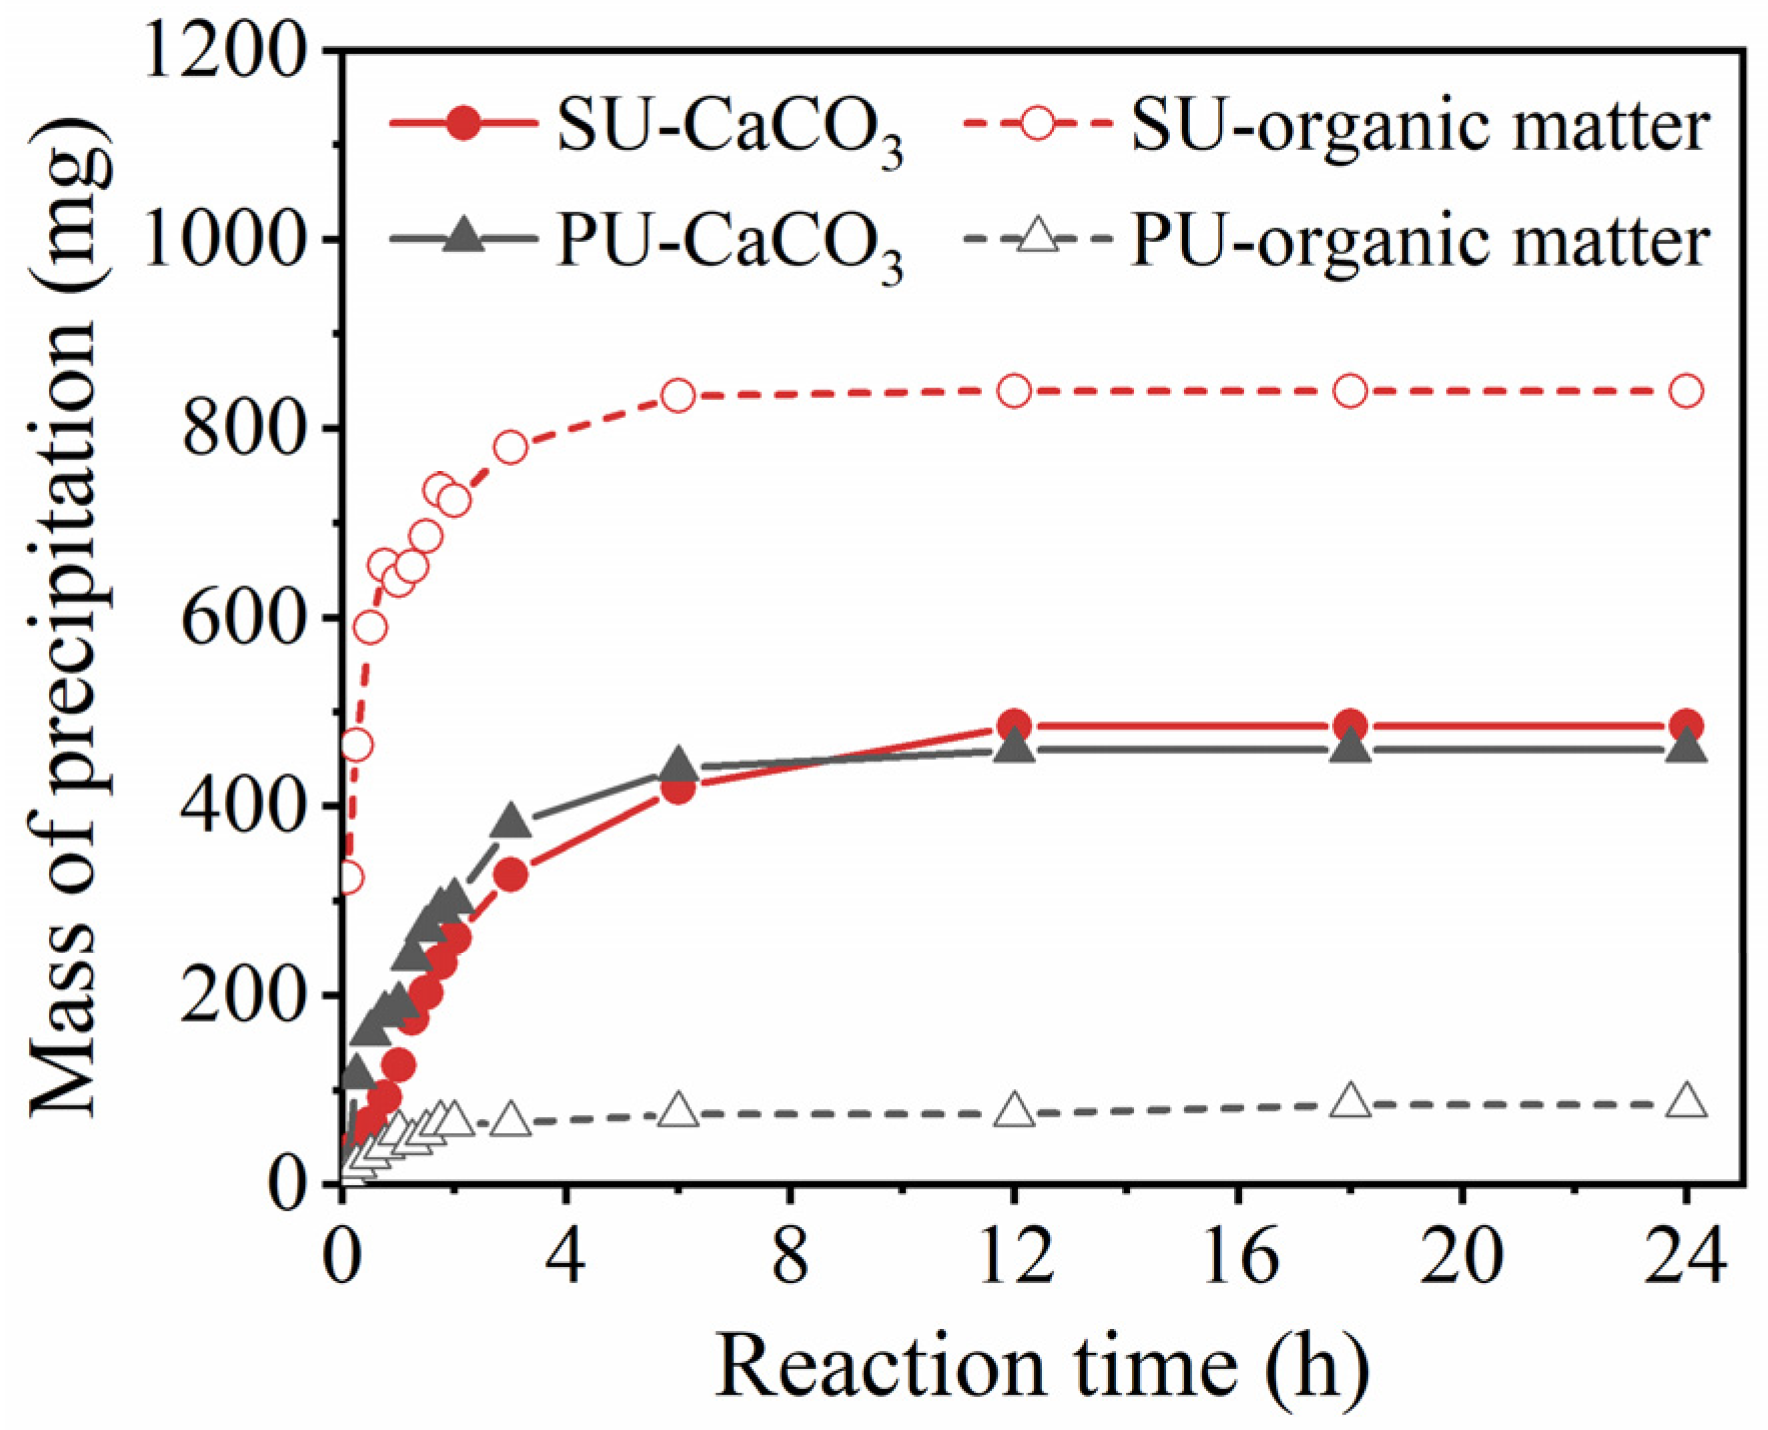
3.1. Precipitation Rates of CaCO3 and Organic Matter in the Tube Tests

Figure 2 presents the masses of CaCO3 and organic matter precipitates over time induced by soybean urease (SU) and pure urease (PU). It can be seen that the amount of organic matter precipitation in the SU specimen generated by the salting-out effect initially reached 325 mg and then increased rapidly to 850 mg within 6 h. The precipitation rate of organic matter gradually decreased with time, from the initial 1300 mg·h−1 (15 min) to 18.3 mg·h−1 after 3 h. The intense organic matter precipitation at the initial stage of the reaction was due to the high concentrations of saline ions. As the reaction progressed, the continuous consumption of saline ions weakened the salting-out effect, leading to the decrease of organic matter precipitation rate. It can also be seen that the amount of CaCO3 precipitation gradually increased with time and reached a yield of 480 mg after 12 h, corresponding to a calcium ion conversion rate of 96%. The precipitation rate of CaCO3 also gradually decreased with time, likely due to the reduction in urease activity and reactant availability [54]. For the PU specimen, the organic matter precipitation reached 70 mg in 2 h and remained stable thereafter. The mass of CaCO3 precipitation increased with time and finally reached 470 mg after 12 h, corresponding to a reaction conversion rate of 94%.
Comparing the reaction processes of SU and PU specimens, the masses of organic matter precipitate produced by soybean urease in the first 5 min and end of the reaction were 32.5- and 9.88-times higher than those produced by pure urease, respectively. This significant difference was related to the purity of the urease solutions. To achieve a urease activity of 5 mmol·L−1·min−1, the concentrations of crude soybean urease and pure urease were 46 g·L−1 and 11.7 g·L−1, respectively. The higher concentration of crude soybean urease introduced more organic matter into the solution (Table 1). When the soybean urease solution was mixed with the cementation solution, the high content of organic matter precipitated out of the solution, resulting in more total precipitation.

3.2. Organic Matter Precipitation Distribution in Soil

Figure 3a,b show the distribution of organic matter content for the treated specimens without and with urea, respectively. The organic matter content of SU-treated specimens was higher than that of PU-treated specimens under the same number of treatment cycles due to the larger amount of organic matter in the crude soybean urease solution. In terms of organic matter content in different regions, the distribution of organic matter content along the depth of PU-treated specimens was always relatively uniform, while the uneven distribution of organic matter content in SU-treated specimens was exacerbated with multiple treatments. It is worth noting that the organic matter content at the bottom of SU-treated specimens remained almost constant during multiple treatments, regardless of the presence of urea. These observations were mainly attributed to the salting-out effect of organic matter and the viscosity of the treatment solution. Since the viscosity coefficient of the crude soybean urease (1.4 mPa·s) was higher than that of pure urease (1.1 mPa·s), it took longer for the SU-treatment solution to infiltrate into the sand specimens. Moreover, as demonstrated in the tube tests, organic matter precipitation due to the salting-out effect occurred at the initial stage of the reaction. Therefore, a significant amount of organic matter could rapidly precipitate in the upper layer of SU-treated specimens. The organic matter precipitates can occupy the soil pores and increase the filtration capacity of the soil. As a result, the organic matter would gradually accumulate in the upper layer of soil, reducing the soil permeability. In addition, comparing the distribution of organic matter in SU-treated specimens with and without urea, it was found that the presence of urea exacerbated the heterogeneity of organic matter distribution. This was attributed to the CaCO3 precipitation generated in the presence of urea further decreasing the permeability of the upper soil layer and impeding the flow of the treatment solution.

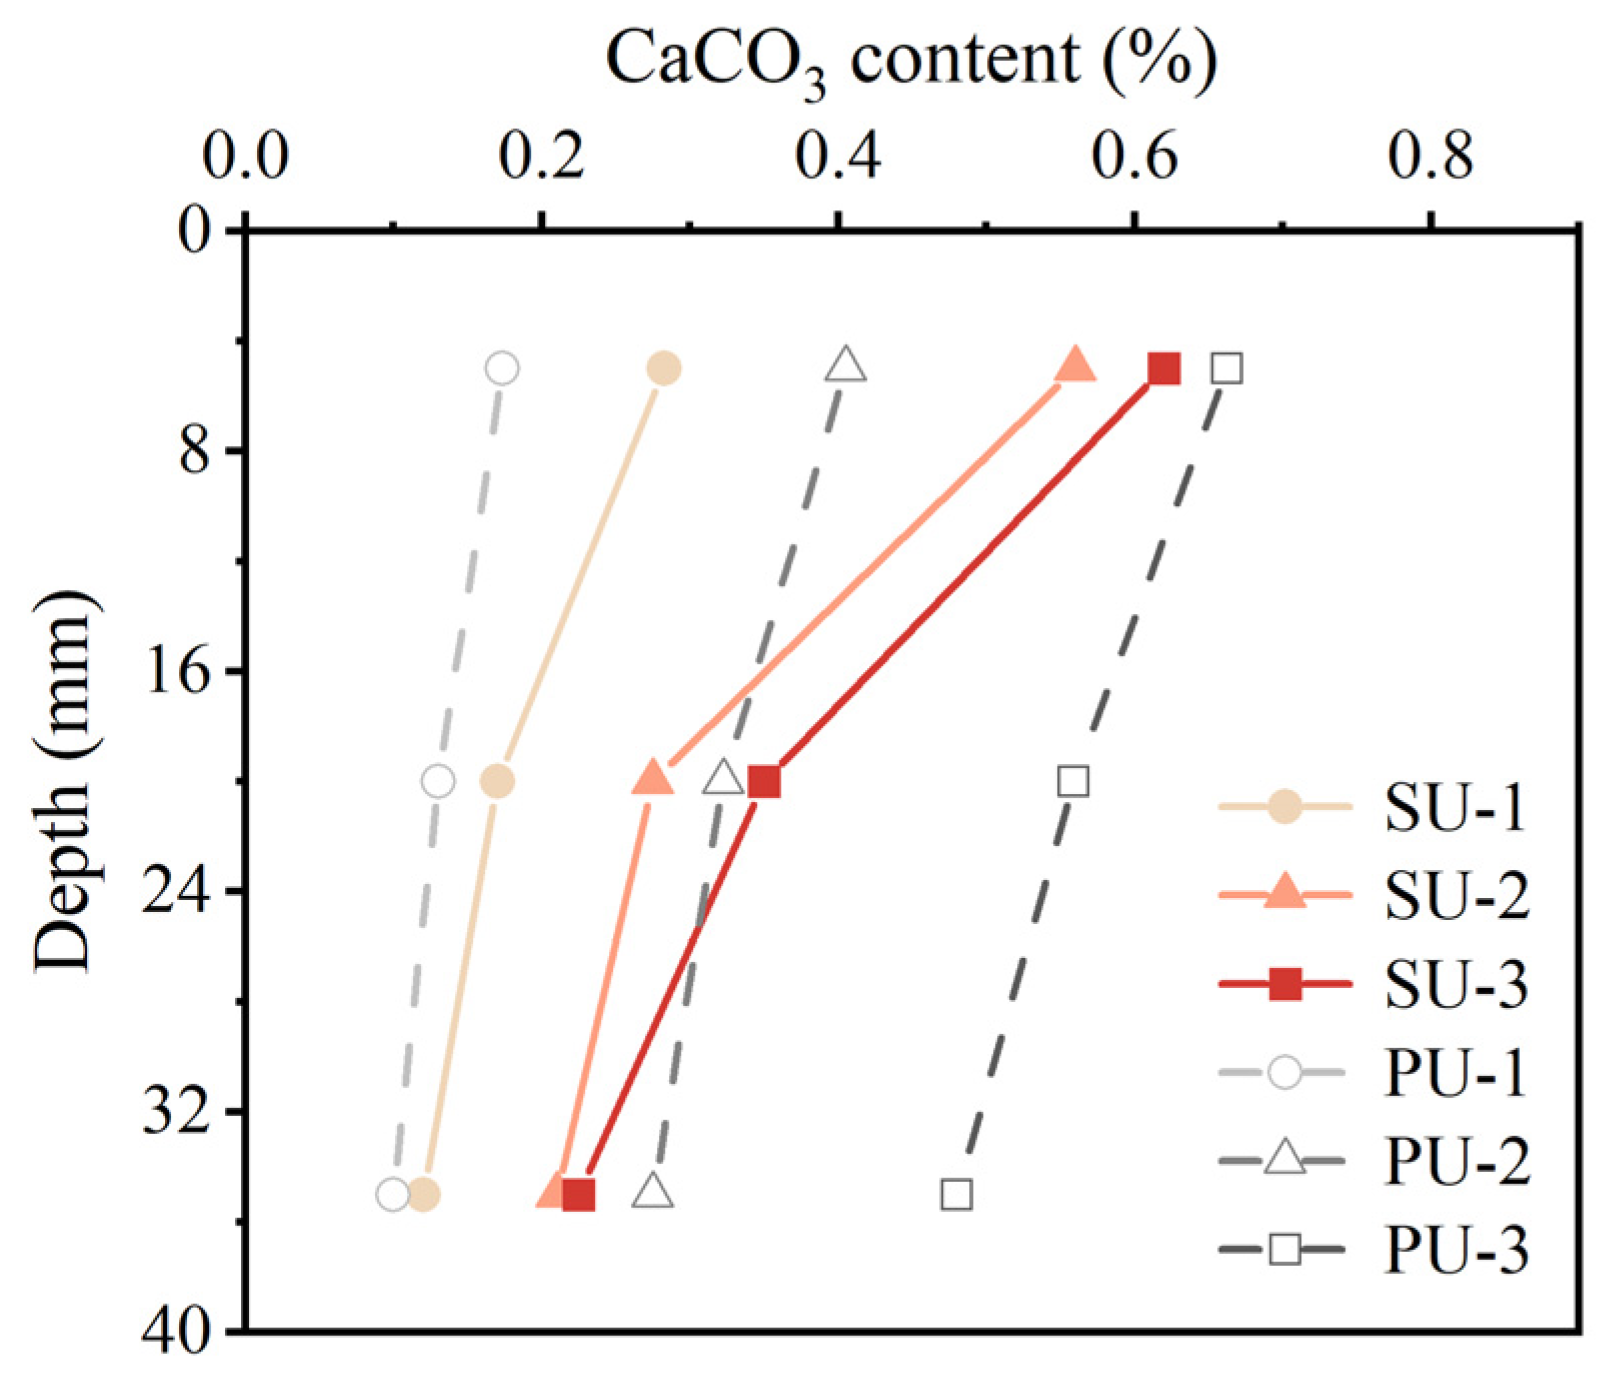
3.3. CaCO3 Precipitation Distribution in Soil

Figure 4 shows the distribution of CaCO3 content along the depth of each EICP-treated specimen. The CaCO3 distribution in SU-treated specimens followed a trend similar to that of organic matter. For SU-1, the CaCO3 content in the upper part (about 0.29%) was about 2.4-times higher than that in the bottom part (about 0.12%). After multiple treatments, the CaCO3 content of SU-treated specimens increased, while the spatial distribution inhomogeneity was aggravated. The CaCO3 content in the top of SU-3 was about 2.8-times higher than that in the bottom layer. By comparing the CaCO3 content of SU-treated specimens in the same region, it was found that the growth rate of CaCO3 content decreased with additional treatment cycles. For example, the CaCO3 content in the top layer increased by 97% from SU-1 to SU-2 but only by 10.7% from SU-2 to SU-3. In particular, the CaCO3 contents at the bottoms of SU-2 and SU-3 were almost identical, suggesting that the third treatment cycle was ineffective for the bottom soil. The inhomogeneous CaCO3 distribution of SU-treated specimens may have been related to the high amount of organic matter provided by the crude soybean urease. As described in Section 3.1 and Section 3.2, organic matter and CaCO3 precipitation occurred simultaneously, and the rate of organic matter precipitation was significantly higher at the initial stage of the reaction. The relatively high amount of organic matter in soybean urease would increase the viscosity of the treatment solution, and co-precipitation of organic matter and CaCO3 would occupy the soil pores rapidly, resulting in a decrease in the permeability in the upper part of SU-treated specimens. When the permeability in the upper part of the soil was low, it was difficult for the treatment solution to be distributed evenly in the sand specimen. As a result, more CaCO3 was precipitated in the upper layer of the soil. A similar phenomenon was reported by Liu et al. [26] and Cui et al. [55], who found that the distribution of CaCO3 content for EICP-treated sand with crude soybean urease was more uneven compared to that with other types of ureases under multiple treatments.
Figure 5 shows the photos of the EICP-treated sand with crude soybean urease and pure urease. The surface color of PU-treated specimens hardly changed after three-cycle treatment. By contrast, SU-treated specimens developed a visible layer of deposit on the top surface, which became progressively whiter as the number of treatment cycles increased. These results were in agreement with the measured organic matter and CaCO3 contents of the soil, which were uniformly distributed along the depth of PU-treated specimens and gradually accumulated at the top surface of SU-treated specimens. A similar phenomenon was also found by Miao et al. [21] and Liu et al. [26], where white precipitation covered the soil surface after multiple EICP treatment cycles with crude soybean urease.

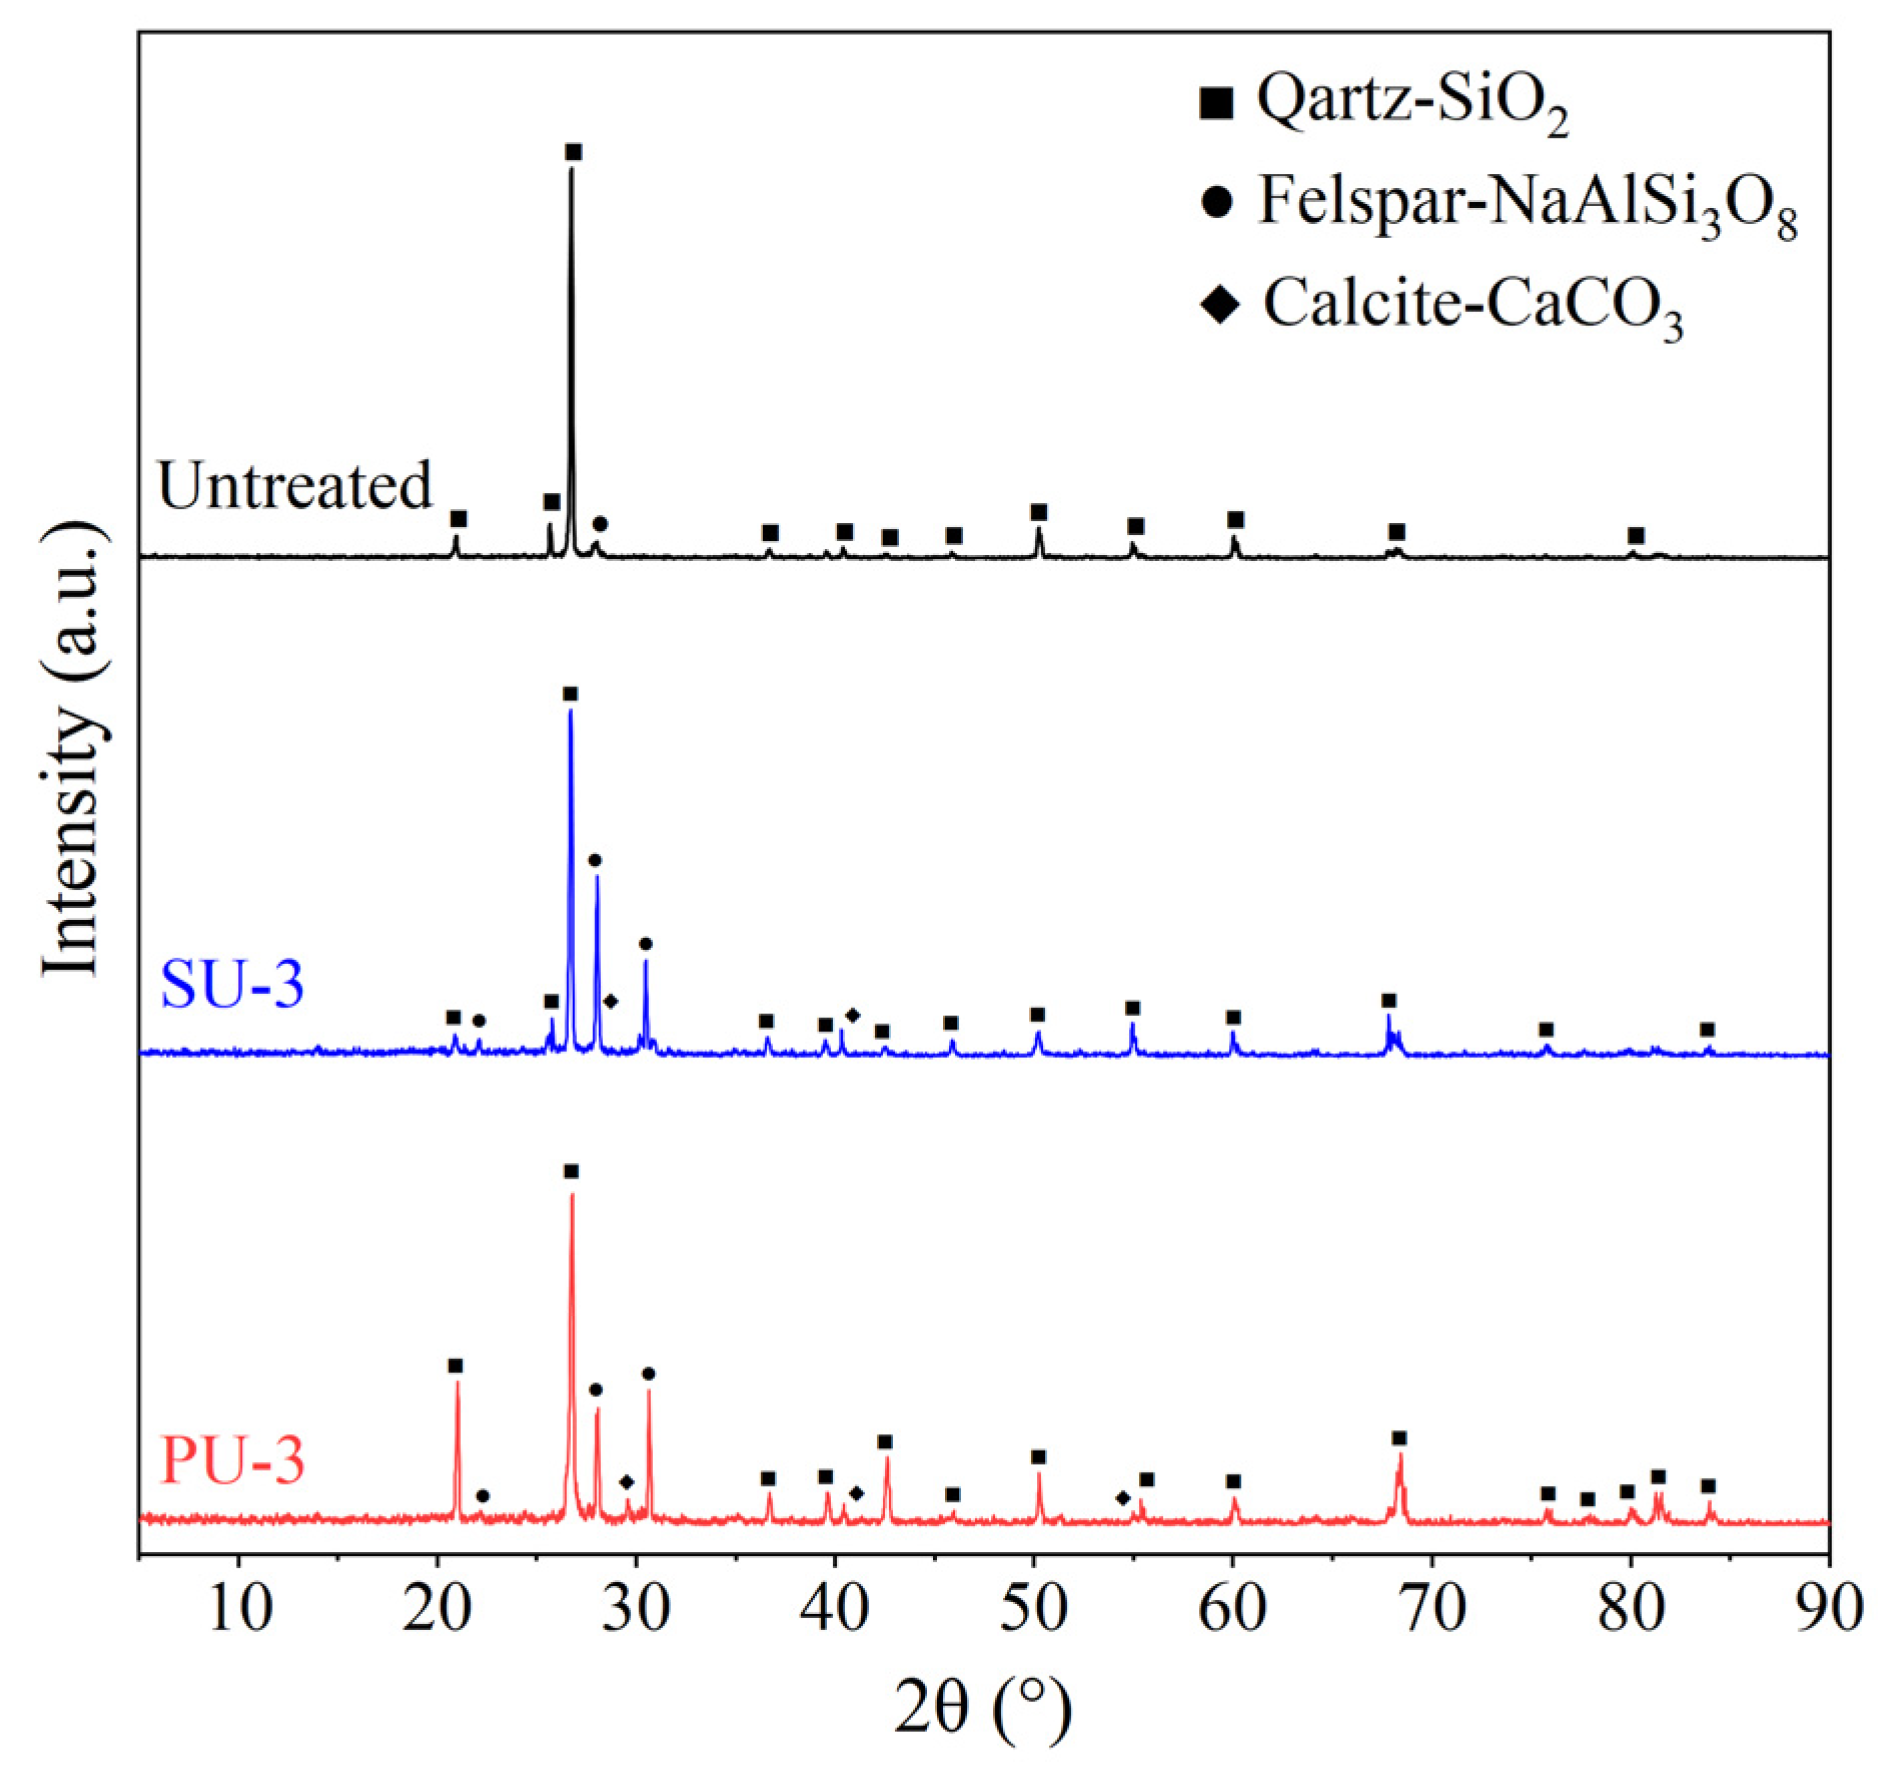
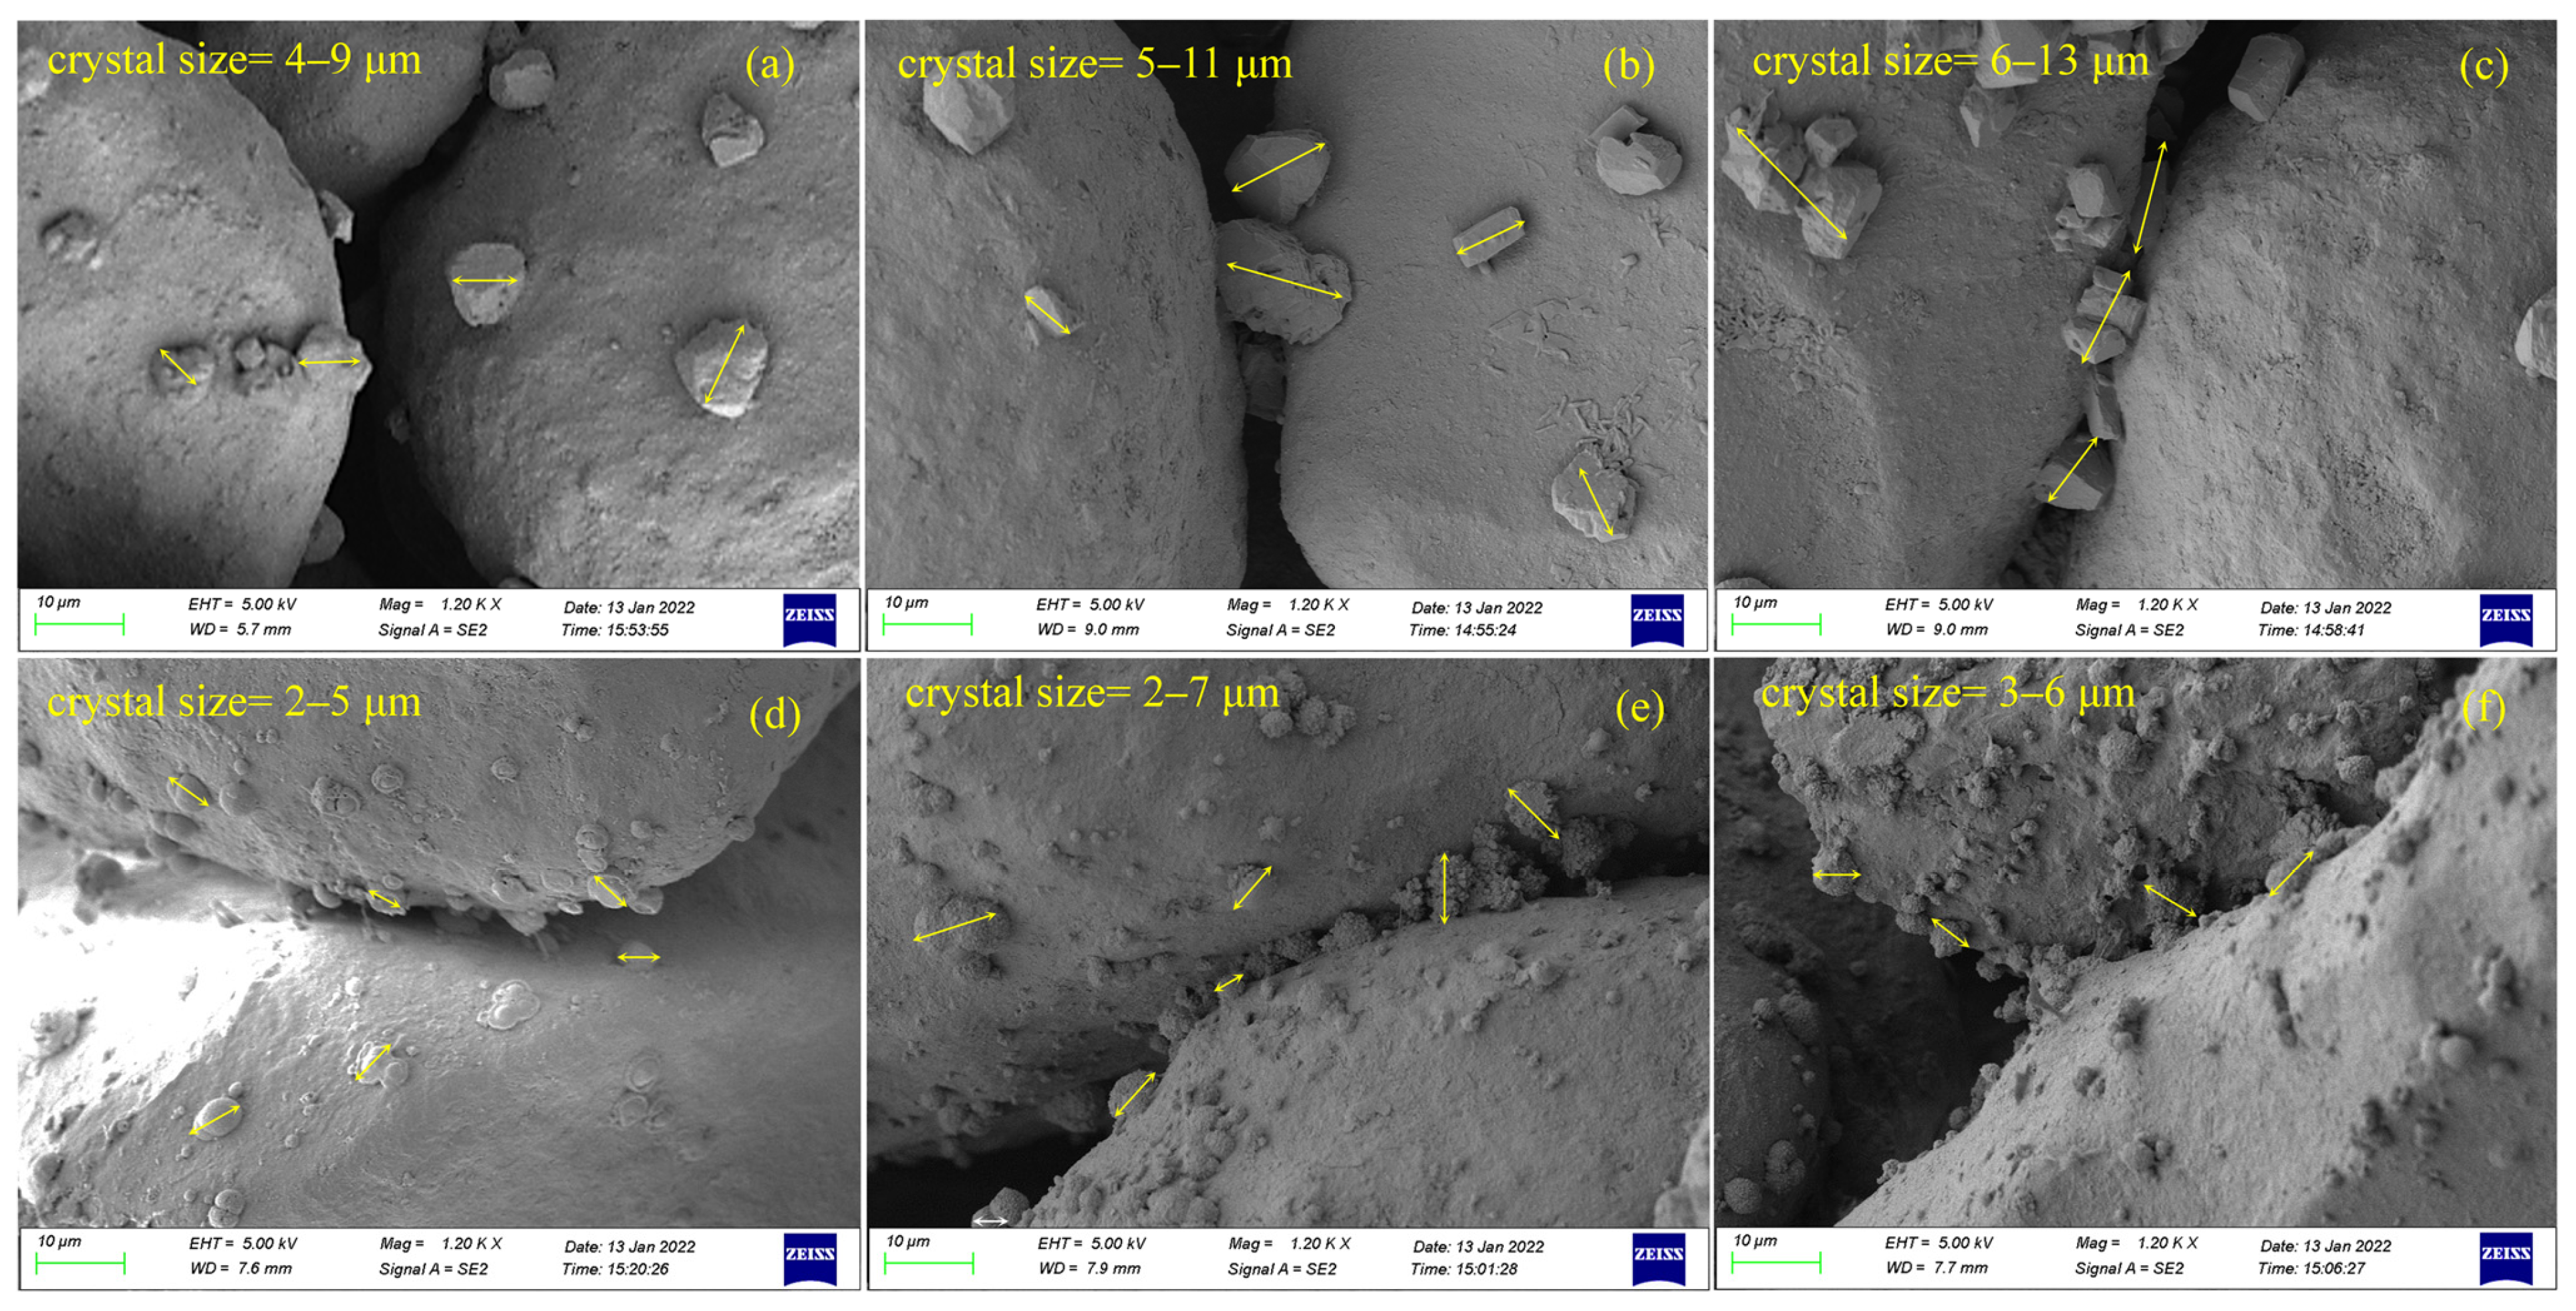
3.4. Microstructure of EICP-Treated Soil

The crystalline phases of precipitated CaCO3 crystals in the untreated sand, SU-3, and PU-3 were analyzed using the X-ray diffraction (XRD) technique. As shown in Figure 6, the mineral composition of the untreated sand was mainly quartz and feldspar, and the CaCO3 precipitated in SU-and PU-treated specimens was mainly calcite, suggesting that the difference in the organic matter content between crude soybean urease and pure urease would not influence the crystal phase of the formed CaCO3.
The top layer of the specimens (5 mm from the surface) was sampled for scanning electron microscopy (SEM) analysis. Figure 7 illustrates the differences in crystal morphology and size of CaCO3 crystals induced by pure urease (PU) and crude soybean urease (SU), respectively. It was found that CaCO3 crystals formed at the contact points between sand particles for both SU- and PU-treated specimens. The CaCO3 crystals in PU-treated specimens exhibited a rhombic shape, while those in SU-treated specimens appeared spherical, despite both being calcite. This difference in the morphology of the CaCO3 crystals may have been influenced by the organic matter. Researchers have demonstrated that organic matter can round the edges and corners of CaCO3 crystals by adsorbing onto crystal planes and altering their growth rates [56,57,58]. In addition, it was seen that the size of the CaCO3 crystals in PU-treated specimens increased with the number of treatment cycles, while the crystal size in SU-treated specimens remained almost unchanged. The crystal size for PU-treated specimens was always larger than that for SU-treated specimens under the same number of treatment cycles. The difference in crystal size may also have been related to the introduced organic matter. Studies have reported that a high concentration of organic matter can prevent crystal layers from growing either by blocking the active growth sites to available ion clusters or by binding Ca2+ ions, inhibiting CaCO3 growth [59,60,61,62].

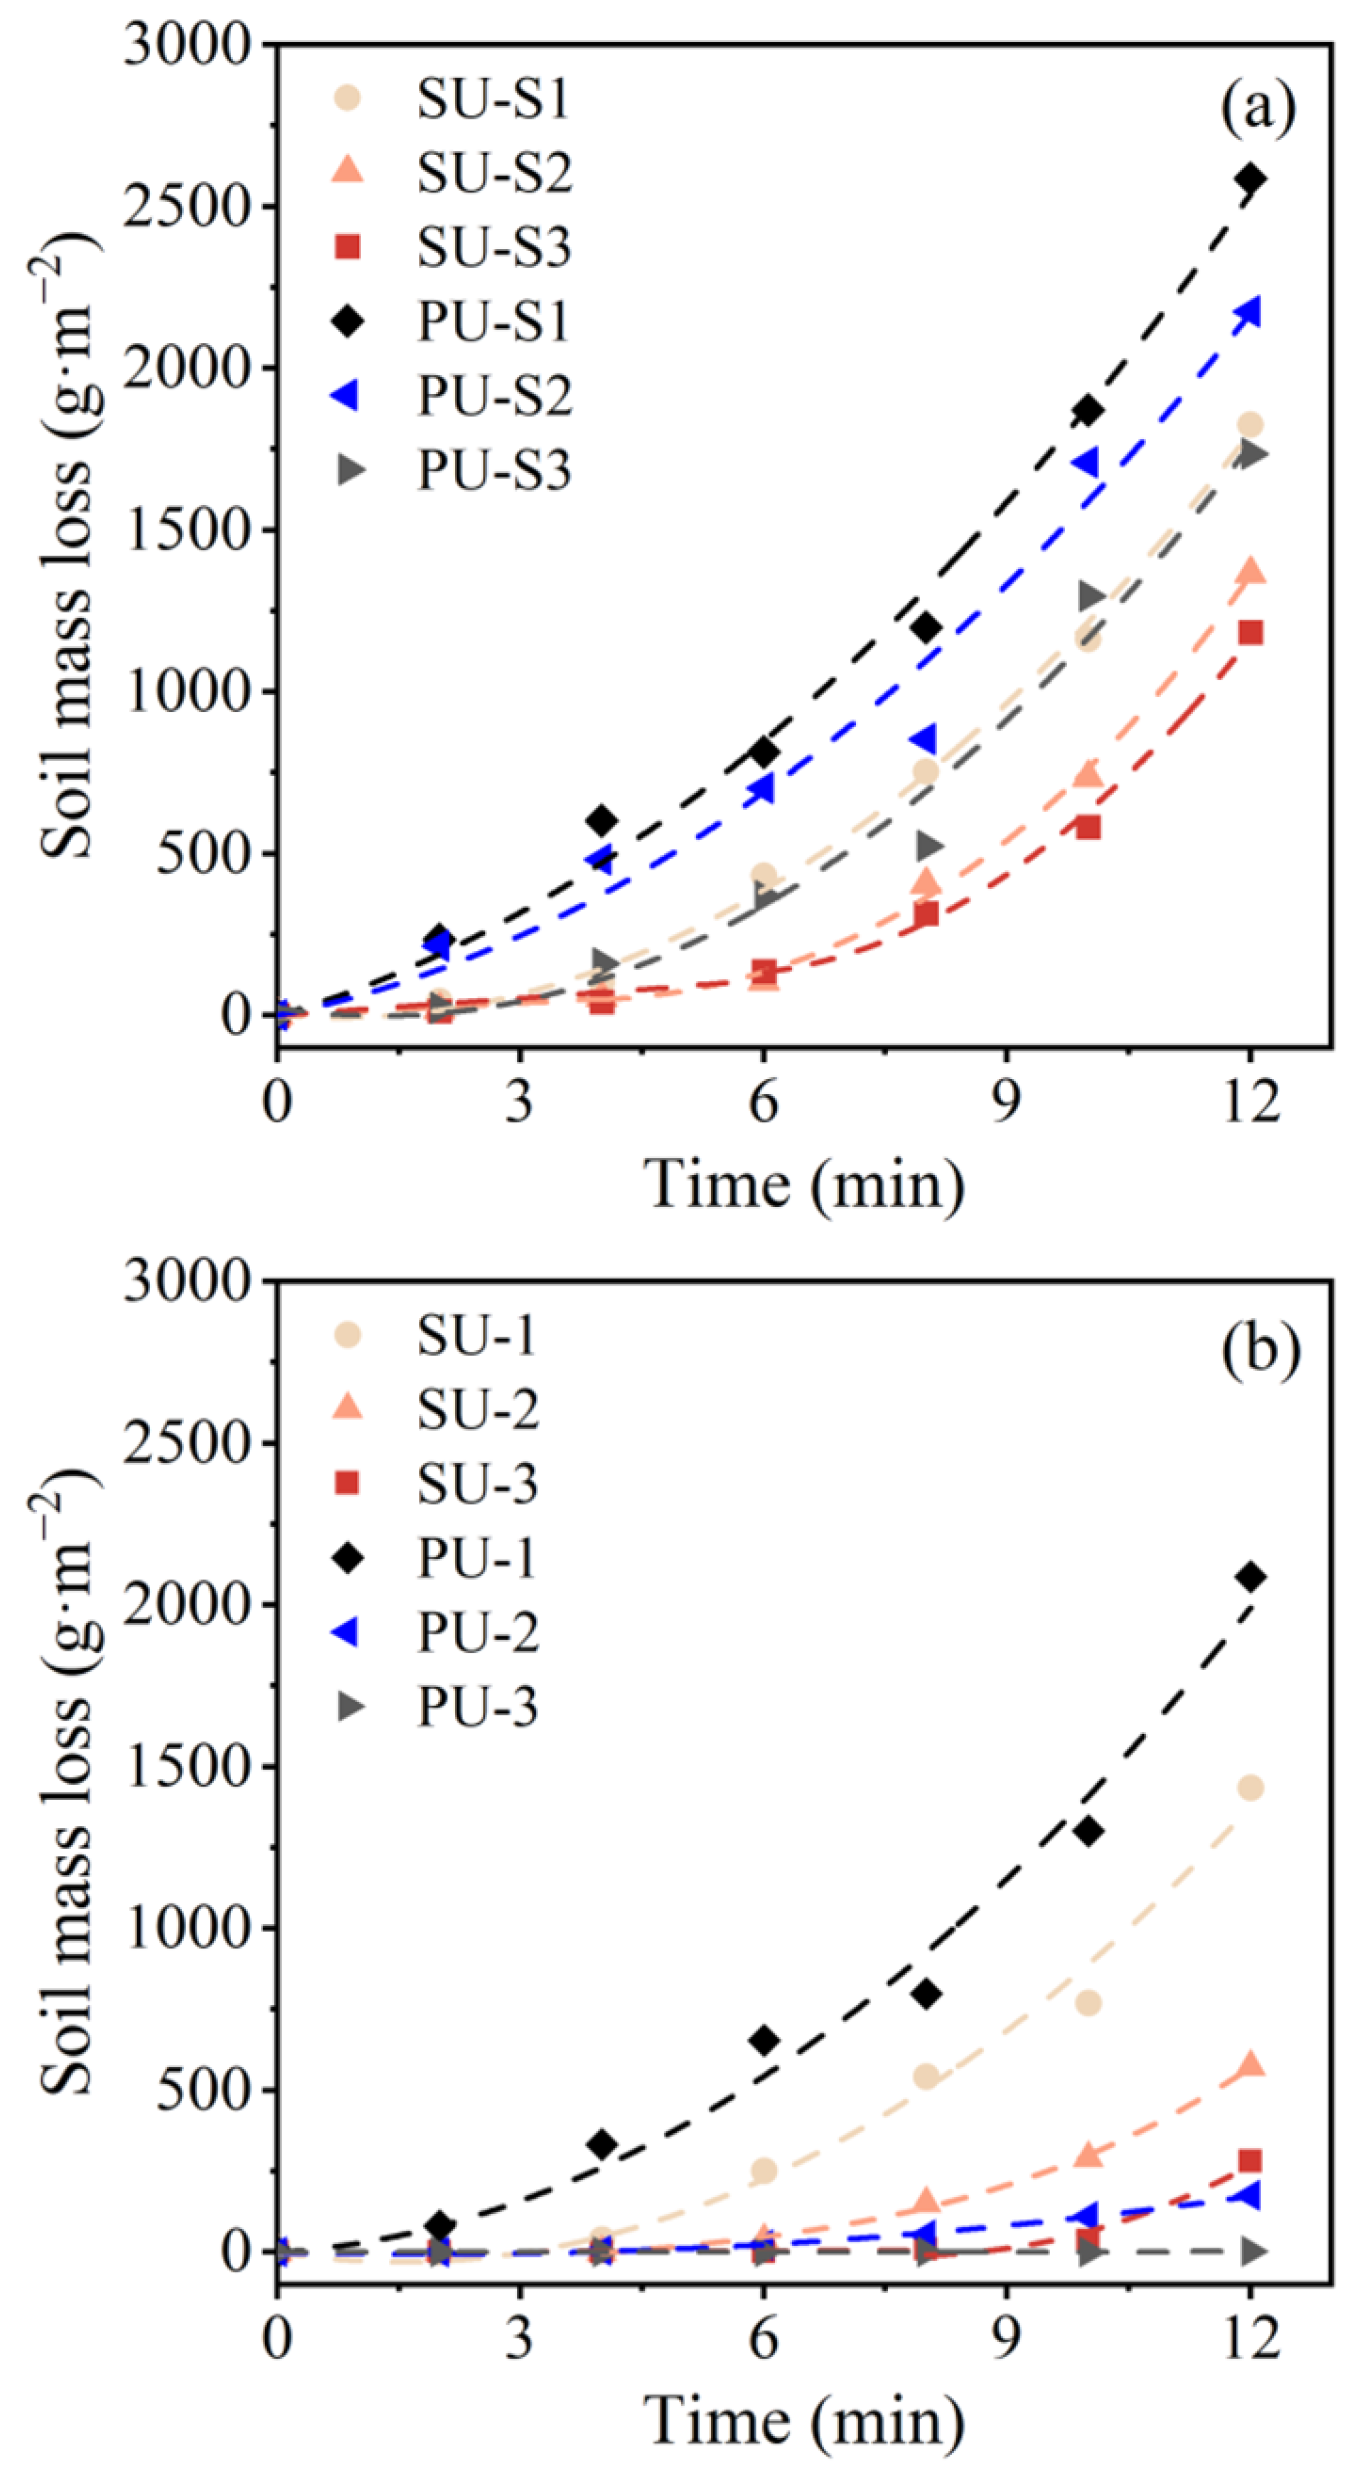
3.5. Wind Erosion Resistance

Figure 8a shows the soil mass loss of crude soybean urease (SU)- and pure urease (PU)-treated sand specimens without urea under 10 m·s−1 wind-blown sand flow for 12 min. It should be noted that the mass loss of untreated desert sand exceeded 13,000 g·m−2. The erosion mass of SU-and PU-treated specimens decreased as the increase in the number of treatment cycles. The final erosion mass of PU-treated specimens was always higher than that of SU-treated specimens under the same number of treatment cycles. The phenomenon was due to the higher content of organic matter in SU introduced into the soil during the treatment. It has been demonstrated that organic matter can cement loose particles and provide erosion resistance to the soil and the erosion resistance of treated soil can be improved with increasing organic matter concentration [29].
Figure 8b plots the soil mass loss of EICP-treated sand specimens with crude soybean urease (SU) and pure urease (PU), respectively. For SU-treated sand, the failure time (i.e., the time when the soil mass loss of the specimen exceeded 0 g·m−2) of SU-1 was at about the 4th min, with a final erosion mass of around 1436 g·m−2. By increasing the number of treatment cycles to 2 and 3, the failure time of specimens was postponed to the 6th and 8th min, respectively. The final mass losses of SU-2 (574 g·m−2) and SU-3 (280 g·m−2) decreased by 60% and 80%, respectively, compared to SU-1. These phenomena were mainly due to the stronger resistance caused by more CaCO3 and organic matter precipitation through multiple treatments. A similar trend was also found for PU-treated specimens. Compared to SU-1, PU-1 exhibited an earlier failure time (2nd min) and larger final erosion mass (2087 g·m−2) due to the lower content of CaCO3 and organic matter in PU-1. Therefore, SU is recommended to enhance the wind erosion resistance of desert sand under a single EICP treatment cycle. As the number of treatment cycle increased, the failure time of PU-2 (4th min) remained earlier than that of SU-2 (6th min), while final erosion mass of PU-2 (176 g·m−2) was 70% lower than that of SU-2 (574 g·m−2). This change was related to the contents of CaCO3 and organic matter in SU-2 and PU-2. As discussed earlier, higher amounts of CaCO3 and organic matter precipitates were formed in the top of SU-2, indicating that the wind erosion resistance of the soil in the top was much higher than that in the middle and bottom. Once the top of SU-2 was eroded, the soil below the top layer was lost rapidly. It indicated that optimization studies on the crude extraction of soybean urease are necessary to achieve more homogeneous and efficient bio-cementation in multiple treatments. By contrast, the use of pure urease may have made it possible for the CaCO3 and organic matter in PU-2 to distribute uniformly, so that the CaCO3 contents in the middle and bottom of PU-2 were higher than those of SU-2. Therefore, a lower final erosion mass of PU-2 was obtained although the failure time of PU-2 was still lower than that of SU-2. After applying the third treatment cycle, the failure time of PU-3 (12th min) exceeded that of SU-3 (8th min) and the final erosion mass of PU-3 (13 g·m−2) was about 95% lower than that of SU-3 owing to the higher CaCO3 content along the depth in PU-3.
The above results demonstrated that the inhomogeneous bio-cementation induced by excess organic matter in crude soybean urease not only limited the number of treatment cycles but also restricted the cementation level of the treated soil. In fact, different kinds of crude urease could potentially induce the salting-out of organic matter, which is particularly noticeable for crude soybean ureases containing high levels of organic matter. However, the low cost of crude soybean urease in comparison to pure urease offers a significant advantage for large-scale local application. Optimization studies of crude soybean urease extraction and utilization should be performed. In addition, a comprehensive evaluation of the effectiveness and cost of treatment using various crude ureases should be conducted in the future.

4. Conclusions

This study compared the wind erosion resistance of treated desert sand with crude soybean urease- and pure urease-induced carbonate precipitation. The amount of organic matter and calcium carbonate precipitation during the reaction process induced by the two ureases was intuitively displayed through tube tests. Sand specimens were treated with crude soybean urease (SU) and pure urease (PU) for several cycles with urea or without urea, respectively. The treated sand specimens were eroded by subjecting them to wind-blown sand flow. The following conclusions were drawn from the experimental results:
(1)
With the same enzyme activity of 5 mmol·L−1·min−1, more organic matter in SU was introduced into the soil than with PU. Due to the salting-out effect, the organic matter in SU rapidly precipitated as the urease solution mixed with the cementation solution. The mass of organic matter precipitation produced by SU was 9.88 times higher than that produced by PU.
(2)
The spatial distribution of CaCO3 in sand treated with SU and PU was different. SU-treated sand under multiple cycle treatment had significant non-uniformity in CaCO3 distribution. This was due to the relatively high viscosity of SU and the rapid precipitation of organic matter in the soil pores, which reduced the permeability of the top layer of SU-treated sand.
(3)
There were significant differences in the morphology and size of CaCO3 crystals in PU-treated specimens and SU-treated specimens. The CaCO3 crystals in PU-treated specimens were rhombic and became larger gradually with the increase in the number of treatment cycles. The relatively high concentration of organic matter in SU influenced the morphology and growth of CaCO3 crystals, resulting in spherical crystals in SU-treated specimens and the crystal size remained almost unchanged under multiple cycle treatment.
(4)
Under a single EICP-treatment cycle, SU is recommended to enhance the wind erosion resistance of desert sand. SU can induce more CaCO3 and organic matter precipitation in soil than PU, and the organic matter in soil can also act as part of the cement, leading to lower erosion mass. However, under multiple EICP-treatment cycles, the high concentration of organic matter in SU caused the inhomogeneous distribution of CaCO3 (more precipitation at the top and less at the bottom), leading to low wind erosion resistance in the middle and bottom parts of the soil. Once the top of SU-treated sand was eroded, the sand below the top layer was lost rapidly, resulting in the final erosion mass of PU-3 (13 g·m−2) being about 95% lower than that of SU-3 (280 g·m−2).

Author Contributions

Conceptualization, Y.C.; methodology, Y.C.; formal analysis, Y.L.; investigation, Y.L. and B.L.; resources, Y.Z. and S.Z.; data curation, Y.C.; writing—original draft preparation, Y.C.; writing—review and editing, L.W. and L.H.; visualization, Y.C. and Y.L.; funding acquisition, Y.G. All authors have read and agreed to the published version of the manuscript.

Funding

The authors would like to express their gratitude for the financial support provided by the National Natural Science Foundation of China (Grant Nos. 52208373, 52478367, and 51988101), the Key Research and Development Program of Zhejiang (Grant No. 2022C03095), the National Natural Science Foundation of China (Grant No. 52208357), National Key Research and Development Program of China (Grant No. 2023YFC3007104), the Fundamental Research Funds for the Central Universities (Grant No. 226202400057), the National Natural Science Foundation of China (Grant No. 52208338), Hebei Natural Science Foundation (Grant No. E2023210018), and the Foundation of Key Laboratory of Soft Soils and Geoenvironmental Engineering (Zhejiang University) Ministry of Education (Grant No. 2022P06).

Institutional Review Board Statement

Not applicable.

Informed Consent Statement

Not applicable.

Data Availability Statement

The data presented in this study are available upon request from the corresponding author.

Conflicts of Interest

Author Shijia Zhang was employed by the company Beijing Engineering Corporation Limited (Beijing, China). The remaining authors declare that the research was conducted in the absence of any commercial or financial relationships that could be construed as a potential conflict of interest.

References

  1. Zhang, Z.H.; Huisingh, D. Combating desertification in China: Monitoring, control, management and revegetation. J. Clean. Prod. 2018, 182, 765–775. [Google Scholar] [CrossRef]
  2. Salifu, E.; MacLachlan, E.; Iyer, K.R.; Knapp, C.W.; Tarantino, A. Application of microbially induced calcite precipitation in erosion mitigation and stabilisation of sandy soil foreshore slopes: A preliminary investigation. Eng. Geol. 2016, 201, 96–105. [Google Scholar] [CrossRef]
  3. Cardoso, R.; Pedreira, R.; Duarte, S.O.D.; Monteiro, G.A. About calcium carbonate precipitation on sand biocementation. Eng. Geol. 2020, 271, 105612. [Google Scholar] [CrossRef]
  4. Matsubara, H. Stabilisation of weathered limestone surfaces using microbially enhanced calcium carbonate deposition. Eng. Geol. 2021, 284, 106044. [Google Scholar] [CrossRef]
  5. Zeng, H.; Yin, L.Y.; Tang, C.S.; Zhu, C.; Cheng, Q.; Li, H.; Lv, C.; Shi, B. Tensile behavior of bio-cemented, fiber-reinforced calcareous sand from coastal zone. Eng. Geol. 2021, 294, 106390. [Google Scholar] [CrossRef]
  6. Liu, B.; Xie, Y.H.; Tang, C.S.; Pan, X.H.; Jiang, N.J.; Singh, D.N.; Cheng, Y.J.; Shi, B. Bio-mediated method for improving surface erosion resistance of clayey soils. Eng. Geol. 2021, 19, 106295. [Google Scholar] [CrossRef]
  7. Hamdan, N.M. Applications of Enzyme Induced Carbonate Precipitation (EICP) for Soil Improvement. Ph.D. Thesis, Arizona State University, Tempe, AZ, USA, 2015. [Google Scholar]
  8. Dilrukshi, R.A.N.; Nakashima, K.; Kawasaki, S. Soil improvement using plant-derived urease-induced calcium carbonate precipitation. Soils Found. 2018, 58, 894–910. [Google Scholar] [CrossRef]
  9. Kavazanjian, E.; Hamdan, N. Enzyme induced carbonate precipitation (EICP) columns for ground improvement. In Proceedings of the IFCEE 2015, San Antonio, TX, USA, 17 March 2015. [Google Scholar] [CrossRef]
  10. Almajed, A.; Lateef, M.A.; Moghal, A.A.B.; Lemboye, K. State-of-the-art review of the applicability and challenges of microbial-induced calcite precipitation (MICP) and enzyme-induced calcite precipitation (EICP) techniques for geotechnical and geoenvironmental applications. Crystals 2021, 11, 370. [Google Scholar] [CrossRef]
  11. Shu, S.; Chen, H.; Meng, H. Modelling microbially induced carbonate precipitation (MICP) in microfluidic porous chips. Geofluids 2022, 2022, 3616473. [Google Scholar] [CrossRef]
  12. Liu, J.; Chen, Z.H.; Kanungo, D.P.; Song, Z.Z.; Bai, Y.X.; Wang, Y.; Li, D.; Qian, W. Topsoil reinforcement of sandy slope for preventing erosion using water-based polyurethane soil stabilizer. Eng. Geol. 2019, 252, 125–135. [Google Scholar] [CrossRef]
  13. Cheng, Y.; Tang, C.; Pan, X.; Liu, B.; Xie, Y.; Cheng, Q.; Shi, B. Application of microbial induced carbonate precipitation for loess surface erosion control. Eng. Geol. 2021, 294, 106387. [Google Scholar] [CrossRef]
  14. Hamdan, N.M.; Kavazanjian, E. Enzyme-induced carbonate mineral precipitation for fugitive dust control. Géotechnique 2016, 66, 546–555. [Google Scholar] [CrossRef]
  15. Woolley, M.A.; Van Paassen, L.; Kavazanjian, E. Impact on surface hydraulic conductivity of EICP treatment for fugitive dust mitigation. In Proceedings of the Geo-Congress 2020, Minneapolis, MN, USA, 25–28 February 2020. [Google Scholar] [CrossRef]
  16. Almajed, A.; Tirkolaei, H.K.; Kavazanjian, E. Baseline investigation on enzyme-induced calcium carbonate precipitation. J. Geotech. Geoenviron. Eng. 2018, 144, 04018081. [Google Scholar] [CrossRef]
  17. Gao, Y.; He, J.; Tang, X.; Chu, J. Calcium carbonate precipitation catalyzed by soybean urease as an improvement method for fine-grained soil. Soils Found. 2019, 59, 1631–1637. [Google Scholar] [CrossRef]
  18. Ahenkorah, I.; Rahman, M.M.; Karim, M.R.; Beecham, S. Enzyme induced calcium carbonate precipitation and its engineering application: A systematic review and meta-analysis. Constr. Build. Mater. 2021, 308, 125000. [Google Scholar] [CrossRef]
  19. Lee, S.; Kim, J. An experimental study on enzymatic-induced carbonate precipitation using yellow soybeans for soil stabilization. KSCE J. Civ. Eng. 2020, 24, 2026–2037. [Google Scholar] [CrossRef]
  20. Gao, Y.; Meng, H.; He, J.; Qi, Y.; Hang, L. Field trial on use of soybean crude extract for carbonate precipitation and wind-induced erosion control of sandy soil. J. Cent. South Univ. 2020, 27, 3320–3333. [Google Scholar] [CrossRef]
  21. Miao, L.; Wu, L.; Sun, X. Enzyme-catalysed mineralisation experiment study to solidify desert sands. Sci. Rep. 2020, 10, 10611. [Google Scholar] [CrossRef]
  22. Dilrukshi, R.A.N.; Kawasaki, S. Effective use of plant-derived urease in the field of geoenvironmental/ geotechnical engineering. J. Civ. Environ. Eng. 2016, 6, 1000207. [Google Scholar] [CrossRef]
  23. Tirkolaei, H.K.; Javadi, N.; Krishnan, V.; Hamdan, N.; Kavazanjian, E. Crude urease extract for biocementation. J. Mater. Civ. Eng. 2020, 32, 04020374. [Google Scholar] [CrossRef]
  24. Arakawa, T.; Timasheff, S.N. Preferential interactions of proteins with salts in concentrated solutions. Biochemistry 1982, 21, 6545–6552. [Google Scholar] [CrossRef] [PubMed]
  25. Novák, P.; Havlíek, V. Protein extraction and precipitation. In Proteomic Profiling and Analytical Chemistry, 2nd ed.; Elsevier: Amsterdam, The Netherlands, 2016; pp. 51–62. [Google Scholar] [CrossRef]
  26. Liu, L.X.; Chen, Y.B.; Gao, Y.F.; Liu, B.; Zhou, Y.D.; Li, C. Effect of urease enrichment degree of multiple sources of urease on bio-cementation efficacy via enzyme-induced carbonate precipitation. Can. Geotech. J. 2023, 60, 1923–1937. [Google Scholar] [CrossRef]
  27. Agarwal, P.; Kaur, S. Effect of bio-enzyme stabilization on unconfined compressive strength of expansive soil. Int. J. Res. Eng. Technol. 2014, 3, 30–33. [Google Scholar] [CrossRef]
  28. Becker, A.; Vrettos, C. Study on erosion stability enhancement of sands using enzymes. Environ. Geotech. 2015, 2, 301–308. [Google Scholar] [CrossRef]
  29. Shafii, I.; Shidlovskaya, A.; Briaud, J.-L. Investigation into the effect of enzymes on the erodibility of a low-plasticity silt and a silty sand by EFA testing. J. Geotech. Geoenviron. Eng. 2019, 145, 04019001. [Google Scholar] [CrossRef]
  30. He, J.; Chu, J.; Gao, Y.; Liu, H. Research advances and challenges in biogeotechnologies. Geotech. Res. 2019, 6, 144–155. [Google Scholar] [CrossRef]
  31. Wu, C.Z.; Chu, J.; Wu, S.F.; Hong, Y. 3D characterization of microbially induced carbonate precipitation in rock fracture and the resulted permeability reduction. Eng. Geol. 2019, 249, 23–30. [Google Scholar] [CrossRef]
  32. Song, C.P.; Elsworth, D.; Jia, Y.Z.; Lin, J.Z. Permeable rock matrix sealed with microbially-induced calcium carbonate precipitation: Evolutions of mechanical behaviors and associated microstructure. Eng. Geol. 2022, 304, 106697. [Google Scholar] [CrossRef]
  33. Liu, Y.; Gao, Y.; He, J.; Zhou, Y.; Geng, W. An experimental investigation of wind erosion resistance of desert sand cemented by soybean-urease induced carbonate precipitation. Geoderma 2023, 429, 116231. [Google Scholar] [CrossRef]
  34. Martinez, B.C.; DeJong, J.T.; Ginn, T.R.; Montoya, B.M.; Barkouki, T.H.; Hunt, C.; Tanyu, B.; Major, D. Experimental optimization of microbial-induced carbonate precipitation for soil improvement. J. Geotech. Geoenviron. Eng. 2013, 139, 587–598. [Google Scholar] [CrossRef]
  35. Cheng, L.; Cord-Ruwisch, R. Upscaling effects of soil improvement by microbially induced calcite precipitation by surface percolation. Geomicrobiol. J. 2014, 31, 396–406. [Google Scholar] [CrossRef]
  36. Cheng, L.; Shahin, M.A.; Chu, J. Soil bio-cementation using a new one-phase low-pH injection method. Acta Geotech. 2019, 14, 615–626. [Google Scholar] [CrossRef]
  37. Whiffin, V.S.; Van Paassen, L.A.; Harkes, M.P. Microbial carbonate precipitation as a soil improvement technique. Geomicrobiol. J. 2007, 24, 417–423. [Google Scholar] [CrossRef]
  38. Chu, J.; Ivanov, V.; Stabnikov, V.; Li, B. Microbial method for construction of an aquaculture pond in sand. Géotechnique 2013, 63, 871–875. [Google Scholar] [CrossRef]
  39. Shu, S.; Yan, B.; Ge, B.; Li, S.; Meng, H. Factors affecting soybean crude urease extraction and biocementation via enzyme-induced carbonate precipitation (EICP) for soil improvement. Energies 2022, 15, 5566. [Google Scholar] [CrossRef]
  40. Fu, K.; Zhang, P.; Fu, D. Experiment and model for the viscosity of carbonated 3-(dimethylamino) propan-1-ol and 2-(ethylamino) ethanol blended aqueous solutions. J. Chem. Thermodyn. 2019, 134, 61–68. [Google Scholar] [CrossRef]
  41. Bian, Y.; Chen, Y.; Zhan, L.; Ke, H.; Gao, Y.; Wang, Q.; Qi, G. An enzyme-induced carbonate precipitation method for Zn2+, Ni2+, and Cr (VI) remediation: An experimental and simulation study. Appl. Sci. 2024, 14, 6559. [Google Scholar] [CrossRef]
  42. Gao, Y.; Hua, C.; Ke, T. Field test on soybean-urease induced calcite precipitation (SICP) for desert sand stabilization against the wind-induced erosion. Sustainability 2022, 14, 15474. [Google Scholar] [CrossRef]
  43. ASTM. Standard Particle for Classification of Soils for Engineering Purposes (Unified Soil Classification System); ASTM International: West Conshohocken, PA, USA, 2018. [Google Scholar]
  44. ISO 6058; Water Quality: Determination of Calcium Content: EDTA Titrimetric Method. ISO: Geneva, Switzerland, 1984.
  45. Fattahi, S.M.; Soroush, A.; Huang, N. Biocementation control of sand against wind erosion. J. Geotech. Geoenviron. Eng. 2020, 146, 04020045. [Google Scholar] [CrossRef]
  46. Miao, L.; Wu, L.; Sun, X.; Li, X.; Zhang, J. Method for solidifying desert sands with enzyme-catalysed mineralization. Land Degrad. Dev. 2019, 31, 1317–1324. [Google Scholar] [CrossRef]
  47. Song, J.Y.; Sim, Y.; Jang, J.; Hong, W.T.; Yun, T.S. Near-surface soil stabilization by enzyme-induced carbonate precipitation for fugitive dust suppression. Acta Geotech. 2020, 15, 1967–1980. [Google Scholar] [CrossRef]
  48. Almajed, A.; Lemboye, K.; Arab, M.G.; Alnuaim, A. Mitigating wind erosion of sand using biopolymer-assisted EICP technique. Soils Found. 2020, 60, 356–371. [Google Scholar] [CrossRef]
  49. Bagnold, R.A. The Physics of Blown Sand and Desert Dunes; Methuen: London, UK, 1941. [Google Scholar]
  50. Yan, Y.; Wang, X.; Guo, Z.; Chen, J.; Xin, X.; Xu, D.; Yan, R.; Chen, B.; Xu, L. Influence of wind erosion on dry aggregate size distribution and nutrients in three steppe soils in northern China. Catena 2018, 170, 159–168. [Google Scholar] [CrossRef]
  51. Shahabinejad, N.; Mahmoodabadi, M.; Jalalian, A.; Chavoshi, E. In situ field measurement of wind erosion and threshold velocity in relation to soil properties in arid and semiarid environments. Environ. Earth Sci. 2019, 78, 501. [Google Scholar] [CrossRef]
  52. Navarro, A.F.; Cegarra, J.; Roig, A.; Garcia, D. Relationships between organic matter and carbon contents of organic wastes. Bioresour. Technol. 1993, 44, 203–207. [Google Scholar] [CrossRef]
  53. Cihacek, L.J.; Jacobson, K.A. Effects of soil sample grinding intensity on carbon determination by high-temperature combustion. Commun. Soil Sci. Plant Anal. 2007, 38, 1733–1739. [Google Scholar] [CrossRef]
  54. Wen, K.; Li, Y.; Amini, F.; Li, L. Impact of bacteria and urease concentration on precipitation kinetics and crystal morphology of calcium carbonate. Acta Geotech. 2019, 15, 17–27. [Google Scholar] [CrossRef]
  55. Cui, M.J.; Lai, H.J.; Wu, S.F.; Chu, J. Comparison of soil improvement methods using crude soybean enzyme, bacterial enzyme or bacteria-induced carbonate precipitation. Géotechnique 2022, 74, 18–26. [Google Scholar] [CrossRef]
  56. Orme, C.; Noy, A.; Wierzbicki, A.; Mcbride, M. Formation of chiral morphologies through selective binding of amino acids to calcite surface steps. Nature 2001, 411, 775–779. [Google Scholar] [CrossRef]
  57. Picker, A.; Kellermeier, M.; Seto, J.; Gebauer, D.; Cölfen, H. The multiple effects of amino acids on the early stages of calcium carbonate crystallization. Z. Krist.—Cryst. Mater. 2012, 227, 744–757. [Google Scholar] [CrossRef]
  58. Montanari, G.; Lakshtanov, L.Z.; Tobler, D.J.; Dideriksen, K.; Dalby, K.N.; Bovet, N.; Stipp, S.L.S. Effect of aspartic acid and glycine on calcite growth. Cryst. Growth Des. 2016, 16, 4813–4821. [Google Scholar] [CrossRef]
  59. Borman, A.H.; De Jong, E.; Huizinga, M.; Kok, D.J.; Westbroek, P.; Bosch, L. The role in CaCO3 crystallization of an acid Ca2+-binding polysaccharide associated with coccoliths of Emiliania huxleyi. Eur. J. Biochem. 1982, 129, 179–183. [Google Scholar] [CrossRef] [PubMed]
  60. Henriksen, K.; Stipp, S.L.S.; Young, J.R.; Marsh, M.E. Biological control on calcite crystallization: AFM investigation of coccolith polysaccharide function. Am. Mineral. 2004, 89, 1709–1716. [Google Scholar] [CrossRef]
  61. Treccani, L.; Mann, K.; Heinemann, F.; Fritz, M. Perlwapin, an abalone nacre protein with three four-disulfide core (whey acidic protein) domains, inhibits the growth of calcium carbonate crystals. Biophys. J. 2006, 91, 2601–2608. [Google Scholar] [CrossRef]
  62. Nielsen, J.W.; Sand, K.K.; Pedersen, C.S.; Lakshtanov, L.Z.; Winther, J.R.; Willemoës, M.; Stipp, S.L.S. Polysaccharide effects on calcite growth: The influence of composition and branching. Cryst. Growth Des. 2012, 12, 4906–4910. [Google Scholar] [CrossRef]
Figure 1. Schematic presentation of the wind-blown sand erosion equipment used by Liu et al. [33].
Sustainability 17 02968 g001
Figure 2. The masses of precipitates produced during the reaction.
Sustainability 17 02968 g002
Figure 3. Organic matter distribution along the depth of each treated specimen: (a) without urea; (b) with urea.
Sustainability 17 02968 g003
Figure 4. CaCO3 precipitation distribution along the depth of specimens.
Sustainability 17 02968 g004
Figure 5. Photos of the treated sand specimens: (a) PU-1; (b) PU-2; (c) PU-3; (d) SU-1; (e) SU-2; (f) SU-3.
Sustainability 17 02968 g005
Figure 6. X-ray diffraction (XRD) analysis of untreated sand, SU-3, and PU-3.
Sustainability 17 02968 g006
Figure 7. SEM images of EICP-treated specimens: (a) PU-1; (b) PU-2; (c) PU-3; (d) SU-1; (e) SU-2; (f) SU-3.
Sustainability 17 02968 g007
Figure 8. Soil mass loss of the treated specimens at 10 m·s−1 wind velocity: (a) without urea; (b) with urea.
Sustainability 17 02968 g008
Table 1. Concentrations of amino acids, protein, and soluble polysaccharides in crude soybean urease and pure urease solution.
TypeCrude Soybean Urease
(g·L−1)
Pure Urease
(g·L−1)
Amino acidGlu2.232<DL 1
Asp1.300<DL
Arg0.760<DL
Leu0.760<DL
Lys0.698<DL
Pro0.590<DL
Ser0.575<DL
Phe0.537<DL
Ile0.421<DL
Gly0.414<DL
Ala0.414<DL
Val0.414<DL
Thr0.399<DL
Tyr0.391<DL
His0.276<DL
Met<DL<DL
Protein9.7953.432
Soluble polysaccharide<DL<DL
1 “DL” means the detectable limit.
Table 2. Basic properties of desert sand.
PropertyValue
Grain size distribution (%)
0.4–0.25 mm1.18
0.25–0.2 mm8.82
0.2–0.15 mm55.67
0.15–0.1 mm30.59
0.1–0.05 mm3.74
Bulk density (g·cm−3)1.51
Specific Gravity, Gs2.66
Uniformity coefficient, Cu1.73
Coefficient of curvature, Cc1.04
Maximum void ratio, emax0.847
Minimum void ratio, emin0.546
Table 3. Test program.
SetsTest IDUrease TypeCementation SolutionTreatment Cycle
Tube testsSUSoybean urease0.2 mol·L−1 CaCl2-CO(NH2)21
PUPure urease0.2 mol·L−1 CaCl2-CO(NH2)21
Wind erosion testsSU-S1Soybean urease0.2 mol·L−1 CaCl21
PU-S1Pure urease0.2 mol·L−1 CaCl21
SU-S2Soybean urease0.2 mol·L−1 CaCl22
PU-S2Pure urease0.2 mol·L−1 CaCl22
SU-S3Soybean urease0.2 mol·L−1 CaCl23
PU-S3Pure urease0.2 mol·L−1 CaCl23
SU-1Soybean urease0.2 mol·L−1 CaCl2-CO(NH2)21
PU-1Pure urease0.2 mol·L−1 CaCl2-CO(NH2)21
SU-2Soybean urease0.2 mol·L−1 CaCl2-CO(NH2)22
PU-2Pure urease0.2 mol·L−1 CaCl2-CO(NH2)22
SU-3Soybean urease0.2 mol·L−1 CaCl2-CO(NH2)23
PU-3Pure urease0.2 mol·L−1 CaCl2-CO(NH2)23
Disclaimer/Publisher’s Note: The statements, opinions and data contained in all publications are solely those of the individual author(s) and contributor(s) and not of MDPI and/or the editor(s). MDPI and/or the editor(s) disclaim responsibility for any injury to people or property resulting from any ideas, methods, instructions or products referred to in the content.

