Abstract
The agricultural sector is the largest source for air pollutants of ammonia (NH3) and greenhouse gases (GHGs) of nitrous oxide (N2O) and methane (CH4). Establishing a unified and homologous emission inventory of air pollutants and GHGs is essential for synergistic abatement pathway studies of air pollution and climate change. However, current agriculture emission inventories of air pollutants and GHGs are unclear due to the separated source classification and inconsistent calculating methodologies. This study adopted a synergistic approach to develop a unified emission inventory for NH3, N2O, and CH4 from the agricultural sector in China for 2021, based on crop and livestock types as the activity level data, and considered regional-specific species in emission factors. The results showed that China’s agricultural emissions in 2021 amounted to 7566.17 Gg of NH3, 486.14 Gg of N2O, and 14,979.71 Gg of CH4. Rice, cattle, and pigs were the primary contributors of NH3, N2O, and CH4. Hotspots of NH3 and N2O emissions were concentrated in the North China Plain and Sichuan Basin, whereas CH4 emissions were predominantly located in southern China. This study provides a crop- and livestock-specific data foundation for making region-specific and priority-based integrated strategies to improve air quality, mitigate climate change, and promote sustainable agricultural development in China.
1. Introduction
Facing the dual environmental challenges of climate change and air pollution [1,2], the Chinese Government has committed to reach a carbon emission peak before 2030 and achieve carbon neutrality before 2060 [3,4]. In the past years, a series of policies have been implemented, including the Air Pollution Control and Prevention Action Plan (APPA) and Blue-Sky Defense War, resulting in a substantial reduction in emissions of primary pollutants and fine particulate matter (PM2.5) pollution [5,6]. However, the synergetic abatement paths face bottlenecks in terms of carbon neutrality and air quality compliance. In 2022, the annual average concentration of PM2.5 in China was 29 µg/m3, which is considerably higher than the target of 5 µg/m3 set by the World Health Organization (WHO) [7]. For greenhouse gas (GHG) abatement, most decarbonization strategies focus on industrial and transportation sectors [8,9], which together account for most CO2 and pollutant emissions, while relatively less emphasis has been placed on addressing non-CO2 GHG emissions. To resolve this bottleneck, a deeper understanding of the characteristics of air pollutant and GHG emissions in other key sectors is required.
Sustainable agricultural production is a crucial pillar of China’s economy, playing a fundamental role in ensuring food security, supporting rural livelihoods, and maintaining social stability [10,11]. At the same time, the agricultural sector is the largest source of emissions of air pollution of ammonia (NH3) [12], and about 85% of total NH3 emissions came from livestock farming and crops of synthetic nitrogen fertilizers in China [13,14,15]. As the precursors to the formation of secondary inorganic aerosols (SIA) and PM2.5, the contribution of agriculture-related NH3 emissions to SIA and PM2.5 are 29% and 16%, respectively [16]. Moreover, agricultural activities significantly contribute to global warming through the emission of greenhouse gases (GHGs) methane (CH4) and nitrous oxide (N2O) [17], producing approximately 60% of CH4 [18,19,20] and 40% of N2O emissions in China [21,22,23]. Therefore, the agricultural sector is a crucial one with significant potential in the integrated mitigation of both air pollutants and GHGs.
Developing a unified and homologous air pollutant and GHGs emission inventories is the foundation for identifying key emission sources and making realistic policy-relevant synergetic abatement strategies [5,24,25]. In previous research, GHG or NH3 emissions have usually been quantified separately, with a focus on a specific gas and/or emission source. For instance, the estimates of agricultural NH3 emissions in China range from 8.0–10.36 Tg [15,26,27]. Similarly, agricultural N2O emissions in China range from 0.57–2.08 Tg [22,28,29]. CH4 emissions from livestock enteric fermentation (LEF) and manure management were estimated to be between 9.44 and 15.01 Tg, while those from rice cultivation ranged from 5.61–14.16 Tg [20,30,31]. These inventories have provided a comprehensive assessment of agricultural emissions at the national scale. However, there are still significant variations in emissions across provinces and regions due to differences in economic development levels and agricultural production structures. Existing research on agricultural emission sources has primarily concentrated on major economic zones such as the Yangtze River Delta (YRD) [32], Pearl River Delta (PRD) [33], and Henan province [34]. Consequently, the spatial heterogeneity of agricultural emissions at the regional and provincial level remains insufficiently understood.
Meanwhile, only a few global or Asian inventories, such as Emissions Database for Global Atmospheric Research (EDGAR v8.0) [35], Greenhouse Gas and Air Pollution Interactions and Synergies (GAINS-China) [36], and the Regional Emission Inventory in Asia (REAS v1.1) [37], have turned out to be a homologous one of both air pollutants and GHGs. Due to inconsistencies in the classification of emission sources, substantial gaps and uncertainties have emerged across those inventories. Specifically, NH3 emissions from animal manure are typically classified under manure management, whereas N2O emissions from manure application are categorized under fertilizer-related emissions. This inconsistency complicates inter-inventory contrast and mitigation policy alignment. Furthermore, in these inventories, European or globally unified emission factors (EFs) were applied, which might not accurately reflect region-specific agricultural practices and species variations across different provinces of China. In particular, cropland soil N2O and NH3 emissions are typically estimated based on nitrogen fertilizer consumption as activity data [14]. However, neglecting the changes in fertilizer application across crop species, such as the transition from ammonium bicarbonate (ABC) to urea and compound fertilizers in China, leads to overestimation of agricultural emissions [38]. To date, not a single coupled inventory involving crop- and livestock-specific emissions have been reported. This gap hinders the quantification of sector-specific contributions and the formulation of precise and synergetic mitigation strategies.
The objectives of this inventory are to (1) develop a unified emission inventory for NH3, N2O, and CH4 in China’s agricultural sector for 2021; (2) analyze the source contribution characteristics of these emissions; (3) elucidate the spatial distribution of NH3, N2O, and CH4 within Chinese agriculture; and (4) identify crop- and livestock-specific and regional discrepancies in agricultural emissions. This study provides a homologous crop- and livestock-specific dataset on agricultural sector emissions to support the formulation of precise mitigation strategies for improving air quality, mitigating climate change, and promoting ecological sustainability.
2. Methodology and Data
2.1. Study Domain and Source Categorization
2.1.1. Study Domain
This study encompassed 31 provinces, municipalities, and autonomous regions in mainland China; Taiwan, Hong Kong, and Macao were excluded due to data limitations. To identify the discrepancies in NH3, N2O, and CH4 emissions in different agricultural regions across China, we classified the study area into six regions based on the distribution of agricultural product systems and codes for the administrative divisions of the Peoples Republic of China [39]. As shown in Figure 1, the agricultural regions in China are divided into six parts: Northeast China (NEC: Liaoning, Jilin, and Heilongjiang), North China (NC: Beijing, Tianjin, Shanxi, Hebei, and Inner Mongolia), East China (EC: Shanghai, Jiangsu, Zhejiang, Anhui, Fujian, Jiangxi, and Shandong), South Central China (SCC: Henan, Hubei, Hunan, Guangdong, Guangxi, and Hainan), Southwest China (SWC: Chongqing, Sichuan, Guizhou, Yunnan, and Tibet), and Northwest China (NWC: Shaanxi, Gansu, Qinghai, Ningxia, and Xinjiang). The base year for the emission inventory was 2021.
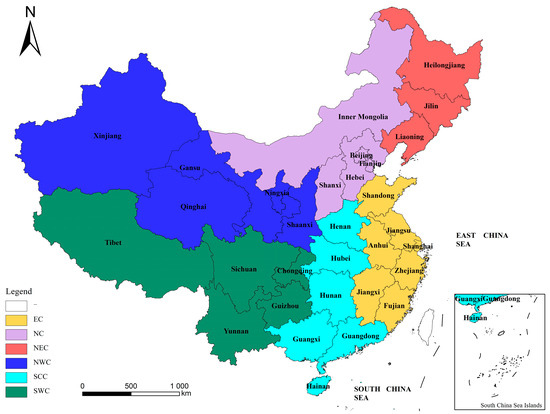
Figure 1.
Map showing the study domain and provincial-level regionalization.
2.1.2. Sources Categorization
Based on existing regulations and guidelines for atmospheric NH3 [40] and GHGs [41] emission inventory in China, we developed a unified classification system for the major emission sources of NH3, CH4, and N2O in the agricultural sector. This classification was comprised of three hierarchical levels of emission sources. The first level encompassed five main categories: livestock manure management (LMM), cropland fertilizers (CF), LEF, paddy cultivation (PC), and aquaculture (Aq). The second levels divided these categories into sectors according to livestock, poultry, or crop species, and third levels further divided breeding method (intensive or free-range) and fertilizer type (urea, ABC and NPK). The official statistical data provide a relatively complete data set for livestock headcounts, crop sown area and the amount of fertilizer application based on available the statistical yearbook, Supplementary Material Texts S1 and S3. A detailed classification of the emission sources is provided in Table 1.

Table 1.
Source categorization for agricultural NH3, CH4, and N2O emission inventories in China.
2.2. Calculation of NH3, N2O and CH4 Emissions
We used a bottom-up approach to aggregate the 2021 annual emissions of China’s agricultural sector by accounting for the emissions from each sub-source; the emissions from each sub-source were calculated as follows:
where is the 2021-based annual emissions of the total agriculture emissions (tons/year); ELEF,i,j,k,l, ELMM,i,j,k,l, ECF,i,j,k,l, EPC,i,j,k,l, and EAq,i,j,k,l represent the NH3, CH4, and N2O emissions from LEF, LMM, CF, PC and Aq (tons/year), respectively; i represents emission gas species (NH3, CH4 and N2O); j represents the provinces, including the land area of 31 provinces in mainland China (excluding Hong Kong, Macao, and Taiwan); k represents the second-level source type; and l represents the third-level source type. The specific activity data compilation approach and emission factor determination methods are described by category in detail in the following chapters.
2.2.1. Livestock Enteric Fermentation
Livestock enteric fermentation emits only CH4, which is calculated as follows [41]:
where (tons/year) denotes the emissions from LEF; i represents CH4; PLj,k,l (head) denotes the livestock population in j province, k source of livestock, and l type of breeding method. The breeding methods included intensive and free range. According to the collected intensive breeding rates from reports and references, using linear regression to fit and forecast rates, the intensive farming rates in 2021 were 71.91% for broilers and laying hens, 68.65% for cows, 40.33% for beef cattle, 53% for pigs, and 38.4% for sheep. Farming methods in the other categories were all considered free range in this study. The details of PLj,k are provided in Supplementary Material Text S1. EFLEF,i,k,l (kg/head) represents the emission factors (EFs) for CH4 from the k-th livestock sub-source and l-th type of breeding method. Owing to the relatively minor impact of regional variations, the EFs were not disaggregated by province. The CH4 EFs for enteric fermentation across different livestock categories, based on feeding practices, were sourced from provincial guidelines and are described in detail in Supplementary Tables S1 and S2.
2.2.2. Livestock Manure Management
Livestock manure management emits NH3, N2O, and CH4 simultaneously. NH3 emissions were calculated as follows:
where denotes the NH3 emissions from LMM, i represents NH3, PLj,k,l (head) represents the population of livestock for j province and k source of livestock, and l type of breeding method. EFi,j,k,l,m is the emission factors for i gas, k sub-source of livestock, l type of breeding method (kg/head), and t temperature. For the LMM EFs of NH3, according to the relevant data provided by the technical guidelines for the preparation of the atmospheric ammonia source emission inventory (Trial) [40], we obtained pixel-level monthly EFs of manure management using monthly temperature data. Details of the methods and parameters are presented in Supplementary Material Text S1, Tables S1 and S3.
The LMM emissions of N2O and CH4 were calculated as follows:
where is the emissions from LMM, i represents CH4 or N2O; PLj,k,l (head) represents the population of livestock for j province and k source of livestock, and l type of breeding method. EFi,j,k,l is the emission factors for i gas, j province, k source of livestock, and l type of breeding method (kg/head). The EFs of CH4 and N2O were obtained by referring to the guidelines for the Emission Inventory of Greenhouse Gases in China [41]. A detailed description of the EFs of CH4 and N2O from LMM is presented in Supplementary Tables S4 and S5, respectively.
2.2.3. Cropland Fertilizer
Cropland fertilizer emissions primarily from the use of synthetic fertilizers. These emissions are nitrogen-rich pollutants, namely NH3 and N2O. These emissions were quantified using the methods described by Misselbrook et al. [48] and Yue et al. [49]. The formula used for this quantification is as follows:
where ECF,i denotes the emissions from the CF sub-sector (tons/year), i represents NH3 and N2O; Cj,k (ha−1) denotes the cultivation area within province j for crop type k; ARSNFjk (kg /ha−1) represents the application rate of synthetic fertilizer for crop type k and fertilizer type l (data from “National Cost and Profit of Agri-product Materials Compilation, 2022” [45], and Supplementary Material Tables S6 and S7); (kg/ha−1) represents the emission factors corresponding to gas type i, crop type k, and fertilizer type l. The emission factors of N2O were obtained from field measurements and localized experiments ([49]; Supplementary Table S8). The NH3 emission factors for CF were modified by functions associated with other variables (e.g., soil pH and land use) to obtain EFs, which were calculated using the following equation from Misselbrook et al. [48]:
where (%) denotes the NH3 emission factors from CF; EFmax is the maximum potential emission for each fertilizer type. RFsoilpH, RFlanduse, RFrate, RFrainfall, and RFtemperature are modified parameters of soil pH, land use, application rate, rainfall, and temperature, respectively. Details of the methods and parameters are presented in Supplementary Material Texts S3 and S4, Tables S6, S7, and S9.
2.2.4. Paddy Cultivation
Paddy cultivation (excluding fertilization) exclusively gives rise to CH4 emissions. CH4 emissions were calculated based on the guidelines for the emission inventory of GHGs in China [41] in the following formula:
where EPC,i is total CH4 emissions from PC (tons/year), Cj,k (ha−1) denotes the rice cultivation areas within province j for rice type k, and denotes the CH4 emission factors corresponding to province j and paddy type k (kg/ha−1) (Supplementary Tables S6 and S10).
2.2.5. Aquaculture
Aquaculture leads to both N2O and CH4 emissions, which within this sub-sector were quantified in the method described by Xu [50]. The formula is as follows:
where is N2O or CH4 emissions for Aq (tons/year), is the Aq area to province j and aquaculture type k (ha−1), and is the N2O or CH4 emission factor for Aq type k (mg/ha−1/h) (Supplementary Tables S11 and S12).
2.3. Spatial Allocation
Agricultural emissions spatial allocation of NH3, N2O, and CH4 were mapped to 3 km × 3 km grid cells by means of the Geographic Information System (ArcGIS; version 10.2). The formula is as follows:
where represents the gas emissions in area c of grid g; g represents the ID of each grid, automatically generated by ArcGIS when the grid was created; c represents different provinces in China; and L represents latitude and longitude.
Based on source characteristics, different emission sources were allocated using various spatial proxies. The detailed spatial proxies used for ARS emissions allocation are presented in Table 1. In summary, data from rural residential areas were used to spatially allocate emissions from LEF and LMM. Since CF includes both upland and paddy areas, emissions from this source were apportioned based on changes in Land-Use and Land-Cover (LUCC) data for arable lands, covering both upland and paddy areas within the study domain. CH4 emissions from PC were allocated to paddy areas identified in LUCC data. Emissions from Aq, being relatively small, were allocated to LUCC-identified water bodies, such as rivers, lakes, and ponds. After completing the spatial allocation, aggregation was conducted to sum all emissions. Our previous research included detailed approaches for the spatial allocation of these emission sources [15,51,52].
2.4. Uncertainty Analysis
Uncertainty in emission inventories can be described qualitatively, semi-quantitatively, and quantitatively. In this study, a quantitative approach in the Monte Carlo Simulation with R (version 4.2.3) was applied to evaluate the uncertainty of all sources of agricultural emissions according to the method by Zheng et al. [51]. By establishing emission factor databases from the literature, the uncertainties for each source and total emissions were quantified and key sources leading to uncertainty in model outputs were identified in the sensitivity analysis approach. Detailed input parameters are provided in Supplementary Table S13.
3. Results and Discussion
3.1. Emission Inventory and Uncertainty
The unified emission inventory of air pollutants (NH3) and GHGs (N2O and CH4) from China’s agricultural sector in 2021 is presented in Table 2 and Figure 2. The total emissions of NH3, N2O, and CH4 were estimated to be 7556.85 Gg (−52–71%), 485.32 Gg (−63–120%), and 14,979.71 Gg (−44–56%), respectively.
Table 2.
Agricultural emission inventory of NH3, N2O, and CH4 in China for 2021 (Gg).
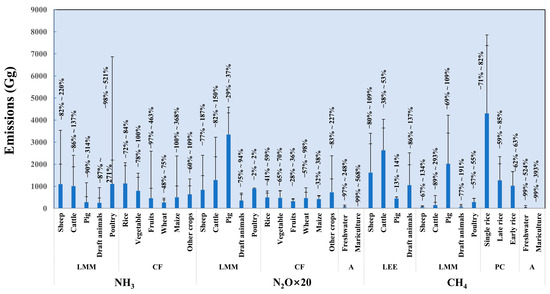
Figure 2.
Uncertainties of sector-based agricultural emissions of NH3, N2O, and CH4 in China in 2021.
Livestock manure management is the dominant source of agricultural emissions, contributing significantly to all three gases (3758.48 Gg for NH3, 336.83 Gg for N2O, and 2576.16 Gg for CH4). Cropland Fertilizer is the primary contributor to NH3 emissions, contributing 3798.37 Gg. Paddy Cultivation is the main source of CH4 emissions, contributing 6607.65 Gg. The rapid development of China’s agricultural economy, combined with its large population, has significantly increased the demand for agricultural production, consequently leading to higher agriculture-related emissions [10,53]. Sector-based emission uncertainties and comparisons with previous studies are discussed in the following sections.
Figure 2 illustrates the uncertainty ranges for different agricultural emission sources of NH3, N2O, and CH4. Overall, the NH3 and N2O emissions exhibited higher uncertainties compared to CH4. The largest source of uncertainty was LMM, with total uncertainties of −71–113% for NH3, −81–212% for N2O, and –64–96% for CH4 (95% confidence). Poultry NH3 (−98–520%), cattle CH4 (–89–293%), and sheep N2O (–77–187%) emissions exhibited the greatest uncertainty, driven by substantial variations in emission factors in breeding periods and livestock management practices of regional differences. For CF, the uncertainties were lower, at −56–79% for NH3 and −44–67% for N2O. Among crops, fruit trees (−97–463%) and maize (−100–368%) showed higher NH3 uncertainty than wheat (–48–75%) and rice (−72–84%), which were influenced by factors such as fertilizer type, soil properties, weather, and application methods. The uncertainties in CH4 emissions from LEF were influenced by the species of livestock: sheep (−80–109%), pigs (−13–14%), cattle (–38–53%), and draft animals (86–137%). CH4 emissions from PC exhibited lower uncertainties (–43–56%), with single rice, late rice, and early rice showing values of −71–82%, −59–85%, and 62–63%, respectively. Aquaculture emissions in both freshwater and mariculture showed high uncertainties for CH4 (−99–536%) and N2O (−96–568%) due to significant regional variations and limited data availability; thus, further investigation is required.
3.2. Comparison with Other Emission Inventories
We preliminarily compared China’s agricultural NH3, N2O, and CH4 emissions with those reported by the Emissions Database for Global Atmospheric Research (EDGARv8.0), Greenhouse Gas and Air Pollution Interactions and Synergies (GAINS-China), Regional Emission Inventory in Asia (REAS v2.1), and other studies (Table 3). Notably, the comprehensive agricultural emission inventories for NH3, N2O, and CH4 in China are available only from EDGAR [35], GAINS-China [36], REAS [37], and our study. There were significant variations in the emission estimation for NH3, N2O, and CH4 among the EDGAR, GAINS-China, REAS, and other databases. Our total agricultural NH3 emission estimate for 2021 was similar to EDGAR’s estimate of 7.46 Tg. However, it was 30–40% lower than those reported by GAINS-China, REAS v2.1, and other studies, such as those by Li et al. [54], Fu et al. [55], and Zhang et al. [56]. For N2O, the total agricultural emissions was 0.49 Tg in 2021, which was consistent with those of Liang et al. [28] and Feng et al. [21], but lower than that observed by Zhou et al. [57] (1.03 Tg in 2008). The CH4 emission in 2021 (14.97 Tg) was lower than those reported by EDGARv8.0 (22.38 Tg), Huang et al. [58] (19.98 Tg), Duan et al. [18] (23.39 Tg), and Gong & Shi [59] (26.56 Tg). These discrepancies were attributed to revisions in the source categories, emission factors, and activity data for the different base years.
Table 3.
Comparison of agricultural emissions of NH3, N2O, and CH4 in China.
Source-based comparisons provide deeper insights into the causes of emission discrepancies. For livestock-related sources, including livestock manure management (LMM) and Livestock enteric fermentation (LEF), our emission estimates were 10–20% higher than those reported by REAS and EDGAR but more than 30% lower than those reported by GAINS-China and most other studies [27,54,55,56]. These discrepancies can be attributed to two primary factors. First, our methods included time-varying temperature-dependent parameters, which differ from the constant parameters used in REAS and EDGAR. Second, although REAS and EDGAR include NH3 emissions from animal manure as a subset of fertilizer emissions, our study did not follow this categorization.
For crop-related sources, including cropland fertilization (CF) and paddy cultivation (PC), our study revealed lower (10–20% NH3, 25–30% N2O, and 5–15% CH4) emission estimates compared with most other studies. These differences can be primarily attributed to three key factors: First, emission factor discrepancies are substantial, as many previous studies relied on IPCC-derived N2O emission factors or CH4 emission factors for PC based on field measurements in Europe, which differ significantly from the region-specific emission factors used in this study; Second, croplands soil N2O and NH3 emissions are estimated by using the amount of nitrogen fertilizer consumption as activity data. Without accounting for shifts in fertilizer use across crop species, where ABC has been replaced by urea and compound fertilizer, agricultural emissions in China have been overestimated. Third, in order to keep the sources consistent for both N2O and NH3 emissions in cropland, our estimates do not include the return of straw to the field and indirect N2O emissions.
3.3. Emission Contributions by Category
Figure 3 shows the contributions of various emission sources to NH3, N2O, and CH4 emissions from China’s agricultural sector in 2021. Emissions from livestock-related sources, such as LMM and LEF, are crucial, constituting 49.7, 69.4, and 55.8% of total emissions for NH3, N2O, and CH4, respectively. Within the livestock category, LEF accounted for 38.6% of CH4 emissions, and the remainder (17.2%) was attributed to LMM. There was a notable variation among different livestock types; cattle and sheep were primary contributors to NH3 (13.4% and 14.6%, respectively), N2O (13.3% and 8.7%, respectively), and CH4 (18.6% and 11.2%, respectively) emissions, with NH3 and N2O emissions predominantly controlled by LMM and CH4 emissions influenced by LEF. Pigs, owing to their high consumption of traditional Chinese diets, significantly contribute to N2O (34.5%) and CH4 (16.5%) emissions. Poultry, including geese, chickens, ducks, and rabbits, contributed 14.6% of NH3, 9.3% of N2O, and 7.5% of CH4 emissions. Meanwhile, draft animals contribute minimally, owing to high agricultural mechanization and fewer numbers of livestock in farms. The contributions of Aq to N2O and CH4 emissions were negligible at 0.5% and 0.2%, respectively.
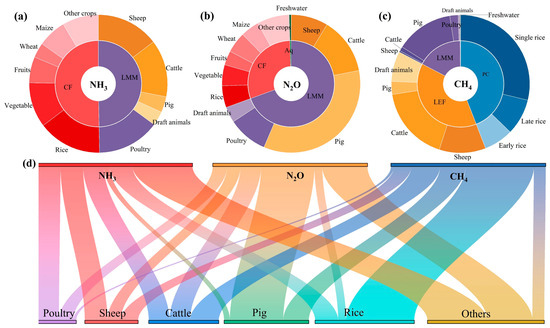
Figure 3.
Source contributions (Unit: %) to agricultural NH3, N2O, and CH4 emissions in China in 2021. (a) NH3; (b) N2O; (c) CH4; (d) NH3, N2O, and CH4 combined.
Crop-related emissions (CF and PC) accounted for 49.7, 30.1, and 44.1% of NH3, N2O, and CH4 emissions, respectively. CF is a significant source of NH3 and N2O, with rice, other crops, and vegetables emitting more gases than maize, wheat, and fruits because of their higher fertilizer requirements. Vegetables contributed 10.5% of NH3 and 4.9% of N2O emissions owing to higher temperatures and fertilization. Maize, primarily grown in northern China with higher summer temperatures, contributed 6.7% of NH3 and 4.4% of N2O. Wheat, despite its widespread cultivation, had lower emissions (3.5% NH3 and 4.8% N2O) due to cooler fertilization seasons. Other crops, including soybeans, tubers, oilseeds, cotton, tobacco, tea, and sugar, contributed a smaller proportion (8.5% NH3, 7.5% N2O) but exhibited concentrated emission patterns due to summer fertilization. Rice, a staple food in China, emitted 14.9% of NH3 and 5.1% of N2O during the fertilization process. The extensive rice cultivation in China, including single, late, and early rice, contributed 44.1% of total CH4 emissions due to the anaerobic growth conditions.
3.4. Regional Distributions and Discrepancies in Emission Sources
Figure 4 presents the NH3, N2O, and CH4 emission contributions and distributions by region (%) and province (Gg) in China for 2021. In general, the spatial distribution indicated that SCC and EC had higher emissions, reflecting significant agricultural intensity due to the extensive use of fertilizers and high-density livestock populations. SWC, NC, and NEC showed moderate emissions from agricultural activities but not at the levels observed in SCC and EC. NWC had lower agricultural emissions than the other regions, but the emissions were notable.
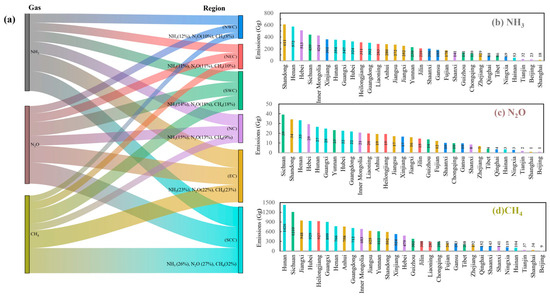
Figure 4.
Regional emission contributions (a) and provincial (b) NH3, (c) N2O, and (d) CH4 emission distribution (Gg).
In detail, the largest agricultural emissions region was from SCC, constituting 26% of NH3, 27% of N2O, and 32% of CH4 emissions. From a provincial perspective, Henan was the second-largest NH3-emitting province, at 572 Gg, and the third-largest N2O-emitting province, at 33 Gg. Additionally, it was the seventh-largest CH4-emitting province, contributing 766 Gg. EC is another pivotal region in terms of agricultural emissions, constituting 23% of NH3, 22% of N2O, and 23% of CH4 emissions. In particular, Shandong was one of the largest NH3- and N2O-emitters provinces. In 2021, NEC contributed 11%, 11%, and 10% of NH3, N2O, and CH4 emissions, respectively. Despite having similar climate features and flat terrain, Heilongjiang contributed more CH4 emissions than Liaoning and Jilin due to its larger area of PC. Conversely, NC, characterized by higher per capita grain yields, contributed 15% of NH3, 14% of N2O, and 9% of CH4 emissions. Among the different provinces, emissions were lower in Beijing and Tianjin, whereas higher emissions were observed in Hebei. SWC contributed 14%, 18%, and 18% of China’s total agricultural NH3, N2O, and CH4 emissions in 2021. Sichuan accounted for the largest share of agricultural emissions, being the second-largest source of CH4, the largest source of N2O, and the fourth-largest source of NH3 in the country. Therefore, the high emissions and driving forces in Sichuan have a significant impact on agricultural emissions in SWC. NWC exhibited the lowest emissions, accounting for 12% of NH3, 10% of N2O, and 8% of CH4. The region’s dry climate, low temperatures, and limited agricultural crop activity contribute to its lower emission levels. Xinjiang is a significant contributor to regional emissions, largely because of the prevalence of oasis and livestock farming in the province.
Designing effective regional and special priority development strategies requires a nuanced understanding of the structural characteristics of emission sources within different regions. To achieve this objective, the analysis focused on understanding the total amount of individual emissions sources and sub-sources to various gases in the six key regions (see Figure 5). Crops and livestock with the largest agricultural emissions were located in SCC and EC, which are the most dominant agricultural economic regions in China, where demand for pig and poultry products is growing alongside their rising living standard. The emission structures of the two regions were similar in that rice and vegetables were the dominant contributors to CF emission as well as poultry NH3, pig N2O, and cattle CH4 emissions, the main LMM sub-sources. Meanwhile draft animals contributed 4.92% of N2O emissions in SCC but only 0.79% in EC, and this disparity can be attributed to the higher level of agricultural mechanization in EC, where the use of draft animals has been largely replaced by agricultural machinery [42]. In SWC, LEF contributed the most of CH4 emissions, followed by PC and LMM. As far as CH4 emissions in the 6 regions of China are concerned, draft animals constituted the largest proportion in SWC. Consisting of the Sichuan Basin, the Yunnan-Guizhou Plateau, and southern part of the Qinghai-Tibet Plateau, SWC is characterized with rugged terrain that is not conducive to large-scale mechanized production. Consequently, agricultural production there predominantly relies on animal power. In NC, livestock farming in Inner Mongolia and planting in Hebei coexist, which explains the high levels of emissions caused by intense agricultural activities. In general, for NH3, N2O, and CH4, sheep were the leading contributor, followed by cattle and pigs. Furthermore, in NC, maize significantly contributed to the NH3 and N2O emissions. The NEC region mainly grows structural grain crops. Rice and maize are the most important grain crops worldwide. Compound fertilizers are applied at a high rate, with low emissions and a low agricultural multiple cropping index. Compared to other regions, NWC had lower emissions of N2O and CH4. Sheep and cattle are the main sub-sources of N2O emissions from LEF and CH4 emissions from LMM, whereas crop planting contributes only marginally to these emissions. This is attributed to the region’s unique agricultural practices, including extensive grazing and limited oasis farming, which are adapted to the arid and semi-arid conditions.
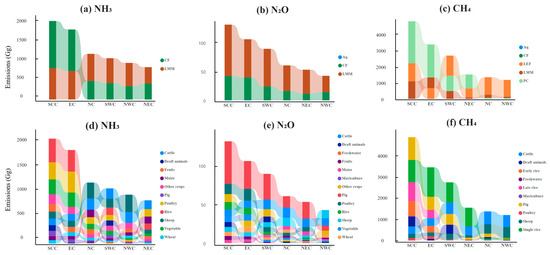
Figure 5.
Regional emissions of source categories in China’s agricultural sector for NH3, N2O, and CH4 (in Gg) emissions in 2021.
3.5. Spatial Distribution
The spatial distributions with a high resolution of 3 km × 3 km for the agricultural sector emission sources in China are shown in Figure 6a–c. Agricultural sector emissions varied significantly across China, with a strong east-west gradient. In general, high NH3, N2O, and CH4 emissions were observed in areas east of the Heihe–Tengchong line [60]. This region includes Beijing–Tianjin–Hebei region, the Yangtze River Delta, the Sichuan Basin, the Triangle of Central China, and the Pearl River Delta. High population density and intensive agricultural activities were the primary reasons for the high emissions. In contrast, the area west of the Heihe–Tengchong Line demonstrated remarkably low agricultural emissions. This region is predominantly a continental plateau and mountainous area, which leads to lower emissions because extensive utilization of agriculture is constrained. However, it is worth noting that northwest Xinjiang is generally higher than other regions, which may be linked to its distribution in oasis agricultural regions. Meanwhile, we found significant variability in the spatial distribution of NH3, N2O, and CH4 in China’s agricultural sector, owing to the contributions of various sources across distinct regions. The spatial distributions of NH3 and N2O emissions were similar, primarily distributed in the North China Plain and the Sichuan Basin. In contrast, CH4 is primarily concentrated in the southern regions. The primary factor contributing to this discrepancy was the divergence in cropping structures, with dryland-based cultivation in the northern regions and rice-based cultivation in the southern regions.
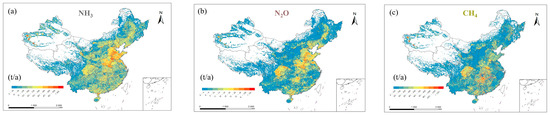
Figure 6.
Spatial distribution of agricultural emissions in China in 2021: (a) NH3, (b) N2O; (c) CH4.
4. Conclusions and Recommendations
This study is the first integrated agricultural emissions inventory framework for China developed for the base year 2021. The developed inventory couples the air pollutant of NH3, and GHGs of N2O and CH4, based on a unified crop- and livestock- specific emission source. This homologous agricultural inventory consists of three hierarchical levels classification system for emission sources, which helps identify regional and categorical discrepancies, provide air quality and climate change modeling input, and outlines precise mitigation strategies in China. In 2021, China’s agricultural emissions of NH3, N2O, and CH4 were 7566.17 Gg, 486.14 Gg, and 14,979.71 Gg, respectively. In addition, the uncertainties of NH3, N2O, and CH4 were (–52.1–71.15%), (–63.16–119.95%), and (–43.7–56.02%), respectively. Emissions from livestock-related sources is the largest primary source of emissions. Rice, vegetables, cattle, and pigs were the agricultural subsectors with the highest contribution to emissions. Furthermore, agricultural NH3 and N2O emission hotspots were mainly distributed in the North China Plain and the Sichuan Basin, whereas CH4 was distributed in the southern region. Shandong had the highest NH3 emissions, Sichuan had the highest N2O emissions, and Hunan had the highest CH4 emissions. Meanwhile, regional discrepancies were observed in the agricultural emissions from crop and livestock species across China. SCC and EC were primary contributors due to extensive fertilizer application in rice, vegetables, and other crops. SWC, NC, and NEC exhibited moderate emissions despite diverse agricultural systems. NWC had lower N2O and CH4 emissions, where sheep and cattle were the main sub-sources. Further improvements in the accuracy of NH3, N2O, and CH4 emission estimates in agriculture can be achieved by conducting regional emission factor testing for N2O and CH4 from livestock sources and collecting detailed activity data across various crops species.
Supplementary Materials
The following supporting information can be downloaded at: https://www.mdpi.com/article/10.3390/su17072966/s1, Text S1: Data collection of livestock population; Text S2: Calculation of NH3 emission factors from livestock manure management; Text S3: Data collection of cropland fertilizer application rates; Text S4: Calculation of NH3 emission factors from cropland fertilizer; Table S1: Populations of livestock; Table S2: CH4 emission factors of intensive and free-range from livestock enteric fermentation; Table S3: NH3 emission factors from livestock manure management; Table S4: N2O emission factors from livestock manure management; Table S5: CH4 emission factors from livestock manure management; Table S6: Sown area for different types of crops in 2021; Table S7: Fertilizer application rates for different types of crops in 2021; Table S8: Ratios of different application and modification variables for NH3 emission factors; Table S9: N2O emission factors from different urea, ammonium bicarbonate and NPK; Table S10: CH4 emission factors from paddy cultivation; Table S11: Aquaculture area in 2021; Table S12: CH4 and N2O emission factors from aquaculture; Table S13: Uncertainty parameters [40,48,51,61,62,63,64,65].
Author Contributions
Conceptualization, X.Z. and Q.S.; methodology, X.Z., Q.S. and J.W.; validation, X.Z. and Q.S.; formal analysis, X.Z. and Q.S.; investigation, X.Z., Z.W., H.C., S.J., L.L. and C.Z.; data curation, X.Z., J.W., Z.W., H.C., S.J., L.L. and C.Z.; writing—original draft preparation, X.Z.; writing—review and editing, X.Z., Q.S. and S.L.; visualization, X.Z. and Q.S.; supervision, Q.S.; funding acquisition, Q.S. All authors have read and agreed to the published version of the manuscript.
Funding
This research was funded by the National Natural Science Foundation of China, grant numbers 42230602, 92044302; the Guangdong Basic and Applied Basic Research Foundation, grant number 2025A1515011328; the Jiangsu Key Laboratory of Atmosphere Environment Monitoring and Pollution Control, grant number KHK 2202; the Project of Research Center of Low Carbon Economy for Guangzhou Region, grant number 2023JDGJ19; and the Science and Technology Foundation of Guangzhou City, grant number 2023A04J0250.
Institutional Review Board Statement
Not applicable.
Informed Consent Statement
Not applicable.
Data Availability Statement
The original contributions presented in this study are included in the article/Supplementary Material; further inquiries can be directed to the corresponding authors.
Conflicts of Interest
The authors declare no conflicts of interest.
References
- Yang, J.; Zhao, Z.; Fang, W.; Ma, Z.; Liu, M.; Bi, J. China’s progress in synergetic governance of climate change and multiple environmental issues. Proc. Nalt. Acad. Sci. Nexus 2024, 3, pgae351. [Google Scholar] [CrossRef] [PubMed]
- Yu, W.; Ye, T.; Zhang, Y.; Xu, R.; Lei, Y.; Chen, Z.; Yang, Z.; Zhang, Y.; Song, J.; Yue, X.; et al. Global estimates of daily ambient fine particulate matter concentrations and unequal spatiotemporal distribution of population exposure: A machine learning modelling study. Lancet Planet. Health 2023, 7, e209–e218. [Google Scholar] [CrossRef]
- Chen, M.; Cui, Y.; Jiang, S.; Forsell, N. Toward carbon neutrality before 2060: Trajectory and technical mitigation potential of non-CO2 greenhouse gas emissions from Chinese agriculture. J. Clean. Prod. 2022, 368, 133186. [Google Scholar] [CrossRef]
- Li, L.; Zhang, Y.; Zhou, T.; Wang, K.; Wang, C.; Wang, T.; Yuan, L.; An, K.; Zhou, C.; Lü, G. Mitigation of China’s carbon neutrality to global warming. Nat. Commun. 2022, 13, 5315. [Google Scholar] [CrossRef]
- Shi, Q.; Zheng, B.; Zheng, Y.; Tong, D.; Liu, Y.; Ma, H.; Hong, C.; Geng, G.; Guan, D.; He, K.; et al. Co-benefits of CO2 emission reduction from China’s clean air actions between 2013–2020. Nat. Commun. 2022, 13, 5061. [Google Scholar] [CrossRef] [PubMed]
- Chen, X.; Li, J.; Jia, M.; Chen, S.; Zhang, S.; Bo, X.; Feng, X.; Dong, G. High spatial resolution emission inventory of air pollutants and carbon in China’s independent coking industry. Atmosphere 2023, 14, 348. [Google Scholar] [CrossRef]
- Zhang, Q.; Yin, Z.; Lu, X.; Gong, J.; Lei, Y.; Cai, B.; Cai, C.; Chai, Q.; Chen, H.; Dai, H.; et al. Synergetic roadmap of carbon neutrality and clean air for China. Environ. Sci. Ecotechnol. 2023, 16, 100280. [Google Scholar] [CrossRef]
- Lei, Y.; Yin, Z.; Lu, X.; Zhang, Q.; Gong, J.; Cai, B.; Cai, C.; Chai, Q.; Chen, H.; Chen, R. The 2022 report of synergetic roadmap on carbon neutrality and clean air for China: Accelerating transition in key sectors. Environ. Sci. Ecotechnol. 2024, 19, 100335. [Google Scholar] [CrossRef]
- Qian, H.; Xu, S.; Cao, J.; Ren, F.; Wei, W.; Meng, J.; Wu, L. Air pollution reduction and climate co-benefits in China’s industries. Nat. Sustain. 2021, 4, 417–425. [Google Scholar] [CrossRef]
- Shirsath, P.B.; Aggarwal, P.K. Trade-offs between agricultural production, GHG emissions and income in a changing climate, technology, and food demand scenario. Sustainability 2021, 13, 3190. [Google Scholar] [CrossRef]
- Wang, G.; Shi, R.; Mi, L.; Hu, J. Agricultural eco-efficiency: Challenges and progress. Sustainability 2022, 14, 1051. [Google Scholar] [CrossRef]
- Zhang, X.; Gu, B.; van Grinsven, H.; Lam, S.K.; Liang, X.; Bai, M.; Chen, D. Societal benefits of halving agricultural ammonia emissions in China far exceed the abatement costs. Nat. Commun. 2020, 11, 4357. [Google Scholar] [CrossRef]
- Huang, X.; Song, Y.; Li, M.; Li, J.; Huo, Q.; Cai, X.; Zhu, T.; Hu, M.; Zhang, H. A high-resolution ammonia emission inventory in China. Glob. Biogeochem. Cycles 2012, 26, 2011GB004161. [Google Scholar] [CrossRef]
- Xu, R.; Tian, H.; Pan, S.; Prior, S.A.; Feng, Y.; Batchelor, W.D.; Chen, J.; Yang, J. Global ammonia emissions from synthetic nitrogen fertilizer applications in agricultural systems: Empirical and process-based estimates and uncertainty. Glob. Change Biol. 2019, 25, 314–326. [Google Scholar] [CrossRef]
- Zhang, Y.; Dore, A.J.; Ma, L.; Liu, X.J.; Ma, W.Q.; Cape, J.N.; Zhang, F.S. Agricultural ammonia emissions inventory and spatial distribution in the North China Plain. Environ. Pollut. 2010, 158, 490–501. [Google Scholar] [CrossRef]
- Han, X.; Zhu, L.; Liu, M.; Song, Y.; Zhang, M. Numerical analysis of agricultural emissions impacts on PM2.5 in China using a high-resolution ammonia emission inventory. Atmos. Chem. Phys. 2020, 20, 9979–9996. [Google Scholar] [CrossRef]
- Lin, J.; Khanna, N.; Liu, X.; Teng, F.; Wang, X. China’s Non-CO2 greenhouse gas emissions: Future trajectories and mitigation options and potential. Sci. Rep. 2019, 9, 16095. [Google Scholar] [CrossRef]
- Duan, Y.; Gao, Y.; Zhao, J.; Xue, Y.; Zhang, W.; Wu, W.; Jiang, H.; Cao, D. Agricultural methane emissions in China: Inventories, driving forces and mitigation strategies. Environ. Sci. Technol. 2023, 57, 13292–13303. [Google Scholar] [CrossRef]
- Wu, X.; Zhang, Y.; Han, Y.; Zhang, Y.; Zhang, Y.; Cheng, X.; Zhong, P.; Yuan, X.; Zhang, Y.; Li, Z. Advances in methane emissions from agricultural sources: Part I. Accounting and mitigation. J. Environ. Sci. 2024, 140, 279–291. [Google Scholar] [CrossRef]
- Peng, S.; Piao, S.; Bousquet, P.; Ciais, P.; Li, B.; Lin, X.; Tao, S.; Wang, Z.; Zhang, Y.; Zhou, F. Inventory of anthropogenic methane emissions in mainland China from 1980 to 2010. Atmos. Chem. Phys. 2016, 16, 14545–14562. [Google Scholar] [CrossRef]
- Feng, R.; Li, Z.; Qi, Z. China’s anthropogenic N2O emissions with analysis of economic costs and social benefits from reductions in 2022. J. Environ. Manag. 2024, 353, 120234. [Google Scholar] [CrossRef]
- Luo, Z.; Lam, S.K.; Fu, H.; Hu, S.; Chen, D. Temporal and spatial evolution of nitrous oxide emissions in China: Assessment, strategy and recommendation. J. Clean. Prod. 2019, 223, 360–367. [Google Scholar] [CrossRef]
- Tian, H.; Pan, N.; Thompson, R.L.; Canadell, J.G.; Suntharalingam, P.; Regnier, P.; Davidson, E.A.; Prather, M.; Ciais, P.; Muntean, M.; et al. Global nitrous oxide budget 1980–2020. Earth Syst. Sci. Data 2023, 16, 2543–2604. [Google Scholar] [CrossRef]
- Cheng, X.; Zhang, Z.X.; Shi, T.; Yang, N.; Yang, S.H.; Chen, J.L.; Mao, G.Z.; Qi, Z.F.; Rao, S.; Jiang, C.L. Climate synergistic benefits: A path to the Beautiful China through total control of major air pollutants. J. Clean. Prod. 2024, 469, 143158. [Google Scholar] [CrossRef]
- Li, S.; Wang, S.; Wu, Q.; Zhao, B.; Jiang, Y.; Zheng, H.; Wen, Y.; Zhang, S.; Wu, Y.; Hao, J. Integrated benefits of synergistically reducing air pollutants and carbon dioxide in China. Environ. Sci. Technol. 2024, 58, 14193–14202. [Google Scholar] [CrossRef]
- Chen, J.; Cheng, M.; Krol, M.; de Vries, W.; Zhu, Q.; Liu, X.; Zhang, F.; Xu, W. Trends in anthropogenic ammonia emissions in China since 1980: A review of approaches and estimations. Front. Environ. Sci. 2023, 11, 1133753. [Google Scholar] [CrossRef]
- Kang, Y.; Liu, M.; Song, Y.; Huang, X.; Yao, H.; Cai, X.; Zhang, H.; Kang, L.; Liu, X.; Yan, X.; et al. High-resolution ammonia emissions inventories in China from 1980 to 2012. Atmos. Chem. Phys. 2016, 16, 2043–2058. [Google Scholar] [CrossRef]
- Liang, M.; Zhou, Z.; Ren, P.; Xiao, H.; Xu, R.; Hu, Z.; Piao, S.; Tian, H.; Tong, Q.; Zhou, F.; et al. Four decades of full-scale nitrous oxide emission inventory in China. Natl. Sci. Rev. 2024, 11, nwad285. [Google Scholar] [CrossRef]
- Wang, G.; Liu, P.; Hu, J.; Zhang, F. Agriculture-induced N2O emissions and reduction strategies in China. Int. J. Environ. Res. Public Health 2022, 19, 12193. [Google Scholar] [CrossRef]
- Lin, X.; Zhang, W.; Crippa, M.; Peng, S.; Han, P.; Zeng, N.; Yu, L.; Wang, G. A comparative study of anthropogenic CH4 emissions over China based on the ensembles of bottom-up inventories. Earth Syst. Sci. Data 2021, 13, 1073–1088. [Google Scholar] [CrossRef]
- Zhang, B.; Chen, G.Q. China’s CH4 and CO2 emissions: Bottom-up estimation and comparative analysis. Ecol. Indic. 2014, 47, 112–122. [Google Scholar] [CrossRef]
- Zhao, Y.; Yuan, M.; Huang, X.; Chen, F.; Zhang, J. Quantification and evaluation of atmospheric ammonia emissions with different methods: A case study for the Yangtze River Delta region, China. Atmos. Chem. Phys. 2020, 20, 4275–4294. [Google Scholar] [CrossRef]
- Bian, Y.; Huang, Z.; Ou, J.; Zhong, Z.; Xu, Y.; Zhang, Z.; Xiao, X.; Ye, X.; Wu, Y.; Yin, X.; et al. Evolution of anthropogenic air pollutant emissions in Guangdong Province, China, from 2006 to 2015. Atmos. Chem. Phys. 2019, 19, 11701–11719. [Google Scholar] [CrossRef]
- Wang, C.; Yin, S.; Bai, L.; Zhang, X.; Gu, X.; Zhang, H.; Lu, Q.; Zhang, R. High-resolution ammonia emission inventories with comprehensive analysis and evaluation in Henan, China, 2006–2016. Atmos. Environ. 2018, 193, 11–23. [Google Scholar] [CrossRef]
- Crippa, M.; Solazzo, E.; Huang, G.; Guizzardi, D.; Koffi, E.; Muntean, M.; Schieberle, C.; Friedrich, R.; Janssens-Maenhout, G. High resolution temporal profiles in the Emissions Database for Global Atmospheric Research. Sci. Data 2020, 7, 121. [Google Scholar] [CrossRef]
- Amann, M.; Kejun, J.; Hao, J.; Wang, S.; Zhuang, X.; Xiang, D.; Hong, L.; Jia, X.; Zhang, C.; Bertok, I.; et al. GAINS Asia. Scenarios for Cost-Effective Control of Air Pollution and Greenhouse Gases in China; International Institute for Applied Systems Analysis (IIASA): Laxenburg, Austria, 2008.
- Ohara, T.; Akimoto, H.; Kurokawa, J.; Horii, N.; Yamaji, K.; Yan, X.; Hayasaka, T. An Asian emission inventory of anthropogenic emission sources for the period 1980–2020. Atmos. Chem. Phys. 2007, 7, 4419–4444. [Google Scholar] [CrossRef]
- Zhang, X.; Wu, Y.; Liu, X.; Reis, S.; Jin, J.; Dragosits, U.; Van Damme, M.; Clarisse, L.; Whitburn, S.; Coheur, P.-F.; et al. Ammonia emissions may be substantially underestimated in China. Environ. Sci. Technol. 2017, 51, 12089–12096. [Google Scholar] [CrossRef]
- MCA. Administrative Division Code. Available online: https://www.mca.gov.cn/n156/n186/index.html (accessed on 15 November 2024).
- MEE. Technical Guidelines for the Preparation of Atmospheric Ammonia Source Emission Inventory (Trial). Available online: https://www.mee.gov.cn/gkml/hbb/bgth/201401/W020140124409251169140.pdf (accessed on 15 November 2024).
- NDRC. Guidelines on Provincial Greenhouse Gas Emission Inventory (Trial); National Development and Reform Commission of the People’s Republic of China: Beijing, China, 2011.
- NBS. China Statistical Yearbook (2021); China Statistics Press: Beijing, China, 2022. [Google Scholar]
- NBS. Compilation of Statistics Data of Chinese Agriculture, 2022; China Statistics Press: Beijing, China, 2022. [Google Scholar]
- MARA. China Animal Husbandry and Veterinary Yearbook; Ministry of Agriculture and Rural Affairs of the People’s Republic of China: Beijing, China, 2022.
- NDRC. National Cost and Profit of Agri-Products Materials Compilation, 2022; National Development and Reform Commission of the People’s Republic of China: Beijing, China, 2022.
- NESSDSI. National Earth System Science Data Sharing Infrastructure. Available online: http://www.geodata.cn (accessed on 15 November 2024).
- RESDC. Available online: http://www.resdc.cn (accessed on 15 November 2024).
- Misselbrook, T.H.; Sutton, M.A.; Scholefield, D. A simple process-based model for estimating ammonia emissions from agricultural land after fertilizer applications. Soil Use Manag. 2004, 20, 365–372. [Google Scholar] [CrossRef]
- Yue, Q.; Ledo, A.; Cheng, K.; Albanito, F.; Lebender, U.; Sapkota, T.B.; Brentrup, F.; Stirling, C.M.; Smith, P.; Sun, J.; et al. Re-assessing nitrous oxide emissions from croplands across Mainland China. Agric. Ecosyst. Environ. 2018, 268, 70–78. [Google Scholar] [CrossRef]
- Xu, X.F. Study on the Characteristics of Greenhouse Gas Emissions from Mariculture Ponds in Tianjin and Their Influencing Factors. Master’s Thesis, Tianjin Normal University, Tianjin, China, 2020. [Google Scholar]
- Zheng, J.Y.; Yin, S.S.; Kang, D.W.; Che, W.W.; Zhong, L.J. Development and uncertainty analysis of a high-resolution NH3 emissions inventory and its implications with precipitation over the Pearl River Delta region, China. Atmos. Chem. Phys. 2012, 12, 7041–7058. [Google Scholar] [CrossRef]
- Zhong, Z.; Zheng, J.; Zhu, M.; Huang, Z.; Zhang, Z.; Jia, G.; Wang, X.; Bian, Y.; Wang, Y.; Li, N. Recent developments of anthropogenic air pollutant emission inventories in Guangdong province, China. Sci. Total Environ. 2018, 627, 1080–1092. [Google Scholar] [CrossRef]
- Xu, Y.; Huang, Z.; Jia, G.; Fan, M.; Cheng, L.; Chen, L.; Shao, M.; Zheng, J. Regional discrepancies in spatiotemporal variations and driving forces of open crop residue burning emissions in China. Sci. Total Environ. 2019, 671, 536–547. [Google Scholar] [CrossRef] [PubMed]
- Li, B.; Chen, L.; Shen, W.; Jin, J.; Wang, T.; Wang, P.; Yang, Y.; Liao, H. Improved gridded ammonia emission inventory in China. Atmos. Chem. Phys. 2021, 21, 15883–15900. [Google Scholar] [CrossRef]
- Fu, H.; Luo, Z.; Hu, S. A temporal-spatial analysis and future trends of ammonia emissions in China. Sci. Total Environ. 2020, 731, 138897. [Google Scholar] [CrossRef]
- Zhang, L.; Chen, Y.; Zhao, Y.; Henze, D.K.; Zhu, L.; Song, Y.; Paulot, F.; Liu, X.; Pan, Y.; Lin, Y. Agricultural ammonia emissions in China: Reconciling bottom-up and top-down estimates. Atmos. Chem. Phys. 2018, 18, 339–355. [Google Scholar] [CrossRef]
- Zhou, F.; Shang, Z.; Ciais, P.; Tao, S.; Piao, S.; Raymond, P.; He, C.; Li, B.; Wang, R.; Wang, X.; et al. A new high-resolution N2O emission inventory for China in 2008. Environ. Sci. Technol. 2014, 48, 8538–8547. [Google Scholar] [CrossRef]
- Huang, M.; Wang, T.; Zhao, X.; Xie, X.; Wang, D. Estimation of atmospheric methane emissions and its spatial distribution in China during 2015. Acta Sci. Circumst. 2019, 39, 1371–1380. [Google Scholar] [CrossRef]
- Gong, S.; Shi, Y. Evaluation of comprehensive monthly-gridded methane emissions from natural and anthropogenic sources in China. Sci. Total Environ. 2021, 784, 147116. [Google Scholar] [CrossRef]
- Qi, W.; Liu, S.; Liu, Z. The novel pattern and driving factors of population spatial distribution on both sides of the “Hu Line” based on seventh census in China. Acta Geogr. Sin. 2022, 77, 3023–3040. [Google Scholar] [CrossRef]
- MARA. National Grain-Saving Type Animal Husbandry Development with Plan (2011–2020). Available online: https://www.moa.gov.cn/gk/ghjh_1/201201/t20120105_2451041.htm (accessed on 15 November 2024).
- NDRC. National Beef and Mutton Production Development Plan (2013–2020). Available online: https://zfxxgk.ndrc.gov.cn/web/iteminfo.jsp?id=286 (accessed on 15 November 2024).
- MARA. Pig Industry Accelerates Transformation and Upgrading. Available online: http://www.ghs.moa.gov.cn/ghgl/202105/t20210511_6367525.htm (accessed on 15 November 2024).
- Zhang, Y.P. China’s dairy industry development opens a new page. China Anim. Husb. 2017, 13, 10–12. [Google Scholar]
- Wu, S.P.; Zhang, Y.J.; Schwab, J.J.; Li, Y.F.; Liu, Y.L.; Yuan, C.S. High-resolution ammonia emissions inventories in Fujian, China, 2009–2015. Atmos. Environ. 2017, 162, 100–114. [Google Scholar] [CrossRef]
Disclaimer/Publisher’s Note: The statements, opinions and data contained in all publications are solely those of the individual author(s) and contributor(s) and not of MDPI and/or the editor(s). MDPI and/or the editor(s) disclaim responsibility for any injury to people or property resulting from any ideas, methods, instructions or products referred to in the content. |
© 2025 by the authors. Licensee MDPI, Basel, Switzerland. This article is an open access article distributed under the terms and conditions of the Creative Commons Attribution (CC BY) license (https://creativecommons.org/licenses/by/4.0/).