Article

Evaluation of Sustainable and Intelligent Transportation Processes Considering Environmental, Social, and Risk Assessment Pillars Employing an Integrated Intuitionistic Fuzzy-Embedded Decision-Making Methodology

1
Department of Industrial Engineering, Ondokuz Mayıs University, Samsun 55139, Türkiye
2
Department of Computer Technologies, Gönen Vocational School, Bandırma Onyedi Eylül University, Bandırma 10200, Türkiye
3
Department of Telecommunications, University of Ruse, 7017 Ruse, Bulgaria
*
Author to whom correspondence should be addressed.
Sustainability 2025, 17(7), 2945; https://doi.org/10.3390/su17072945
Submission received: 25 February 2025 / Revised: 15 March 2025 / Accepted: 24 March 2025 / Published: 26 March 2025

Abstract

:
The intelligent urban transportation system is a significant component of the economic development process of countries. However, the transportation system is one of the largest contributors to greenhouse gas emissions, and transportation accidents may cause environmental damage due to the transport of hazardous materials. Hence, a sustainable transportation system is significant in providing safe, environmentally friendly, and intelligent urban transport modes for economies when achieving sustainable development goals and evaluating environmental, social, and risk assessment pillars. This paper aims to evaluate the sustainable and intelligent urban transportation systems of fifty global economies by using nine main and fifty-six sub-criteria. In this paper, nine main and fifty-six sub-criteria are defined to evaluate the sustainable and intelligent urban transportation systems of fifty global economies. The nine main criteria and their sub-criteria have never been used before for assessing the transportation systems of fifty global economies. The experts’ opinions are asked to deal with uncertainty when generating pairwise comparison matrices for specified criteria. Then, a novel integrated intuitionistic fuzzy-based AHP and VIKOR framework is proposed to assess the sustainable and intelligent urban transportation systems of fifty global economies. Economic (C1), safety (C2), and hazards (C3) are the top three weighted criteria from the results of the framework for evaluating the sustainable and intelligent urban transportation systems of fifty different economies. Also, the environmental impact and utilization (C5) and sustainability (C8) criteria are notable, and they constitute 21.6% of the total weight for the evaluation of sustainable and intelligent transportation processes. Then, several different scenarios and comparison studies are also presented for the fifty global economies. Sweden, the United States, and Denmark are the top three choices for sustainable and intelligent urban transportation systems based on the results. Moreover, managerial recommendations of the application are drawn for sustainable and intelligent transportation processes. Finally, the safe, reliable, sustainable, and intelligent transportation process may positively impact economic, environmental, and social aspects of the development process of global economies when minimizing potential disruptions and risks.

1. Introduction

Transport plays a vital role in the economic development and growth of countries. Transportation is critical for bringing together different inputs used in producing goods and services needed by people in economies to create added value and distribute the outputs from the production process to various markets. Developments in transportation have now become a part of the development process. It is not surprising that economic development is strongly related to transportation opportunities. Moreover, goods transportation is the most essential process for competition in the global economy. The transportation sector creates job opportunities and affects the labor market’s efficiency. Other sector benefits include increasing the country’s trade volume, contributing to production efficiency, balancing consumer prices, and preventing price fluctuations.
The entire transportation sector creates an enormous environmental negative impact on energy consumption and greenhouse gas (GHG) emissions [1]. The International Energy Agency (IEA) reported that cars and vans used in 2022 will account for 48% of global transportation carbon dioxide emissions. The transportation sector is one of the sectors responsible for GHG emissions. In 2022, the transportation sector will come second after the energy sector worldwide [2,3]. The European Union (EU) estimates that the sector volume will increase in the near future due to the increase in freight transportation and people’s demand for transportation. In this case, the sector will increasingly continue to be a source of GHGs. Increasing environmental concerns and developing vehicle technologies have led people to use and research more environmentally friendly alternatives. However, decision-makers are taking steps to reduce these emissions in the medium and long term by taking a series of measures, establishing an efficient transportation infrastructure, and encouraging the use of more environmentally friendly vehicles [4]. The EU aims for zero carbon emissions, as stated in its 2050 targets [1]. Therefore, this goal can be achieved with safe, clean, affordable, reliable, and more active transportation modes. In other words, a sustainable mobility system is indispensable for societies. Furthermore, due to the increasing need for transportation in societies and its resulting various impacts, transportation sector operations must reflect the sustainable development and climate action goals. Sustainability in transportation is directly and indirectly related to more than half of the United Nations’ (UN) Sustainable Development Goals (SDGs) from the 2030 agenda [5].
Moreover, increasing sustainable transportation alternatives in vulnerable communities is one of the best ways for countries to support human development and social inclusion. Globally emerging climate risks, the COVID-19 pandemic, and regional wars have deeply affected the transportation sector. Increasing the resilience of the global transportation sector will make it easier for countries to adapt to changing conditions in international competition. Efficiency and resilience in logistics are crucial to driving sustainable economic growth and improving food security [6].
Increasing the efficiency of the processes, different transportation modes, and energy conservation and shifting to renewable energies both have the potential to reduce approximately 30% of the carbon emissions resulting from the transportation sector [7]. Along the same lines, the World Bank Logistics Performance Index 2023 report stated that the green logistics demand is increasing day by day. It has been noted that almost 75% of carriers demand environmentally friendly logistics options when exporting to high-income countries [8].
To reduce GHG emissions globally, governments have begun to take a series of steps to encourage the use and adoption of environmentally friendly vehicles. The regulations that have already come into force and will be put into force regarding these targets promote the use of alternative fuel vehicles, such as solar energy, electricity, biodiesel, LNG, and CNG vehicles, and limit the sale and use of conventional vehicles. Therefore, in parallel with the increasing environmental concerns in societies, developments in environmentally friendly vehicles, especially electric vehicle (EV) technology, have also increased rapidly. Furthermore, electric vehicles have an approximately 13% lower total cost of ownership per mile than internal combustion engine vehicles and also provide net current savings of approximately USD 200,000 over an average 15-year lifespan [9].
The research motivation concepts and gaps are summarized as follows: Safe, reliable, sustainable, and intelligent urban transportation systems contribute to the economic, environmental, and social aspects of societies. Also, the expert’s evaluation may include uncertainty and vagueness. Thus, the assessment of sustainable and intelligent urban transportation systems is a significant concern for global economies when considering uncertainty and risk pillars. In this paper, the criteria weights are obtained for evaluating the sustainable and intelligent transportation system, and then the fifty global economies are ranked. An integrated intuitionistic fuzzy-based AHP and VIKOR technique is proposed to prioritize the weights of the nine criteria and fifty-six sub-criteria and rank the fifty global economies in terms of their sustainable and intelligent transportation systems when dealing with uncertainty. This paper addresses this research gap to evaluate the sustainable and intelligent transportation processes of the fifty global economies using an integrated intuitionistic fuzzy-embedded decision-making methodology. To the best of our knowledge, the presented fuzzy-embedded method and the defined criteria and sub-criteria in this paper have not been studied in the literature concerning the fifty global economies.
The research contributions of this paper are provided as follows: First, this research study is addressed to show the implementation of environmental impact and utilization and sustainability metrics with safety and hazard metrics, including new metrics, like, for example, epidemics. Thus, the integrated intuitionistic fuzzy-based AHP and VIKOR technique is developed to determine the weights of these metrics for sustainable and intelligent urban transportation systems and rank the fifty global economies. Second, traditional multi-criteria decision-making (MCDM) methods may not be effective in considering experts’ instability under uncertainty and vagueness. On the contrary, the integrated technique presented in this paper is suitable for overcoming experts’ instability in a fuzzy environment. In addition, the integrated MCDM technique, considering uncertainty, is used for the first time to evaluate the sustainable and intelligent urban transportation systems of fifty global economies when examining the specified criteria involving environmental impact and utilization, sustainability, safety, and hazards. Third, the three experts’ opinions are surveyed to generate pairwise comparison matrices (PCMs) associated with the linguistic scale under uncertainty. In addition, the criteria and sub-criteria are specified and associated with the experts’ opinions, published reports, and the literature, filling the research gap for sustainable and intelligent urban transportation systems. Fourth, comparison and verification studies are also conducted to evaluate the sustainable and intelligent urban transportation systems of fifty global economies when considering uncertainty and risk pillars. Furthermore, a number of scenario analyses are carried out to assess the performances of fifty global economies related to environmental impact and utilization, sustainability, safety, and hazard exposures when presenting managerial recommendations of the presented application of the transportation process in this paper. Finally, Figure 1 shows the flowchart of the presented sustainable transportation framework.
The remainder of the paper is structured as follows: Section 2 provides brief literature reviews of sustainable transportation performance indicators and fuzzy-based decision-making techniques under uncertainty. Then, Section 3 describes the problem description and proposed methodology. Next, Section 4 presents the application of the proposed methodology under uncertainty, including the determination of criteria and alternatives, prioritizing the criteria, and ranking economies. Further, Section 5 provides managerial insights into the presented application of the sustainable and intelligent transportation process. Finally, Section 6 draws the conclusions of this study.

2. Literature Review

This section first introduces a brief review of evaluative articles on sustainable transportation. Then, intuitionistic fuzzy-based MCDM studies are reviewed in order to evaluate the alternatives when dealing with uncertainty.

2.1. Literature Review on Sustainable Transportation Performance Indicators

The concept of transportation sustainability was put forward almost three decades ago. The first studies in the literature are studies on how philosophical concepts related to how to measure this concept will find their counterpart in practice. Hence, Ref. [10] carried out a survey covering both research in the literature and transportation trends or policies by researchers or experts. The author evaluated various performance indicators related to sustainability currently considered in transportation. The author also analyzed the practices related to the measurement and monitoring of these indicators and discussed the results and experiences. Later, Ref. [11] proposed a framework that depended on the social, economic, and environmental dimensions of sustainability in the transportation sector. In this framework, cost-effectiveness, net effects, quality, comprehensiveness, comparability, functionality, transparency, and understandability/clarity pillars are considered. Later, Ref. [12] applied the technique for order of preference by similarity to ideal solution (TOPSIS) and Choquet integral methods to evaluate the transportation network sustainability of European countries. The main criteria consist of 17 environmental, economic, and social indicators. The results obtained from both methods stated that Germany had the best value among the 15 selected countries. The main reason why Germany is sustainable compared to other countries is its high environmental and social scores. Along the same lines, Ref. [13] surveyed indicators related to sustainability by analyzing 17 studies available in the literature. Cities around the world were compared by creating a composite index by selecting three indicators: social, environmental, and economic. In a similar way, Ref. [14] conducted literature research and stated that traffic safety depends on driver and user behaviors, road conditions, vehicle factors, traffic opportunities, and socio-economic factors. The authors then proposed a road safety performance index method considering transportation infrastructure characteristics. This risk index is calculated based on six main vital indicators. These are the number of accidents, the density of road junctions, surface anomalies, problems with road signs, and deficiencies in safety barriers.
Road safety performance is an important issue in transportation. In particular, Ref. [15] classified local municipalities as homogeneous and compared the road safety performance of these classes with the current physical structure on a local basis. The determined structure and culture factors to road safety performance include climate, relief, road network, population density, demographics, economic condition, the modal split of transport, and land use. Next, Ref. [16] addressed the evaluation of rail transit line systems. The authors developed a hierarchical multi-criteria decision-making satisfaction framework for a case study of the Istanbul rail network. The proposed method starts with statistical analysis. Then, it is evaluated by applying the fuzzy analytic hierarchy process and fuzzy Choquet integral. The main criteria are train and station comfort, time, information systems, accessibility, security, welcoming, fare, and ticketing. Furthermore, the results indicated that safety, time, and accessibility are the most important criteria. Then, Ref. [17] proposed an entropy TOPSIS-RSR (rank-sum ratio) method to assess road safety risk based on the composite Road Safety Risk Index (RSRI). The index consists of human, vehicle, road, environmental, and management factors, as well as traffic and personal risks. First, thirty-one provinces of China were evaluated and then grouped into five classes considering the risk index.
Public transportation accessibility provides efficient ways to reach destinations with suitable costs and times. Thus, Ref. [18] studied an evaluation of public transport accessibility with three criteria at a strategic level. These criteria are transit coverage, transit supply, and route diversity. TOPSIS was applied for evaluation, and then the various regions in Abu Dhabi were classified by K-means cluster analysis. Later, Ref. [19] conducted a literature review on public transportation services and analyzed the studies in terms of objectives, methods, data type, and results. The research perspective includes decisions mainly at the operational level and partly at the tactical level. These studies especially consider minimizing operational costs, idle time, and waiting time. The reviewed studies utilized vehicles with internal combustion engines; hence, the assumptions of all the studies ignored environmental concerns related to transportation. Next, Ref. [20] applied a multi-criteria analysis to evaluate the quality of public transport services in Florianópolis, Brazil. To compute the evaluation index, the main components related to comfort, vehicles, services, information, reliability, security, payment, entertainment, accessibility, and infrastructure have been weighted and included in the function.
Regarding the transportation system and institutions, we initially identified sustainable transportation indicators. Then, the determined indicators were analyzed, and the impact of these indicators on the transportation system performance of different states in the United States was evaluated. Along the same lines, Ref. [21] initially surveyed the literature relating to the Urban Mobility Index. The authors then chose the most popular Sustainable Urban Mobility Index and applied it to the public transport of the Metropolitan Region of the Great Vitoria, Brazil. The results were discussed, considering the indicators with the best and worst scores. The indicators/main criteria were defined as social, economic, and environmental and were left without necessary explanations. Hence, all criteria should require detailed explanations. Ref. [22] examined the supply chain sustainability in developing economies from the perspective of Industry 4.0. By conducting a case study in the Indian manufacturing industry, they have identified the potential challenges that may arise. The challenges were then grouped into organizational, legal, strategic, and technological categories using Explanatory Factor Analysis and weighted using AHP. Organizational challenges were found to be of the highest importance, while legal issues were found to be the least important. Similarly, Ref. [23] evaluated transportation service providers using economic, environmental, social, and operational criteria. The criteria were weighted with the best worst method (BWM) and evaluated by applying VIKOR. While the operational pillar ranks first, the social is the least important one. In terms of the sub-criteria, the service cost ranks first, and employee welfare comes last. Later, Ref. [24] applied the IV-VIKOR technique with the FNBC method and evaluated the OECD member countries with road safety performance indicators using the Human Development Index (HDI). Ref. [25] proposed an integrated approach involving the principal component analysis/factor analysis (PCA/FA) and fuzzy logic (FL) methodologies to assess the transportation sustainability of Indian states. The proposed integrated sustainable transportation index covers more than one hundred economic, social, and environmental indicators.
Recently, Ref. [26] determined a series of transport-related indicators for the UN SDGs so as to evaluate the progress of the SDGs in China’s transport sector and to analyze the interactions between the selected indicators. The analysis results stated that infrastructure construction, transportation volume, safety, and land use indicators received high scores; conversely, the results indicated that there are still great difficulties in using clean energy in the transportation sector. Similarly, Ref. [27] evaluated the 14-year road transportation sustainability performance of 29 Chinese provinces with socioeconomic and demographic variables. The several selected variables are GDP, labor, capital, energy, CO2, SO2, population density, innovation index, etc. Additionally, a hybrid approach integrated with data envelopment analysis and TOPSIS is proposed. The results show that there is a high level of variability regarding sustainability among different provinces in China. Using both literature research and European Commission (EC) directives, Ref. [28] developed a framework for the Sustainable Urban Mobility Plan that can be implemented to increase the welfare of the municipal population. Some of the indicators determined for this plan are affordability, accessibility, air pollution, mobility, noise, road deaths, accessibility, congestion, satisfaction, safety, etc. To evaluate these, Cross Impact Matrix Multiplication Applied to Classification (MICMAC) was adapted to the study. The results indicate traffic congestion as the strongest urban mobility indicator. This is followed by affordability, efficiency, mobility, and integration. Ref. [29] proposed a simulation-based framework to analyze plastic waste assessment processes. The methodology comprises 27 sub-criteria considering economic, social, security, energy, and environmental dimensions. Only three alternative processes were weighted with the BWM and ranked with the vector-based method. More recently, Ref. [30] studied the existing logistics performance index (LPI) and Environmental Performance Index (EPI) and combined these indices with simple mathematical expressions to define the Green Logistics Performance Index (GLPI). Later, in their study, they compared members of the European Union according to these three indices. Ref. [31] proposed an interval-valued Pythagorean fuzzy BWM and TOPSIS to rank sustainable energy systems in smart cities. The study involves five criteria and alternatives. The study defined the concept of environmentalism and sustainability through carbon emissions and environmental impact. Risks, safety, etc., are crucial pillars related to smart cities that were ignored within the limited criteria and alternatives.
Table 1 provides a brief summary of the literature review on the stream of sustainable transportation. A wide variety of performance indicators related to the transportation sector have been discussed in the literature, and the bottom line of the table summarizes the differences between this proposed study and existing studies. In terms of indicators, unlike current studies, the proposed study evaluates sustainable transportation with a holistic approach, considering expert opinions. From an application perspective, the study offers a more comprehensive comparison with up-to-date data, considering different global income levels and fifty economies on the continent. In terms of method, this is the first study to use the integrated intuitionistic fuzzy-based AHP and VIKOR technique in this evaluation.

2.2. Literature Review of the Intuitionistic Fuzzy-Based MCDM Studies

In the literature, many MCDM techniques, such as the analytic hierarchy process (AHP), TOPSIS, etc., have been presented for decision problems. In this paper, intuitionistic fuzzy-associated MCDM techniques are summarized as follows: Ref. [32] proposed an intuitionistic fuzzy analytic hierarchy process (IFAHP) with intuitionistic fuzzy values. Also, the presented IFAHP by [32] enhanced the inconsistent preferences without the decision-maker participation when considering more complex decision-making problems. Along the same lines, Ref. [33] used the IFAHP technique to evaluate the four main human capital indicators. Next, Ref. [34] offered a preference programming related to determined weights from the IFAHP technique, where decision makers state their judgments of pair-wise comparisons with generalized triangular intuitionistic fuzzy numbers for several examples.
Moreover, Ref. [35] used a SWOT analysis to identify the criteria and sub-criteria of a reverse logistics outsourcing decision-making problem. Further, Ref. [35] applied the IFAHP technique to evaluate the weights among the relevant criteria and sub-criteria of reverse logistics outsourcing. Then, Ref. [36] used the fuzzy set theory for a decision-making problem when evaluating the outsource manufacturers under uncertainty. For this particular purpose, Ref. [36] presented an interval-valued intuitionistic fuzzy AHP- and TOPSIS-embedded technique for the evaluation of the outsource manufacturers. In a similar way, Ref. [37] developed an interval type-2 fuzzy AHP technique originating from an intuitionistic fuzzy set for the technology selection of a damless hydroelectric power plant. Next, Ref. [38] applied an integrated interval-valued intuitionistic fuzzy AHP and TOPSIS technique for the prioritization of production strategies. In the same way, Ref. [39] applied the IFAHP technique for decision problems with imprecise information. Also, Ref. [39] introduced a distance-focused priority technique from intuitionistic fuzzy sets for the supplier selection problem. The recent intuitionistic fuzzy-based MCDM studies are presented as follows: Significantly, Ref. [40] integrated intuitionistic fuzzy sets and AHP to obtain better performance. In addition, Ref. [40] investigated the formulated differences between the AHP weight and the normalized defuzzified IFAHP weight and conducted two case studies associated with supplier selection scenarios. In a similar way, Ref. [41] presented a circular intuitionistic fuzzy analytic hierarchy process (CIFAHP) and a circular intuitionistic fuzzy VIKOR (CIF-VIKOR) technique for a multi-expert supplier selection problem. Further, Ref. [42] presented interval-valued circular intuitionistic fuzzy (IVCIF) sets and their mathematical operations to integrate the uncertainty. Next, Ref. [42] introduced an IVCIF-based AHP method for the application of digital transformation project selection problems.

3. Problem Description and Proposed Methodology

In this section, the problem description is provided. Next, the proposed intuitionistic fuzzy-based integrated methodology is presented to obtain criteria weights and rank the alternatives, including benchmarking analysis associated with the income levels of fifty global economies.

3.1. Problem Description

Practical problems in the real world often consist of a number of non-proportionate and conflicting criteria, and often, no solution can be found to satisfy all criteria at the same time. For this particular situation, MCDM methods are able to identify the ranking list and the solution acquired with specified weights being associated with the opinions of the experts. Moreover, in the real world, the performance values and the weights of the specified criteria are not known precisely. Also, the knowledge of experts is not so precise. Thus, an imprecise and uncertain environment is considered for the criteria to be evaluated. In these particular situations in decision-making problems, fuzzy approaches are used to find the weights of the criteria. Then, overall performance scores associated with exploring the research gap from the literature, published reports, and the weights of the criteria from the opinion of the experts are obtained.

3.2. Integrated Intuitionistic Fuzzy-Based AHP and VIKOR

An integrated intuitionistic fuzzy-based AHP and VIKOR approach is developed in this sub-section. In addition, the equations are provided to obtain the weights and rank the alternatives using the MCDM techniques by the researchers [32,36,43]. In this paper, the equations are formulated based on the fuzzy framework for transportation processes. The proposed methodology consists of three main parts. The first part consists of stages 1–10 and is based on the intuitionistic fuzzy-based AHP technique in order to find criteria weights based on the judgments of the experts. The second part is related to stages 11–16, and it is associated with the VIKOR technique to rank the alternatives based on the weights acquired from the first part. The third part consists of stage 17, including a conclusion for an MCDM problem, benchmarking analyses of the income levels of fifty global economies, and managerial recommendations. The details of each step are provided as follows:
Stage 1: Start the procedure of the intuitionistic fuzzy-based AHP method, and then go to stage 2.
Stage 2: Pairwise comparison matrices (PCMs) are built based on the linguistic scale, and decision makers (DMs) make choices in order to fill the PCMs with the linguistic terms in Table 2.
Stage 3: The linguistic scale-based pairwise matrices are transformed into their associated intuitionistic fuzzy sets in Table 2 to acquire intuitionistic PCMs and an aggregated pairwise comparison matrix ( A P C M ˜ g ). The A P C M ˜ g is denoted as follows:
A P C M ˜ g = μ g 11 , μ g 11 + , π g 11 , π g 11 + μ g 1 n , μ g 1 n + , π g 1 n , π g 1 n + μ g n 1 , μ g n 1 + , π g n 1 , π g n 1 + μ g n n , μ g n n + , π g n n , π g n n +
where μ i j and π i j represent the membership and non-membership functions of the fuzzy set, respectively.
Stage 4: The score judgment matrix ( S J M ˜ ) is denoted with the associated score function of an interval-valued intuitionistic fuzzy number as follows:
S J M ˜ = μ g 11 π g 11 + , μ g 11 + π g 11 μ g 1 n π g 1 n + , μ g 1 n + π g 1 n μ g n 1 π g n 1 + , μ g n 1 + π g n 1 μ g n n π g n n + , μ g n n + π g n n
Stage 5: The interval exponential matrix, ( I E M ˜ ), is obtained in the following way:
I E M ˜ = e μ g 11 π g 11 + , e μ g 11 + π g 11 e μ g 1 j π g 1 j + , e μ g 1 j + π g 1 j e μ g n 1 π g n 1 + , e μ g n 1 + π g n 1 e μ g n n π g n n + , e μ g n n + π g n n
Stage 6: When establishing the priorities, the ith priority vector, p w i ˜ , is found using the following formula:
p w ˜ i = j = 1 n e μ g i j π g i j + i = 1 n j = 1 n e μ g 11 + π g 11 , j = 1 n e μ g 11 + π g 11 i = 1 n j = 1 n e μ g i j π g i j + p w ˜ i = p w i , p w i + i = 1 , 2 , , n
Stage 7: The possibility degree, P s p w ˜ i p w ˜ j , denotes the probability for the random event p w ˜ i p w ˜ j . Possibility degrees are calculated as follows:
P s p w ˜ i p w ˜ j = p s i j = max p w i + p w j , 0 max p w i p w j + , 0 p w i + p w i + p w j + p w j
Similarly, the possibility degrees are found for the random event p w ˜ j p w ˜ i as follows:
P s p w ˜ j p w ˜ i = p s j i = max p w j + p w i , 0 max p w j p w i + , 0 p w i + p w i + p w j + p w j
Stage 8: The prioritized possibility degrees are obtained as follows:
p w i = 0.5 + j = 1 n p s i j 1 j = 1 n p s i j 1 n n
Stage 9: The ith normalized weight, w i , is found as follows:
n w i = p w i i = 1 n p w i
Stage 10: The main criteria and sub-criteria weights are found when repeating stages 2–9. Next, go to stage 11 to evaluate the alternatives.
Stage 11: Start the procedure of the VIKOR method, and then go to stage 12.
Stage 12: A multi-attribute decision-making matrix is generated as follows:
f i j n × m = f 11 f 12 f 1 m f 21 f 22 f 2 m f n 1 f n 2 f n m n × m
where f i j represents the value of the ith alternative on the jth criterion.
Stage 13: The positive ideal solution (PIS) and negative ideal solution (NIS) are determined as follows:
P I S i = max f i j N I S i = min f i j
where i = 1 , 2 , , n and j = 1 , 2 , , m .
Stage 14: The values, S j and R j , are computed as follows:
S j = i = 1 n n w i P I S i f i j n w i P I S i f i j P I S i N I S i P I S i N I S i R j = max i n w i P I S i f i j n w i P I S i f i j P I S i N I S i P I S i N I S i
Stage 15: The values, Q j , are calculated using the following equation:
Q j = 0.5 S j S + 0.5 S j S + S + S + S + S + + 0.5 R j R + 0.5 R j R + R + R + R + R + where S + = min j S j , S = max j S j , R + = min j R j , and R = max j R j .
Stage 16: The alternatives are sorted depending on the ascending order of the S , R , and Q values. Then, go to stage 17 in order to conclude the results.
Stage 17: Draw a conclusion for the multi-attribute decision-making problem with the different scenario analyses, benchmark the income levels of fifty global economies, and provide managerial insights.

4. Application of the Proposed Methodology Under Uncertainty

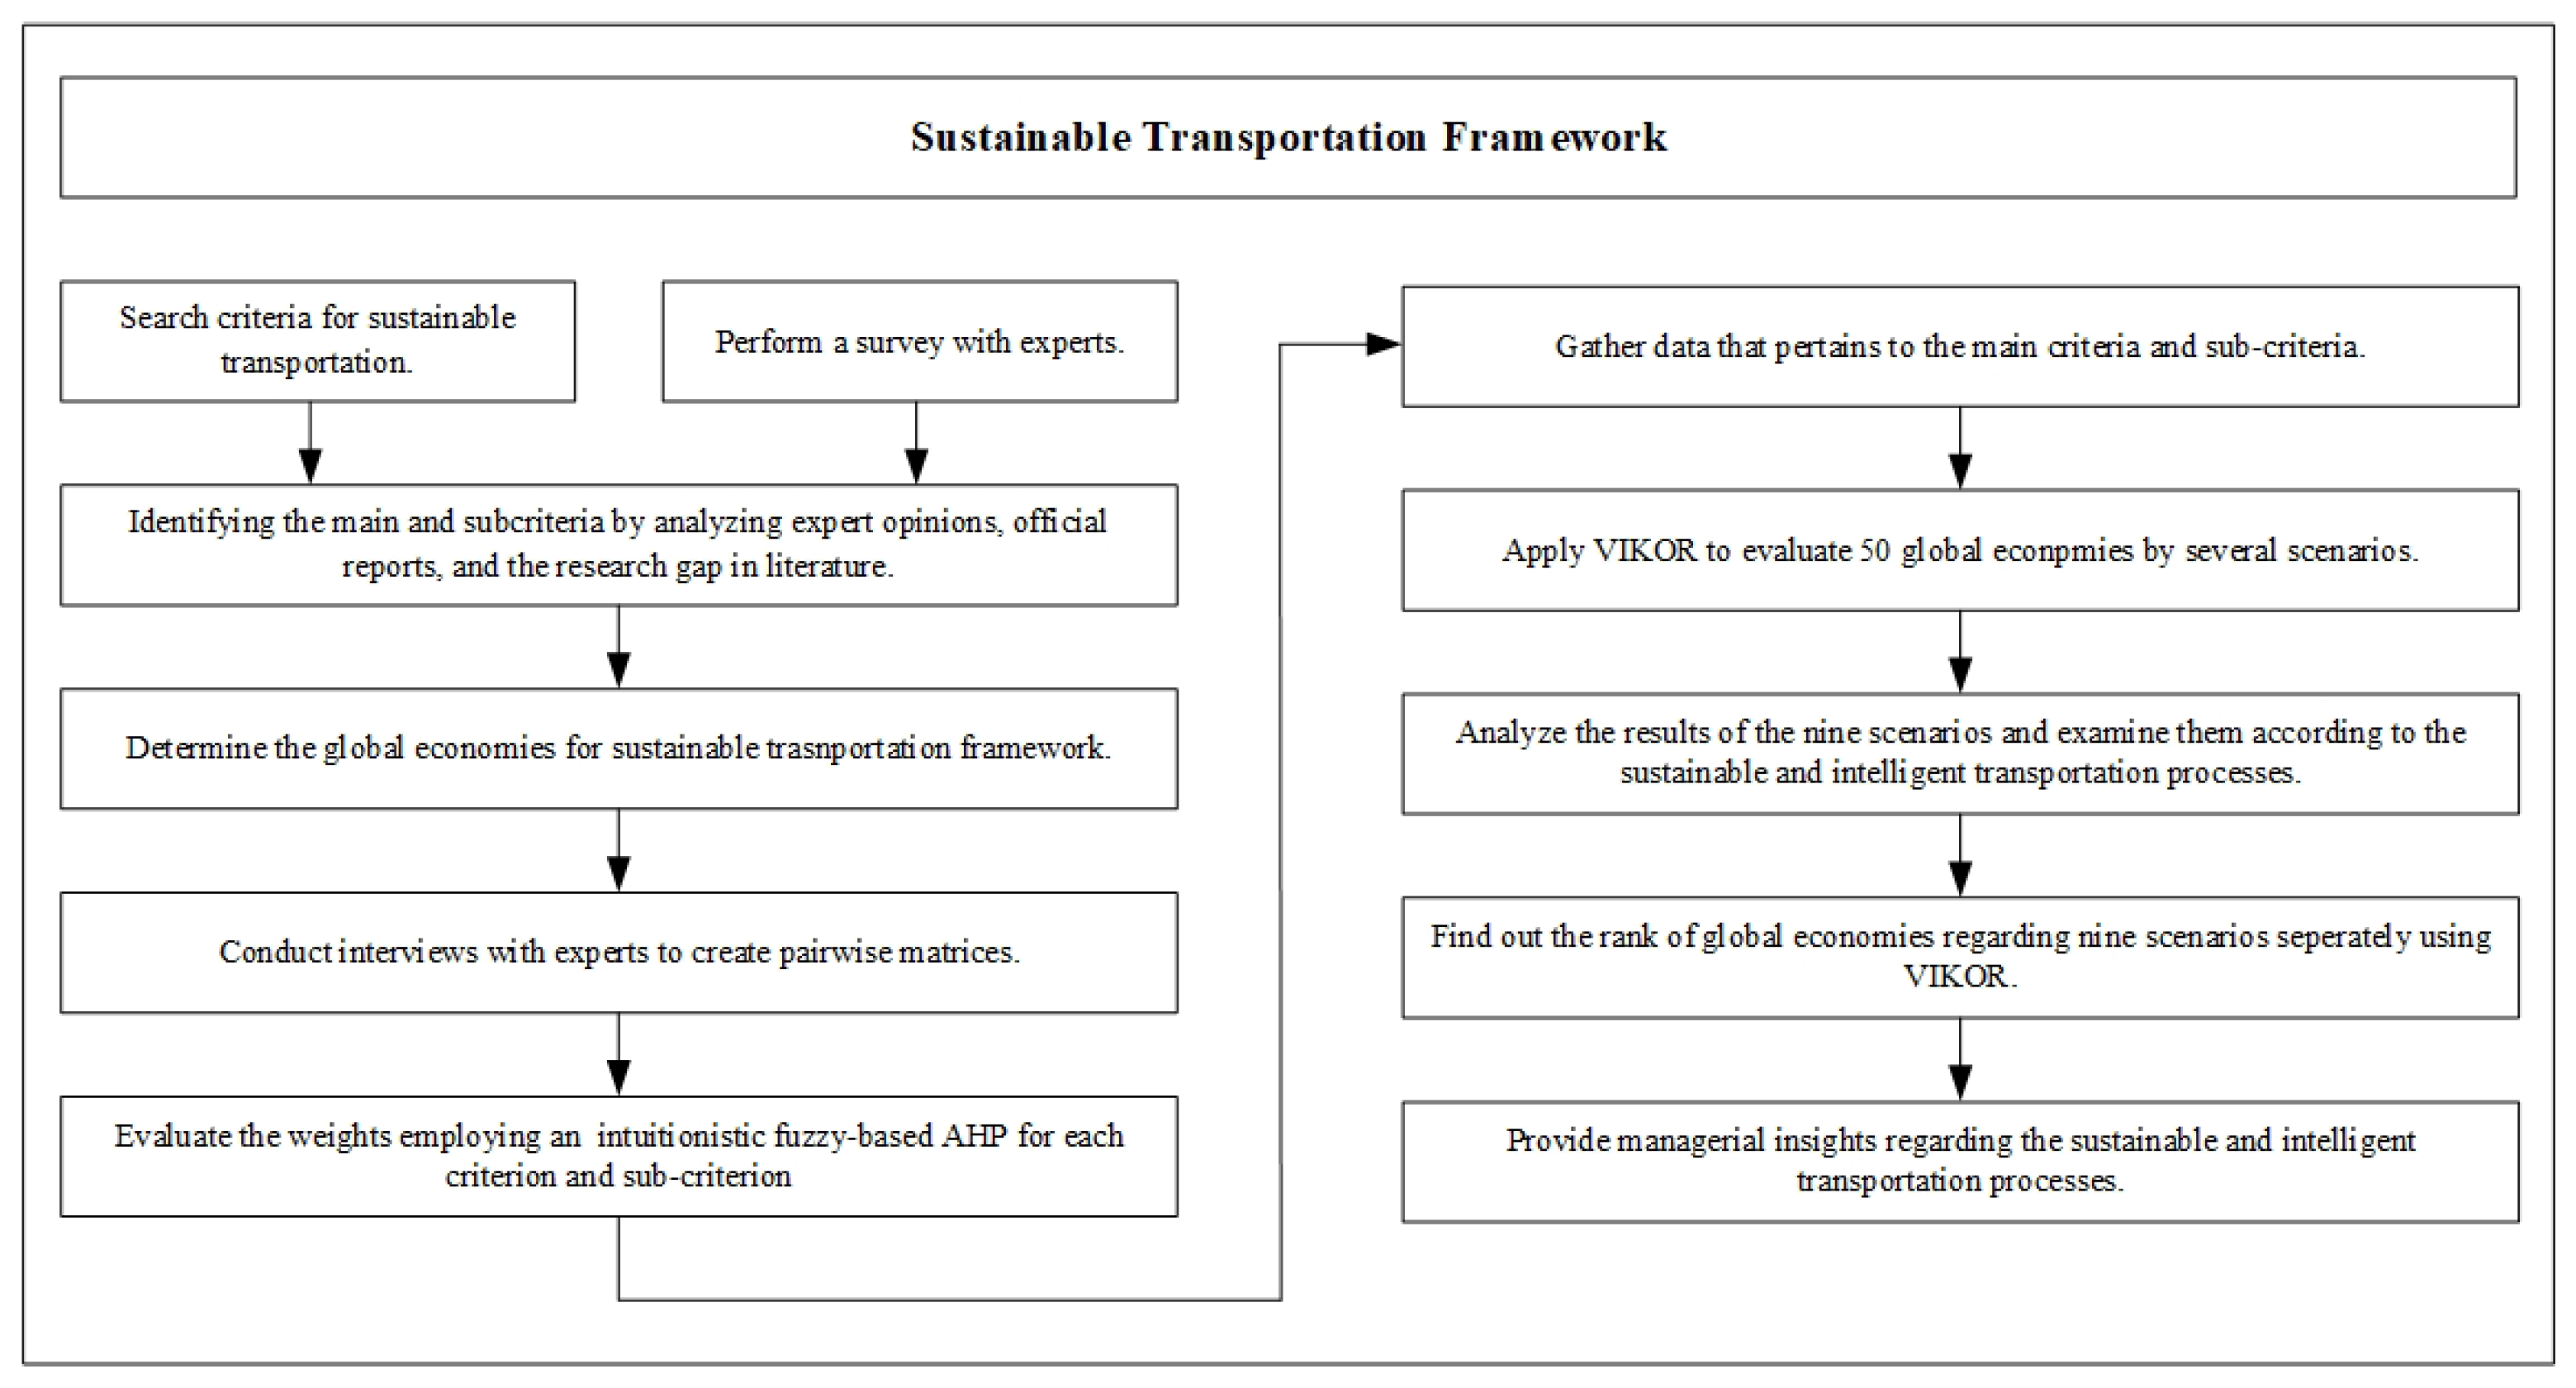
This section consists of four sub-sections as follows: First, the specified criteria and alternatives are explained. Second, the criteria are prioritized using stages 1–10 in the proposed methodology. Third, the fifty global economies are ranked based on stages 11–16 in the proposed methodology. Four, the fifty global economies are ranked as how they relate to the business region and income level when applying stage 17 in the proposed methodology.

4.1. Criteria and Alternatives

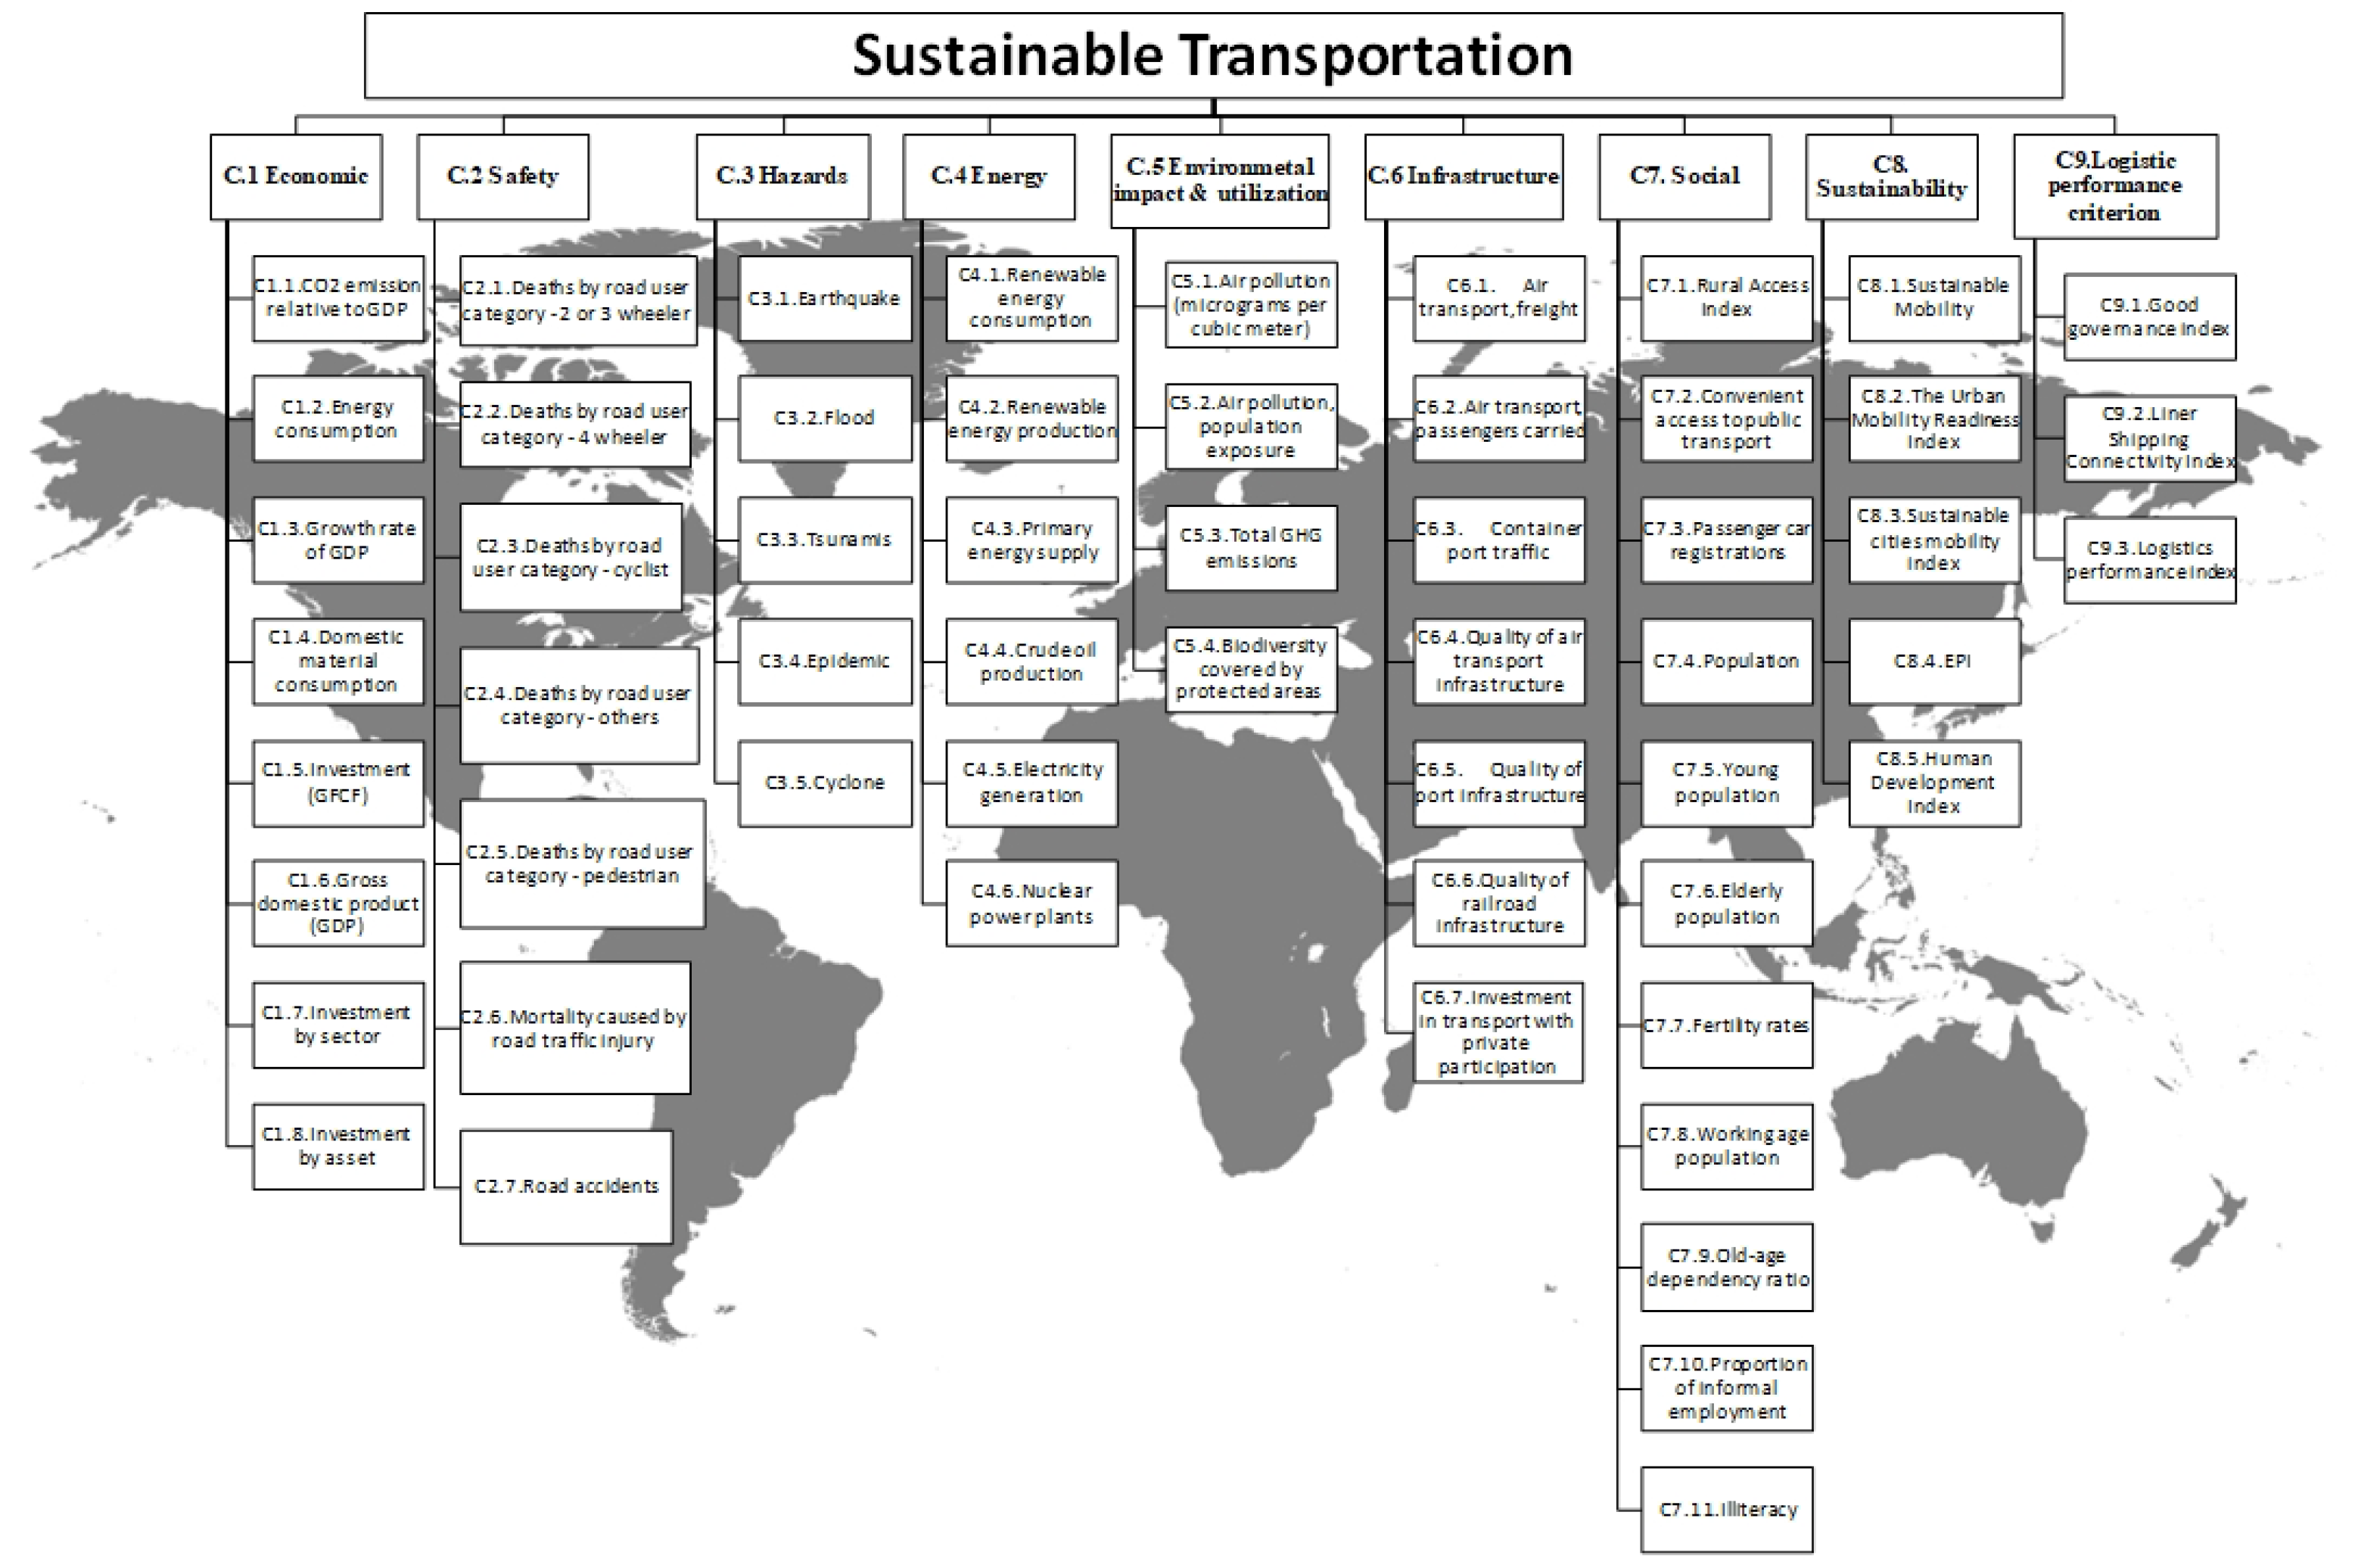
Evaluations of sustainable and intelligent urban transportation systems are associated with several factors that affect the performances of global economies. For this reason, the assessments of sustainable and intelligent transportation systems are critical to achieving more efficient and resilient logistics systems for the economic growth of each country. In this study, nine main criteria and fifty-six sub-criteria are selected based on surveying the experts, papers from scholarly databases, and published reports. The main criteria are listed as follows: economic, safety, hazards, energy, environmental impact and utilization, infrastructure, social, sustainability, and logistic performance criterion (see Figure 2). Table 3 summarizes the description of the specified criteria. Moreover, fifty global economies were selected in America, Asia, Europe, the Middle East, and Africa when asking the opinions of the decision-making team, considering the GDP and published reports about global economies. In addition, the chosen economies cover 90.86% of the world GDP (currency: USD). Thus, income levels worldwide are considered when specifying countries.
C1 Economic: Global interest in the transportation sector has continued to increase in recent years due to the fact that decision makers state that the sector is at the center of sustainable development. The sustainability of the sector increases economic growth and improves accessibility for its members. It also raises integration in economies by taking into account increasing environmental concerns.
C2 Safety: This safety indicator includes indicators such as deaths, injuries, number of accidents, etc. The WHO states that more than 1 million people die and 20–50 million people are injured in road traffic accidents worldwide every year [45]. In addition to the pain caused by these accidents, the treatment costs of injured people and the loss of the working ability of those who are disabled bring about a financial economic burden. Road traffic accidents impose an economic burden on economies, costing almost 3% of their annual gross domestic product [45]. Moreover, taking precautions against accidents in road traffic can reduce the risk of injury and death. In the Sustainable Development 2030 agenda, the aim to reduce deaths and injuries in road traffic by 50% is stated [45].
C3 Hazards: The global economy thrives on the flow of products, and human needs have become dependent on the products and services offered by this transportation sector. In this regard, the country’s logistics system must operate efficiently and productively. However, assets in this system are still exposed to a range of potential disruptions and threats, such as earthquakes, floods, tsunamis, hurricanes, epidemics, etc. These disasters can significantly disrupt production in economies or affect the flow of international input supplies [43].
C4 Energy: Energy is one of the most critical components of sustainable transportation. The use of zero-emission electric or alternative fuel vehicles, as well as low-emission internal combustion engine vehicles, can lead to energy-saving and affordable transportation.
C5 Environmetal impact and utilization: The main indicator of environmental dimensions includes the negative effects on the economy related to transportation. Further, sustainable transportation aims to reduce/stop increasing environmental impacts and thus increase economic benefit. Therefore, sustainable transportation affects many dimensions, such as social equality, public health, resilient cities, urban–rural networks, and the productivity of rural areas.
C6 Infrastructure: Infrastructure investments stimulate economic growth, increase employment, and improve livelihoods. Infrastructure investments increase the country’s capacity, create opportunities for society, provide economic competitiveness, and help global integration. Increasing sustainable transportation options, especially in low-income communities, is one of the most essential ways for countries to achieve human development and social inclusion. Investments in transportation infrastructure support economic growth, create jobs, and connect the community to critical services such as health or education [46].
C7 Social: This indicator incorporates community statistics regarding transportation and easy access to public transport. Regarding the social dimension of the transport system, it measures the challenges and opportunities in terms of affordability, reliability, and accessibility for different users of the system’s modernization [47]. Additionally, in some countries, informal employment constitutes a significant part of the economy and labor market. Although informal employment is vital in sectors and income generation, it leaves people with a higher level of vulnerability and insecurity. The ILO reports state that indicators such as unemployment rate and time-related underemployment in these countries are incomplete and unsuccessful in expressing the labor market [48]. From the perspective of transport equality and social inclusion, indicators such as accessibility to public transport for people who do not have a car or are impaired, connectivity for low-income or deprived geographical areas, etc., are important in this regard [23,49].
C8 Sustainability: This main criterion consists of internationally known and popular indices that express the level and status of countries regarding sustainability and sustainable mobility. Sustainable mobility involves reducing emissions from transportation and minimizing fuel consumption, taking into account the regenerative capacity of the environment. This term, also known as green driving, aims to contribute to society by consuming fewer resources in sustainable transportation, supporting climate protection, and facilitating the growth of more green areas [50]. The Environmental Performance Index (EPI) evaluates countries worldwide from the perspective of climate change performance, environmental health, and ecosystem vitality, with 40 performance metrics classified into 11 main sustainability-related categories [51]. Furthermore, the HDI measures human development by taking into account the dimensions of living a long and healthy life, being knowledgeable, and having a reasonable standard of living [52,53].
C9 Logistic performance criterion: Logistics performance is a measure that indicates the trade logistics performance of countries. It includes ease of connection within the supply chain of partners, logistics service quality, and a number of structural components related to infrastructure and controls in international trade and transportation [8]. While the good governance index measures countries’ economic growth, human capital creation, and social cohesion strength, the liner shipping connectivity index represents how well countries are connected to global maritime networks

4.2. Prioritizing the Criteria

The criteria weights are obtained using stages 1–10 in the intuitionistic fuzzy-based AHP method. A decision-making team has experience with sustainable and intelligent urban transportation systems. In addition, the decision-making team consists of three people with doctoral degrees in industrial engineering and civil engineering, with a concentration on transportation and more than ten years of work experience. Then, PCMs are generated based on the opinions of the decision-making team. In the Appendix A, Table A1 shows the PCMs of the decision-making team. The three experts individually make their choices to fill the PCMs in Table A1 using Table 2. Indeed, PCMs are important in analyzing the preferences of the three experts and proceeding to the other stages for obtaining weights. After applying the presented intuitionistic fuzzy-based AHP method, Table 4 shows the calculated weights of criteria and sub-criteria. As observed from Table 4, the highest weight among the nine criteria is economic (C1), which is 0.127. The finding of the economic criterion is in agreement with the previous paper by [54] in terms of economic development. The second-highest weight is safety (C2), and its weight is 0.125. As expected, the safety indicator is an important concern in analyzing deaths, injuries, etc. The finding of the safety criterion is consistent with the published report [45]. Next, the global economies are negatively affected by earthquakes, floods, tsunamis, hurricanes, epidemics, etc. Thus, the third-highest criterion is hazards (C3) based on this awareness, and its weight is 0.116. Then, the environmental concerns affect transportation operations. Based on this awareness, environmental impact and utilization (C5) is the fourth-highest weight, and its weight is 0.113. Next, energy (C4) is a significant part of sustainable and intelligent transportation systems and is the fifth-highest criterion based on the experts’ opinions. Further, infrastructure (C6) is the sixth-highest weight in Table 4, and its weight is 0.107. Then, the seventh criterion is social (C7) with a weight of 0.106. Next, sustainable mobility is a key concept to reduce emissions from transportation. Based on this awareness, the weight of the sustainability criterion (C8) is 0.103. Even though sustainability is the eighth-highest criterion, it contributes 10.30% to the evaluation process. Lastly, the logistic performance criterion is the lowest weight among the criteria associated with the decision-making team.
In Table 4, the local and global weights of the sub-criteria are presented. The most significant sub-criterion for each main criterion is summarized as follows. The investment (GFCF) (C1.5) is the most significant sub-criterion of economic. Then, road accidents (C2.7) is the most important sub-criterion of safety. Next, earthquake (C3.1) is the highest sub-criterion weight for hazards due to the experts’ experiences. Further, renewable energy production (C4.2) is important to contribute to sustainable transportation and intelligent systems. Based on this awareness, the maximum sub-criterion weight of energy is renewable energy production. Moreover, the total GHG emissions (C5.3) have the maximum sub-criterion weight for environmental impact and utilization. The findings are consistent with the previously published papers [54]. Then, air transport, passengers carried (C6.2) is the most significant sub-criterion of infrastructure. Also, air transport, freight (C6.1), and investment in transport with private participation (C6.7) are important sub-criteria as well. Next, passenger car registrations (C7.3) and the young population (C7.5) are the maximum sub-criteria of social. Further, sustainable mobility (C8.1) is the maximum sub-criterion weight for sustainability in order to achieve the sustainable development goals. Lastly, the good governance index (C9.1) is the highest weight of the logistic performance criterion.

4.3. Ranking Economies

The fifty global economies are ranked by applying stages 11–16 in the proposed methodology. Table 5 presents the results of the VIKOR approach. While the first column refers to economies, the first row corresponds to the criteria-based results of the VIKOR approach. In other words, the all criteria column presents the results of all indicators; the remaining columns express each criterion’s results one by one.
According to the first scenario, which includes economic indicators, the highest-performing countries are Bulgaria, Mexico, Egypt, Arab Rep., Denmark, and Portugal. Bulgaria’s high score contributes to the sub-indicators of domestic material consumption, investment (GFCF), and gross domestic product (GDP). Countries with low scores in this scenario are Vietnam, Uruguay, South Africa, Colombia, and China. Vietnam has the lowest scores in the domestic material consumption, investment (GFCF), and investment by asset sub-indicators. Improvements in these economic indicators may also increase transportation performance.
According to the safety indicator, Sweden, Spain, Turkey, the Russian Federation, and the United Kingdom are the top five scoring countries. The main reason is that Sweden achieved the best results in the sub-indicators, such as deaths by road users, traffic injuries, and accidents. Sweden has adopted the Vision Zero approach, defined as a strategic safety policy against the risk of severe or fatal injury from the road transport perspective. The rate of wearing seat belts and helmets is high in society. In addition, this system is mandatory and is monitored and supported by a safety impact assessment and road inspections. The bottom five scorers are Saudi Arabia, Vietnam, the Philippines, Malaysia, and Nigeria. These countries have the lowest score in mortality caused by road traffic injury and road accidents.
Considering the risk profiles of the fifty economies, Denmark is the top scorer. Denmark ranks first because its location has a low risk of earthquakes, floods, tsunamis, and cyclones. Singapore, Ireland, Uruguay, and the United Kingdom are the rest of the five top-scoring countries. In the other case, the countries with the highest risk profile are the Philippines, Japan, Chile, Colombia, and Greece. The Philippines’ high probability of exposure to earthquakes, tsunamis, and cyclones causes it to be at the bottom of this category. Natural disasters can affect economies that are vulnerable to global supply chains and transportation.
Energy is one of the most essential inputs to the transportation sector. There are plans to either reduce or abandon the currently used resources on which the industry depends and transform them into clean resources in the future. Regarding energy as the main indicator, European countries, especially Scandinavian countries, dominate the list. Iceland, Norway, Sweden, Finland, and Estonia are the top five economies with the highest scores. Iceland owes its success to receiving the highest score in primary energy supply, renewable energy production, and consumption sub-pillars. The bottom scorers are countries that cannot benefit from clean energy sources and are dependent on conventional energy sources. These countries are, in order, Singapore, Egypt, Arab Rep., Malaysia, Tunisia, and Argentina.
Environmental sustainability is essential in meeting people’s needs and preserving/protecting the natural environment without compromising the availability of future resources. Air quality is directly linked to climate and ecosystem, and GHG emissions caused by burning fossil fuels reduce air quality. Regarding this pillar, the top five scorers are Estonia, Australia, Spain, the United States, and Portugal. Estonia has the best air quality compared to other economies. In the other spectrum, the lowest scorers are China, India, Egypt, Arab Rep., and Saudi Arabia. China has the highest air pollution and GHG emissions.
Infrastructure creates value in the economy by providing mobility in society, accessibility to services, and ease in the flow of products. It also contributes to social welfare by increasing social interaction. The top five economies in terms of transportation infrastructure are China, the United States, the United Arab Emirates, Germany, and Japan. The Chinese economy has achieved an increasing rise in world trade for decades by investing in the world’s largest and busiest ports. According to the infrastructure score, the economies at the bottom of the list are Nigeria, Tunisia, Bulgaria, Uruguay, as well as Egypt, Arab Rep. Nigeria has low scores in terms of investment in transport with private participation and quality of transportation modes.
Green mobility is critical for society to grasp. Transport must provide better connections to rural and remote areas, be accessible to people with limited mobility and disabilities, be affordable, and offer equal and good conditions to all segments of society. Regarding the social pillar, Brazil, Turkey, Israel, the United Kingdom, and the United States are the five top-scoring economies. At the other end of the spectrum are Tunisia, Nigeria, Egypt, Arab Rep., the Philippines, and Malaysia.
Sustainability briefly refers to low- and zero-emission environmentally friendly vehicles, energy-saving and affordable accessible transportation modes. The five top-scoring economies are Sweden, Denmark, Finland, Switzerland, the Netherlands, and the United Kingdom. European economies perform well in this pillar. Sweden has focused on sustainable transportation for many years and has allocated resources to environmentally friendly technologies. It also aims to increase the proportion of people traveling by public transport and improve the community’s quality of life. At the end of the list, the lowest scoring economies are Nigeria, Saudi Arabia, India, the Philippines, and Egypt, Arab Rep.
The set of indices covered in the logistic performance criterion expresses the most current perspective on the commercial logistics performance of economies. While Singapore, the Netherlands, Germany, the United Kingdom, and Belgium are in the first row, Bulgaria, Argentina, Tunisia, the Russian Federation, and Colombia are at the other end of the spectrum.
When all criteria are considered, the top five scorers, according to VIKOR’s results, are Sweden, the United States, Denmark, the United Kingdom, and Switzerland. European countries dominate the group. The overall results indicated that the top five countries have strong economic and investment performance, have determined safety policies in road safety, and have less exposure to possible risks. In addition, policies are in place in these countries to encourage and expand renewable energy. The high level of development in different modes of transportation and the support of social policies in the top five countries are also crucial. The main reason why these economies have higher performance is that they are dominant players in international trade and supply chains while considering environmental concerns. On the other spectrum, the lowest scorers are Vietnam, India, Argentina, China, and Tunisia, according to VIKOR’s results. The results showed that the countries at the bottom of the list perform less well regarding economic activities and road safety. The absence of a high amount of infrastructure investment in these economies, except for China, is one of the reasons for their low performance. These countries have the lowest environmental and social performances in terms of global economies.
We discussed the obtained criteria weights from the proposed methodology with the decision-making team, and they confirmed that the methodology steps were correctly applied. In addition, we validated the results of ranking economies considering the nine scenarios employing another MCDM technique for the specified problem. The ranking of economies is the same for both methods.

4.4. Ranking Economies Based on Business Region and Income Level

This section divides economies more homogeneously into categories based on their business regions and income levels [55]. Table 6 provides the results for economies regarding their business regions. The first three columns represent Europe and Central Asia, East Asia and the Pacific are defined by the second three columns, the third three columns represent America, and finally, the Middle East and Africa are indicated by the last three columns, respectively. The economies with the highest sustainable transportation performance in their regions are Sweden, Australia, the United States, and the United Arab Emirates. Furthermore, Table 7 shows the results for economies in terms of their income levels. The countries with the highest sustainable transportation performance by income level are Sweden, Malaysia, and Egypt, Arab Rep., respectively.

5. Managerial Recommendations

European countries, especially Scandinavian countries, adopted the sustainability philosophy over two decades ago and set strategic and tactical steps and goals. To achieve sustainable goals, there are investments and support for these policies. For these reasons, European countries are the closest to achieving sustainable goals. In addition, these countries have slowly begun to receive investment returns. Therefore, sustainable development plays a significant role in meeting the needs of the present, including transportation. Moreover, efficient transportation systems contribute to economic, environmental, and social opportunities for global economies. On the other hand, a number of low-performing countries in Table 5 struggle with environmental concerns due to the exposure of air pollution to the population, total GHG emissions, and the lack of terrestrial and freshwater areas. It is also noted that high total GHG emissions can be measured because of the high population of countries such as China and India. Due to serious environmental concerns, sustainability should efficiently be implemented in transportation systems for the economic growth of global economies.
This study evaluates the sustainable and intelligent transportation processes of fifty global economies, examining nine criteria, such as economic, safety, hazards, energy, environmental impact and utilization, infrastructure, social, sustainability, and logistic performance when dealing with uncertainty. An integrated intuitionistic fuzzy-based AHP and VIKOR method was proposed for the assessment of sustainable and intelligent urban transportation systems. The novel integrated decision-making technique benefits from contemporary sustainability, safety, and hazards data to assess and benchmark sustainable and intelligent transportation processes for economies. New metrics, such as epidemics impacting transportation, are not dealt with by sustainable and intelligent urban transportation systems. Therefore, this study is the first research to comprehensively conduct and benchmark economic, environmental, safety, hazards, and sustainability-based metrics. The opinions of the decision-making team were considered when constructing PCMs under uncertainty. Based on intuitionistic fuzzy-based AHP results, economics, safety, and hazards are the three with the highest weights among the other six criteria. Also, sustainability has a vital weight where it provides 10.30% to the total weights of the evaluating criteria. Next, the VIKOR approach, which is the part of the proposed integrated decision-making technique, is applied to the fifty global economies located in Africa, America, Asia, Europe, and the Middle East. Hence, this research work comprehensively benchmarks the fifty global economies associated with their business regions and income levels. Sweden is the most suitable economy for the sustainable transportation system. It is followed by the United States, Denmark, the United Kingdom, and Switzerland.
Global economies may generate effective strategies in transportation systems by implementing economics, environmental impact and utilization, safety, hazard, and sustainability-based assessments when reducing operational costs and risks and minimizing adverse environmental impacts. In addition, the low-ranking economies in Table 5 could give priority to the implementation of strategies and policies to improve their transportation problems when considering sustainable philosophy, technological adaptations, economic factors, safety, and risk evaluations. So, the contribution of the economic growth is provided for each country. Also, global economies benefit from economics metrics when maximizing safety metrics and minimizing exposing hazards metrics, as shown in this paper. Finally, sustainable and intelligent transportation systems may take advantage of economics and sustainable benefits and reduce potential risks and negative impacts through involving environmental and operating abilities.

6. Conclusions

Developments in transportation systems provide an essential contribution to the development processes of global economies when considering holistic risk management and environmental protection-related concerns. In addition, the hazards and safety assessments are complicated problems for transportation systems. Hence, evaluating transportation systems is important to reduce risk and support sustainability. Further, developments of sustainable and intelligent urban transportation systems are prominent for economies, environmental protection, and societies. For this purpose, a decision-making method is needed to propose evaluating sustainable and intelligent transportation systems for global economies.
In this paper, an integrated intuitionistic fuzzy-based AHP and VIKOR technique is proposed to assess the sustainable and intelligent urban transportation systems of fifty global economies when dealing with uncertainty. The nine main criteria and the fifty-six sub-criteria are denoted for the fifty global economies. Economics has the highest weight, which is 0.127, among the eight main criteria from the results of the intuitionistic fuzzy-based AHP, which is a part of the integrated method. Investment (GFCF), domestic material consumption, and the growth rate of GDP are the top three weights for economics. Next, safety and hazards are other vital main criteria. In addition, sustainability provides 10.30% to the total weights of the main criteria. Hence, sustainability should not be ignored in order to benefit from economic growth. Moreover, the top five height global sub-criteria weights are found to be the total GHG emissions (C5.3), the good governance index (C9.1), air pollution (micrograms per cubic meter) (C5.1), earthquake (C3.1), and the logistic performance index (C9.3), respectively.
The VIKOR technique, which is part of the proposed methodology, is used in order to rank the fifty global economies. Also, different scenario analyses and benchmarking are conducted. Based on the results, Sweden is the most appropriate economy for a sustainable and intelligent transportation system. The United States and Denmark are in the second and third ranks, respectively. When benchmarking the business region, Sweden, Australia, the United States, and the United Arab Emirates are the most significant economies for sustainable and intelligent transportation systems. Sweden, Malaysia and Egypt, Arab Rep., are the top choices for sustainable and intelligent transportation systems associated with income levels.
The limitations of this study are summarized as follows: This study did not consider a couple of technologies, such as autonomous driving, vehicle–road collaboration, and 5G applications, because the urban mobility readiness index included these technologies. In this study, nine main criteria and fifty-six sub-criteria are considered. So, a number of indicators are not included in the criteria, such as the penetration rate of intelligent technology and the maturity of data sharing.
This research consists of nine main criteria and fifty-six sub-criteria to evaluate sustainable and intelligent transportation systems when ranking fifty global economies. An extension of this work could be conducted for future studies. First, additional main criteria could be included in one of the prospective studies in the context of sustainability. Also, a couple of indicators could be considered to evaluate the technology maturity model for the transportation process. Then, different fuzzy sets could be applied to specify the weights of the main criteria and sub-criteria and rank the economies. Lastly, the other decision-making techniques could be used to choose the most appropriate alternative.

Author Contributions

A.Ö. and M.E.; methodology, A.Ö. and M.E.; software, A.Ö., M.E., S.K. and T.I.; validation, A.Ö. and M.E.; investigation, A.Ö., M.E., S.K. and T.I.; writing—original draft preparation, A.Ö., M.E., S.K. and T.I.; writing—review and editing, A.Ö., M.E., S.K. and T.I.; visualization. All authors have read and agreed to the published version of the manuscript.

Funding

This study is partially financed by the European Union-NextGenerationEU, through the National Recovery and Resilience Plan of the Republic of Bulgaria, project № BG-RRP-2.013-0001-C01.

Institutional Review Board Statement

Not applicable.

Informed Consent Statement

Not applicable.

Data Availability Statement

Dataset available on request from the authors.

Conflicts of Interest

The authors declare no conflict of interest.

Appendix A

Please see Table A1 for pairwise comparison matrices.
Table A1. Pairwise comparison matrices for DM1, DM2, and DM3.
DM1C1C2C3C4C5C6C7C8C9
C1EELTMLLTMHLTEELTLLTMLLTMLLTHLTVHLT
C2 EELTHLTMHLTMLLTEELTHLTHLTHLT
C3 EELTMLTMLLTLLTEELTMLLTHLT
C4 EELTEELTEELTMLLTELLTLLT
C5 EELTMLLTLLTLLTMHLT
C6 EELTMLLTEELTMHLT
C7 EELTEELTHLT
C8 EELTEELT
C9 EELT
DM2C1C2C3C4C5C6C7C8C9
C1EELTMLLTMHLTAELTLLTLLTMLLTHLTVHLT
C2 EELTHLTHLTMLLTAELTHLTHLTHLT
C3 EELTMLLTMLLTLLTAELTMLLTAELT
C4 EELTAELTAELTAELTEELRLLT
C5 EELTMLLTLLTLLTAELT
C6 EELTMLLTAELTMHLT
C7 EELTAELTHLT
C8 EELTAELT
C9 EELT
DM3C1C2C3C4C5C6C7C8C9
C1EELTLLTMHLTAELTMLLTMLLTMLLTHLTVHLT
C2 EELTHLTHLTMLLTMHLTHLTMHLTHLT
C3 EELTAELTMLLTLLTHLTMLLTHLT
C4 EELTMHLTMHLTMLLTMHLTLLT
C5 EELTMLLTLLTLLTMHLT
C6 EELTMLLTMHLTMHLT
C7 EELTMHLTMHLT
C8 EELTMHLT
C9 EELT

References

  1. EEA. Transport and Mobility. 2023. Available online: https://www.eea.europa.eu/en/topics/in-depth/transport-and-mobility?activeAccordion=e53c3d45-3510-42da-bd18-cc72d0fb1a7b/ (accessed on 4 April 2024).
  2. EC. EDGAR-Emissions Database for Global Atmospheric Research. 2023. Available online: https://edgar.jrc.ec.europa.eu/ (accessed on 4 April 2024).
  3. Fleck, A. Cars Cause Biggest Share of Transportation CO2 Emissions. 2023. Available online: https://www.statista.com/chart/30890/estimated-share-of-co2-emissions-in-the-transportation-sector/ (accessed on 4 April 2024).
  4. EC. Transport and Mobility. 2023. Available online: https://transport.ec.europa.eu/news-events/news/green-deal-greening-freight-more-economic-gain-less-environmental-impact-2023-07-11_en/ (accessed on 10 April 2024).
  5. UN. Sustainable Transport. 2022. Available online: https://sdgs.un.org/topics/sustainable-transport (accessed on 7 April 2024).
  6. World Bank. Transport-Overview. 2023. Available online: https://www.worldbank.org/en/topic/transport/overview (accessed on 7 April 2024).
  7. Li, H.; Hao, Y.; Xie, C.; Han, Y.; Wang, Z.-R. Emerging technologies and policies for carbon–neutral transportation. Int. J. Transp. Sci. Technol. 2023, 12, 329–334. [Google Scholar]
  8. Arvis, J.-F.; Ojala, L.; Shepherd, B.; Ulybina, D.; Wiederer, C. Connecting to Compete 2023: Trade Logistics in an Uncertain Global Economy–The Logistics Performance Index and Its Indicators; The World Bank Group: Washington, DC, USA, 2023. [Google Scholar]
  9. Phadke, A.; Khandekar, A.; Abhyankar, N.; Wooley, D.; Rajagopal, D. Why Regional and Long-Haul Trucks Are Primed for Electrification Now; University of California: Berkeley, CA, USA, 2021. [Google Scholar]
  10. Gudmundsson, H. Sustainable Transport and Performance Indicators. Issues Environ. Sci. Technol. 2004, 20, 35–63. [Google Scholar]
  11. Bongardt, D.; Schmid, D.; Huizenga, T.; Litman, T. Sustainable Transport Evaluation–Developing Practical Tools for Evaluation in the Context of the CSD Process, Eschborn, Germany. 2011. Available online: https://www.un.org/esa/dsd/resources/res_pdfs/csd-19/Background%20Paper%2010%20-%20transport.pdf (accessed on 1 April 2024).
  12. Kolak, O.; Akin, D.; Birbil, I.; Feyzioglu, O.; Noyan, N. Multicriteria Sustainability Evaluation of Transport Networks for Selected European Countries. Lect. Notes Eng. Comput. Sci. 2011, 2190, 117–122. [Google Scholar]
  13. Haghshenas, H.; Vaziri, M. Urban sustainable transportation indicators for global comparison. Ecol. Indic. 2012, 15, 115–121. [Google Scholar]
  14. Rosolino, V.; Teresa, I.; Vittorio, A.; Carmine, F.D.; Antonio, T.; Daniele, R.; Claudio, Z. Road Safety Performance Assessment: A New Road Network Risk Index for Info Mobility. Procedia-Soc. Behav. Sci. 2014, 111, 624–633. [Google Scholar]
  15. Aarts, L.T.; Houwing, S. Benchmarking road safety performance by grouping local territories: A study in the Netherlands. Transp. Res. Part A Policy Pract. 2015, 74, 174–185. [Google Scholar]
  16. Aydin, N.; Celik, E.; Gumus, A.T. A hierarchical customer satisfaction framework for evaluating rail transit systems of Istanbul. Transp. Res. Part A Policy Pract. 2015, 77, 61–81. [Google Scholar] [CrossRef]
  17. Chen, F.; Wang, J.; Deng, Y. Road safety risk evaluation by means of improved entropy TOPSIS–RSR. Saf. Sci. 2015, 79, 39–54. [Google Scholar] [CrossRef]
  18. Hawas, Y.E.; Hassan, M.N.; Abulibdeh, A. A multi-criteria approach of assessing public transport accessibility at a strategic level. J. Transp. Geogr. 2016, 57, 19–34. [Google Scholar]
  19. Daraio, C.; Diana, M.; Di Costa, F.; Leporelli, C.; Matteucci, G.; Nastasi, A. Efficiency and effectiveness in the urban public transport sector: A critical review with directions for future research. Eur. J. Oper. Res. 2016, 248, 1–20. [Google Scholar]
  20. Barbosa, S.B.; Ferreira, M.G.G.; Nickel, E.M.; Cruz, J.A.; Forcellini, F.A.; Garcia, J.; Guerra, J.B.S.O.d.A. Multi-criteria analysis model to evaluate transport systems: An application in Florianópolis, Brazil. Transp. Res. Part A Policy Pract. 2017, 96, 1–13. [Google Scholar]
  21. Costa, P.B.; Neto, G.C.M.; Bertolde, A.I. Urban Mobility Indexes: A Brief Review of the Literature. Transp. Res. Procedia 2017, 25, 3645–3655. [Google Scholar]
  22. Luthra, S.; Mangla, S.K. Evaluating challenges to Industry 4.0 initiatives for supply chain sustainability in emerging economies. Process Saf. Environ. Prot. 2018, 117, 168–179. [Google Scholar] [CrossRef]
  23. Paul, A.; Moktadir, M.A.; Paul, S.K. An innovative decision-making framework for evaluating transportation service providers based on sustainable criteria. Int. J. Prod. Res. 2020, 58, 7334–7352. [Google Scholar]
  24. Chen, F.; Lyu, J.; Wang, T. Benchmarking road safety development across OECD countries: An empirical analysis for a decade. Accid. Anal. Prev. 2020, 147, 105752. [Google Scholar]
  25. Illahi, U.; Mir, M.S. An indicator-based integrated methodology for evaluating sustainability in transportation systems using multivariate statistics and fuzzy logic. J. Sci. Technol. Policy Manag. 2022, 13, 43–72. [Google Scholar]
  26. Liu, X.; Yuan, M. Assessing progress towards achieving the transport dimension of the SDGs in China. Sci. Total Environ. 2023, 858, 159752. [Google Scholar]
  27. Antunes, J.; Tan, Y.; Wanke, P.; Jabbour, C.J.C. Impact of R&D and innovation in Chinese road transportation sustainability performance: A novel trigonometric envelopment analysis for ideal solutions (TEA-IS). Socio-Econ. Plan. Sci. 2023, 87, 101544. [Google Scholar]
  28. Chatziioannou, I.; Nikitas, A.; Tzouras, P.G.; Bakogiannis, E.; Alvarez-Icaza, L.; Chias-Becerril, L.; Karolemeas, C.; Tsigdinos, S.; Wallgren, P.; Rexfelt, O. Ranking sustainable urban mobility indicators and their matching transport policies to support liveable city Futures: A MICMAC approach. Transp. Res. Interdiscip. Perspect. 2023, 18, 100788. [Google Scholar]
  29. Qian, Q.; Liu, C.; Ren, J.; Song, J.; He, C. A simulation-based techno-economic-safety-social-environmental decision-making framework for prioritizing plastic waste treatment processes. Process Saf. Environ. Prot. 2024, 191, 2469–2484. [Google Scholar]
  30. Starostka-Patyk, M.; Bajdor, P.; Białas, J. Green logistics performance Index as a benchmarking tool for EU countries environmental sustainability. Ecol. Indic. 2024, 158, 111396. [Google Scholar]
  31. Otay, İ.; Çevik Onar, S.; Öztayşi, B.; Kahraman, C. Evaluation of sustainable energy systems in smart cities using a Multi-Expert Pythagorean fuzzy BWM & TOPSIS methodology. Expert Syst. Appl. 2024, 250, 123874. [Google Scholar]
  32. Xu, Z.; Liao, H. Intuitionistic fuzzy analytic hierarchy process. IEEE Trans. Fuzzy Syst. 2013, 22, 749–761. [Google Scholar]
  33. Abdullah, L.; Jaafar, S.; Taib, I. Intuitionistic fuzzy analytic hierarchy process approach in ranking of human capital indicators. J. Appl. Sci. 2013, 13, 423–429. [Google Scholar]
  34. Dutta, B.; Guha, D. Preference programming approach for solving intuitionistic fuzzy AHP. Int. J. Comput. Intell. Syst. 2015, 8, 977–991. [Google Scholar]
  35. Tavana, M.; Zareinejad, M.; Di Caprio, D.; Kaviani, M.A. An integrated intuitionistic fuzzy AHP and SWOT method for outsourcing reverse logistics. Appl. Soft Comput. 2016, 40, 544–557. [Google Scholar]
  36. Kahraman, C.; Öztayşi, B.; Çevik Onar, S. An integrated intuitionistic fuzzy AHP and TOPSIS approach to evaluation of outsource manufacturers. J. Intell. Syst. 2018, 29, 283–297. [Google Scholar]
  37. Kahraman, C.; Öztayşi, B.; Çevik Onar, S.; Doğan, O. Intuitionistic fuzzy originated type-2 fuzzy AHP: An application to damless hydroelectric power plants. Int. J. Anal. Hierarchy Process 2018, 10, 266–292. [Google Scholar]
  38. Karasan, A.; Erdogan, M.; Ilbahar, E. Prioritization of production strategies of a manufacturing plant by using an integrated intuitionistic fuzzy AHP TOPSIS approach. J. Enterp. Inf. Manag. 2018, 31, 510–528. [Google Scholar]
  39. Hinduja, A.; Pandey, M. A distance-based method for computing priorities of intuitionistic fuzzy preference relation and its application in AHP. Vision 2019, 23, 329–340. [Google Scholar] [CrossRef]
  40. Chen, X.; Fang, Y.; Chai, J.; Xu, Z. Does intuitionistic fuzzy analytic hierarchy process work better than analytic hierarchy process? Int. J. Fuzzy Syst. 2022, 24, 909–924. [Google Scholar]
  41. Otay, İ.; Kahraman, C. A novel circular intuitionistic fuzzy AHP-VIKOR methodology: An application to a multi-expert supplier evaluation problem. Pamukkale Üniversitesi Mühendislik Bilim. Derg. 2022, 28, 194–207. [Google Scholar]
  42. Otay, İ.; Onar, S.Ç.; Öztayşi, B.; Kahraman, C. A novel interval valued circular intuitionistic fuzzy AHP methodology: Application in digital transformation project selection. Inf. Sci. 2023, 647, 119407. [Google Scholar]
  43. Erdem, M.; Özdemir, A. Sustainability and risk assessment of data center locations under a fuzzy environment. J. Clean. Prod. 2024, 450, 141982. [Google Scholar]
  44. Vemaps. Grey Map of the World. 2025. Available online: https://vemaps.com/world/wrld-16 (accessed on 15 January 2025).
  45. World Health Organization. Road Traffic Injuries. 2023. Available online: https://www.who.int/health-topics/road-safety#tab=tab_1/ (accessed on 7 April 2024).
  46. World Bank. Infrastructure. 2023. Available online: https://www.worldbank.org/en/topic/infrastructure/overview (accessed on 7 April 2024).
  47. UN-Habitat. Percentage Access to Public Transport. 2022. Available online: https://data.unhabitat.org/datasets/04c64cb5553843b8a644af6429b6633c_0/about/ (accessed on 7 April 2024).
  48. International Labour Organization. Statistics on Informal Economy. 2022. Available online: https://ilostat.ilo.org/topics/informality/ (accessed on 5 April 2024).
  49. Erdem, M.; Özdemir, A. Evaluation of cyber security risk pillars for a digital, innovative, and sustainable model utilizing a novel fuzzy hybrid optimization. Comput. Secur. 2025, 153, 104394. [Google Scholar]
  50. World Bank. Sustainable Mobility: Helping Countries Develop Concrete, Locally Relevant Solutions. 2020. Available online: https://www.worldbank.org/en/results/2020/11/11/the-global-roadmap-of-action-toward-sustainable-mobility (accessed on 4 April 2024).
  51. Block, S.; Emerson, J.W.; Esty, D.C.; de Sherbinin, A.; Wendling, Z.A. Environmental Performance Index 2022; Yale Center for Environmental Law & Policy: New Haven, CT, USA, 2022; Available online: https://epi.yale.edu/ (accessed on 5 April 2024).
  52. UN. Human Development Report 2023–2024. UNDP (United Nations Development Programme). Available online: http://report.hdr.undp.org (accessed on 4 April 2024).
  53. World Justice Project. Rule of Law Index. 2022. Available online: https://worldjusticeproject.org/rule-of-law-index/global/2022/ (accessed on 8 April 2024).
  54. Lee, C.M.; Erickson, P. How does local economic development in cities affect global GHG emissions? Sustain. Cities Soc. 2017, 35, 626–636. [Google Scholar]
  55. World Bank. The World by Income and Region. 2023. Available online: https://datatopics.worldbank.org/world-development-indicators/the-world-by-income-and-region.html (accessed on 4 April 2024).
Figure 1. Flowchart of the study.
Sustainability 17 02945 g001
Figure 2. Sustainable and intelligent transportation criteria [44].
Sustainability 17 02945 g002
Table 1. Brief literature review on sustainable transportation.
StudyEconomic(al)RiskSafetyEnergyEnvironmetalInfrastructureSocialSustainableMethodLocation
[12]+ + + TOPSIS, Choquet integralFifteen EU countries
[11]+ + + Sustainable Framework
[13]+ + + Global cities
[14] + Risk indexCrotone (Calabria, south Italy)
[15]+ ++ Cluster analysisMunicipals in Netherlands
[16]+ + + FAHP- fuzzy Choquet integralİstanbul rail network
[17] + +++ Entropy TOPSIS–RSRThirty-one provinces of China
[24]+ + ++ IV-VIKOR with FNBCThirty-six OECD countries
[18] ++ TOPSIS, K-meansAbu Dhabi
[21]+ ++ The Metropolitan Region of the Great Vitoria, Brazil
[20]+ ++ Evaluation indexFlorianópolis, Brazil
[22]+ ++ EFA, AHPManufacturing industry, India
[23]+ + + BWM, VIKORTransport service providers
[26] +RegressionChina
[27]+ ++ + DEA-TOPSISTwenty-nine provinces of China
[30] + Members of EU
[28]+ ++ MICMACMembers of EU
[29]+ +++ + BWM, vector-based rankingChemical processes
[25]+ + + PCA/FA-FLTwenty-seven states of India
[31]+ +++ BWM-TOPSISFive cities
This study++++++++Intuitionistic fuzzy-based AHP and VIKORFifty global economies
Table 2. Linguistic scale and its associated intuitionistic fuzzy set.
Linguistic ScaleMembership ValueNon-Membership Value
Absolutely low linguistic term (ALLT)[0.10, 0.25][0.65, 0.75]
Very low linguistic term (VLLT)[0.15, 0.30][0.60, 0.70]
Low linguistic term (LLT)[0.20, 0.35][0.55, 0.65]
Medium low linguistic term (MLLT)[0.25, 0.40][0.50, 0.60]
Approximately equal linguistic term (AELT)[0.45, 0.55][0.30, 0.45]
Medium high linguistic term (MHLT)[0.50, 0.60][0.25, 0.40]
High linguistic term (HLT)[0.55, 0.65][0.20, 0.35]
Very high linguistic term (VHLT)[0.60, 0.70][0.15, 0.30]
Absolutely high linguistic term (AHLT)[0.65, 0.75][0.10, 0.25]
Exactly equal linguistic term (EELT)[0.50, 0.50][0.50, 0.50]
Table 3. Description of criteria.
C1EconomicDescription
C1.1CO 2 emission relative to GDPIt measures CO2 produced from transport relative to GDP
C1.2Energy consumptionIt evaluates the energy consumption of transportation in relation to GDP
C1.3Growth rate of GDPIt measures the annual growth rate of real GDP per employed person
C1.4Domestic material consumptionIt measures the total quantity of materials that an economy utilizes directly
C1.5Investment (GFCF)It refers to the purchase of produced assets
C1.6Gross domestic product (GDP)It measures the added value created by the production of goods and services in the country during a particular period
C1.7Investment by sectorIt refers to sector-based investments in household, corporate, and general government
C1.8Investment by assetThere are six categories of assets: residences, other buildings and structures, transport equipment, cultivated biological resources, and intellectual property products
C2Safety
C2.1Deaths by road user category— 2 or 3 wheelerDeaths among 2 or 3 wheeler road users
C2.2Deaths by road user category—4 wheelerDeaths among 4 wheeler road users
C2.3Deaths by road user category—cyclistDeaths among cyclist road users
C2.4Deaths by road user category—othersDeaths among 2 or 3 wheeler road users
C2.5Deaths by road user category—pedestrianDeaths among 2 or 3 wheeler road users
C2.6Mortality caused by road traffic injuryRoad traffic injuries cause mortality
C2.7Road accidentsNumber of road accidents
C3Hazards
C3.1EarthquakeThe indicator measures absolute and relative exposure to earthquakes with Modified Mercalli Intensity in MMI categories VI and VIII
C3.2FloodThe indicator measures the absolute and relative exposure to floods in one year
C3.3TsunamisThe indicator measures the absolute and relative exposure to tsunamis in one year
C3.4EpidemicThe indicator determines the total population affected by epidemics per country every year
C3.5CycloneThe indicator evaluates the total and proportional exposure to tropical cyclones and storm surges
C4Energy
C4.1Renewable energy consumptionThe indicator measures the share of renewable energy in total final consumption
C4.2Renewable energy productionThe indicator measures the contribution of renewable energy sources to the total primary energy supply
C4.3Primary energy supplyThe indicator measures the amount of primary energy supply
C4.4Crude oil productionThe indicator measures the amount of crude oil production
C4.5Electricity generationThe indicator measures the amount of electricity produced from fossil fuels, nuclear power plants, hydroelectric power plants, geothermal systems, solar panels, etc.
C4.6Nuclear power plantsThe indicator measures the number of units in nuclear power plants in operation as of 2019
C5Environmetal impact & utilization
C5.1Air pollution (micrograms per cubic meter)It measures a population’s average exposure to concentrations of suspended particles with an aerodynamic diameter of less than 2.5 microns
C5.2Air pollution, population exposureIt measures the percentage of the population exposed to ambient PM2.5 concentrations that exceed the reference value established by the World Health Organization
C5.3Total GHG emissionsThe indicator measures total greenhouse gas emissions (carbon dioxide, methane, nitrous oxide and hydrofluorocarbons (HFCs), and sulfur hexafluoride)
C5.4Biodiversity covered by protected areasIt measures the proportion of essential areas for terrestrial and freshwater biodiversity covered by protected areas according to ecosystem type
C6Infrastructure
C6.1Air transport, freightIt measures cargo, express and diplomatic bags carried during each flight stage in metric tonnes multiplied by kilometers traveled
C6.2Air transport, passengers carriedIt measures passengers of air carriers registered in the country
C6.3Container port trafficIt measures the flow of containers from land to sea modes of transport and vice versa in units of a standard-size container twenty-foot equivalent
C6.4Quality of air transport infrastructureThe indicator measures the quality of air transport infrastructure on a scale of 1 to 7
C6.5Quality of port infrastructureThe indicator measures the quality of port infrastructure on a scale of 1 to 7
C6.6Quality of railroad infrastructureThe indicator measures the quality of railroad infrastructure on a scale of 1 to 7
C6.7Investment in transport with private participationThis indicator measures, in US dollars, commitments to infrastructure projects in the field of transportation that have reached financial closure and serve the public directly or indirectly
C8Sustainability
C8.1Sustainable MobilityThe indicator evaluates achieving the Sustainable Development Goals under the main headings of universal access, efficiency, safety, and green mobility
C8.2The Urban Mobility Readiness IndexThe indicator measures the maturity of a city’s innovation ecosystem in urban mobility This index includes technologies such as artificial intelligence
C8.3Sustainable cities mobility indexThe indicator measures cities according to the three pillars of sustainability: planet, people and profit
C8.4EPIThe indicator evaluates countries on climate change performance, environmental health, and ecosystem vitality
C8.5Human Development IndexThe indicator evaluates average achievement in key dimensions of human development, based on the criteria of living a long and healthy life, being knowledgeable, and having a reasonable standard of living
C9Logistic performance criterion
C9.1Good governance indexThe indicator measures countries’ economic growth, human capital creation, and social cohesion strength
C9.2Liner Shipping Connectivity IndexThe indicator measures how well countries are connected to global maritime networks
C9.3Logistics performance indexThe indicator measures the trade logistics performance of countries
Table 4. Weights for criteria and sub-criteria.
CriterionCalculated Weights for Each CriterionSub-CriterionCalculated Local WeightsCalculted Global Weights
C10.127
C1.1.0.0880.011
C1.2.0.0970.012
C1.3.0.1430.018
C1.4.0.1430.018
C1.5.0.1490.019
C1.6.0.1340.017
C1.7.0.1280.016
C1.8.0.1180.015
C20.125
C.2.1.0.1330.017
C.2.2.0.1200.015
C.2.3.0.1330.017
C.2.4.0.1330.017
C.2.5.0.1580.020
C.2.6.0.1570.020
C.2.7.0.1650.021
C30.116
C.3.1.0.2650.031
C.3.2.0.2050.024
C.3.3.0.1800.021
C.3.4.0.1780.021
C.3.5.0.1720.020
C40.110
C.4.1.0.2020.022
C.4.2.0.2030.022
C.4.3.0.1780.020
C.4.4.0.1530.017
C.4.5.0.1430.016
C.4.6.0.1220.013
C50.113
C.5.1.0.2760.031
C.5.2.0.2410.027
C.5.3.0.2950.034
C.5.4.0.1880.021
C60.107
C.6.1.0.1680.018
C.6.2.0.1770.019
C.6.3.0.1570.017
C.6.4.0.0970.010
C.6.5.0.1160.012
C.6.6.0.1210.013
C.6.7.0.1650.018
C70.106
C.7.1.0.0980.010
C.7.2.0.0880.009
C.7.3.0.1080.011
C.7.4.0.1000.011
C.7.5.0.1080.011
C.7.6.0.0880.009
C.7.7.0.0890.009
C.7.8.0.0860.009
C.7.9.0.0690.007
C.7.10.0.0780.008
C.7.11.0.0880.009
C80.103
C.8.1.0.2610.027
C.8.2.0.2200.023
C.8.3.0.1960.020
C.8.4.0.1870.019
C.8.5.0.1360.014
C90.093
C.9.1.0.3620.034
C.9.2.0.3120.029
C.9.3.0.3260.030
Table 5. Ranking economies considering the nine scenarios.
All CiteriaC1C2C3C4C5C6C7C8C9
Countries Qj Rank Qj Rank Qj Rank Qj Rank Qj Rank Qj Rank Qj Rank Qj Rank Qj Rank Qj Rank
Argentina0.774480.225270.365300.442240.949460.641260.903430.597320.551350.94349
Australia0.287130.294440.332260.349160.940450.40620.687130.46890.336230.51220
Austria0.245100.170170.242120.471280.42870.588200.755210.520200.252150.45216
Belgium0.283120.186190.348270.356170.757250.626240.736190.46780.249130.2265
Brazil0.466290.11870.591430.374200.845280.541150.832360.09110.643400.70443
Bulgaria0.707440.00110.433360.619380.625160.573350.914480.507170.398271.00050
Canada0.15870.126100.360290.451260.46390.40090.650100.489140.315210.42415
Chile0.695420.12480.390340.849480.925420.684300.852390.638360.574360.57731
China0.758470.307460.402350.677400.875311.000500.14410.676390.587380.2879
Colombia0.690410.350470.612440.796470.921390.628250.908440.629350.725440.78346
Croatia0.484300.12590.320220.641390.44680.595340.858400.534230.323220.69141
Czechia0.415220.167150.323230.29390.677210.673330.845370.471100.350240.54826
Denmark0.05930.09540.265150.00010.510110.506180.763230.512190.04220.39314
Egypt, Arab Rep.0.655400.08930.537410.615360.968490.812480.911460.858480.746460.51119
Estonia0.364210.188200.282170.333130.41150.00010.849380.511180.257160.65035
Finland0.264110.174180.370320.337150.35140.390100.728180.561270.05430.52023
France0.12760.215250.301200.377210.627170.522190.64990.594290.14480.2848
Germany0.21590.235310.260130.371190.601140.610210.56540.533220.11170.1493
Greece0.506330.140120.223100.749460.603150.645370.792310.538250.442300.68939
Iceland0.301140.140130.358280.441230.07610.40080.767250.490150.238120.68038
India0.802490.266400.330250.693410.911360.913490.713160.612330.789480.53224
Indonesia0.593380.228290.692460.717430.923400.668280.812350.473110.672410.66437
Ireland0.332180.133110.330240.18830.760260.38870.701140.483120.352250.56730
Israel0.431240.169160.21890.571340.882320.677390.802320.32830.304190.56429
Italy0.436250.238340.234110.571350.557120.647270.778280.625340.408280.61334
Japan0.488310.265390.262140.947490.895340.545130.56650.748430.173100.2567
Korea, Rep.0.493320.238330.370310.713420.904350.719440.63580.741420.306200.56127
Malaysia0.461270.259380.720470.444250.952480.627220.758220.826460.581370.2486
Mexico0.560370.07620.17570.618370.927430.648320.782290.595300.675420.69140
Netherlands0.305160.193220.589420.482290.741240.677310.654110.487130.09750.1042
New Zealand0.337200.232300.441370.512300.889330.38360.755200.46670.288170.54625
Nigeria0.703430.247360.642450.520330.766270.780460.996500.880490.917500.73944
Norway0.305170.153140.382330.320110.22620.397120.790300.538240.14590.58232
Philippines0.756450.255370.806480.963500.915370.649290.909450.828470.786470.76745
Poland0.455260.193230.314210.26970.699220.693360.867410.39960.423290.50018
Portugal0.19980.10050.295190.28580.494100.40550.766240.642370.374260.51421
Russian Federation0.595390.277420.12540.470270.733230.657230.803330.597310.491320.85447
Saudi Arabia0.549360.279430.961500.309100.846290.804470.771270.580280.881490.47517
Singapore0.332190.209240.512380.18820.989500.695410.63570.719410.226110.0001
South Africa0.518340.357480.285180.24960.923410.714420.809340.645380.725450.51822
Spain0.304150.246350.06520.357180.587130.43630.660120.545260.250140.59033
Sweden0.02310.192210.01810.334140.32930.409140.769260.500160.00010.36513
Switzerland0.10850.236320.16960.397220.641190.478110.720170.522210.07540.34312
Tunisia0.758460.296450.527400.514310.950470.686400.941490.905500.548340.86148
Turkiye0.523350.11360.07830.727440.640180.717430.708150.24320.605390.65436
United Arab Emirates0.421230.273410.280160.326120.920380.755450.56530.690400.467310.30610
United Kingdom0.09040.228280.13450.22750.675200.525160.57560.33040.09960.1754
United States0.04320.219260.21380.516320.41360.45840.16620.34150.296180.32911
Uruguay0.463280.366490.525390.22140.863300.451170.914470.780440.522330.56428
Vietnam1.000501.000500.907490.729450.938440.636380.893420.806450.692430.69942
Table 6. Top six scorers considering business region.
Europe & Central AsiaQjRankEast Asia & PacificQjRankAmericaQjRankMiddle East & AfricaQjRank
Sweden0.0231Australia0.2871United States0.0431United Arab Emirates0.4211
Denmark0.0592Singapore0.3322Canada0.1581Israel0.4312
United Kingdom0.0903New Zealand0.3373Uruguay0.4633South Africa0.5183
Switzerland0.1084Malaysia0.4614Brazil0.4664Saudi Arabia0.5494
France0.1275Japan0.4885Mexico0.5605Egypt, Arab Rep.0.6555
Portugal0.1996Korea, Rep.0.4936Colombia0.6906Nigeria0.7036
Table 7. Top six scorers considering income level.
High IncomeQjRankUpper Middle IncomeQjRankLower Middle IncomeQjRank
Sweden0.0231Malaysia0.4611Egypt. Arab Rep.0.6551
United States0.0432Brazil0.4662Nigeria0.7032
Denmark0.0593South Africa0.5183Philippines0.7563
United Kingdom0.0904Türkiye0.5234Tunisia0.7584
Switzerland0.1085Mexico0.5605India0.8025
France0.1276Indonesia0.5936Vietnam1.0006
Disclaimer/Publisher’s Note: The statements, opinions and data contained in all publications are solely those of the individual author(s) and contributor(s) and not of MDPI and/or the editor(s). MDPI and/or the editor(s) disclaim responsibility for any injury to people or property resulting from any ideas, methods, instructions or products referred to in the content.

