Article

Investigating the Impact of Salinity on Soil Organic Matter Dynamics Using Molecular Biomarkers and Principal Component Analysis

1
Laboratory “PRAVDURN” (UKHM), Faculty of Nature and Life Sciences, (Algeria) Agricultural Production and Sustainable Valorization of Natural Resources, Hassiba Benbouali University of Chlef, Chlef 02180, Algeria
2
Laboratory Management and Valorization of Agriculture and Aquatic Ecosystems (LMVAAE), University Center of Tipaza, Tipaza 42000, Algeria
3
College of Engineering and Technology, American University of the Middle East, Egaila 54200, Kuwait
4
Institut de Chimie des Milieux et Matériaux de Poitiers IC2MP, Université de Poitiers, UMR CNRS 7285, Equipe Eaux, Biomarqueurs, Contaminants Organiques, Milieux, B27, 4 rue Michel Brunet, CEDEX 9, 86073 Poitiers, France
*
Authors to whom correspondence should be addressed.
Sustainability 2025, 17(7), 2940; https://doi.org/10.3390/su17072940
Submission received: 27 February 2025 / Revised: 23 March 2025 / Accepted: 24 March 2025 / Published: 26 March 2025

Abstract

:
Soil salinity is a growing threat to agricultural sustainability, particularly in arid and semi-arid regions. Understanding how salinity affects soil organic matter (OM) is critical for improving land management and maintaining soil health. This study addresses these challenges by exploring the molecular-level impact of salinity on OM dynamics. Salinity exerts a depth-dependent influence on lignin and microbial lipid biomarkers, which are used to trace plant inputs and microbial activity, respectively. For lignin biomarkers, in the surface layer (0–20 cm), higher salinity levels are associated with increased Syringyl/Vanillyl (S/V) and Cinnamyl/Vanillyl (C/V) ratios, suggesting enhanced preservation of syringyl (S) and cinnamyl (C) units. In the middle layer (−20 to −60 cm), higher salinity correlates with elevated SVC (total lignin phenols), Acid/aldehyde (Ad/Al) ratios, and other markers of selective lignin degradation. For lipid biomarkers, salinity modulates microbial adaptation and turnover, as seen in variations in i17 (iso-C17), a17 (anteiso-C17), and unsaturation indices such as C16:1/C16, reflecting Gram-positive and Gram-negative bacterial activity. These trends indicate that salinity stress alters microbial lipid profiles, leading to reduced turnover and enhanced preservation in deeper, more anoxic environments. Principal Component Analysis (PCA) revealed depth- and salinity-driven patterns that distinguish between surface microbial transformations and deep-layer molecular preservation. Correlation analysis of Principal Components (PCs) with salinity revealed that higher salinity favored molecular stability in deeper layers, while lower salinity was associated with microbial transformations in surface layers. These findings underscore salinity’s critical role in OM stabilization and turnover, and provide a molecular framework to guide sustainable management of saline soils.

1. Introduction

Agricultural practices rely heavily on soil quality and fertility to ensure sustainable food production. Soils provide essential functions, such as nutrient cycling, water retention, and support for plant growth, making them a cornerstone of agricultural systems. However, the productivity of agricultural soils is under constant threat from various stressors, including salinization, loss of organic matter (OM), and unsustainable land management practices. OM is a key component of soil health, as it improves soil structure, enhances microbial activity, and provides a reservoir of nutrients that sustain long-term fertility. Therefore, the preservation and management of soil OM are fundamental to achieving sustainable agriculture, as OM directly supports the ecological functions that underpin resilient and productive agricultural systems. Understanding the dynamics of OM is essential for improving agricultural soil management and addressing the challenges of modern agriculture [1,2].
Molecular biomarkers, including lignin and lipids, provide critical insights into the processes governing OM turnover and stabilization in soils. Lignin serves as an indicator of plant-derived organic inputs and their oxidative degradation, while lipids reflect microbial activity and biochemical transformations. These molecular families are particularly relevant in this study, as they highlight the complex interactions between plant inputs, microbial activity, and environmental factors shaping soil organic matter dynamics [2,3,4,5].
Salinity poses a major challenge to agricultural soils, particularly in regions where irrigation practices contribute to salt accumulation. High salinity reduces soil fertility by limiting water availability, disrupting microbial activity, and degrading soil structure. Saline soils often experience reduced crop yields and increased vulnerability to degradation. OM plays a central role in buffering the negative effects of salinity by enhancing soil structure, supporting microbial resilience, and improving water and nutrient retention. However, salinity in turn influences OM turnover and stabilization, often leading to reduced microbial decomposition and selective preservation of certain molecular components. As a result, salinity directly affects OM dynamics and, consequently, soil quality and long-term productivity [4,6]. Understanding the influence of salinity on OM and molecular biomarkers is critical for developing strategies to manage saline soils, improve soil health, and ensure sustainable agricultural productivity [4,6].
In Algerian agricultural soils, salinity is a major cause of soil degradation, and is particularly evident in arid and semi-arid regions where water scarcity complicates water supply efforts. In such areas, not only must water be sourced to mitigate salinity, but significant capital investment is also required, making the process challenging. According to the Boulaine map [7], soils affected by salinity originally covered 13,500 ha, accounting for 34% of the study area’s surface [8]. However, more recent assessments indicate that areas affected by salinity have expanded to approximately 80% [9]. The most concerning aspect of this salinization process is its insidious nature, as it progresses rapidly in both space and time, with dynamics that are difficult to monitor and control.
Principal Component Analysis (PCA) is a powerful tool for analyzing complex datasets in environmental and agricultural sciences [10]. It allows identifying dominant factors that influence biomarker variability, reduce dataset complexity, and extract meaningful patterns from multivariate data. PCA has been widely used in geochemical and soil science studies to explore relationships between soil properties, OM components, and environmental stressors, making it a suitable method for deciphering multiple trends, based on similarities and discrepancies in the dataset [10,11].
The objective of this study is to investigate the relationships between salinity, molecular biomarkers (lignin and lipids), and soil OM dynamics across different depths and time periods. By applying PCA to these datasets, this study aims to identify the dominant drivers of biomarker variability, elucidate the processes governing decomposition and stabilization, and provide actionable insights for managing saline soils and promoting sustainable agricultural practices. These practices are essential to mitigate these challenges and align with global efforts to achieve the United Nations Sustainable Development Goals (SDGs). Goals such as SDG 2 (Zero Hunger), SDG 13 (Climate Action), and SDG 15 (Life on Land) emphasize the need for sustainable food systems, improved soil management, and climate change mitigation [3]. This study contributes to these goals by investigating how salinity influences soil organic matter (OM) dynamics—a critical component of soil fertility and resilience. Understanding the molecular processes behind OM stabilization in saline environments provides actionable knowledge for managing degraded soils and sustaining agricultural productivity in vulnerable regions [2,4].

2. Materials and Methods

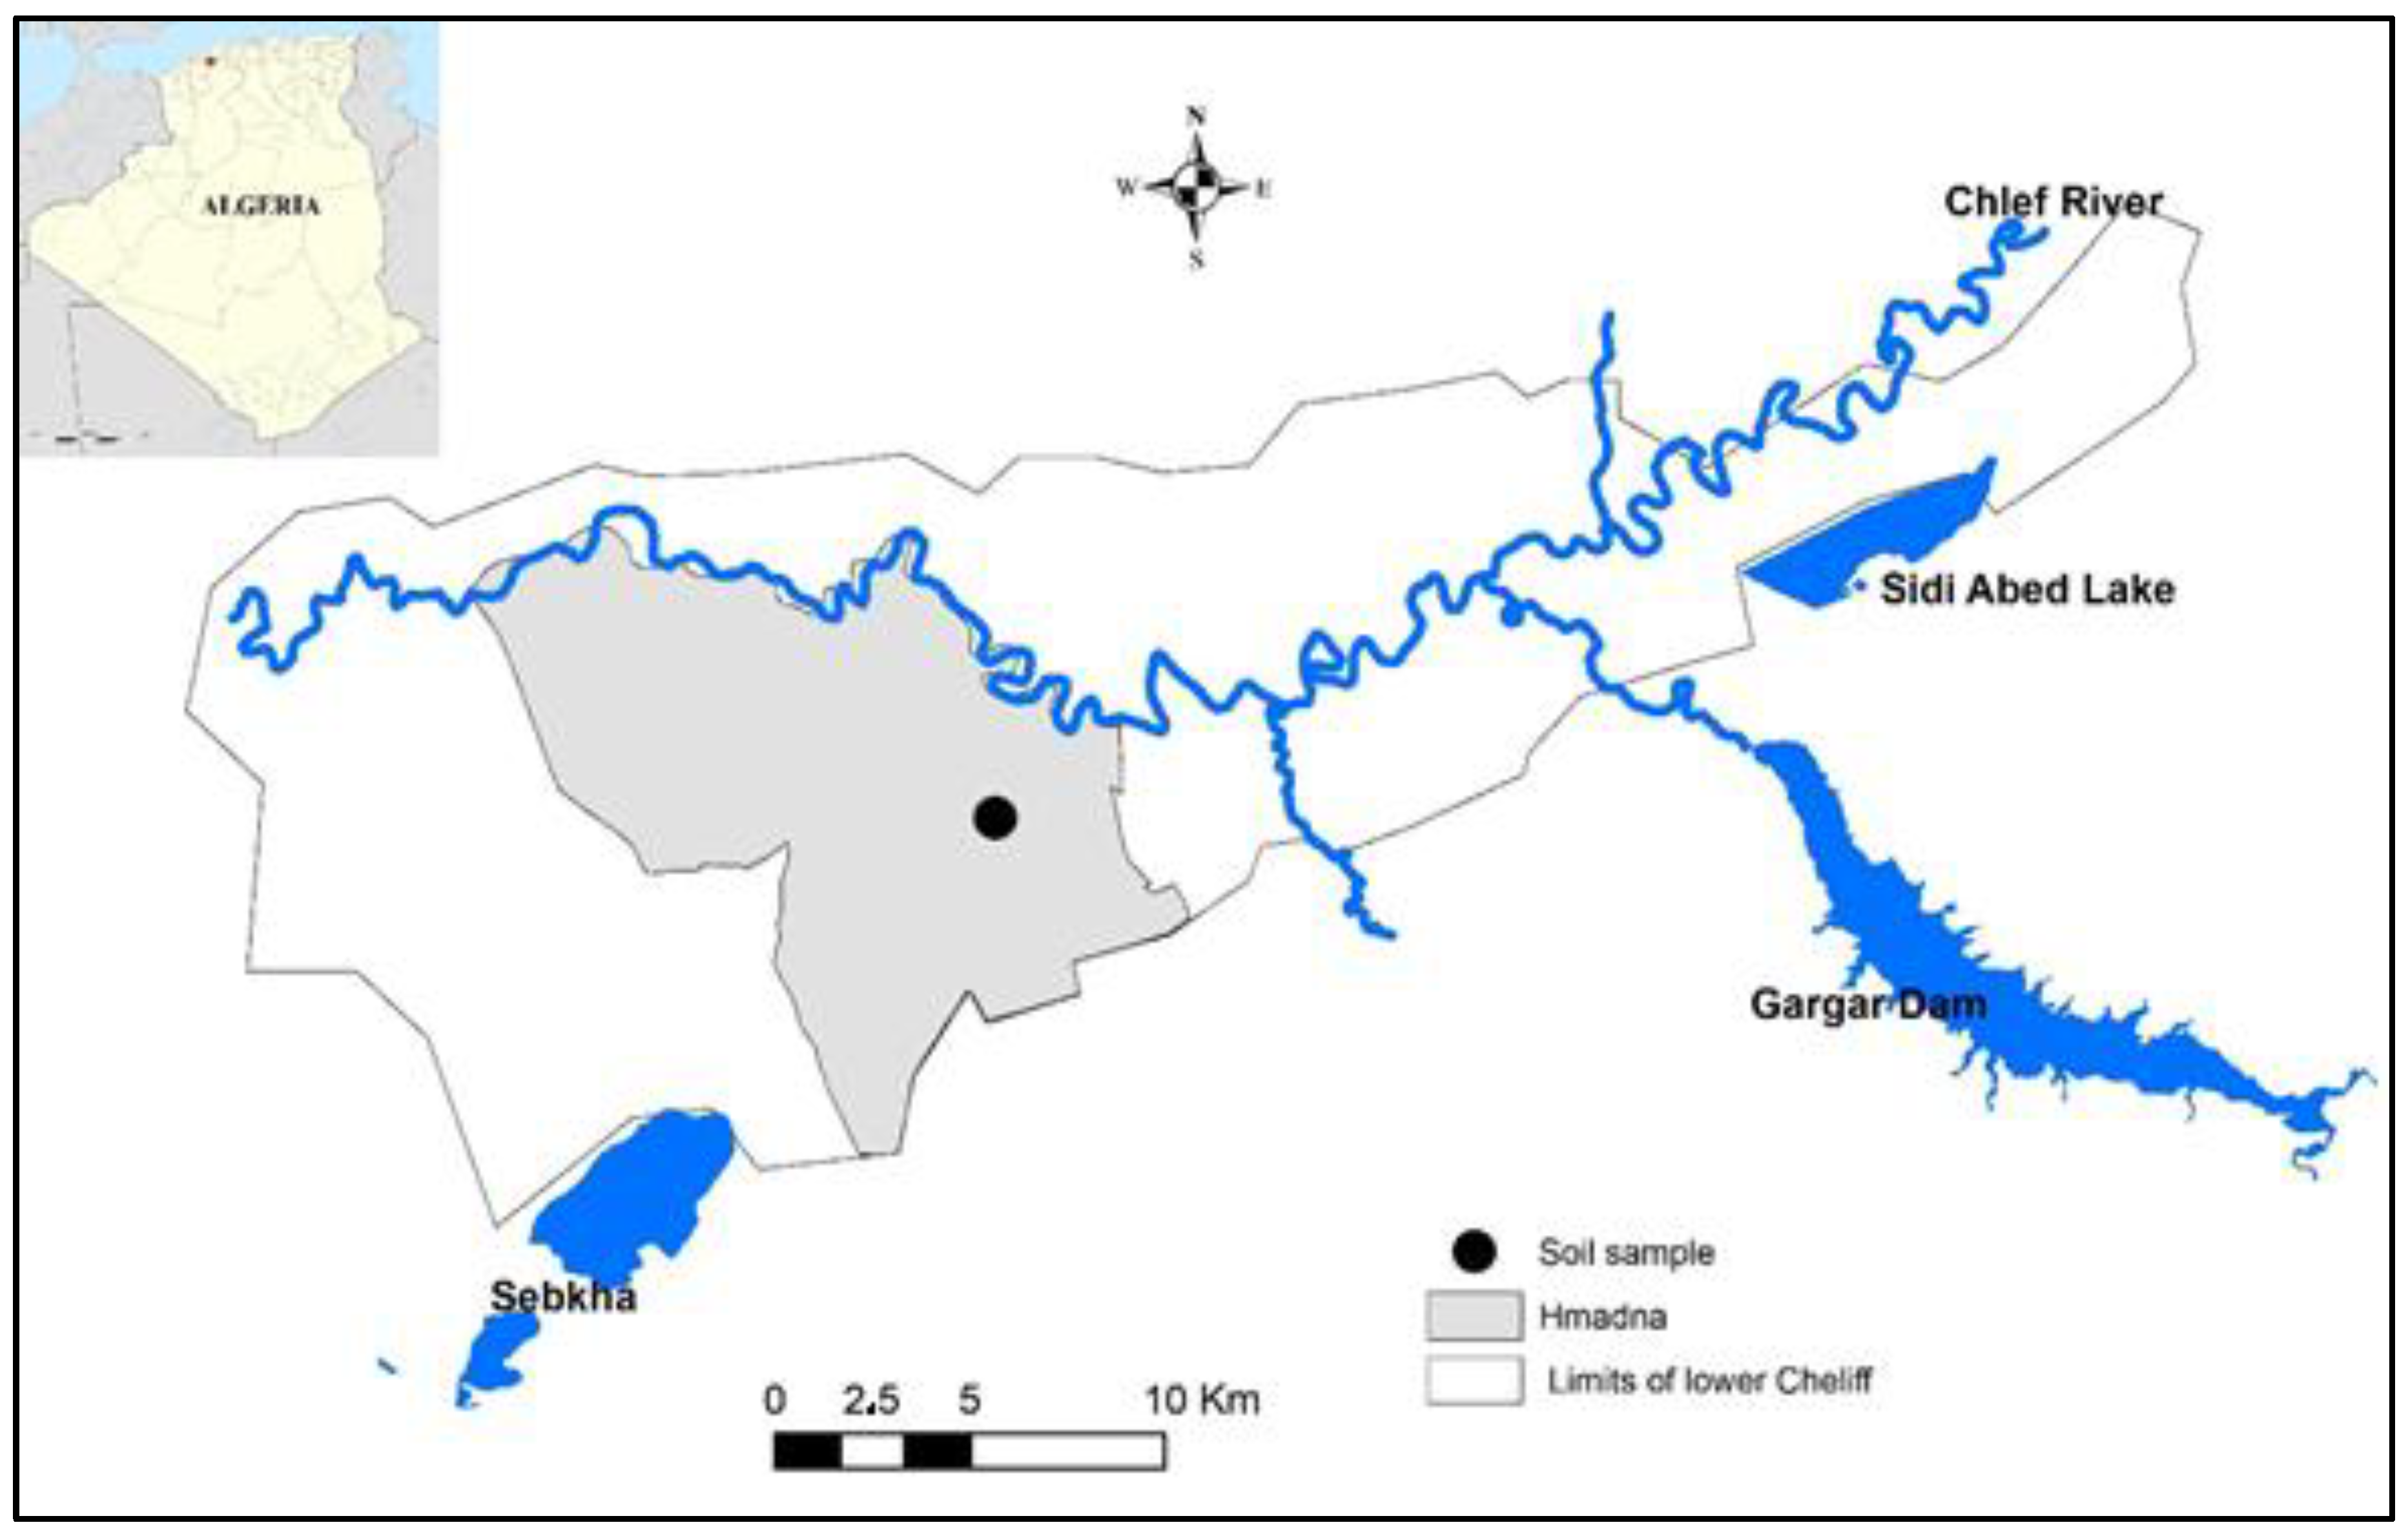
2.1. Site Description

El Hamadna, situated in northwestern Algeria, experiences a semi-arid Mediterranean climate characterized by hot, dry summers and mild, wet winters (Figure 1). Rainfall is concentrated between October and April, which supports the cultivation of water-efficient crops such as cereals and crops adaptable to cooler conditions like artichokes. The clay soil at the site provides adequate moisture retention, which is particularly beneficial for these crops during the dry summer months (Table 1).
The studied site in El Hamadna is located at geographical coordinates X: 296,645 and Y: 3,979,661, covering a surface area of 2 hectares. Agricultural activities at this site included the cultivation of artichokes and cereals, spanning the period from 2009 to 2012. The soil is characterized as clay, and the overall salinity, measured in terms of electrical conductivity (CE), was recorded at 4.17 dS/m. These details highlight the agricultural practices, soil type, and salinity conditions of the site (Table 1).
The recorded salinity level suggests that the soil is moderately saline, which is manageable for both artichokes and cereals, known for their relative tolerance to such conditions [12]. However, careful irrigation and salinity management remain crucial to sustain productivity and prevent future salinization. The smaller surface area of 2 hectares highlights the importance of efficient land use practices (Table 1), such as crop rotation and integrated soil fertility management, to maximize yields. This study emphasizes the need for aligning agricultural practices with the specific climatic and soil conditions of El Hamadna to ensure sustainable agricultural productivity and land preservation.

2.2. Sampling Strategy

Soil sampling was carried out biannually in May and November from 2009 to 2012, totaling eight sampling events. These specific months were chosen to capture seasonal contrasts in soil moisture, microbial activity, and salinity conditions, with May representing the late spring period following winter precipitation, and November representing the post-harvest dry season. This schedule allowed to assess both seasonal and interannual trends in OM and salinity dynamics.
The sampling strategy for this study involved collecting soil samples from three distinct depth levels: 0 to −20 cm, −20 to −60 cm, and −60 to −100 cm. This stratification aimed at capturing the vertical variability in soil OM dynamics and molecular biomarker distributions, influenced by depth and environmental conditions. After collection, the samples underwent freeze-drying using lyophilization to preserve their chemical and structural integrity. Following lyophilization, the samples were finely ground to ensure homogeneity and facilitate accurate molecular and salinity analyses. This systematic approach ensured that the dataset accurately represented the depth-specific processes influencing OM turnover and stabilization.
The selection of these depth intervals was guided agronomic practices in El Hamadna, which emphasize the significance of these soil layers in terms of organic input, microbial activity, and salinity profiles. The 0–20 cm layer represents the plow zone, directly influenced by cultivation and fresh organic inputs. The −20 to −60 cm interval captures transitional processes including root activity and nutrient dynamics, while the −60 to −100 cm layer reflects deeper subsoil processes characterized by reduced microbial reworking and enhanced organic matter preservation under higher salinity and lower oxygen conditions. This stratification also aligns with known salinity gradients in semi-arid clay soils, where salt tends to accumulate due to limited leaching and capillary rise.

2.3. Salinity

Soil salinity was assessed using the 1/5 diluted extract method, a widely used approach for measuring electrical conductivity in soil solutions. This method involves mixing one part of air-dried, sieved soil with five parts of deionized water (1:5 ratio) and allowing the suspension to equilibrate [13]. The mixture is then thoroughly stirred and left to settle to ensure proper dissolution of soluble salts. After equilibration, the electrical conductivity (EC) of the supernatant was measured using a WTW Cond 3210 Portable Conductivity Meter (WTW GmbH, Weilheim, Germany), a high-precision device designed for field and laboratory applications [14]. The results, expressed in decisiemens per meter (dS/m), provide an indication of the soil’s salinity level, which is a critical factor influencing soil structure, nutrient availability, and microbial activity [13,14]. This method was applied consistently across all samples to enable reliable comparisons of salinity variations across different depths and time periods.

2.4. Molecular Analysis

For lignin analysis, the 11 phenolic sub-units analyzed in this study (Figure 2) were extracted using alkaline oxidation with cupric oxide (CuO) method developed by Ertel and Hedges [15]). In brief, 1 g of CuO was combined with 100 mg of dried soil samples and 7 mL of 1 M NaOH. The reaction was conducted in a sealed reactor (Parr Instruments, Moline, IL, USA) at 170 °C for 2 h. The resulting product underwent purification steps including filtration, acidification, and extraction with organic solvents. The final mixture was silylated before being analyzed using gas chromatography coupled with mass spectrometry (GC-MS). For more details, check Younes et al. [10].
The total lipid extract (TLE) from each dried soil sample was obtained following the Bligh and Dyer method [16]. Briefly, 500 mg of soil samples from the three different depths were shaken for 1 h in a mixture of CHCl3:MeOH:phosphate buffer (1:2:0.8). Equal volumes of CHCl3 and phosphate buffer were then added, and the mixture was left overnight to allow phase separation. The lipid fraction was extracted from the CHCl3 phase, and the solvent was subsequently removed. The non-hydrocarbon fraction was derivatized by heating at 70 °C for 15 min with BSTFA and TMCS (99:1) prior to GC-MS analysis.

2.5. Gas Chromatography Coupled with Mass Spectrometry (GC-MS)

GC-MS analysis was performed to identify various compounds using a Trace GC instrument (Thermo Finnigan, Somerset, NJ, USA) coupled with a mass spectrometer (Thermo Finnigan Automass, Temecula, CA, USA). The injector (Thermo Finnigan PTV, Somerset, NJ, USA) was set to operate at 250 °C, and a fused silica column (Supelco Equity 5%, 30 m × 0.25 mm i.d., 0.25 µm film thickness) was used with helium as the carrier gas at a flow rate of 1 mL/min. The oven temperature was programmed to increase from 60 to 300 °C at a rate of 5 °C/min and was held at 300 °C for 15 min. The mass spectrometer operated in electron ionization mode at 70 eV, with ion separation achieved through a quadrupole mass filter. Analyses were conducted in full-scan mode (m/z 50–650, 2 scans/s). Compound identification was based on GC retention times, mass spectral comparisons with standards, and corroboration with the relevant literature.

2.6. Molecular Biomarker Ratios

Several molecular biomarker ratios were utilized to assess the dynamics of soil OM and its interactions with environmental factors. These ratios serve as indicators of degradation, preservation, and microbial activity within the soil profile. The lignin phenolic moieties’ symbols and structures are given in Figure 2. The SVC lignin parameter, representing the sum of syringyl (S), vanillyl (V), and cinnamyl (C) phenols, is a key indicator used to quantify lignin-derived OM in soils [1,2,10]. Higher SVC values often reflect fresh OM inputs, while lower values suggest advanced decomposition or selective preservation [1,2]. As such, SVC is a critical parameter for understanding the role of lignin in carbon cycling and the dynamics of soil OM under varying environmental and management conditions [2].
Acid/Aldehyde (Ad/Al) ratio indicates advanced lignin oxidation and degradation. This ratio is relevant for evaluating the extent of lignin decomposition, as an increase in the ratio reflects oxidative degradation of lignin, which is often linked to microbial activity and environmental conditions such as oxygen availability. It is widely used to assess the degradation state of lignin in soils and sediments, providing insights into carbon cycling and OM stability [2]. Syringyl/Vanillyl (S/V) ratio serves as an indicator of lignin source, with higher ratios typically associated with angiosperm-derived lignin and lower ratios with gymnosperm-derived lignin. It is crucial for tracing the origin of plant-derived organic matter in soils and sediments. This ratio helps to differentiate between woody and non-woody plant inputs, which is valuable for understanding vegetation dynamics and land-use changes over time [2,17]. p-Hydroxyphenyl/Syringyl (H/S) ratio reflects the selective degradation of S-units compared to H-units. It is relevant for understanding the differential degradation of lignin components, which can provide insights into microbial processing and environmental conditions [18].
The iso- and anteiso-branched Fatty Acids (FAs) to linear C15 ratio (i15+a15/C15) serves as a marker for bacterial activity. It is particularly relevant in identifying contributions from specific bacterial communities to soil OM, enabling the study of microbial processes and their role in organic matter turnover [19]. The CPI provides insights into the origin and preservation of lipids in soils. It is widely used to trace the sources of organic matter and assess the degree of degradation, as high CPI values typically indicate well-preserved OM, while lower values suggest advanced degradation [19]. These molecular ratios were integral to understanding the processes governing soil OM decomposition, microbial activity, and preservation across varying depths and environmental conditions.

2.7. Data Analysis Method

The adopted statistical technique is PCA, which is widely applied to simplify high-dimensional datasets by transforming correlated features into linearly uncorrelated variables, known as principal components (PCs). While this dimensionality reduction can lead to a trade-off between simplicity and accuracy due to the potential loss of detail, its primary objective is to retain as much information as possible from the original dataset. PCA achieves this by applying an orthogonal transformation to generate a smaller set of uncorrelated variables (PCs) that statistically redefine the original, potentially correlated features.
The principal components represent the directions of maximum variance in the data, capturing the most significant variations while minimizing information loss. They are ordered sequentially by the amount of variance they explain, with the first PC accounting for the largest possible variance, followed by the second PC, which captures the next highest variance, and so on. For this study, PCA was performed using XLSTAT 2024.03 software (Addinsoft, Paris, France), adhering to the methodology described in prior studies [10].
Prior to PCA computation, the dataset was normalized using XLSTAT’s built-in z-score standardization function, which transforms each variable to have a mean of 0 and a standard deviation of 1. This step ensures that all molecular biomarkers contribute equally, regardless of their original measurement scales, and satisfies PCA’s assumptions regarding data scale and comparability. PCA was selected due to its robustness in identifying dominant axes of variation while retaining interpretability through loadings and explained variance. While exploratory multivariate tools such as Hierarchical Cluster Analysis (HCA) and Non-Metric Multidimensional Scaling (NMDS) were also considered, they offered limited capacity to quantify variable contributions and were less suited to capture continuous gradients like those observed with salinity. PCA provided the clearest insight into the relationship between salinity, depth, and molecular biomarker variability, justifying its central role in this study.
This study focused on uncovering multivariate trends and structural patterns in the dataset using PCA rather than testing individual pairwise correlations. Given the dataset design (one composited sample per depth and time point), traditional statistical significance testing (e.g., t-tests or ANOVA) was not applicable due to limited degrees of freedom and absence of replication. Instead, PCA loadings and variance contributions were used to prioritize key biomarker ratios, while visual correlation plots and component scores were used to interpret their relationships with salinity and depth. This approach is standard in environmental datasets with constrained sampling but complex variable interdependencies.

3. Results and Discussion

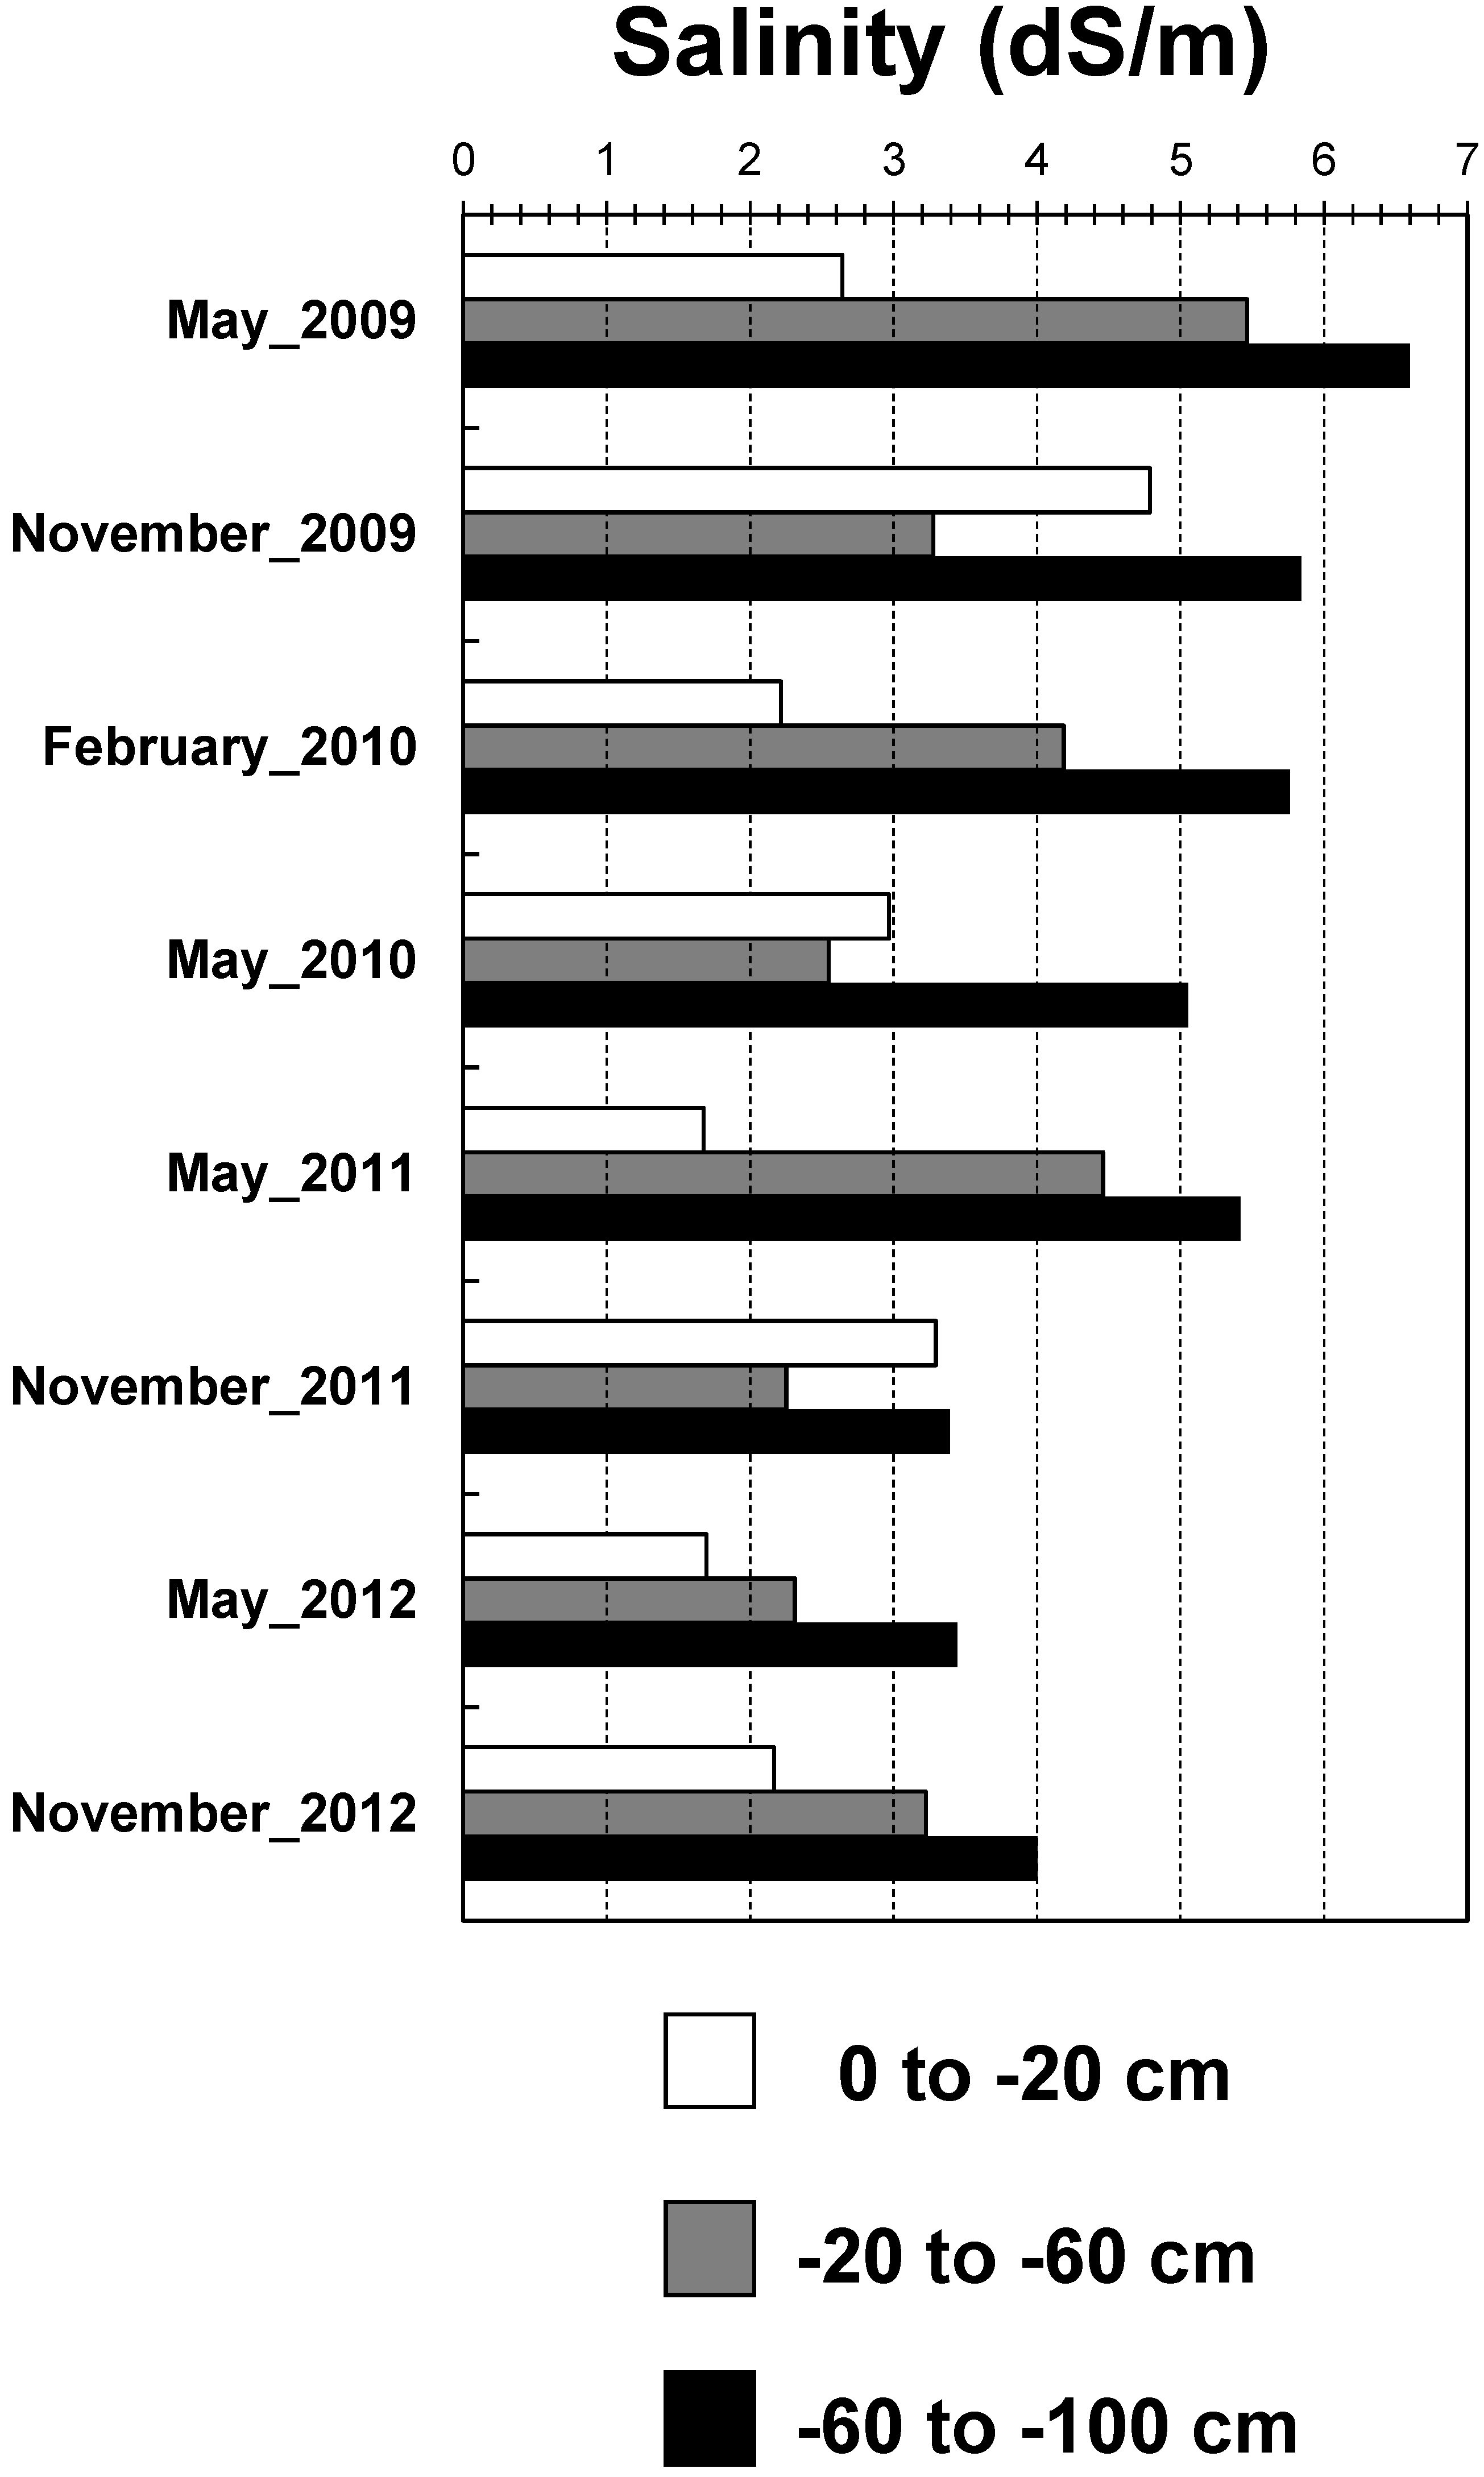
3.1. Temporal and Depth-Dependent Variations in Soil Salinity

The salinity levels at the studied site exhibit notable variation across three depths (0 to −20 cm, −20 to −60 cm, and −60 to −100 cm) and over time from May 2009 to November 2012 (Figure 3). At the shallowest depth (0 to −20 cm), salinity fluctuates significantly, starting at 2.64 dS/m in May 2009, peaking at 4.78 dS/m in November 2009, and dropping to a low level of 1.67 dS/m in May 2011. By November 2012, salinity stabilizes around 2.16 dS/m.
At the intermediate depth (−20 to −60 cm), salinity levels begin higher than surface depth, at 5.46 dS/m in May 2009, decreasing to 3.27 dS/m by November 2009, and showing continued fluctuations throughout the study period (Figure 3). For instance, salinity peaks at 4.45 dS/m in May 2011 but declines to 2.25 dS/m by November 2011. By November 2012, salinity at this depth rises slightly to 3.22 dS/m, highlighting the effects of salt redistribution through capillary action, seasonal rainfall, and variations in irrigation efficiency [6,20].
At the deepest layer (−60 to −100 cm), salinity levels are consistently higher than the upper layers, starting at 6.59 dS/m in May 2009 and gradually decreasing to 3.38 dS/m in November 2011. This depth exhibits less fluctuation, with salinity stabilizing between 3.38 and 4.00 dS/m by the end of the study period (Figure 3). These trends suggest limited leaching efficiency at greater depths due to the clay-rich soils, which act as reservoirs for salts accumulating over time [4,21].
The variability in salinity levels across depths and time highlights the significant influence of external factors, including rainfall, evaporation, and irrigation practices, on salinity distribution. Clay-rich soils, such as those in the study area, tend to have lower permeability, limiting the downward leaching of salts [22]. This aligns with observations in semi-arid regions, where capillary rise during dry seasons intensify surface salinity, while seasonal rainfalls facilitate partial leaching [6,23]. These findings emphasize the need for soil and water management strategies, such as using salt-tolerant crops, improving irrigation techniques, and implementing seasonal leaching practices [24]. Sustainable approaches are crucial to mitigate salinity’s adverse impacts on agricultural productivity and ensure effective land use while preserving soil health [6,21].

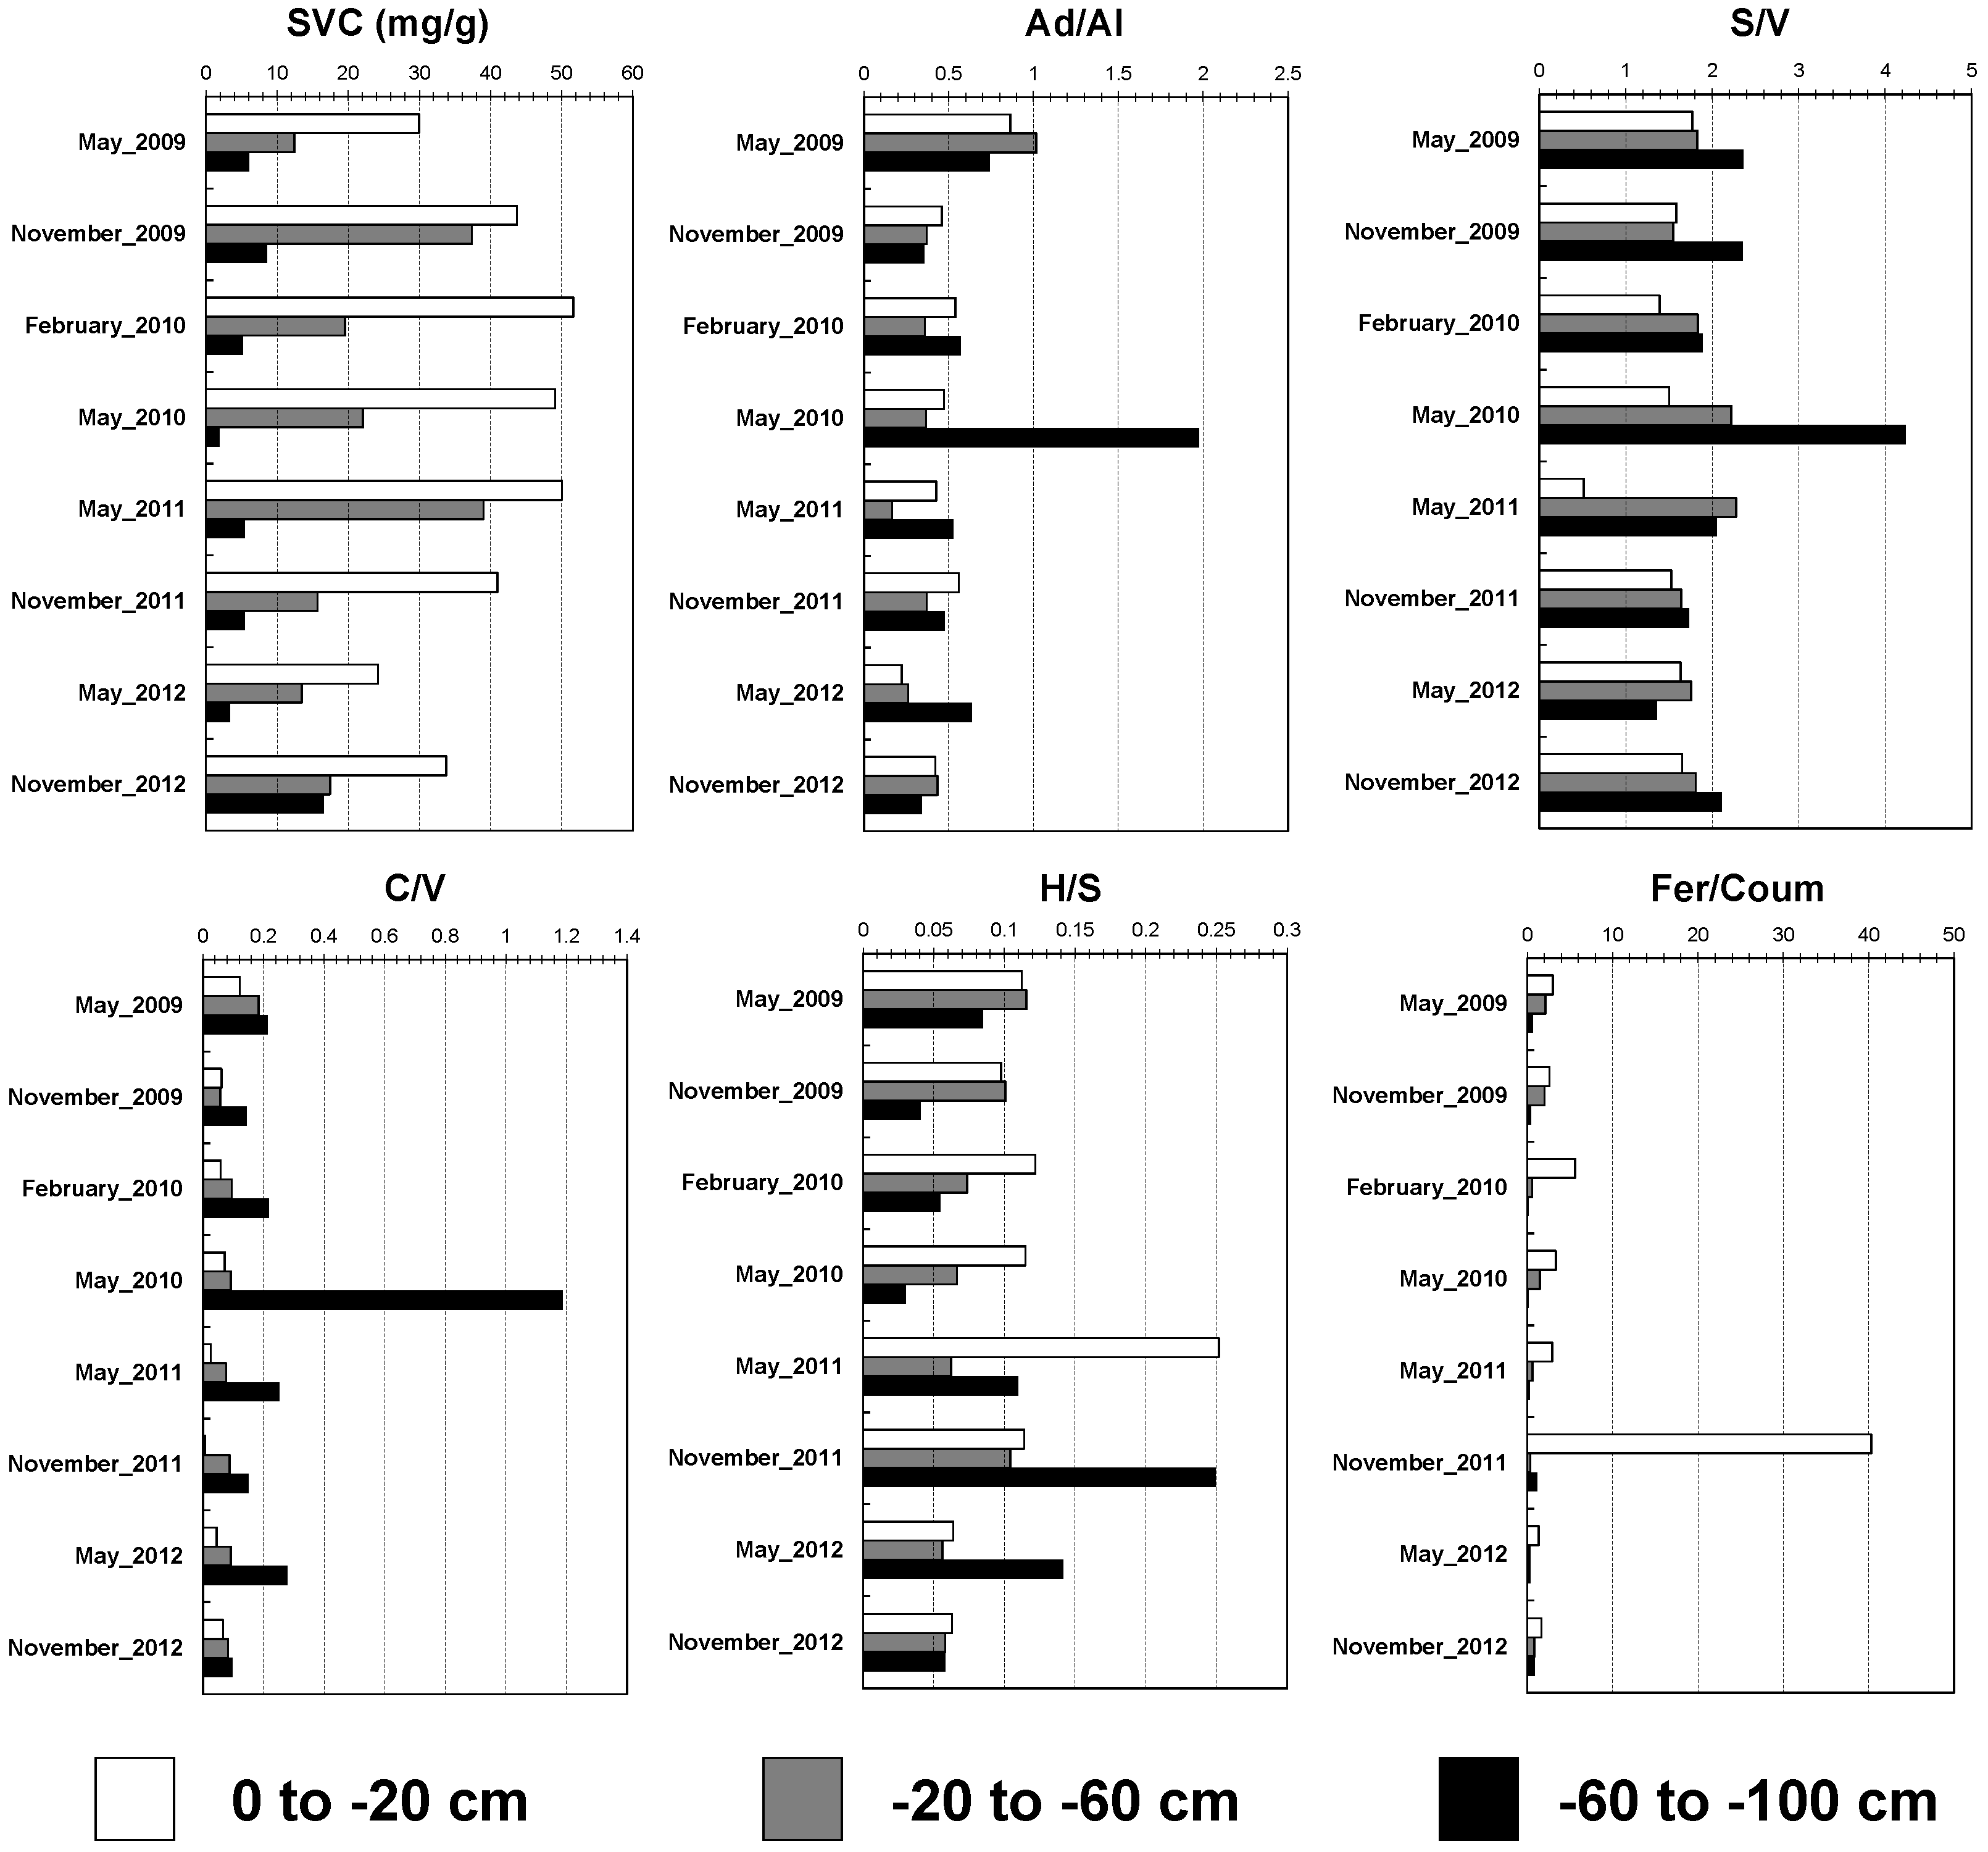
3.2. Depth-Dependent Dynamics of Lignin Biomarkers: Insights into Decomposition and Preservation in Soil Profiles

The lignin biomarkers at different depths and timings in the studied soils exhibit distinct patterns, reflecting variations in lignin composition, degradation, and preservation processes influenced by environmental conditions, microbial activity, and soil depth (Figure 4). The SVC values decrease with depth, indicating reduced inputs of fresh lignin-derived OM and progressive degradation of lignin. SVC starts at high values (29.95 mg/g at 0–20 cm in May 2009) and drops significantly at deeper layers (6.10 mg/g at −60 to −100 cm during the same period). This trend aligns with previous studies, which suggest that lignin inputs and preservation are highest near the surface due to active plant residue incorporation and microbial reworking [2,10,11].
The Ad/Al ratio, an indicator of lignin degradation, shows considerable variation at the surface (0–20 cm), fluctuating between 0.22 and 0.86, suggesting an interplay between active lignin oxidation driven by high microbial activity and oxygen availability, and accessibility of fresh OM input from uppermost agriculture [2,25]. At mid-depth (−20 to −60 cm), the Ad/Al ratio is generally lower and more stable, indicating slower degradation processes due to limited oxygen and reduced microbial activity. Interestingly, it exhibited higher values in May 2009, indicating the thrive of microbial reworking in dry climatic conditions [2,25]. At the deepest layer (−60 to −100 cm), Ad/Al ratio increases slightly in most periods, yet peaking at 1.97 in May 2010, which may reflect partial lignin decomposition facilitated by dissolved OM transport [26].
The S/V ratio increases with depth, reflecting the preferential degradation of V-units, which are more susceptible to microbial oxidation compared to S-units [27]. At the surface, S/V ratios range from 0.51 to 1.77, indicating the input of fresh lignin from angiosperm type vegetation of these samples [28]. The C/V ratio is consistently low at the surface depth (0–20 cm), reflecting minimal contributions from C-units. The predominance of woody plant-derived lignin over non-woody plant sources [2,17], could be excluded in our case, as both artichokes and cereals are non-woody. These trends would highlight the rapid degradation of C-units, which are known to be more labile compared to vanillyl units [2,18]. At the intermediate depth (−20 to −60 cm), the C/V ratios remain relatively stable, ranging from 0.058 (November 2009) to 0.184 (May 2009), indicating limited vertical transport of cinnamyl units and reduced input of non-woody plant-derived lignin (Figure 4). The preservation of C-units at this depth is influenced by slower microbial activity and reduced oxygen availability [29]. At the deepest level (−60 to −100 cm), the C/V ratio generally increases, with higher values such as 1.187 in May 2010 and 0.278 in May 2012, suggesting a low microbial reworking. The elevated ratios at these depths may also result from the selective preservation of C-units due to limited microbial activity and anaerobic conditions in deeper soils [2,30,31]. Studies have noted that under such conditions, C- units can persist for longer periods despite their inherent lability [18].
At the surface depth (0–20 cm), the H/S ratio fluctuates between 0.062 and 0.251 over time, with highest input in May 2011 (Figure 4). These elevated values suggest inputs of non-woody or herbaceous plant material, which are rich in p-hydroxyphenyl units [17]. At the intermediate depth (−20 to −60 cm), H/S ratios show a declining trend, ranging from 0.056 (May 2012) to 0.115 (May 2009). This reduction indicates a diminishing contribution of fresh plant inputs and greater microbial processing, leading to the preferential degradation of H-units [32]. The lower microbial activity and oxygen availability at this depth contribute to the preservation of S- relative to H-units [18]. In the deepest layer (−60 to −100 cm), H/S ratios showed episodes of decline to values as low as 0.030 in May 2010 (Figure 4). This consistent decrease reflects advanced degradation and minimal contributions from fresh lignin inputs [2,10]. However, episodes of increase were noted, such as 0.249 in November 2011 (Figure 4). This could indicate selective preservation of p-hydroxyphenyl units under reduced microbial activity and anaerobic conditions [33].
The Fer/Coum ratio provides insights into non-angiosperms inputs and the degree of lignin degradation [34]. At the surface depth, Fer/Coum ratios range widely, from 1.35 (May 2012) to 40.29 (November 2011; Figure 4). This high value suggests a specific contribution from fresh plant residues, particularly from non-woody plants like artichokes and cereals, which are rich in ferulic acid [35]. The fluctuations reflect ongoing lignin input and decomposition, with microbial activity driving the degradation of more labile components [2]. At the intermediate depth, Fer/Coum ratios decrease significantly, with values as low as 0.27 in May 2012 (Figure 4). The decline reflects reduced inputs of fresh lignin and enhanced microbial degradation of ferulic acid relative to p-coumaric acid. The stabilization of ratios at these depths aligns with the findings that microbial activity is constrained by lower oxygen availability and environmental stressors [1]. In the deepest layer, Fer/Coum ratios are the lowest, dropping to 0.12 in May 2010 (Figure 4). These values indicate advanced lignin degradation and minimal input from fresh plant residues [18,32]. The selective preservation of p-coumaric acid at these depths highlights the role of anaerobic conditions in slowing down the degradation of less labile lignin components [18].

3.3. Depth and Temporal Variability of Lipid Biomarkers: Insights into Microbial Activity and Organic Matter Dynamics in Soil Profiles

The variation of lipid biomarkers across different depths and timings reveals significant insights into microbial activity, OM degradation, and soil stability processes (Figure 5). At the shallowest depth (0–20 cm), i15+a15/C15 ratio peaks in February 2010 at 3.17, reflecting high microbial activity. This observation is consistent with microbial-derived FAs like iso and anteiso components being markers for bacterial activity, as supported by studies showing their abundance in aerobic environments [19,36]. The i17+a17/C17 ratio shows a substantial fluctuation, reaching 3.81 in May 2010 and its lowest value of 0.23 in November 2011 (Figure 5). These shifts indicate dynamic microbial populations, as iso and anteiso FAs are commonly associated with Gram-positive bacteria and aerobic microbial activity [19,36]. The C20−/C20+ ratio fluctuates markedly, with a high of 3.93 in May 2009 but dropping to 0.77 by November 2012 (Figure 5), indicating shifts in organic matter inputs and possibly microbial community and terrestrial input changes [37,38]. The C16:1/C16 ratio exhibits significant variability, peaking at 0.45 in February 2010 but decreasing to 0.01 by May 2011. This suggests varying microbial synthesis or degradation activity at different periods [19,36]. Similarly, the C18:1/C18 ratio reaches its highest value of 1.46 in February 2010 and drops to 0.04 by May 2011, aligning with microbial shifts [19,36]. Both ratios indicate active microbial processing near the surface.
The C20−/C20+ ratio provides insights into microbial lipid dynamics and OM transformation [39]. At the surface depth (0–20 cm), the C20−/C20+ ratio exhibits substantial variability, ranging from 0.74 in November 2011 to 3.93 in May 2009 (Figure 5). Elevated ratios during specific time points, such as May 2009, suggest enhanced microbial input, which is consistent with active microbial lipid synthesis in surface layers under favorable oxygen and nutrient conditions [40]. Conversely, the lower ratios, such as 0.74 in November 2011, indicate a relative enrichment of long-chain FAs, often associated with vascular plant inputs or selective preservation under reduced microbial activity [39]. At the intermediate depth (−20 to −60 cm), the C20−/C20+ ratio shows more stable yet elevated values, such as 7.38 in May 2009 and 3.47 in November 2012. These trends highlight the dominance of short-chain fatty acids, which may be attributed to microbial recycling of OM under moderate oxygen conditions [41]. The persistence of these ratios at intermediate depths supports the idea that microbial-derived short-chain FAs are preferentially preserved in environments with reduced decomposition rates [40]. At the deepest layer (−60 to −100 cm), the C20−/C20+ ratio displays more pronounced reductions, such as 0.64 in November 2009, alongside peaks like 10.92 in May 2010 (Figure 5). These fluctuations suggest a dynamic balance between degradation and preservation processes at depth [42]. The higher ratios may reflect limited microbial degradation of short-chain fatty acids under anaerobic conditions, whereas the lower ratios suggest selective preservation of long-chain fatty acids derived from plant inputs [39].
The Carbon Preference Index (CPI) provides critical insights into the sources, degradation, and environmental conditions affecting organic matter across soil depths [39,40]. At the surface depth (0–20 cm), CPI values range from 0.18 (February 2010) to 0.43 (May 2012; Figure 5), indicating significant microbial contributions and advanced degradation of FAs, resulting in a reduced odd/even carbon number preference. These low values reflect dynamic microbial activity and rapid turnover of organic matter typical of surface soils [39,43]. Slightly higher CPI values, such as 0.43 in May 2012 (Figure 5), suggest transient increases in terrestrial plant inputs or reduced microbial degradation. At intermediate depths (−20 to −60 cm), CPI values stabilize, ranging from 0.23 (February 2010) to 0.94 (November 2011; Figure 5), reflecting a mix of degraded terrestrial plant inputs and microbial contributions. The peak CPI of 0.94 in November 2011 indicates a relative dominance of even FAs from higher plants, potentially due to reduced microbial degradation under less oxidative conditions. This stabilization highlights slower OM turnover and greater preservation in these depths. In the deepest layer (−60 to −100 cm), CPI values remain consistently low, ranging from 0.22 to 0.53, indicating advanced degradation and microbial alteration of OM and/or minimal fresh inputs from terrestrial plants. These patterns suggest that anaerobic conditions at greater depths further limit the preservation of higher plant biomarkers, emphasizing the presence of some microbial processing [38,44].
Overall, the analysis underscores the depth-dependent nature of lipid biomarker variability, reflecting shifts in microbial processes, OM inputs, and environmental constraints over time. These trends align with previous studies indicating that lipid biomarkers are critical tools for understanding soil OM turnover and microbial community structures [44].

3.4. Influence of Salinity on Lipid and Lignin Biomarkers: Implications for Microbial Activity and Organic Matter Stabilization

The measured salinity levels across different soil depths and time periods significantly influence the dynamics and distribution of lipid and lignin biomarkers, as salinity affects microbial activity, organic matter (OM) turnover, and biomolecular preservation [45]. Elevated salinity creates osmotic stress that suppresses microbial activity, reducing enzymatic degradation and reworking of OM [46]. These effects manifest differently across soil layers and are reflected in distinct patterns of lipid and lignin biomarker dynamics.
For lignin biomarkers, salinity exerts a depth-dependent influence. In the surface layer (0–20 cm), higher salinity levels are mostly associated with increased S/V and C/V ratios. These patterns suggest that saline conditions at the surface enhance the preservation of S- and C-units relative to V-units, reflecting selective lignin preservation and limited microbial oxidation. In the middle layer (−20 to −60 cm), higher salinity mostly correlates with increased SVC, Ad/Al, C/V, H/S, and Fer/Coum ratios. These trends highlight the stabilization of plant-derived lignin and its selective degradation pathways under saline conditions, as microbial activity slows and oxidative processes are reduced [46]. Conversely, in the deepest layer (−60 to −100 cm), high salinity is mostly linked to higher S/V ratios but lower H/S and Fer/Coum values. These changes indicate that while S-units are relatively preserved, microbial activity continues to selectively degrade H-units and ferulic acid components under more anaerobic conditions [2,30,31].
For lipid biomarkers, salinity significantly modulates microbial lipid synthesis and degradation, particularly in deeper soil layers. In the middle layer (−20 to −60 cm), higher salinity is associated with elevated i17+a17/C17, C20−/C20+, C18:1/C18, and C16:1/C16 ratios. These trends would indicate that salinity intervals at this depth, present convenient trophic condition (supply of minerals) for the microbial activity [47]. These patterns suggest enhanced microbial adaptation to saline conditions, as supported by increased unsaturation and shifts in lipid composition to stabilize cell membranes [48]. At the lowest layer (−60 to −100 cm), however, high salinity results in a reduction of C16:1/C16 ratios, indicating limited microbial lipid synthesis and a shift toward saturated lipids, which are more resistant to degradation. These trends align with findings that salinity stress alters microbial lipid profiles, reducing turnover and enhancing preservation in deeper, more anoxic environments [46].
Together, these observations emphasize the depth-dependent role of salinity in modulating microbial activity, lipid synthesis, and lignin preservation. Surface soils exhibit dynamic responses to salinity, while deeper layers highlight the interplay between salinity-driven degradation and selective preservation. At moderate salinity levels, as observed in the intermediate depth (−20 to −60 cm), microbial reworking is enhanced due to the availability of nutrients and a balance between environmental constraints and microbial activity [47]. In contrast, at high salinity levels, as observed in the lowest depth (−60 to −100 cm), microbial activity is suppressed due to osmotic stress, resulting in reduced microbial reworking and selective preservation of organic matter [46]. These findings underscore salinity’s critical role in OM stabilization and carbon cycling in saline soils [47]. To further elucidate these relationships, PCA will be employed as a multivariate statistical approach. The primary objectives of using PCA are to identify the dominant factors influencing the distribution of biomarkers, reveal correlations between salinity and biomarker variability, and distinguish the contribution of microbial activity across depths and time periods. By reducing the complexity of the dataset, PCA will enable the identification of key drivers behind the observed patterns, providing a comprehensive understanding of the mechanisms governing biomarker dynamics in saline soil environments.

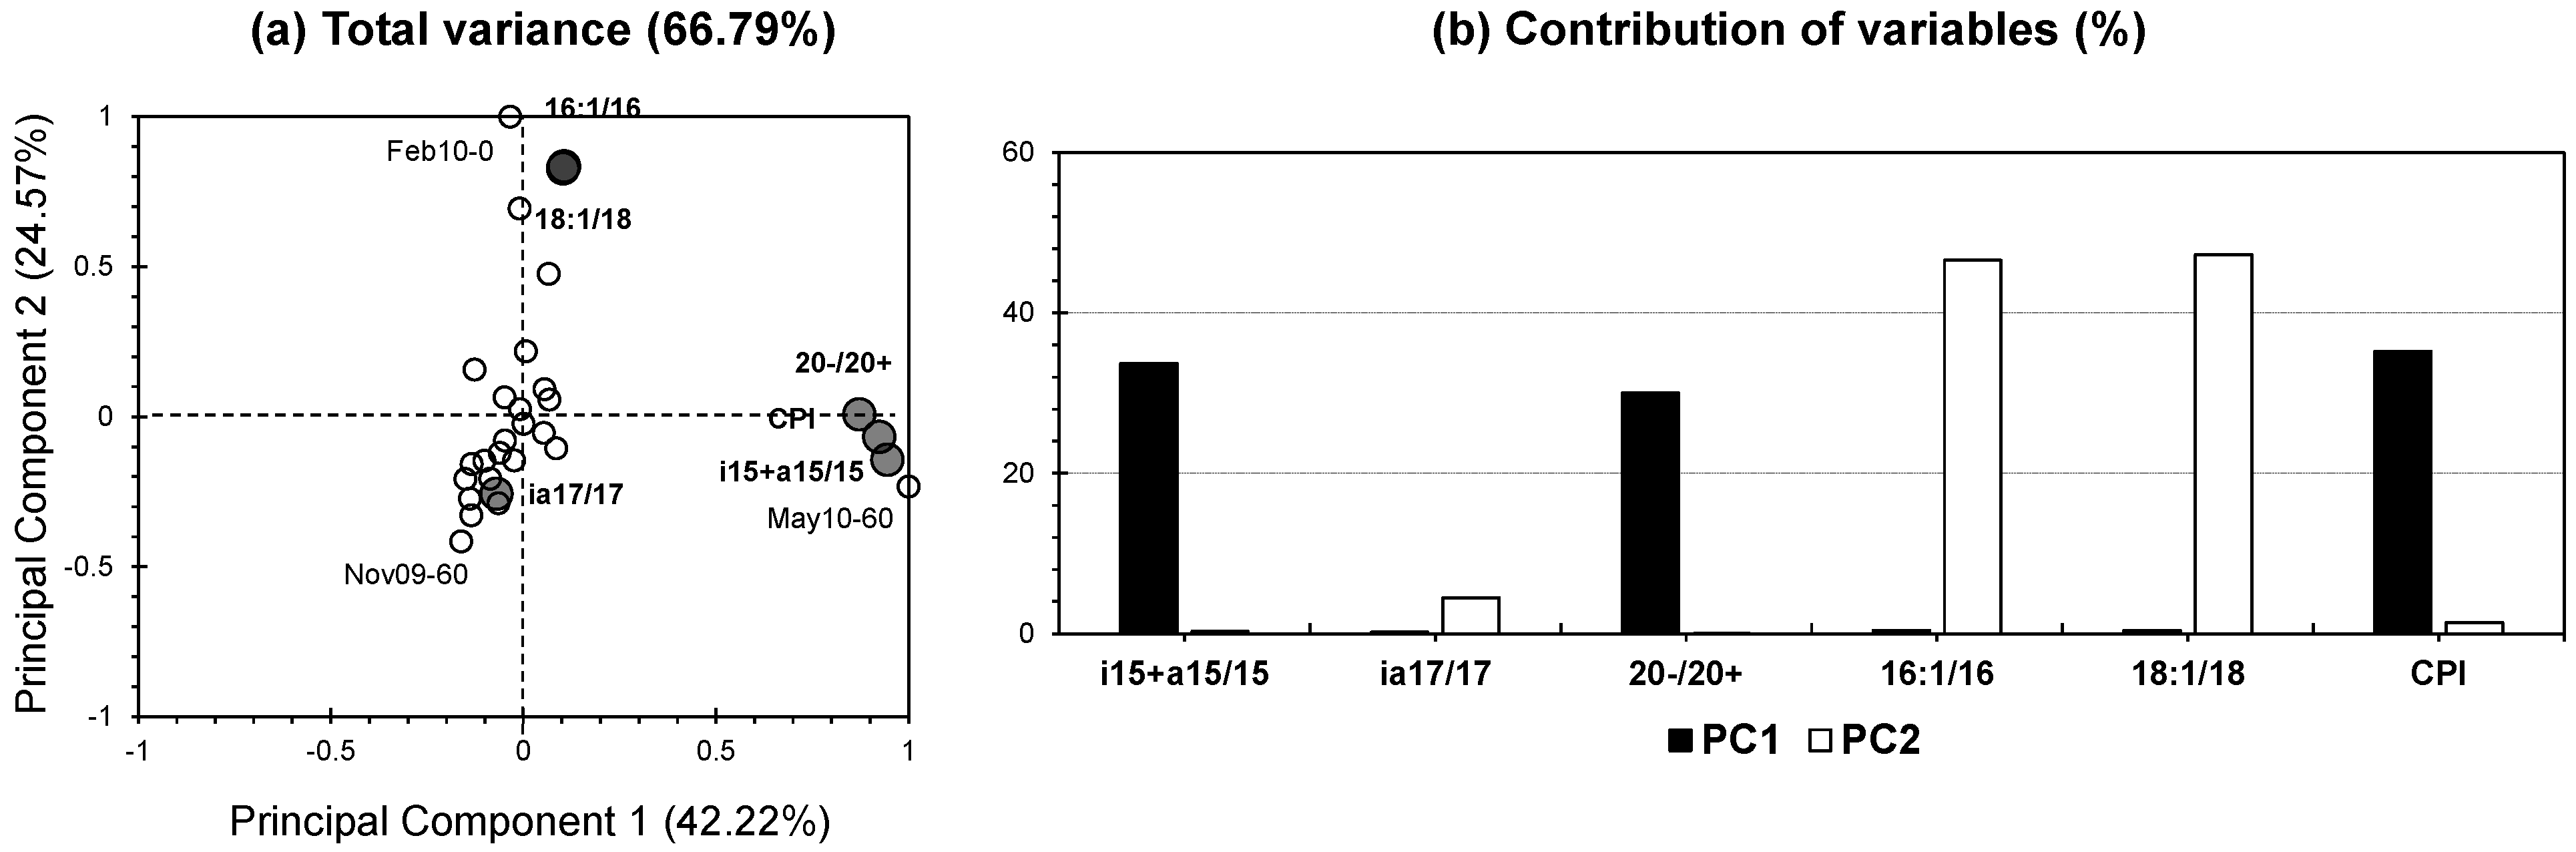
3.5. PCA for Molecular Biomarkers

3.5.1. Linking Lignin and Lipid Dynamics with Soil Biochemical Processes

The PCA bi-plot presents 58.71% of the total variance, with PC1 explaining 44.95% and PC2 accounting for 13.76% (Figure 6a). This level of explained variance indicates that the first two PCs moderately capture relationships within the dataset of molecular biomarkers, comprising lignin- and lipid-derived parameters [49]. The variance explained by PC1 signifies a strong influence of major molecular biomarkers as Ad/Al, S/V, C/V, i15+a15/C15, and CPI, as evidenced by their high contributions (14%, 14.48%,17.65%, and 15.30%; Figure 6b). These parameters are critical indicators of lignin degradation and lipid dynamics, suggesting that PC1 represents the primary axis of molecular changes associated with OM decomposition and preservation. PC2 is influenced by biomarkers as C16:1/C16 and C18:1/C18 (31.43% and 16.29%, respectively; Figure 6b), highlighting variations in microbial lipid processing and microbial reworking. These findings suggest that PC2 primarily reflects the microbial and biochemical processes associated with lipid dynamics.
The soil samples exhibit varying loadings on PC1 and PC2, reflecting their distinct molecular compositions. Samples such as May10-60 dominate the positive side of PC1, indicating strong associations with biomarkers CPI, S/V, and C/V, which are linked to OM stability and lignin degradation. Conversely, Nov09-60 and Feb10-60 exhibits negative loadings on PC2, suggesting a lesser degree of lipid microbial activity. Notably, surface samples such as Feb10-0 show high microbial lipid activity (as it is plotted on the most positive side of PC2), highlighting the dynamic biochemical transformations near the soil surface (Figure 6a).
The PCA findings align with previous interpretations from lignin and lipid analyses. High Ad/Al and C/V ratios in PC1 are consistent with earlier observations of selective lignin preservation and degradation dynamics in soil profiles [2,50]. The dominance of lipid unsaturation markers (C16:1/C16 and C18:1/C18) in PC2 also supports prior findings that microbial activity is a key driver of these lipid biomarker ratios [19]. However, discrepancies arise in the contributions of CPI, which show stronger significance in PC1 that is mostly dominated by lignin proxies.
To further enhance the representativeness of the dataset and capture additional variance, PCA will be performed separately for lignin and lipid biomarkers. This approach aims to isolate the distinct biochemical pathways influencing these two groups of molecular proxies, allowing for a more precise interpretation of their contributions to OM dynamics. By achieving a higher variance within each dataset, this analysis will offer a more detailed understanding of the underlying processes and strengthen the representativeness of the findings.

3.5.2. PCA Analysis of Lignin Biomarkers: Enhanced Insights into Decomposition and Preservation Dynamics

The PCA bi-plot for the lignin molecular biomarker dataset captures 71.70% of the total variance, with PC1 and PC2 contributing for 52.21% and 19.49% of the variance respectively (Figure 7a). This high percentage of explained variance demonstrates the effectiveness of separating lignin biomarkers from the larger dataset, as it provides a more focused analysis and captures greater representativeness compared to the total molecular biomarker dataset. Splitting the data into subsets has proven valuable for identifying more specific trends and relationships in lignin biomarker dynamics [10].
The variance captured by PC1 highlights the dominant role of S/V and C/V ratios, with contributions of 27.59% and 27.37%, respectively, along with a lower contribution of Ad/Al (20.01%) (Figure 7b). These parameters are directly linked to lignin degradation and input, indicating that PC1 represents the primary axis of decomposition and preservation of lignin in soil. PC2 is primarily driven by Fer/Coum (47.59%) and to a lower extent by Ad/Al (22.85%; Figure 7b), suggesting that this axis reflects additional decomposition pathways or environmental processes influencing lignin biomarkers.
The loadings for soil samples indicate distinct groupings along PC1 and PC2 (Figure 7a). Samples such as May10-60 strongly correlate with parameters Ad/Al, S/V and C/V ratios, indicating preservation of oxidized lignin fraction at the lowest depths [10]. In contrast, Nov11-0 shows a high positive loading on PC2, which is strongly influenced by Fer/Coum, reflecting the input of non-woody angiosperm vegetation from the dominant agricultural practices [34]. Surface samples such as Feb10-0 also show elevated PC2 values, consistent with dynamic degradation at shallow depths, while deeper samples such as Nov09-60, exhibiting low positive input on PC1 with a negative input on PC2, indicate stability and limited lignin transformation (Figure 7a).
These findings align with previous interpretations of lignin molecular proxies. The dominance of S/V and C/V ratios in PC1 agrees with earlier observations that these ratios are strong indicators of lignin source and decomposition state [2,50]. The high loading of Fer/Coum on PC2 is consistent with studies showing that it indicates the prevalence of angiosperms’ vegetation [34]. However, a discrepancy arises in the relative importance of Ad/Al across both components; while it plays a significant role here, its influence was less pronounced in the combined molecular biomarker dataset. This influence could have been hindered by the contribution of lipid biomarkers’ ratios, in the first PCA approach, which mostly indicates microbial reworking (Figure 7a).
In brief, the PCA analysis of lignin biomarkers highlights the benefits of focusing on subsets of data, as it captures more variance and provides greater specificity in interpreting lignin dynamics. These findings reinforce the importance of S/V, C/V, and Ad/Al ratios in understanding lignin decomposition and preservation, while also emphasizing the uppermost vegetation input, reflected by Fer/Coum. This analysis provides deeper insights into the biochemical processes shaping lignin turnover in soils.

3.5.3. PCA Analysis of Lipid Biomarkers: Insights into Microbial Activity and Lipid Dynamics in Soil Profiles

The PCA bi-plot for the lipid molecular biomarker dataset captures 66.79% of the total variance, of which 42.77% is explained by PC1 and 24.57% by PC2 (Figure 8a). This represents a significant improvement in capturing the variability of the lipid dataset compared to the broader molecular biomarker dataset (Figure 8a). Focusing on lipid biomarkers alone provides a clearer distinction between key lipid-related processes, enhancing the interpretive power of the analysis.
The variance explained by PC1 primarily reflects the influence of major lipid biomarkers, including i15+a15/C15 (33.68%), C20−/C20+ (30.03%), and CPI (35.24%) (Figure 8b). These parameters are critical indicators of microbial activity, lipid degradation, and preservation, suggesting that PC1 captures the primary axis of lipid turnover and stability in the soil. i15+a15/C15 represents contributions from Gram-positive bacteria [50,51]. PC2 is dominated by unsaturation markers, particularly C16:1/C16 (46.56%) and C18:1/C18 (47.26%; Figure 8b). These ratios are indicative of Gram-negative bacteria, reflecting active microbial metabolism and lipid synthesis [50,52]. The separation between these molecular ratios identifies PC1 as a pattern for Gram-positive bacteria, while PC2 reflects the prevalence of Gram-negative bacteria, emphasizing their role in active lipid dynamics and metabolic activity [50,52].
The loadings of soil samples reveal distinct groupings along PC1 and PC2, reflecting their molecular compositions. Samples such as May10-60, showing high positive influence along PC1 with a moderate negative influence along PC2, strongly correlate with parameters like CPI and i15+a15/C15, indicating higher microbial activity and lipid preservation at this depth and time. Conversely, samples such as Feb10-0 show high positive loadings on PC2, reflecting increased microbial lipid synthesis and unsaturation, consistent with surface-level microbial activity. Deeper samples, such as Nov09-60, exhibit lower negative loadings on both axes, reflecting reduced lipid turnover and microbial activity in deeper, more stable soil environments [52].
These findings align well with previous interpretations of lipid molecular proxies. The strong contributions of i15+a15/C15 and CPI to PC1 are consistent with prior observations linking these markers to microbial activity and lipid preservation in soil profiles [19,50]. Similarly, the dominance of unsaturation ratios (C16:1/C16 and C18:1/C18) on PC2 aligns with findings that emphasize the role of microbial lipid synthesis and environmental stress in shaping lipid dynamics [19,48]. However, a discrepancy arises in the relatively low contribution of i17+a17/C17, which was previously noted as an indicator of Gram-positive bacterial activity [50,52]. This may reflect dataset-specific factors or reduced variability in this biomarker across samples.
In brief, the PCA analysis of lipid biomarkers underscores the value of focusing on subsets of data to achieve higher variance and more specific insights. The findings confirm the relevance of i15+a15/C15, CPI, and unsaturation ratios as key indicators of microbial activity and lipid dynamics, while also highlighting dataset-specific discrepancies such as the limited influence of i17+a17/C17. This analysis provides a refined understanding of lipid turnover and preservation in soil systems, complementing and extending prior interpretations of lipid molecular proxies.

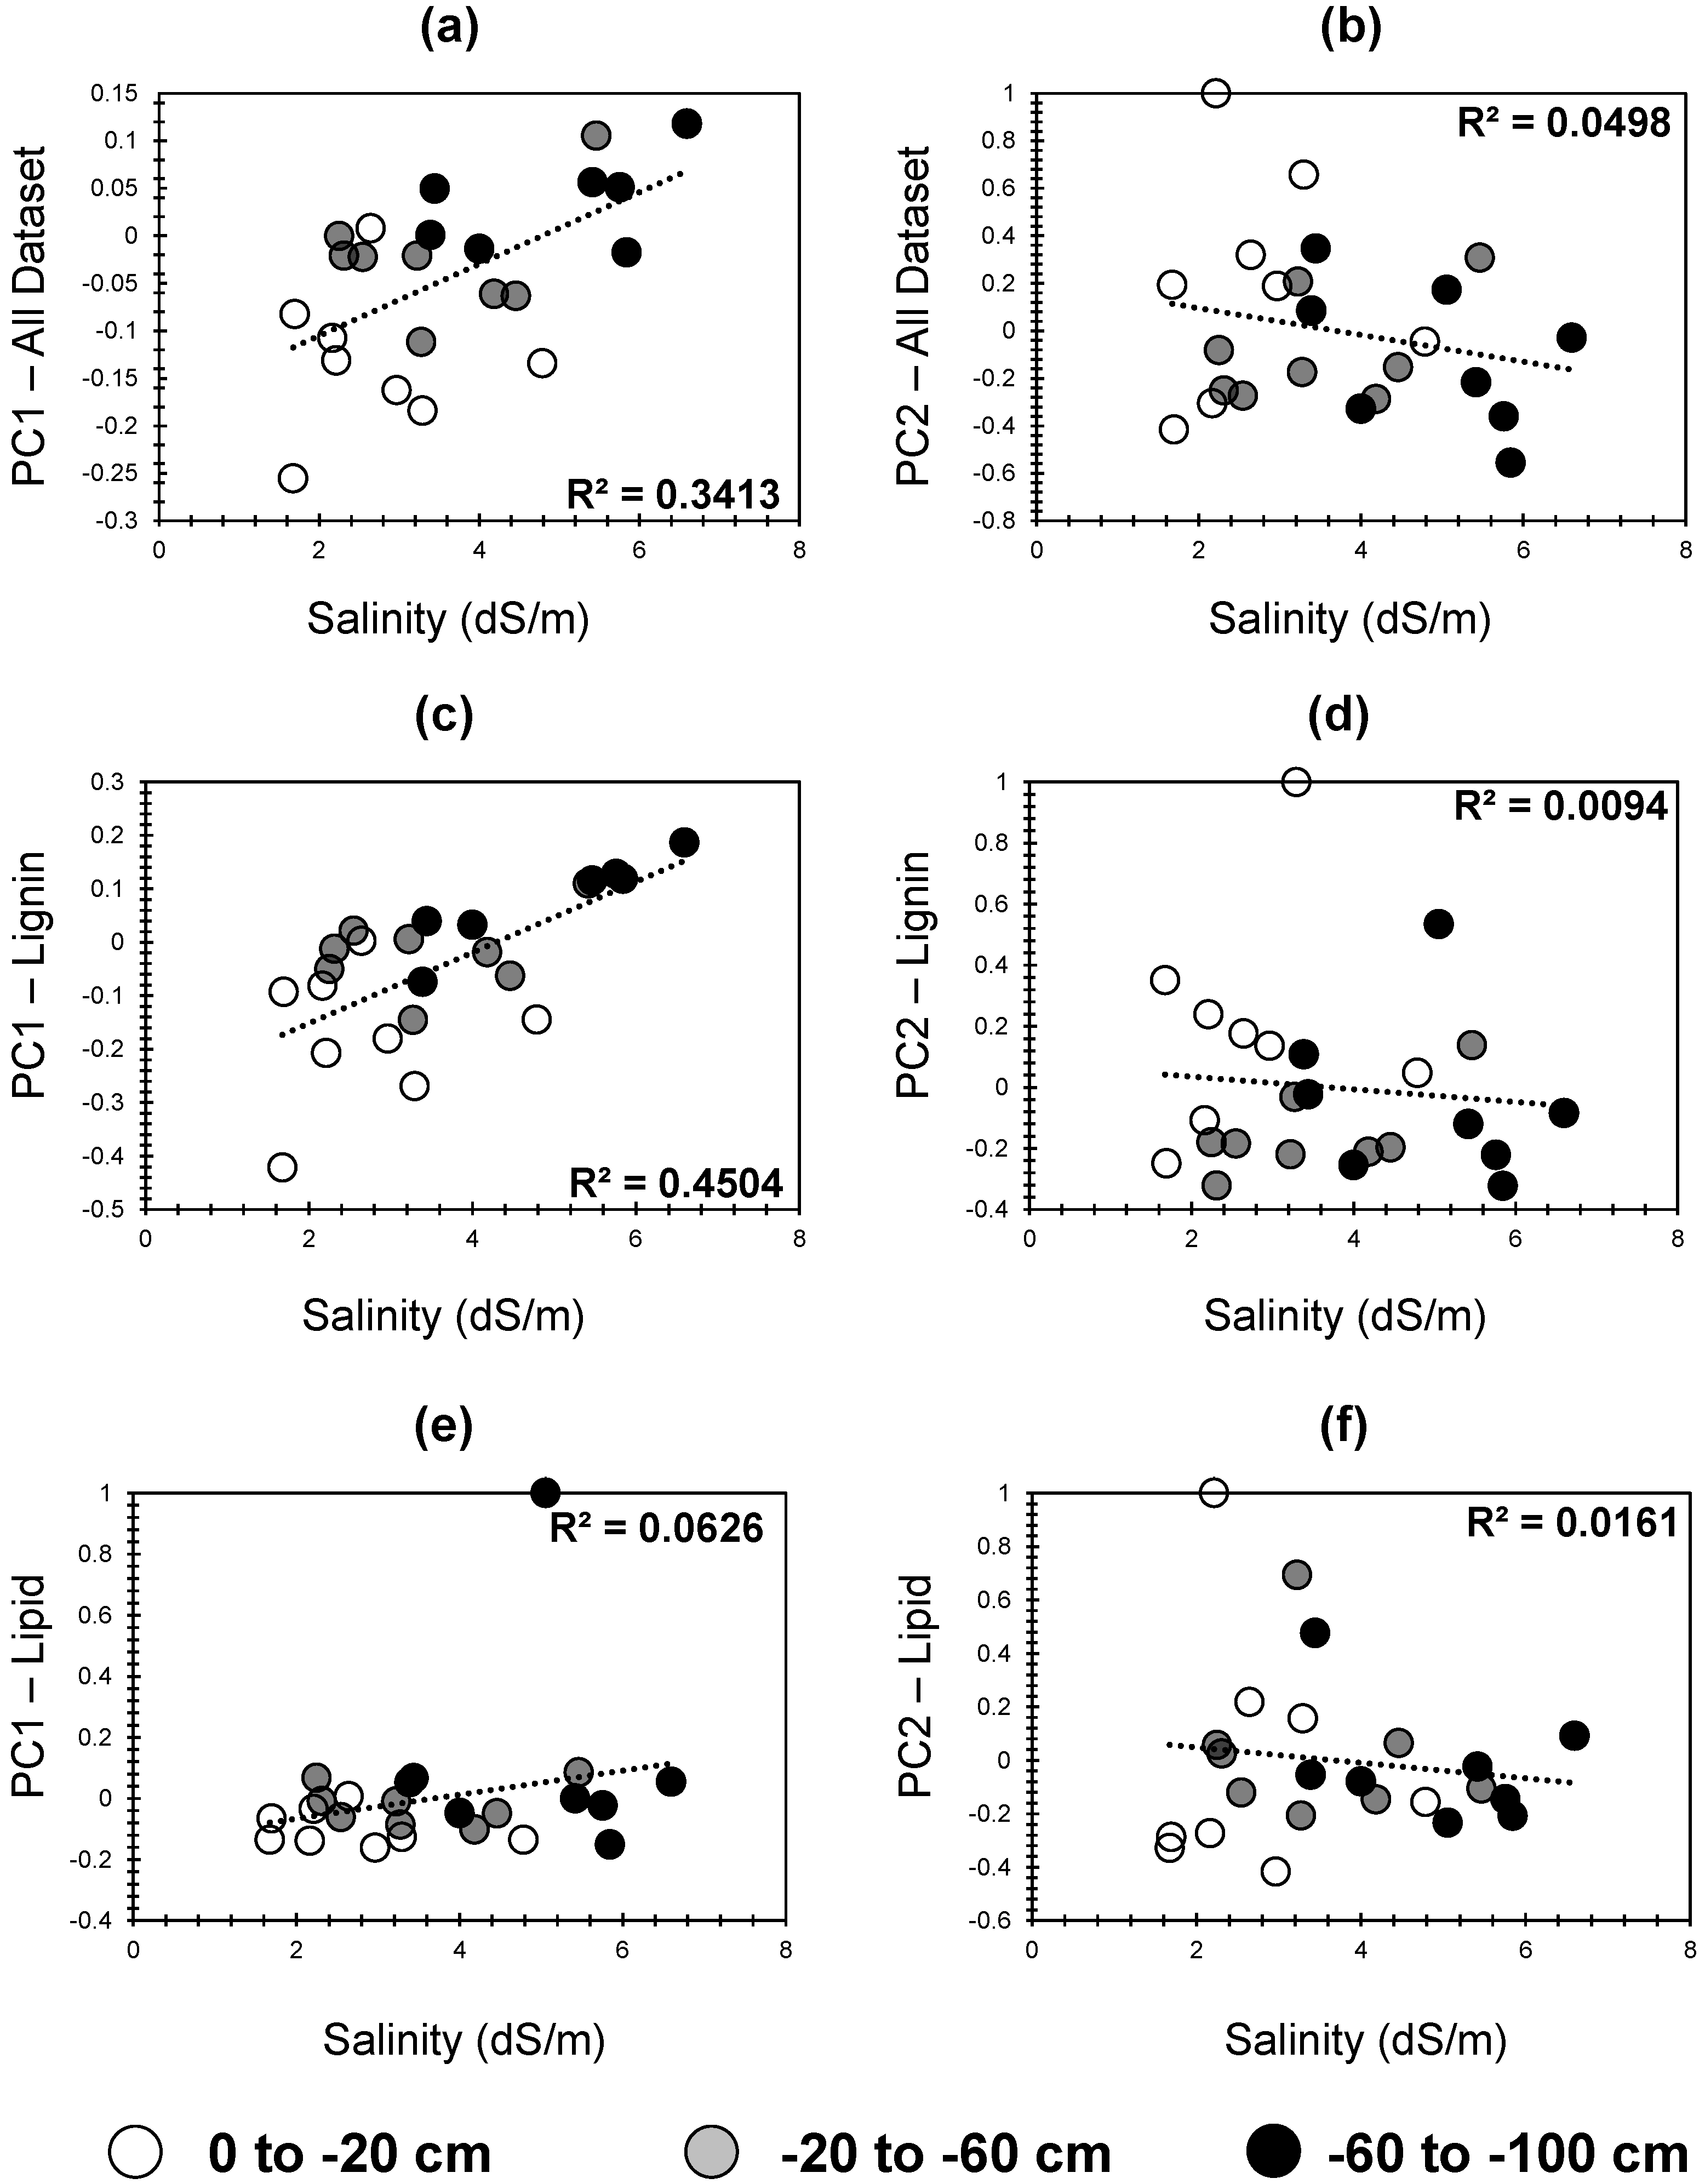
3.5.4. Correlation Between Principal Components and Salinity: Insights into Temporal and Depth-Based Soil Organic Matter Dynamics

Figure 9 illustrates the correlation between the PCs from the three PCA analyses and salinity. The PCs demonstrated low correlations with salinity, except for PC1 of the combined dataset (moderate correlation of 34.13%; Figure 9a) and PC1 of the lignin PCA (45%; Figure 9c). Despite these low correlations, complementary trends can be traced between salinity variation and the PCs of molecular biomarkers, offering critical insights into OM dynamics across different depths.
For the combined dataset, PC1 exhibited a positive correlation with salinity, where the highest PC1 scores were predominantly noted in the deepest, most saline layers (Figure 9a). These results suggest that PC1 captures the primary axis of molecular changes associated with OM stabilization in saline conditions. In contrast, the lowest PC1 scores were observed in the surface layers with the least salinity, where microbial activity and dynamic turnover dominate. PC2 showcased an inverse correlation with salinity, as its highest values were scored for the surface less saline layer, and its lowest values were scored for the most saline deepest layer (Figure 9b). These results indicate that PC2 reflects microbial lipid reworking processes, which are more active in surface layers with lower salinity.
In the lignin PCA, PC1 followed the same trend as PC1 for the combined dataset, with higher PC1 scores associated with the deepest, most saline layers (Figure 9c). This reflect lignin stability and preservation under conditions of reduced microbial activity and oxidative processes. In contrast, surface layers with lower salinity exhibited lower PC1 values, highlighting active lignin decomposition driven by aerobic microbial processes. PC2, however, demonstrated a distinct pattern, with surface layers showing the highest PC2 scores (Figure 9d). This pattern emphasizes the role of surface processes in incorporating fresh plant-derived lignin into the soil. Conversely, the deepest layers, associated with the highest salinity, showed the lowest PC2 scores, indicating limited contributions of non-woody inputs and advanced lignin degradation under anaerobic conditions.
For the lipid PCA, PC1 showed a trend similar to the previous PC1s, with higher scores in deeper, more saline layers, emphasizing the stabilization and preservation of microbial lipids. PC1 reflects the influence of i15+a15/C15 (33.68%), C20−/C20+ (30.03%), and CPI (35.24%), which indicate Gram-positive bacterial activity and lipid stability under saline and nutrient-limited conditions. At lower salinities, PC1 scores were reduced, reflecting dynamic microbial reworking in surface layers (Figure 9e). PC2, dominated by unsaturation markers C16:1/C16 (46.56%) and C18:1/C18 (47.26%), mirrored the PC2 trends from lignin PCA. Surface layers exhibited higher PC2 scores, indicative of Gram-negative bacterial activity and active lipid synthesis, while deeper layers with higher salinity exhibited lower PC2 scores, highlighting reduced microbial activity and lipid turnover in these more stressful environments (Figure 9f).
Across all PCAs, depth and salinity are critical determinants of OM dynamics. Surface layers with lower salinity exhibited greater microbial activity, dynamic lipid and lignin transformations [2], as reflected in higher PC2 scores. Intermediate layers with moderate salinity showed proper trophic conditions that enhanced microbial reworking and biomarker preservation, driven by a balance between microbial activity and environmental constraints [47]. In the deepest layers, the high salinity suppressed microbial reworking, favoring the preservation of stable molecular biomarkers, as indicated by higher PC1 scores [46]. These trends confirm the complementary roles of salinity, depth, and microbial activity in shaping the molecular composition and stability of OM, reinforcing the utility of PCA in elucidating complex soil biochemical processes.

4. Conclusions

The objective of this study was to investigate the relationships between salinity, molecular biomarkers (lignin and lipid proxies), reflecting soil organic matter (OM) dynamics, to understand the processes governing decomposition, preservation, and microbial activity across different depths and time periods. The results demonstrate that salinity plays a pivotal role in shaping OM stability and turnover. Higher salinity levels suppress microbial activity and enzymatic degradation, leading to the selective preservation of lignin phenols. Lignin biomarkers (e.g., Ad/Al, S/V, C/V) highlighted reduced degradation in saline soils, particularly at depth, while lipid biomarkers (e.g., i15+a15/C15, C16:1/C16) emphasized microbial contributions to OM turnover, with salinity promoting the stability of saturated over unsaturated lipids.
Depth- and time-based trends further confirmed salinity’s influence: surface layers showed dynamic microbial transformations, while deeper layers exhibited greater biomarker stability. Periods of lower salinity corresponded to increased microbial activity, while high salinity coincided with reduced degradation and enhanced preservation.
Principal Component Analysis (PCA) allowed the identification of dominant molecular patterns and highlighted contrasting microbial and preservation processes between surface and subsurface layers. These findings emphasize the importance of salinity as a key environmental driver of OM transformation and stabilization and provide valuable insights for managing soil health and sustainability in saline environments.

Author Contributions

The authors of this study have made substantial contributions to the conception, design, analysis, and interpretation of data for this manuscript. The specific contributions of each author are as follows: A.A., formal analysis, validation, writing—first draft, funding acquisition; A.D., methodology, supervision, writing—reviewing; C.E.S., writing—first draft and reviewing; H.A., writing—first draft and reviewing; S.E.-Z., writing—first draft and reviewing; K.Y., conceptualization, methodology, formal analysis, supervision, project administration, writing—first draft and reviewing; L.G., conceptualization, methodology, funding acquisition, supervision, and writing—reviewing. All authors have read and agreed to the published version of the manuscript.

Funding

The PhD funding has been acquired from Erasmus Mundus—Al Idrisi scholarship (Action 2—Strand 1—Lot 1). The analysis was covered by Laurent Grasset at the University of Poitiers.

Data Availability Statement

Data is contained within the article.

Acknowledgments

The authors would like to thank Erasmus Mundus for the PhD funding, and the University of Poitiers for covering the fees of the analysis.

Conflicts of Interest

The authors declare no competing interests.

References

  1. Bahri, H.; Dignac, M.-F.; Rumpel, C.; Rasse, D.P.; Chenu, C.; Mariotti, A. Lignin Turnover Kinetics in an Agricultural Soil Is Monomer Specific. Soil Biol. Biochem. 2006, 38, 1977–1988. [Google Scholar] [CrossRef]
  2. Thevenot, M.; Dignac, M.-F.; Rumpel, C. Fate of Lignins in Soils: A Review. Soil Biol. Biochem. 2010, 42, 1200–1211. [Google Scholar]
  3. Assembly, G. Sustainable Development Goals. SDGs Transform. Our World 2015, 2030, 6–28. [Google Scholar]
  4. Shahid, S.A.; Zaman, M.; Heng, L. Soil Salinity: Historical Perspectives and a World Overview of the Problem. In Guideline for Salinity Assessment, Mitigation and Adaptation Using Nuclear and Related Techniques; Springer International Publishing: Cham, Switzerland, 2018; pp. 43–53. ISBN 978-3-319-96189-7. [Google Scholar]
  5. Collard, F.-X.; Blin, J. A Review on Pyrolysis of Biomass Constituents: Mechanisms and Composition of the Products Obtained from the Conversion of Cellulose, Hemicelluloses and Lignin. Renew. Sustain. Energy Rev. 2014, 38, 594–608. [Google Scholar]
  6. Corwin, D.L. Climate Change Impacts on Soil Salinity in Agricultural Areas. Eur. J. Soil Sci. 2021, 72, 842–862. [Google Scholar] [CrossRef]
  7. Boulaine, J. Carte Des Sols Des Plaines Du Cheliff Au 1/50.000 e, Feuilles 1 à 5. Inspection générale de l’Agriculture du Gouvernement Général de l’Algérie 1956. [Google Scholar]
  8. Douaoui, A. Variabilité Spatiale de la Salinité et Sa Relation Avec Certaines Caractéristiques Des Sols de la Plaine du Bas-Chéliff. Ph.D. Thesis, University Center of Tipaza Morsli Abdallah, Tipaza, Algeria, 2005. [Google Scholar]
  9. Abd El Kader Douaoui, H.N.; Walter, C. Detecting Salinity Hazards within a Semiarid Context by Means of Combining Soil and Remote-Sensing Data. Geoderma 2006, 134, 217–230. [Google Scholar] [CrossRef]
  10. Younes, K.; Moghrabi, A.; Moghnie, S.; Mouhtady, O.; Murshid, N.; Grasset, L. Assessment of the Efficiency of Chemical and Thermochemical Depolymerization Methods for Lignin Valorization: Principal Component Analysis (PCA) Approach. Polymers 2022, 14, 194. [Google Scholar] [CrossRef]
  11. Schellekens, J.; Bindler, R.; Martínez-Cortizas, A.; McClymont, E.L.; Abbott, G.D.; Biester, H.; Pontevedra-Pombal, X.; Buurman, P. Preferential Degradation of Polyphenols from Sphagnum–4-Isopropenylphenol as a Proxy for Past Hydrological Conditions in Sphagnum-Dominated Peat. Geochim. Cosmochim. Acta 2015, 150, 74–89. [Google Scholar]
  12. Bahreininejad, B.; Allahdadi, M. Effects of Saline Irrigated Water on Forage Quality of Globe Artichoke (Cynara cardunculus var. scolymus L.). Iran Agric. Res. 2020, 39, 59–66. [Google Scholar]
  13. Hardie, M.; Doyle, R. Measuring Soil Salinity. In Plant Salt Tolerance; Shabala, S., Cuin, T.A., Eds.; Methods in Molecular Biology; Humana Press: Totowa, NJ, USA, 2012; Volume 913, pp. 415–425. ISBN 978-1-61779-985-3. [Google Scholar]
  14. Wang, J.J.; Provin, T.; Zhang, H. Measurement of Soil Salinity and Sodicity. In Soil Test Methods from the Southeastern United States; University of Kentucky: Lexington, KY, USA; Clemson University: Clemson, SC, USA, 2014; p. 185. Available online: https://aesl.ces.uga.edu/Sera6/PUB/Methodsmanualfinalsera6.Pdf#page=193 (accessed on 26 February 2025).
  15. Ertel, J.R.; Hedges, J.I. The Lignin Component of Humic Substances: Distribution among Soil and Sedimentary Humic, Fulvic, and Base-Insoluble Fractions. Geochim. Cosmochim. Acta 1984, 48, 2065–2074. [Google Scholar]
  16. Jørgensen, P.-E.; Eriksen, T.; Jensen, B.K. Estimation of Viable Biomass in Wastewater and Activated Sludge by Determination of ATP, Oxygen Utilization Rate and FDA Hydrolysis. Water Res. 1992, 26, 1495–1501. [Google Scholar]
  17. Hedges, J.I.; Mann, D.C. The Characterization of Plant Tissues by Their Lignin Oxidation Products. Geochim. Cosmochim. Acta 1979, 43, 1803–1807. [Google Scholar] [CrossRef]
  18. Otto, A.; Simpson, M.J. Evaluation of CuO Oxidation Parameters for Determining the Source and Stage of Lignin Degradation in Soil. Biogeochemistry 2006, 80, 121–142. [Google Scholar] [CrossRef]
  19. Collard, M.; Teychené, B.; Lemée, L. Comparison of Three Different Wastewater Sludge and Their Respective Drying Processes: Solar, Thermal and Reed Beds–Impact on Organic Matter Characteristics. J. Environ. Manag. 2017, 203, 760–767. [Google Scholar]
  20. Qadir, M.; Quillérou, E.; Nangia, V.; Murtaza, G.; Singh, M.; Thomas, R.J.; Drechsel, P.; Noble, A.D. Economics of Salt-induced Land Degradation and Restoration. Nat. Resour. Forum 2014, 38, 282–295. [Google Scholar] [CrossRef]
  21. Massoud, F.I. Salt Affected Soils at a Global Scale and Concepts for Control; FAO: Rome, Italy, 1981. [Google Scholar]
  22. Bourg, I.C.; Ajo-Franklin, J.B. Clay, Water, and Salt: Controls on the Permeability of Fine-Grained Sedimentary Rocks. Acc. Chem. Res. 2017, 50, 2067–2074. [Google Scholar] [CrossRef]
  23. Corwin, D.L.; Lesch, S.M.; Oster, J.D.; Kaffka, S.R. Short-Term Sustainability of Drainage Water Reuse: Spatio-Temporal Impacts on Soil Chemical Properties. J. Environ. Qual. 2008, 37, S-8-S-24. [Google Scholar] [CrossRef]
  24. Wichelns, D.; Qadir, M. Achieving Sustainable Irrigation Requires Effective Management of Salts, Soil Salinity, and Shallow Groundwater. Agric. Water Manag. 2015, 157, 31–38. [Google Scholar]
  25. Younes, K.; Laduranty, J.; Descostes, M.; Grasset, L. Molecular Biomarkers Study of an Ombrotrophic Peatland Impacted by an Anthropogenic Clay Deposit. Org. Geochem. 2017, 105, 20–32. [Google Scholar] [CrossRef]
  26. Kaal, J.; Pérez-Rodríguez, M.; Biester, H. Molecular Probing of DOM Indicates a Key Role of Spruce-Derived Lignin in the DOM and Metal Cycles of a Headwater Catchment: Can Spruce Forest Dieback Exacerbate Future Trends in the Browning of Central European Surface Waters? Environ. Sci. Technol. 2022, 56, 2747–2759. [Google Scholar] [CrossRef]
  27. Grünewald, G.; Kaiser, K.; Jahn, R.; Guggenberger, G. Organic Matter Stabilization in Young Calcareous Soils as Revealed by Density Fractionation and Analysis of Lignin-Derived Constituents. Org. Geochem. 2006, 37, 1573–1589. [Google Scholar]
  28. Gordon, E.S.; Goñi, M.A. Sources and Distribution of Terrigenous Organic Matter Delivered by the Atchafalaya River to Sediments in the Northern Gulf of Mexico. Geochim. Cosmochim. Acta 2003, 67, 2359–2375. [Google Scholar]
  29. Hedges, J.I.; Clark, W.A.; Come, G.L. Organic Matter Sources to the Water Column and Surficial Sediments of a Marine Bay: Organic Matter Sources. Limnol. Oceanogr. 1988, 33, 1116–1136. [Google Scholar] [CrossRef]
  30. Hedges, J.I.; Blanchette, R.A.; Weliky, K.; Devol, A.H. Effects of Fungal Degradation on the CuO Oxidation Products of Lignin: A Controlled Laboratory Study. Geochim. Cosmochim. Acta 1988, 52, 2717–2726. [Google Scholar]
  31. Jeffries, T.W. Biodegradation of Lignin-Carbohydrate Complexes. In Physiology of Biodegradative Microorganisms; Ratledge, C., Ed.; Springer Netherlands: Dordrecht, The Netherlands, 1991; pp. 163–176. ISBN 978-94-010-5527-7. [Google Scholar]
  32. Skyba, O.; Douglas, C.J.; Mansfield, S.D. Syringyl-Rich Lignin Renders Poplars More Resistant to Degradation by Wood Decay Fungi. Appl. Environ. Microbiol. 2013, 79, 2560–2571. [Google Scholar] [CrossRef]
  33. Chang, B.V.; Chang, S.W.; Yuan, S.Y. Anaerobic Degradation of Polycyclic Aromatic Hydrocarbons in Sludge. Adv. Environ. Res. 2003, 7, 623–628. [Google Scholar]
  34. Orem, W.H.; Colman, S.M.; Lerch, H.E. Lignin Phenols in Sediments of Lake Baikal, Siberia: Application to Paleoenvironmental Studies. Org. Geochem. 1997, 27, 153–172. [Google Scholar]
  35. Tortosa-Díaz, L.; Saura-Martínez, J.; Taboada-Rodríguez, A.; Martínez-Hernández, G.B.; López-Gómez, A.; Marín-Iniesta, F. Influence of Industrial Processing of Artichoke and By-Products on The Bioactive and Nutritional Compounds. Food Eng. Rev. 2025, 1–24. [Google Scholar] [CrossRef]
  36. Elouaqoudi, F.Z.; El Fels, L.; Amir, S.; Merlina, G.; Meddich, A.; Lemee, L.; Ambles, A.; Hafidi, M. Lipid Signature of the Microbial Community Structure during Composting of Date Palm Waste Alone or Mixed with Couch Grass Clippings. Int. Biodeterior. Biodegrad. 2015, 97, 75–84. [Google Scholar]
  37. Kögel, I.; Hempfling, R.; Zech, W.; Hatcher, P.G.; Schulten, H.-R. Chemical Composition of the Organic Matter in Forest Soils: 1. Forest Litter. Soil Sci. 1988, 146, 124–136. [Google Scholar]
  38. Kögel-Knabner, I. The Macromolecular Organic Composition of Plant and Microbial Residues as Inputs to Soil Organic Matter: Fourteen Years On. Soil Biol. Biochem. 2017, 105, A3–A8. [Google Scholar] [CrossRef]
  39. Eckmeier, E.; Wiesenberg, G.L. Short-Chain n-Alkanes (C16–20) in Ancient Soil Are Useful Molecular Markers for Prehistoric Biomass Burning. J. Archaeol. Sci. 2009, 36, 1590–1596. [Google Scholar] [CrossRef]
  40. Wiesenberg, G.L.; Lehndorff, E.; Schwark, L. Thermal Degradation of Rye and Maize Straw: Lipid Pattern Changes as a Function of Temperature. Org. Geochem. 2009, 40, 167–174. [Google Scholar] [CrossRef]
  41. Bhattarai, S.P.; Su, N.; Midmore, D.J. Oxygation Unlocks Yield Potentials of Crops in Oxygen-Limited Soil Environments. Adv. Agron. 2005, 88, 313–377. [Google Scholar]
  42. Balesdent, J.; Chenu, C.; Balabane, M. Relationship of Soil Organic Matter Dynamics to Physical Protection and Tillage. Soil Tillage Res. 2000, 53, 215–230. [Google Scholar] [CrossRef]
  43. Estournel-Pelardy, C.; El-Mufleh Al Husseini, A.; Doskočil, L.; Grasset, L. A Two-Step Thermochemolysis for Soil Organic Matter Analysis. Application to Lipid-Free Organic Fraction and Humic Substances from an Ombrotrophic Peatland. J. Anal. Appl. Pyrolysis 2013, 104, 103–110. [Google Scholar] [CrossRef]
  44. Akkermans, A.D.L.; Van Elsas, J.D.; De Bruijn, F.J. (Eds.) Molecular Microbial Ecology Manual; Springer Netherlands: Dordrecht, The Netherlands, 1996; ISBN 978-94-011-7660-6. [Google Scholar]
  45. Tremblay, L.; Benner, R. Microbial Contributions to N-Immobilization and Organic Matter Preservation in Decaying Plant Detritus. Geochim. Cosmochim. Acta 2006, 70, 133–146. [Google Scholar] [CrossRef]
  46. Ma, Y.; Dias, M.C.; Freitas, H. Drought and Salinity Stress Responses and Microbe-Induced Tolerance in Plants. Front. Plant Sci. 2020, 11, 591911. [Google Scholar] [CrossRef]
  47. Robert, M.; Chenu, C. Interactions between Soil Minerals and Microorganisms. In Soil Biochemistry; CRC Press: Boca Raton, FL, USA, 2021; pp. 307–404. [Google Scholar]
  48. Quinn, P.J.; Joo, F.; Vigh, L. The Role of Unsaturated Lipids in Membrane Structure and Stability. Prog. Biophys. Mol. Biol. 1989, 53, 71–103. [Google Scholar] [CrossRef]
  49. Younes, K.; Grasset, L. Carbohydrates as Proxies in Ombrotrophic Peatland: DFRC Molecular Method Coupled with PCA. Chem. Geol. 2022, 606, 120994. [Google Scholar] [CrossRef]
  50. Harji, R.R.; Bhosle, N.B.; Garg, A.; Sawant, S.S.; Venkat, K. Sources of Organic Matter and Microbial Community Structure in the Sediments of the Visakhapatnam Harbour, East Coast of India. Chem. Geol. 2010, 276, 309–317. [Google Scholar]
  51. El Fels, L.; Lemee, L.; Ambles, A.; Hafidi, M. Identification and Biotransformation of Aliphatic Hydrocarbons during Co-Composting of Sewage Sludge-Date Palm Waste Using Pyrolysis-GC/MS Technique. Environ. Sci. Pollut. Res. 2016, 23, 16857–16864. [Google Scholar]
  52. Srivastava, M.; Mishra, A.K. Comparative Analysis of Paddy Soil Denitrifying Bacteria with Soil Phospholipid Fatty Acid Profile. Geomicrobiol. J. 2021, 38, 404–414. [Google Scholar] [CrossRef]
Figure 1. Study area and sampling sites in El Hamadna, Algeria.
Sustainability 17 02940 g001
Figure 2. The 11 phenolic sub-units yielded by cupric (II) oxide alkaline oxidation. Adapted from Ref. [10].
Sustainability 17 02940 g002
Figure 3. Variation of soil salinity, measured as electrical conductivity (dS/m), across different depths (0 to −20 cm, −20 to −60 cm, −60 to −100 cm) and time periods. The chart highlights the spatial and temporal distribution of salinity levels within the soil profile.
Sustainability 17 02940 g003
Figure 4. The distribution of lignin biomarkers across different depths and time periods. The chart highlights variations in lignin degradation, preservation, and source inputs, providing insights into the dynamics of soil organic matter.
Sustainability 17 02940 g004
Figure 5. The distribution of lipid biomarkers across different depths and time periods. The chart highlights variations in microbial activity, lipid unsaturation, and preservation, offering insights into biochemical transformations within the soil profile.
Sustainability 17 02940 g005
Figure 6. (a) PCA biplot of the combined dataset (lignin and lipid biomarkers). The plot illustrates the relationships between molecular biomarkers (variables; grey bullets) and the principal components, highlighting the major factors driving variability in soil samples (individuals; white bullets) across depths and time periods. (b) Contribution of the variables along PC1 and PC2.
Sustainability 17 02940 g006
Figure 7. (a) PCA biplot of the lignin’s dataset. The plot illustrates the relationships between molecular biomarkers (variables; grey bullets) and the principal components, highlighting the major factors driving variability in soil samples (individuals; white bullets) across depths and time periods. (b) Contribution of the variables along PC1 and PC2.
Sustainability 17 02940 g007
Figure 8. (a) PCA biplot of the lipids’ dataset. The plot illustrates the relationships between molecular biomarkers (variables; grey bullets) and the principal components, highlighting the major factors driving variability in soil samples (individuals; white bullets) across depths and time periods. (b) Contribution of the variables along PC1 and PC2.
Sustainability 17 02940 g008
Figure 9. Biplot presentations and regression analyses for salinity (x–axis) and principal components (PC1 and PC2) from three separate PCA analyses. Panels (a,b) represent PC1 and PC2 for the combined dataset of all biomarkers (lipid and lignin), while (c,d) illustrate PC1 and PC2 from the lignin PCA, and (e,f) depict PC1 and PC2 from the lipid PCA. The sample M10-60 was excluded from PC1 analyses of the combined dataset and the lignin PCA to reduce bias in the biplots, ensuring a more accurate representation of the relationships between salinity and molecular dynamics across the datasets.
Sustainability 17 02940 g009
Table 1. Description of the studied site in El Hamadna: agricultural practices, soil texture, and salinity levels across different time periods.
LocationGeographical CoordinatesSurfaceAgricultural AcitvityOverall Salinity EC (dS/m)Soil Texture
TypePeriods
XY
El Hmadna296,6453,979,6612 haArtichoke
and Cereals
2009–20124.17Clay
Disclaimer/Publisher’s Note: The statements, opinions and data contained in all publications are solely those of the individual author(s) and contributor(s) and not of MDPI and/or the editor(s). MDPI and/or the editor(s) disclaim responsibility for any injury to people or property resulting from any ideas, methods, instructions or products referred to in the content.

