Article

The Mechanisms and Empirical Analysis of the Impact of Environmental Regulations on Employment Levels in Specific Industries in China

School of Economics, Qingdao University, Qingdao 266071, China
*
Author to whom correspondence should be addressed.
Sustainability 2025, 17(7), 2938; https://doi.org/10.3390/su17072938
Submission received: 24 January 2025 / Revised: 9 March 2025 / Accepted: 25 March 2025 / Published: 26 March 2025

Abstract

:
As environmental regulations in China have become more stringent, balancing these regulations with employment growth represents a major concern for policymakers and researchers striving for sustainable economic development. Although several studies have investigated the influence of environmental regulations on labor demand, most focus on corporate or regional levels, with limited exploration of industry-specific dynamics. Given the external and interconnected nature of environmental challenges, regulatory policies not only significantly impact the targeted industry but also generate spillover effects across interrelated sectors, thereby shaping broader sustainability transitions. This paper examines the mechanisms through which environmental regulations affect industry employment, incorporating the role of industrial linkages in sustainable labor market adjustments. Using panel data from 34 Chinese industries (2009–2018), this study empirically analyzes how stringent regulations influence employment dynamics, considering variations in technology and pollution intensity. The findings reveal a U-shaped relationship between environmental regulations and employment, accompanied by downward network spillover effects. Furthermore, threshold regressions demonstrate industry-specific effects, wherein clean and high-tech industries experience minimal short-term disruptions but benefit from regulatory intensity in the long run. In contrast, low-tech and pollution-intensive industries face notable direct and spillover effects, with low-tech sectors exhibiting job creation effects and pollution-intensive sectors experiencing displacement effects. To achieve sustainable employment structures while maintaining environmental integrity, policymakers must recognize inter-industry linkages and implement targeted policies that support sectoral transitions toward green and high-tech advancements. Encouraging upstream improvements to enhance downstream sustainability will be essential for balancing regulatory enforcement with long-term employment stability.

1. Introduction

The life quality of people is closely intertwined with the ecological environment state. The robust economic development of China has long relied on a traditional industrial structure, which has propelled rapid economic growth in the country to a certain extent. Nevertheless, simultaneously, economic development has also cast a looming ecological shadow. As a result, a wider range of concerns such as excessive resource consumption, environmental/ecological pollution, climate change, and global warming have become increasingly pronounced over time. Accordingly, the World Bank (2007) Report states that 12 out of the 20 cities with the most severe air pollution worldwide were situated in China. At the same time, China also grappled with serious environmental problems such as water and soil pollution. Consistent with this, 28% of groundwater samples in China between 2000 and 2012 exceeded the maximum pollutant levels specified by the World Health Organization (WHO) (Gu et al., 2013 [1]). Furthermore, nearly 17% of China’s agricultural soils exceeded safe standards for heavy metal content (Zhao et al., 2015 [2]). As the impact of environmental pollution on our country’s economic development and people’s livelihoods becomes increasingly severe, the public’s call for a sound ecological environment grows ever more pronounced. Distinctively, the impact of environmental regulation on employment in China is unique due to several factors. First, the nation’s industrial structure is heavily reliant on energy-intensive and polluting sectors, including manufacturing and heavy industry, which are the primary targets of environmental regulation. As these sectors are critical to both regional and national economies, the transition towards cleaner, greener industries poses both challenges and opportunities for labor markets. In particular, the rapid pace of industrial restructuring, often mandated by governmental policies such as the “Green Development” agenda, can lead to significant shifts in employment, creating job losses in traditional industries while fostering growth in renewable energy, environmental technology, and clean manufacturing sectors. Second, the disparity in regional development within China further exacerbates the impact of environmental regulation on employment. While coastal and more developed regions may benefit from cleaner technologies and greener industries, central and western regions, which are more reliant on heavy industry and natural resources, may experience higher costs associated with compliance with environmental standards. This uneven spatial distribution of employment effects creates unique challenges in balancing ecological goals with the need for employment stability, particularly in areas where the labor market may already be strained. Moreover, the relationship between environmental regulation and employment in China is also influenced by the country’s rapidly growing urbanization. The shift of industries from more heavily polluted urban areas to suburban and rural areas in response to stricter regulations can create geographical imbalances in labor demand. In the short term, this can lead to job displacement in certain sectors, especially in regions where economic transition is slower or where industries are unable to adapt quickly to regulatory changes. However, over the long term, the shift towards cleaner industries and the creation of green jobs may offer opportunities for sustainable employment growth, particularly as China invests in green technologies and infrastructure. In this context, enhancing environmental management and improving the ecological environment have become priority considerations for governments at all levels across the nation. Environmental regulation acts as the most direct instrument for improving ecological quality. Nevertheless, such regulation primarily targets the energy-intensive and highly polluting industrial enterprises; thereby, elevating their mean production costs. As a result, such a burden of heightened cost may reduce labor employment and raise industry entry barriers; thus, stimulating certain enterprises to exit the market and further diminishing employment opportunities. To sum up, these outcomes are encapsulated in the notion of the “cost effect” [3] (Siebert, H., 2017. Porter and Linde, 1995). At the same time, the Porter hypothesis postulates that ecological regulation compels enterprises to boost innovation, in order to improve their product competitiveness. Coupled with the adoption of new equipment and technologies, this phenomenon can result in increased employment, referred to as the “innovation effect” of environmental regulation on employment. Hence, environmental regulation optimizes the industrial structure; thereby, accelerating the decline of certain industries while promoting the expansion of others. As a consequence, such a dynamic leads to labor surpluses in declining industries and labor shortages in expanding industries (Song et al., 2021 [4]). Moreover, ecological regulation inherently features continuous adjustment, optimization, and phased governance which results in a phased effect on labor demand across industries (Li et al., 2023 [5]). At present, the patterns and influential mechanisms by which environmental regulation impacts labor demand remain uncertain, warranting theoretical analysis and empirical analysis. Thus, the study findings shall assist in recognizing the structural changes in labor demand during the implementation of environmental regulations; thereby, extending theoretical support for the complementary integration of ecological and employment benefits.
In light of an in-depth review of existing literature, it becomes evident that the influences of environmental regulations on employment are multifaceted and complex (Guo et al., 2020 [6]; Jing et al., 2023 [7]). The first perspective suggests that environmental regulations exert a negative impact on labor employment. Firstly, environmental regulations as external shocks, force labor-intensive, and pollution-emitting corporations to divert a substantial portion of their productive investments toward emissions reduction and pollution control. Thereafter, the subsequent rise in production costs and lower profit margins leads to a significant decline in the “brown” employment. Raff et al. (2020) [8] utilized panel data from the chemical manufacturing industry, in order to empirically investigate the adverse influence of ecological regulation policies of government on labor by including enforcement and supervision as regression variables. Similarly, Liu et al. (2017) employed the difference-in-differences (DiD) method and inferred that environmental regulations exert an adverse influence on employment in business firms, especially private enterprises, within the textile and printing industry of China [9]. Afterward, based on a difference-in-differences-in-differences (DDD) identification strategy, Liao et al. (2024) concluded that the higher the intensity of environmental governance in pollution-intensive enterprises, the lower their labor demand [10]. Meanwhile, using a decade of enterprise-level panel data, Liu et al. (2021) confirmed that labor in the Chinese manufacturing sector is more susceptible to the effects of environmental regulations [11]. This implies that there exists industry heterogeneity in terms of the impact of environmental regulations on employment levels. Besides, the researchers emphasized that enforcement of ecological regulations also increases the probability of business relocation (Li et al., 2021), which lessens the employment demand in cities with stricter environmental regulations, specifically in labor- and pollution-intensive industries [12]. For example, Kahn and Mansur (2013) [13], using data from different regions in the United States, analyzed data from various regions in the United States and posited that the same carbon tax policy led to employment losses in the northeastern region that were 7.12 times larger than those in California. Thereafter, Wang et al. (2022) used the ecological footprint method to calculate the environmental costs of China’s industrial participation in the global value chain [14], employed a global value-chain perspective, and established that the cost of environmental regulations adversely affected employment in the eastern region but exhibited an insignificant influence on employment in the western and central regions; thereby, reflecting spatial heterogeneity in the effect of ecological regulations on labor employment. Finally, the influence of environmental regulations on labor employment differs in accordance with the skill level, with low-skilled labor being subjected to substantial negative effects. Subsequently, Chen (2023), using census and firm-level data to design instrumental variables, confirms that regulatory oversight of SO2 pollution declined the net business growth in target regions and industries; thus, directly leading to lower local employment growth [15]. Nonetheless, the distribution of aforementioned negative employment influence varies based on the skill level, with workers backed by college education extremely less impacted by environmental regulation policies. Parallel to this, Li et al. (2023) analyzed the micro-level changes in internal labor demand using city-level data and data from publicly listed companies [5]. They employed a DID model to investigate the labor reallocation resulting from China’s Clean Air Action (CAA) from 2013 to 2017. Their study results pointed out that the effect of the CAA on urban employment principally manifested as job destruction. Despite this, business organizations tended to hire more high-skilled workers, in response to the impact of environmental regulations. This highlights that there is skill heterogeneity in the influence of environmental regulations on labor employment levels. In short, the effect of environmental regulations on labor employment levels is multifaceted, involving skill heterogeneity, industry heterogeneity, and spatial heterogeneity. Therefore, it is essential to perform further research into the mechanisms and interactions of these different influencing factors for an effective comprehension of the correlation between environmental regulations and employment.
The second perspective holds that environmental/ecological regulations uplift labor employment levels, with environmental regulations augmenting labor demand through two primary pathways, namely technological innovation and industry structure adjustment. Firstly, environmental regulations impose stricter limits on high-energy consumption and high-pollution industries; potentially, leading business firms to shift towards low-carbon and cleaner sectors (Zhong et al., 2015) [16]. The proposed industry structure adjustment creates new employment prospects, especially in the fields related to waste management, renewable energy, and environmental technology. Accordingly, Cao et al. (2017) adopted a mediation model to explore the effect of environmental regulations on employment [17]. Their study results illustrated that stringent environmental regulations incentivize the industry structure upgrades; thus, absorbing a substantial amount of labor while conserving ecological resources. Secondly, in the context of Porter and Vanderlinde’s hypothesis (1995), proper environmental regulations can trigger corporations to engage in research and development (R&D) and innovation [18]; consequently, minimizing production expenses, fostering competitive edges, expanding the business scale, and leading to higher labor demand. Explicitly, Bu et al. (2022) [19] employed propensity score matching (PSM) and difference-in-differences (DID) methodologies to conduct an empirical analysis of employment in the context of continuous education and training in China, using panel data from listed companies between 2009 and 2019 [1]. Their study confirmed that environmental regulations allowed pilot enterprises to expand their employment through R&D/innovation. Consistent with this, Hille and Möbius (2019) utilized a dual empirical strategy to analyze the relationship between energy prices and employment [20]. They believe that technological innovation exerts emission-reducing and energy-saving impacts; thereby, creating new labor demand, such as the emergence of new job positions resulting from the development of new processes and products.
The third perspective advocates that environmental regulations exert a non-linear influence on labor employment. Research studies illuminate that there exists a negative association between environmental regulations and labor employment in the short term, but their positive impacts become more pronounced in the long term (Nondo & Schaeffer, 2012) [21]. Moreover, Qin et al. (2022) constructed a nonlinear panel regression model using data from Chinese prefecture-level cities [22]. Their findings demonstrate that the impact of environmental regulations on employment gradually shifts from inhibiting to promoting as there is an optimal adjustment of industry structures. On the basis of panel data from 38 industrial sectors in China for the time period ranging from 2003 to 2010, Wang et al. (2013) reported a U-shaped relationship between environmental regulations and employment, characterized by an initial suppressive effect followed by a succeeding promotional influence [23]. Subsequent to that, Yu et al. (2021) constructed a panel model using provincial data from China [24]. Their study findings established that the tertiary sector possesses a “green” comparative advantage, and increasing its share can concurrently yield dual benefits for both ecological protection and employment.
To sum up, most research scholars have predominantly emphasized analyzing the direct effect of environmental regulations on labor employment while most often ignoring the transmission influences of environmental regulations on employment, particularly the examination of such influences in the context of industry linkage; an area that has been rarely explored in the extant literature. Present studies most often emphasize the backward and forward linkages within industries, concentrating on how possible changes in the production, output value, and technology within a sector directly or indirectly influence the upstream and downstream industries. This approach further explores the possible effect on enterprise innovation (Chakraborty and Chatterjee, 2017 [25]), the transmission of industrial innovation, and the mutual promotion among industries (Franco and Marin, 2017 [26]). Furthermore, the inter-industry linkages underscore the shared knowledge base among different industries which lowers the costs of exchanging technological and material resources between sectors. Consequently, this escalates the potential for collaborative innovation across industries; thereby, promoting the spillover effects of skills and knowledge (Su et al., 2023 [27]. Ellison et al., 2010 [28]). As a matter of fact, different industries tend to display clustering development trends driven by knowledge spillover effects, shared intermediate inputs, and abundant labor pools; hence, extending possibilities for the transmission impacts of environmental regulations (Ellison et al., 2010 [28]; Helsley & Strange, 1990 [29]). Simultaneously, upstream–downstream industry linkages and labor mobility between industries serve as critical pathways for producing transmission effects (Acemoglu et al., 2016 [30]).
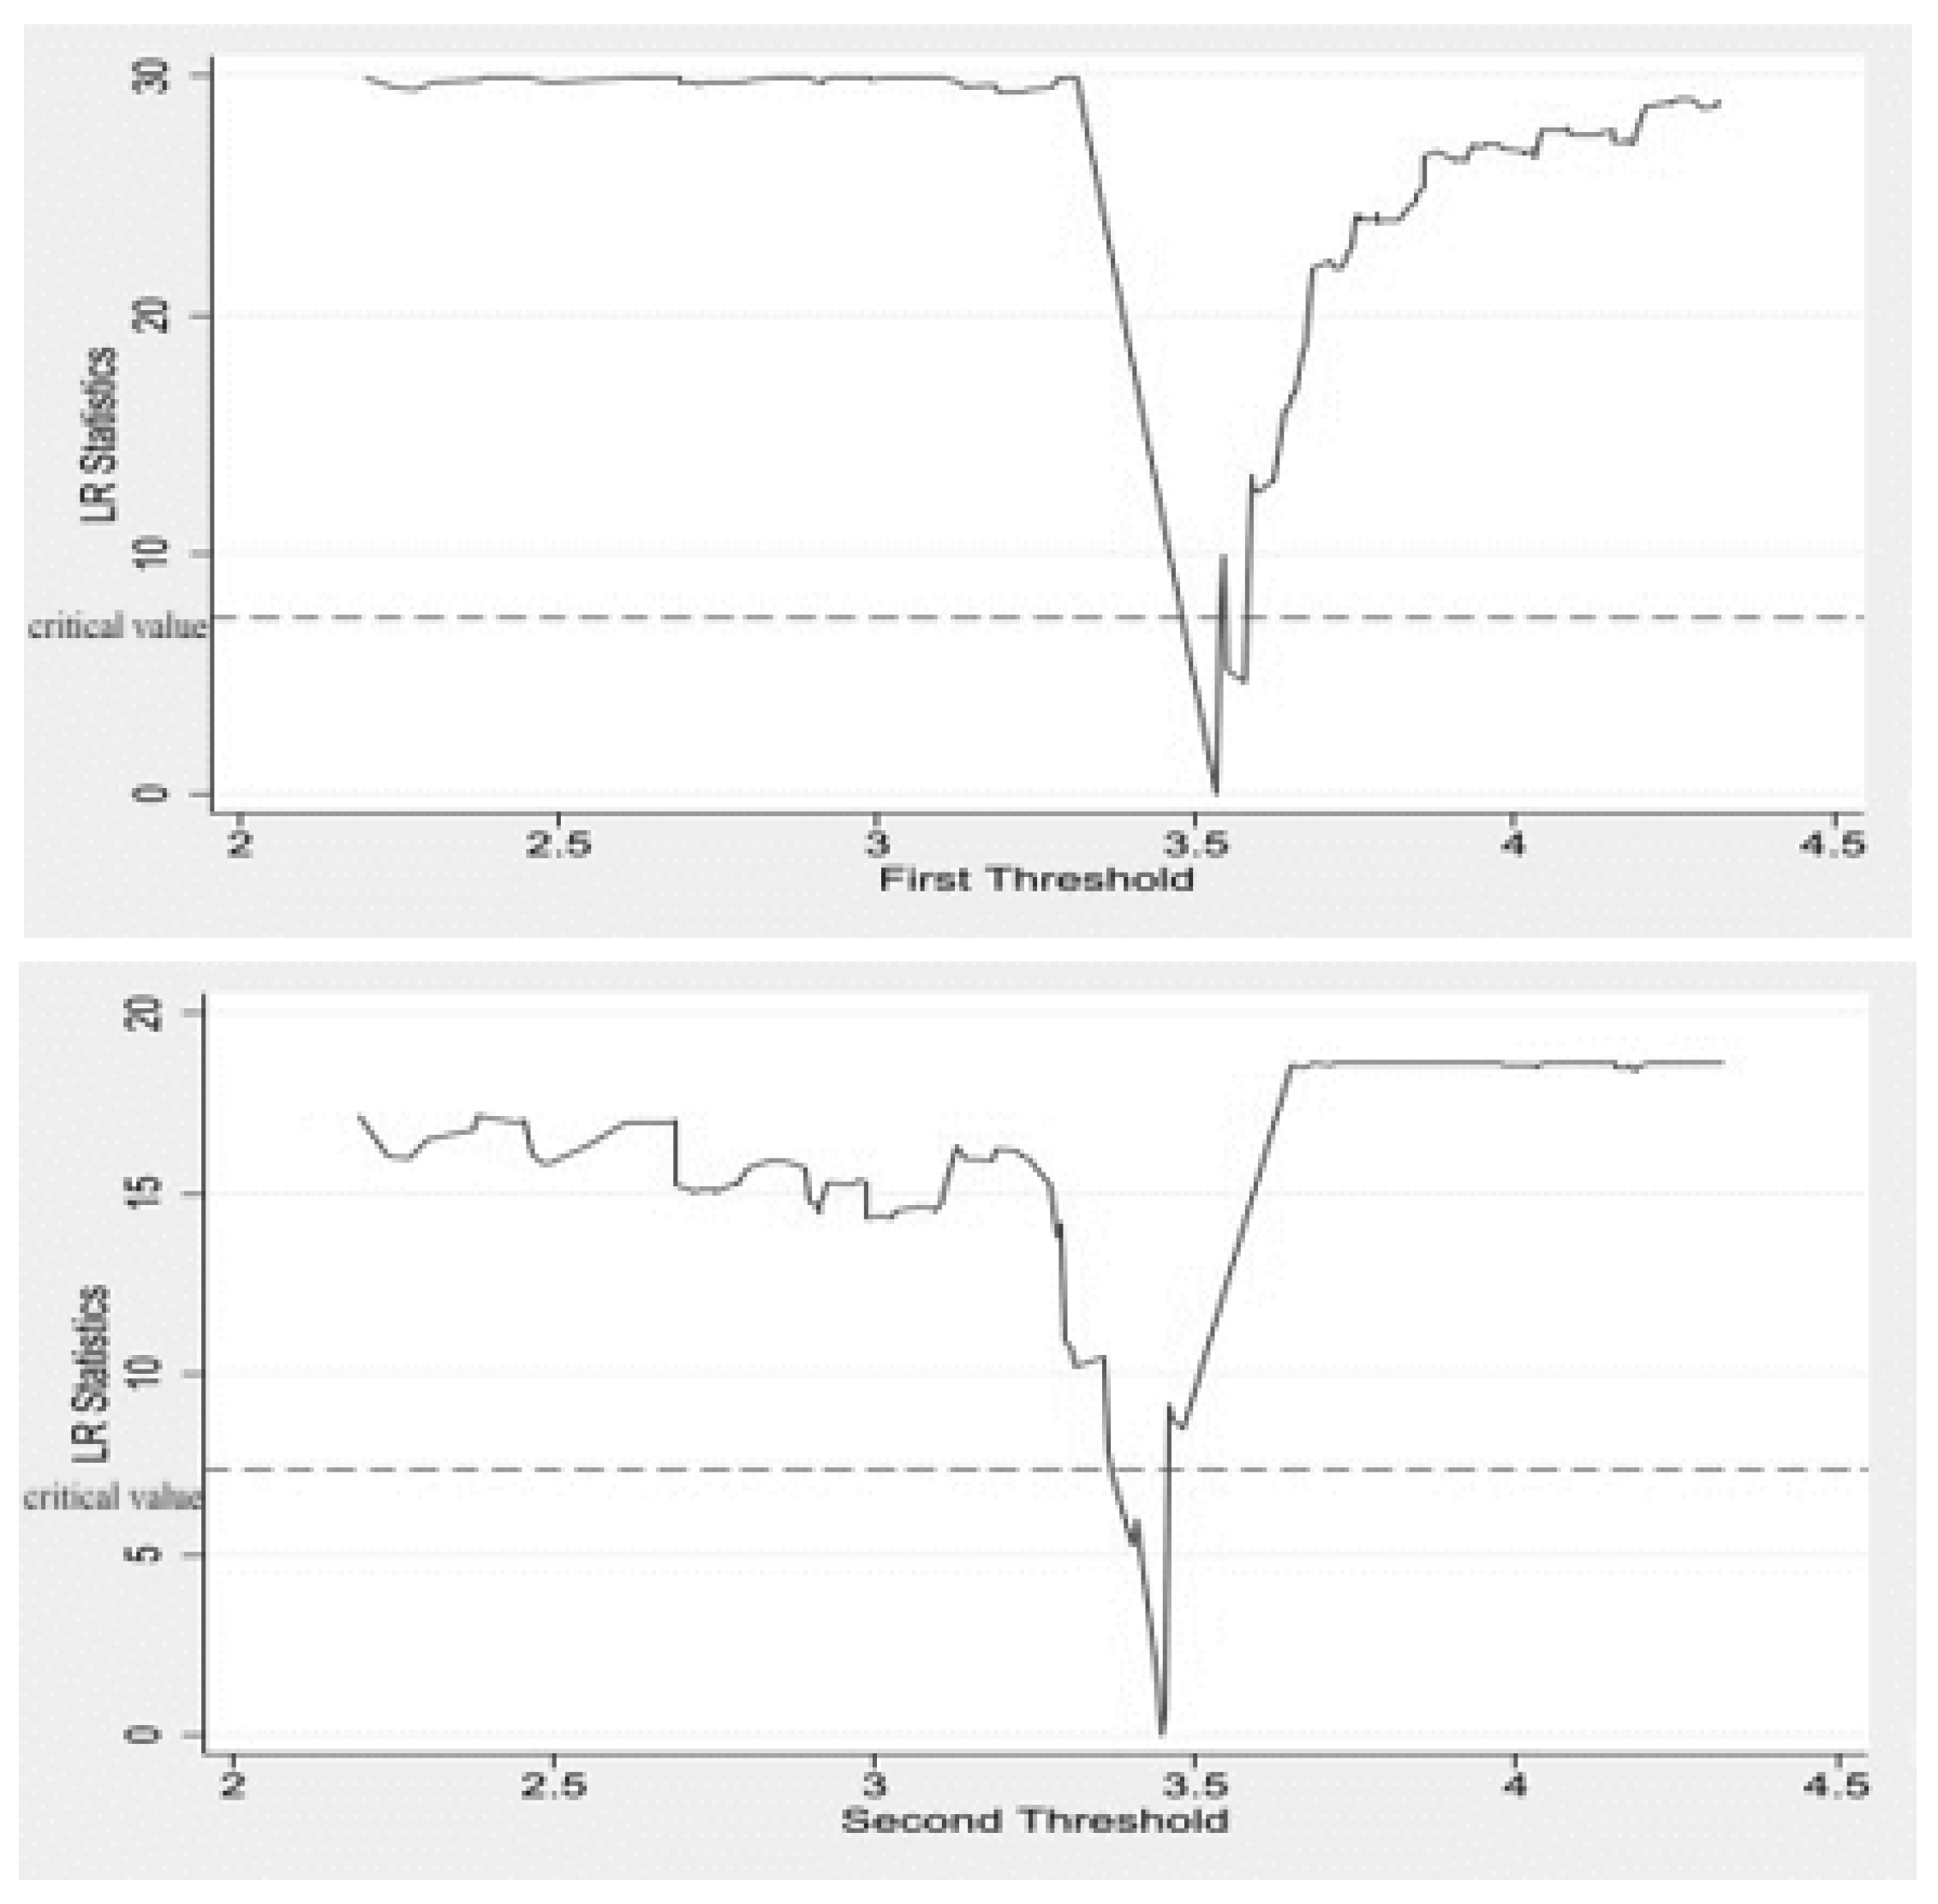
From the perspective of industrial interconnection and based on the aforementioned considerations, this research article incorporates input–output connection matrices to quantitatively ascertain the transmission influence of ecological/environmental regulation on the upstream and downstream networks of labor employment levels within industries. Subsequent to this, using panel data modeling, this paper explores the mechanisms through which both direct and indirect environmental regulation affects the labor employment levels within industries. Finally, this study further examines the evident nonlinear effects and heterogeneous impacts of environmental regulation on labor employment levels by employing threshold regression and heterogeneity analysis, respectively. As a result, the potential marginal contributions of this study are as follows: Firstly, based on a network-oriented research perspective, this research paper elucidates the influential mechanism of environmental regulation on labor employment levels between industries from the industrial interconnection viewpoint; thereby, offering valuable insights and attempting to enrich and enhance the theoretical approaches related to inter-industry labor employment in China. Secondly, conversely to the existing theories on the spatial spillover effect, associated with the effect of environmental regulation on employment structures, this research article decomposes the spatial spillover into upstream and downstream network transmission effects, from a supply–demand perspective; consequently, exploring the potential impacts of transmission in different directions on labor employment levels within China’ industries. As a result, this study attempts to extend a theoretical foundation for the analysis of balanced labor market structures.

2. Mechanism Analysis

Assuming the tight inter-industry input–output associations, as well as the characteristics of ecological concerns—such as mobility, externalities, and connectivity—, the influence of environmental regulation on industry employment is not confined to the industry itself. Such an effect can also substantially impact the employment scale of related industries (Li and Li, 2024) [31]. From the labor market theory perspective, the relationship between environmental regulation and employment is influenced by supply and demand dynamics in the labor market (North,1990) [32]. When regulations increase the cost of production, firms may reduce labor demand, particularly in labor-intensive industries or sectors with limited capacity to innovate. On the other hand, environmental regulations can also drive the creation of new employment opportunities, particularly in industries related to green technology, renewable energy, and waste management, as firms adapt to new market demands and technological innovations. Labor market theory suggests that these changes are also influenced by factors such as labor mobility, wage adjustments, and skill mismatches, which determine how labor is redistributed across sectors (Porter and Linde, 1995) [18]. The interaction between regulatory measures and labor market outcomes is therefore complex and depends on the interplay between the supply of labor, the nature of job displacement, and the creation of new opportunities within emerging sectors. Notably, the mechanisms through which environmental regulations impact employment vary significantly across different ecological environments. Air pollution-related regulations primarily target high-emission industries such as manufacturing and energy, potentially leading to job losses in high-pollution firms while simultaneously driving employment growth in low-carbon technologies and green manufacturing. Land-based industries (such as agriculture and mining) are more affected by soil and water pollution control policies, which may necessitate adjustments in traditional production methods, causing short-term employment fluctuations but fostering the long-term development of ecological agriculture and environmental restoration industries. Ocean-based industries (such as fisheries and shipping) are subject to marine pollution control and carbon emission regulations, which may lead to contractions in traditional fishing and shipping sectors while simultaneously stimulating growth in sustainable fisheries, green shipbuilding, and new energy-powered maritime transportation. For underwater industries (such as offshore oil and gas extraction and deep-sea mining), stricter environmental regulations impose higher compliance costs and technological requirements, driving the advancement of environmentally friendly exploration technologies and sustainable resource development, thereby reshaping employment structures within these sectors. Therefore, this section theoretically determines the effect of environmental regulation on industry employment scale from two key perspectives: the direct effect on the supply and demand of the labor market, and the network transmission influence, as depicted in Figure 1. The inclusion of institutional theory and labor market theory allows for a more comprehensive understanding of how environmental regulations can reshape both industry structures and employment dynamics, reinforcing the theoretical framework of this study. Therefore, this section theoretically determines the effect of environmental regulation on the industry employment scale from two key perspectives, namely the direct effect on supply and demand of the labor market, and the network transmission influence, as depicted in Figure 1.

2.1. The Direct Mechanism of Environmental Regulations on Labor Employment Levels

In specific, environmental regulations exhibit a direct effect on labor employment when these regulations impact the core industries. Nonetheless, the proposed influence is heterogeneous. On the one hand, pollution-intensive industries may need to reduce production scale or undertake high-cost pollution control measures, in order to comply with stringent environmental standards; thereby, resulting in higher production costs, increased product prices, reduced demand, and consequently coercing enterprises to downsize employment positions and scale down production. Eventually, this cost effect demonstrates a negative impact on labor employment. Contrarily, the strengthening of ecological regulations in clean and eco-friendly industries may stimulate technological innovations and changes in production approaches; hence, offering new employment prospects for labor (Liu et al., 2021 [11], Yu et al., 2022 [33], Zheng et al., 2022 [34]).
On the other hand, high-tech industries most often incorporate advanced ecological equipment and technologies, leading to reduced levels of pollution emissions. Partially, these industrial sectors may have already adapted to the requirements of environmental regulations while exerting a relatively minor influence on labor employment (Mishra and Smyth, 2012 [35]; Ren et al., 2020 [36]). Although, industries with lower technological levels may encounter serious challenges, warranting more resources to upgrade their technological setup, in order to fulfill the demands of environmental regulations (Wang et al., 2020) [14]. Based on this, the technological proficiency and pollution levels of various industries play an imperative role in the non-linear effect of environmental regulations on labor employment. As a result, this study puts forward Hypothesis 1 as follows:
Hypothesis 1:
The direct effect of environmental regulations on labor employment levels is non-linear.

2.2. The Indirect Transmission Mechanism of Environmental Regulation on Labor Employment Levels

Social network theory reports that network intermediaries propagate external shocks (Huo et al., 2022 [37]); hence, impacting other elements of the entire economic system, and thereafter, producing indirect influences on various aspects such as employment, income, and economic growth (Helbing, 2013) [38]. Therefore, environmental regulation as a source of demand and supply shocks for micro-enterprises, is able to transmit through industry linkages to influence their downstream or upstream counterparts. This significantly impacts the entire industry chain and triggers macroeconomic fluctuations. As a consequence, industry linkages are expected to stimulate the transmission impacts of environmental regulation on employment levels (Grassi, 2017 [39]; Qi and Li, 2019 [40]).
The dense connections among industries in the input–output network illustrate that the industries are interconnected through input and output connections, with no isolated industries. Evidently, any external shock impacting one industry shall transmit upstream or downstream through this network (Luo, S., 2020) [41]. In the context of a three-sector example, as illustrated in Figure 2, there is an increased output and labor demand in A2 when a positive demand shock, expressed as Z, influences A2. Resultantly, the amplified demand for A2’s output triggers an uplift in the demand for A1, resulting in a higher labor demand in A1. On the same note, there is an increase in the A3’s output and labor force when a positive demand shock; symbolized as W, affects A3. This propagates upstream and stimulates a rise in the demand and labor force in A2, which, ultimately influences A1. Hence, A1 encounters a combined positive effect on its labor employment level from shocks W and Z, with the proposed impacts being transmitted through A3 and A2.
In terms of the supply side, most often environmental regulations applied to an upstream industry serve as a catalyst for innovation within that particular industry (Steinbrunner, 2022 [42]). Owing to the close interrelation among industries (Storper and Venables, 2003 [43]), the emergence of new business models, products, and technologies within an industry tends to compel downstream firms to be involved in new product development and purposeful innovation (Srinivasan, 2017 [44]). Eventually, this surges the industry’s demand for labor; thereby, stimulating a positive supply shock for downstream industries. On the demand side, when environmental regulations are imposed on a downstream industry, it often responds by enhancing technological capabilities or compromising product quantity, in order to comply with environmental constraints. Concurrently, both approaches produce cost effects within the industry (Dai et al., 2022 [45]). Generally, this decreases the demand for products from upstream industries and creates a negative demand shock on the employment scale of upstream industries (Chu et al., 2019) [46].
Hypothesis 2:
Industrial linkages shall induce network transmission influences of environmental regulations on employment levels.
Hypothesis 3:
Environmental regulations demonstrate positive supply impacts on the labor employment levels in downstream industries.
Hypothesis 4:
Environmental regulations exert negative demand effects on the labor employment levels in upstream industries.

3. Variables and Data Sources

3.1. Variable Descriptions

In this paper, the study period spans from 2009 to 2018. Given the lack of timeliness in data sources such as WIOD, ADB-ICIO, and GATP-ICIO, as well as the issue of discontinuity in China’s input–output tables, the authors chose to utilize the 2021 OECD data on inter-country input–output tables. The OECD database is widely recognized for its accuracy and reliability, as it is regularly updated and follows internationally accepted standards. This makes the 2021 OECD data highly suitable for our study, ensuring a robust foundation for analyzing inter-industry relations and employment impacts across multiple countries. The data were classified in accordance with the National Economic Industry Classification (GB/T 4754-2017), and subsequent consolidation of certain detailed industries was performed, see Appendix A. Numerical codes were then assigned to these consolidated industry sectors to ensure clarity and consistency in the analysis. This choice of data not only enhances the reliability of our results but also allows for a comprehensive and comparable analysis within the global context.
(1) Dependent/explained variable: Employment level ( l n L ) . By taking the logarithmic difference of the total number of employees, this variable estimates the average number of employees in each industry. Meanwhile, data for the industrial sector are sourced from the China Industrial Statistical Yearbook and China Statistical Yearbook.
(2) Key independent/explanatory variable: Environmental regulation impact variable ( l n E R ). At present, there is no consensus in academia regarding a standardized estimate of environmental regulation. Therefore, current studies often adopt alternative indicators for measurement, such as pollution tax revenue, industrial pollution control investment, the number of environmental policies, and compliance rates for industrial wastewater and gas emissions. Though, the aforementioned indicators essentially scale the environmental regulation in the context of pollution control; thus, may not comprehensively reflect its actual effects. Reportedly, Kheder (2008) and others recommend the use of G D P / E n e r g y as an estimate of environmental regulation [47], as this variable can effectively reflect the real effect of government/state regulations on the environment. In general, holding GDP constant, the lower the energy consumption, the less environmental pollution is produced, reflecting better actual influences of ecological regulation. Given the benefits of the aforementioned indicator, this research paper also employs G D P / E n e r g y as an alternative measure of environmental regulation. Certainly, a higher value of this indicator suggests stronger environmental regulation in the industry. Furthermore, GDP data for different industries are retrieved from value-added data in the input–output table, whereas energy consumption data are mainly derived from the China Statistical Yearbook. Owing to the unavailability of energy consumption data for some subsectors within the service industry, this study adopted the approach proposed by Bai and Meng (2017) [48]. Correspondingly, the total energy consumption of the service industry is allocated based on the final use ratios of the five major energy sectors, namely: “Coal Mining and Washing,” “Petroleum Processing, Coking, and Nuclear Fuel Processing”, and “Petroleum and Natural Gas Extraction”, “Gas Production and Supply”, and “Electricity and Heat Production and Supply,” as depicted in the input–output table.
(3) Downstream network effects (downstream)
Notably, the total impact of a supply shock in a specific industry that gradually propagates downstream through the input–output network is referred to as the impact variable of downstream transmission. The aforementioned effect can be captured using the Leontief inverse matrix (Acemoglu et al., 2012, 2016) [30]. The mathematical expression of downstream transmission effects is as follows:
D o w n s t r e a m i , t 1 = j a ~ i j , t 1 × z i , t 1
Here, z i , t 1 symbolizes the shock variable, a ~ i j , t 1 represents the corresponding element of the Leontief inverse matrix I A ~ , which serves as the input–output coefficient:
a ~ i j , t 1 = S a l e s   o f   s e c t o r   j   t o   s e c t o r   i   i n   y e a r t 1 T o t a l   o u t p u t   o f   s e c t o r   i   i n   y e a r t 1
(4) Upstream network effects (upstream)
In specific, the cumulative influence of a demand shock propagating upstream through the input–output network to impact a certain industry is referred to as the upstream transmission impact variable (Acemoglu et al., 2012, 2016) [30,49]. The calculation is as follows:
U p s t r e a m i , t 1 = j a ^ j i , t 1 × z i , t 1
a ^ j i , t 1 is gauged based on the input–output table while representing the share of the sector i’s inputs to sector j out of the sector i’s total demand in year(t − 1):
a ^ j i , t 1 = S a l e s   o f   s e c t o r   i   t o   s e c t o r   j   i n   y e a r t 1 T o t a l   o u t p u t   o f   s e c t o r   i   i n   y e a r t 1
(5) Control variables. ① Economic development level (lnGDP): The economic development level is predicted by the aggregate value of production across various industries. ② Average wage ( l n W a g e ): This variable represents the average wage of urban employed persons by industry. ③ Capital intensity level ( l n F i x e d ): The fixed asset investments (in billions) by industry are used to predict capital intensity level. ④ Labor productivity ( l n L a b o r): The proportion of annual value-added to the number of employed individuals by industry is employed to measure labor productivity. Under the condition of constant overall social production, an increase in labor productivity lessens the total demand in the labor market; possibly, leading to a downfall in overall employment size ⑤ Market structure level ( l n s ): Explicitly, industries with larger mean enterprise sizes have higher market structure levels. In particular, the average enterprise size in a certain industry is estimated by the proportion of total output value to the total number of enterprises in that industry. ⑥ Trade openness (Trade): Trade openness is anticipated by the proportion of total imports to GDP. The aforementioned data are sourced from the China Statistical Yearbook, the China Industrial Statistical Yearbook, the China Labor Statistical Yearbook, the China Third Industry Statistical Yearbook, and the OECD Input–Output Tables.

3.2. Descriptive Statistics

In order to minimize the influence of data collection errors and other factors on the empirical results, this paper carried out Winsorization on control variables; thereby, eliminating data points beyond the 1st percentile and the 99th percentile to exclude anomalies, outliers, and unreasonable data. Accordingly, the descriptive statistics of the relevant variables are populated in Table 1.

3.3. Model Specification

Primarily, the first step is to test the association between environmental regulation and employment levels as hypothesized in Hypothesis 1; thus, exhibiting both the non-linear direct influences and the indirect transmission influences of environmental protection on employment levels.
Firstly, the quadratic term of the environmental regulation variable is introduced into the model, in order to ascertain the non-linear relationship between environmental regulation and labor employment levels. Meanwhile, high-pollution and low-technology industries are inclined to suffer more significant shocks, with the strengthening of environmental regulation. This leads to a decline in the labor employment. As a result, high-technology and low-pollution industries may benefit from environmental regulation to a certain extent due to their higher innovation capabilities and technological advancements; thereby, permitting them to not only effectively adapt to changes but also increase or maintain the labor demand.
Secondly, in order to confirm the presence of indirect transmission impacts of environmental regulation on labor employment levels, this research study incorporates virtual variables for network transmission effects to ascertain whether environmental regulation exerts an indirect transmission effect on labor employment. Noticeably, environmental regulation may produce spillover influences in the industry network by impacting the interrelationships of enterprises, leading to changes in the demand for industry labor employment.
In short, the baseline model is expressed in Equation (1):
l n L i , t = α + β 1 l n E R i , t 1 + β 2 l n E R 2 i , t 1 + β 3 D + Z i , t 1 φ + e i + v t + ε i , t 1
Here, i indicates industries; t stands for years; Z i , t 1 presents control variables;   D means dummy variables, with D = 1 when industry i is a polluting industry, while D = 0 when industry i is a clean industry; e i hows individual fixed effects;   v t depicts time-fixed effects; and ε i , t 1 signifies the random error term.
According to Hypothesis 2, the second step is to further exhibit the indirect network transmission effects of environmental regulation on labor employment levels. For this purpose, the aforesaid influences are decomposed into upstream and downstream transmission effects. Accordingly, the specific model is expressed as follows:
l n L i , t = α + β 1 l n E R i , t 1 + β 2 l n E R 2 i , t 1 + β 3 D o w n s t r e a m i , t 1 + β 4 U p s t r e a m i , t 1 + Z i , t 1 φ + e i + v t + ε i 1
i symbolizes industries; t denotes years; Z i , t 1 reflects control variables; D o w n s t r e a m i , t 1 represents downstream network effects; U p s t r e a m i , t 1 exemplifies upstream network effects; e i reflects individual fixed effects; v t means time-fixed effects; and ε i shows the random error term.
In models (1) and (2), the dependent variables are lagged by one period as policy shocks often have lagged effects.

4. Analysis of Empirical Results

4.1. Stationarity Test and Cointegration Relationship Test

Owing to the effect of the same macroeconomic environment and policies on employment across various industries, and the spillover effects of technological innovation along the industry chain impacting employment in multiple sectors, there exists cross-sectional dependency. The proposed dependency may lead to biased regression outcomes. In order to address the problem of cross-sectional dependency, this study adopted the Pesaran (2021) cross-sectional dependence test to explore the independence of cross-sectional data [50]. Table 2 presents the results of the aforementioned test, which shows that all data rejects the null hypothesis; thus, confirming the existence of cross-sectional dependence.
If there is no correlation among cross-sections, first-generation panel unit root tests can be applied. Conversely, if cross-sections exhibit correlation, second-generation methods are more appropriate. The CIPS test, developed by Pesaran, is an improved version of the IPS test. It considers the influence of cross-sectional correlation. The results are presented in Table 3.
All variables are stationary after the first differencing. Therefore, it is necessary to conduct a cointegration test on the panel data (Yilanci, V., et al., 2022) [51]. The Pedroni cointegration test accommodates varying cointegration relationships across individual units, unlike other common methods, such as the Kao and Fisher tests, which generally assume homogeneity in these relationships. As a result, the Pedroni test is better suited for panel data that exhibit heterogeneity. The results of the Pedroni cointegration test indicate the existence of a long-term equilibrium relationship between the variables, allowing us to proceed to the next step of regression estimation (Table 4).

4.2. Baseline Regression Analysis

Based on the outcomes of the Hausman test, this study adopts a two-way fixed effects model to effectively address cross-sectional dependence and heteroscedasticity. In addition to this, clustered standard errors are utilized to adjust the standard errors of the estimators; thereby, increasing the accuracy of estimates.
As per Table 5, the first-order and second-order terms of the environmental regulation variable in Model 1 are negative and positive, respectively. This highlights that the direct effect of environmental regulation on labor employment levels is nonlinear; thereby, demonstrating a U-shaped trend, consistent with the findings of Qin et al. (2022) [22]. Further, the coefficient of the first-order term ( l n E R ) is negative; consequently, indicating a direct negative influence of environmental regulation on labor employment levels. Additionally, the positive coefficient of the second-order term ( l n E R 2 ) reflects that the proposed direct impact displays nonlinear characteristics. From a producer’s standpoint, certain pollution-intensive industries need to either bear expensive pollution control costs or reduce production scale, with an increase in the intensity of environmental regulation; thus, leading to a decline in labor demand. This illuminates the stage where the cost impacts of environmental regulation take over. Though, certain industries or firms are encouraged to engage in green technology innovation and enhance technological upgrades, as environmental regulations become more stringent. In turn, this gives rise to eco-friendly new technologies, formats, models, and industries, driving industrial structural transformation and upgrading, as well as replacing or phasing out outdated industries. Resultantly, new employment opportunities are produced, leading to an increment in labor employment. The proposed phase represents the period where the influences of creation come into effect. In the meantime, the net impact of environmental regulation on labor employment depends on the joint effect of cost influences and creation influences while varying with the intensity of environmental regulation.
In Model 2, a virtual variable “D” is presented to account for network transmission effects. The positive and significant coefficient of “D” illustrates that environmental regulation indirectly transmits through the industry-relevant network; consequently, affecting labor employment levels. This further validates Hypothesis 2 in this paper. The study proceeds to analyze the directional influences of transmission on labor employment levels while examining whether there exist upstream and downstream network impacts of environmental regulation within the input–output network.
As shown in the third column, the results establish that the coefficient of the “Downstream” variable is significantly positive when the “Downstream” variable is introduced to test for downstream network effects within the input–output network. This implies that the positive supply shock induced by environmental regulation propagates downstream within the input–output network; hence, exerting a positive impact on labor employment levels in downstream industries. As a result, Hypothesis 3 is validated in this study. In addition, Model 4 results exhibit that the coefficient of the “Upstream” variable is not significant when the “Upstream” variable is introduced, in order to examine the existence of upstream network effects of environmental regulation within the input–output network. This denotes that the environmental regulation in the short term does not significantly impact the labor employment levels in the upstream labor force of the industry, which contradicts Hypothesis 4 of this study since upstream industries may mitigate the adverse influences of environmental regulation by improving efficiency, reducing costs, and optimizing their production processes. Moreover, upstream industries may expand their product range or seek alternative markets, in order to lower their dependence on downstream industries; thereby, alleviating the effect of environmental regulation on their labor demand. The proposed strategies warrant substantial time for both implementation and adjustment. Therefore, potential changes in labor employment in the case of upstream industries may not be immediately evident.
Besides, this research paper also performed the analysis of the dual effect’s presence of the “Upstream” and “Downstream” variables. As evident in the fifth column, the coefficient of the “Upstream” variable is insignificant, whereas the significance of “Downstream” is reduced to a certain extent, as compared to the third column. Thus, the researchers infer that a regression analysis without the “Upstream” variable is more precise. Based on this, the network transmission influence of ecological regulation on the industry employment levels essentially demonstrates downstream transmission impacts.

4.3. Heterogeneity Analysis

The strictness of environmental regulations can affect production costs, technological innovation, and adjustments in the industrial chain of an enterprise. Meanwhile, various levels of ecological regulations may lead to varying degrees of influence on labor employment. In line with the previous discussion, there exists a nonlinear correlation between environmental regulations and labor employment. The researchers can realize a more comprehensive understanding of the nonlinear impact of environmental regulations on labor employment by analyzing the effects of environmental regulations at different levels of stringency on employment. Consequently, referring to Hansen (1999), this research study adopts threshold regression techniques [52]. As per this approach, environmental regulations act as the threshold variable, with the downstream network effects and environmental regulations as explanatory variables. This permits the analysis of the effect of environmental regulations on employment at different stringency levels. Further, the specific model is expressed as follows:
l n L i , t = α + β 1 l n E R i , t 1 × I l n E R i , t 1 δ 1 + β 2 l n E R i , t 1 × I δ 1 l n E R i , t 1 δ 2 + β 3 l n E R i , t 1 × I δ n 1 l n E R i , t 1 δ n + β 4 l n E R i , t 1 × I l n E R i , t 1 δ n + Z i , t 1 φ + ε i 1
l n L i , t = α + β 1 D o w n s t r e a m i , t 1 × I l n E R i , t 1 δ 1 + β 2 D o w n s t r e a m i , t 1 × I δ 1 l n E R i , t 1 δ 2 + β 3 D o w n s t r e a m i , t 1 × I δ n 1 l n E R i , t 1 δ n + β 4 D o w n s t r e a m i , t 1 × I l n E R i , t 1 δ n + Z i , t 1 φ + ε i 1
Table 6 and Figure 3 and Figure 4 present the results of the tests. The F-statistic stands at 32.85 in the single threshold effect estimation of environmental regulations, which is significant at the 1% level of statistical significance; resultantly, confirming the statistical significance and rejecting the hypothesis of a linear relationship. Furthermore, the F-statistic is reported to be 7.14 with a p-value of 0.37 in the double threshold test, which does not pass the significance test; thereby, signaling the absence of a double threshold. Additionally, the single threshold value for the direct impact of environmental regulations is recorded to be 2.1951. Therefore, a single threshold regression is utilized for further analysis. On the one hand, the single threshold effect estimation documents an F-value of 7.19 for the downstream transmission effect; while, on the other hand, the double threshold estimation has an F-value of 24.38, both of which are significant. The first and second threshold values are documented to be 3.4466 and 3.5312, respectively.
Based on the threshold values, the parameter estimates were forecasted in accordance with the model. Accordingly, the threshold regression results are exhibited in Table 7. Primarily, results in the first column of Table 4 reveal that the coefficients of environmental regulation are significantly positive on both sides of the threshold. This indicates an overall positive impact of environmental regulation on labor employment. Subsequently, the downstream network effect is positively correlated with labor employment, albeit with a small coefficient of 0.00097, when the lagged one-period environmental regulation intensity is below the first threshold in the second column. However, the coefficient increases significantly to 0.01572 when environmental regulation intensity crosses the first threshold. Afterward, the association between downstream network effects and labor employment becomes negative when environmental regulation crosses the second threshold; thus, reflecting that once environmental regulation intensity reaches a certain level, it exerts a negative effect on employment in downstream industries.
Though various studies have exhibited the adverse influences of stringent regulation, certain research studies have either not fully elucidated these effects or assumed them limited. This article supplements the extant literature by illuminating the suppressive influence of stringent ecological regulation on employment from the standpoint of downstream transmission within the industrial chain.
Furthermore, the impact of environmental regulation’s intensity on employment levels may exhibit heterogeneity due to variations in the stringency of environmental regulations across different industries. Thus, this paper divides all industries into pollution-intensive and clean industries based on their pollution intensity, subsequently scrutinizing the impact of environmental regulations on employment levels across these diverse sectors. Correspondingly, the results are populated in Table 8.
Prominently, regression results analysis discloses that environmental regulation exerts a significant direct and indirect influence on polluting industries. Although, pollution-intensive industries with higher pollution levels, such as steel and coal, experience higher environmental technology costs, their technological capabilities are challenging to rapidly change in response to possible changes in the environmental regulations. This phenomenon exerts significant pressure on these enterprises to reduce their scale; thereby, producing a significant influence of environmental regulation on employment in pollution-intensive industries. However, the sunk costs in the production processes are relatively lower, and upgrading and renovating the technology and equipment are comparatively convenient in case of cleaner industries within manufacturing, such as textile, food, and services, with lower pollution levels. The proposed business firms can adjust their research and innovation strategies aligned with the requirements of environmental regulations, which mitigates the effect of environmental regulation on employment in clean industries. Evidently, the regression results exhibit that environmental regulation in the short term does not exert a direct effect on employment in clean industries. Nonetheless, there exists a downstream positive supply impact, as clean industries offer eco-friendly materials, technologies, or components that can impact the production of downstream industries. In the meantime, downstream industries require technological innovation, in order to adapt to such changes while meeting the environmental regulation requirements, creating new employment opportunities, and maintaining market competitiveness, aligning with the perspective of Mishra et al. (2012) that environmental regulation fosters employment growth in the environmental sector [35].
Thereafter, this paper categorized all industries into high-technology and low-technology sectors, in line with their technological levels (Table 9). Apparently, the regression results confirm significant differences in the influence of environmental regulation on employment between low-technology and high-technology industries. In terms of high-technology industries, the coefficient of the linear term of environmental regulation is insignificant, whereas the coefficient of the quadratic term is significant; hence, implying that the negative impact of environmental regulation on employment in high-technology industries is not prominent while there exists a direct positive impact since high-technology sectors commonly invest excessively in the technological innovation, and R&D. Therefore, these sectors possess the capability to both develop and implement eco-friendly technologies. In addition to this, high-technology industries warrant specialized technical talent and labor when faced with the effect of environmental regulation. The workforce can discover new employment opportunities within high-technology industries through job transitioning and technical training; consequently, mitigating potential negative employment effects from environmental regulation. This finding is consistent with the research by Berman et al. (2001), which indicates that labor employment in such industries exhibits a lack of regulatory elasticity [53]. Conversely, low-technology industries most often rely on a large low-skilled workforce, which may entail limited transition abilities and occupational skills. Expectedly, low-skilled labor may experience significant challenges and employment difficulties in the short term when environmental regulation impacts low-technology industries. This observation supports Raff et al. (2019), who argue that low-skilled workers are more prone to unemployment in the short term [8]. Besides, high-technology industries generally encounter technological benefits and market competitiveness, leading to a strong demand for their products/services in the market. Therefore, high-technology industries can maintain a relatively stable market position and employment prospects even when affected by environmental regulation. This results in a relatively minor impact of employment on upstream and downstream labor. As a consequence, the transmission impact of employment in high-technology industries is relatively insignificant, whereas low-technology industries, often positioned upstream in the supply chain, encounter more direct and critical consequences when environmental regulation leads to reduced production or closures. In short, the downstream industries are more significantly and directly influenced, while the effect on upstream industries is relatively weaker since these upstream industries possess more advanced or higher levels of environmental protection technologies.

4.4. Robustness Testing

In order to ensure the robustness of the estimation results, the following approaches were adopted for the baseline regression: Firstly, the entire sample was subjected to the full generalized least squares (FGLS) technique, in order to mitigate possible issues associated with autocorrelation and heteroscedasticity in the regression model. Meanwhile, the regression results can be found in columns (1) through (3) of Table 10. Secondly, the Chinese government began monitoring five heavy metals including lead, arsenic, mercury, chromium, cadmium, and lead. Industries related to heavy metal pollution after the introduction of the “Twelfth Five-Year Plan for the Prevention and Control of Heavy Metal Pollution” in 2011, therefore, in order to reduce the sample size, the Basic Metal Manufacturing and Chemical Raw Materials, and Chemical Products Manufacturing industries, were excluded from the study sample. Thereafter, the regression results for this reduced sample are presented in columns (4) through (6) of Table 10. The following steps were adopted to enhance the robustness of the study findings.
The coefficients and signs of the main explanatory/independent variables in the regression results are mostly consistent with the baseline regression results from earlier in the text; thereby, confirming the robustness of the model.

5. Main Conclusions and Policy Implications

5.1. Main Conclusions

China has implemented stringent ecological/environmental control policies over the years in response to different ecological challenges. The persistent increase in the strictness of environmental regulations has not only improved the ecological environment but has also resulted in a variety of social effects, with a specific focus on their influence on employment. From a network perspective, this study investigates the effects of environmental regulation on industry employment. As a result, the following main conclusions are drawn in this study:
Firstly, environmental regulation exerts a direct non-linear effect on labor employment levels. Further, different types of industries exhibit non-linear changes in labor employment as the stringency of environmental regulations increases. Meanwhile, cost effects result in fewer job positions and lower production scale, while clean and eco-friendly industries may benefit from environmental regulations. This leads to a creation effect and the generation of more employment opportunities.
Secondly, the network transmission impact of environmental regulation on labor employment levels primarily demonstrates downstream network transmission effects. Prominently, environmental regulation exerts significant impacts on downstream industries through industry linkages and supply chain network effects; thereby, resulting in obvious changes in the labor employment levels in these industries. This infers that the transmission of environmental regulation’s impact on industry supply relationships is more noticeable. The proposed downstream transmission effect enhances labor mobility between industries, and strengthens inter-industry interdependence; consequently, further influencing the labor market as a whole.
Thirdly, the strictness of environmental regulations exhibits a substantial heterogeneity in its impact on industry employment levels. Notably, high-tech industries are relatively better at adapting to ecological regulations; hence, minimizing the negative impact on employment. In contrast, low-tech industries may encounter greater challenges and need to invest more resources, to advance and enhance their technological capabilities, in order to meet environmental requirements. In addition to this, the response of pollution-intensive industries and clean industries to environmental regulations also reflects significant differences; thus, mirroring the competitiveness and adaptability of different industries under ecological regulations.

5.2. Policy Implications

Based on the aforementioned conclusions, the following policy recommendations are put forward in this study:
Firstly, the implementation of environmental regulation policies should take into account the characteristics and differences among different industries. Furthermore, industries with varying technological levels and different types of polluting industries exhibit different patterns of employment change when impacted by environmental regulations. On this basis, policymakers should adopt differentiated policy measures, aligned with the specific situations to minimize adverse influences on employment. For pollution-intensive industries, priority should be given to providing technical support and financial subsidies to assist these sectors in pursuing technological innovation and upgrading. For example, tax incentives could be given to companies in energy-intensive sectors like steel or cement, helping them invest in cleaner technologies. Additionally, funds could be set aside to support research and development in cleaner production techniques. This approach can help mitigate the negative employment effects of environmental regulations. For high-tech industries, efforts should focus on enhancing support for research and development in environmental technologies, thereby fostering the creation of new green job opportunities. A specific example could be the establishment of “Green Innovation Funds” that provide tax breaks and subsidies to companies working on clean energy solutions or environmental technology advancements. This would encourage further investment in the development of sustainable technologies, creating new job markets in these sectors.
Secondly, the formulation of environmental regulation policies should consider the potential correlation effects between industries. In general, the direct effect of environmental regulations is not limited to the regulated industries but also extends through the industry chain to downstream and upstream industries, with special emphasis on the downstream industries. The government should encourage inter-industry collaboration and innovation by establishing industry alliances and cooperative platforms to facilitate resource sharing and technological exchange, thereby enhancing the environmental standards of the entire industrial chain. Specific measures include promoting collaboration between upstream and downstream enterprises within the supply chain, initiating joint research and development projects, and establishing environmental management information platforms to strengthen comprehensive management of environmental impacts across the entire industrial chain. For example, the development of an online platform where businesses can share best practices for reducing environmental impacts, increasing overall environmental efficiency.
Additionally, improving employment security mechanisms and providing retraining and job assistance will help displaced workers re-enter the labor market due to environmental regulations. For example, the government could establish retraining programs specifically aimed at workers from high-emission industries, offering them opportunities to learn skills required in renewable energy, waste management, or sustainable agriculture. Additionally, public–private partnerships could be developed to create job placement services that help displaced workers find employment in green industries.

5.3. Limitations and Future Outlook

In this paper, the analysis of the environmental regulation’s influence on employment primarily uses data for the time period from 2009 to 2018. The limited time span may not detect the long-term impacts of environmental regulation. Moreover, the research data are retrieved from publicly available statistical yearbooks, which may involve lags and inaccuracies, potentially influencing the accuracy of study results. Furthermore, this paper does not fully describe what could affect employment, such as technological advancements or global economic fluctuations, nor does it deeply examine the micro-level influential mechanisms on low-skilled labor, which is more substantially impacted by environmental regulation. Future studies may extend the time span of data to explore the long-term effects of environmental regulation on labor employment. By employing more external factors and adopting multidimensional analysis approaches, the in-depth effect of environmental regulation can be further examined in future studies. Finally, using micro-level data to investigate the mobility mechanisms of low-skilled labor across industries could offer more precise policy recommendations.

Author Contributions

Conceptualization, L.L.; Software, W.H.; Validation, W.H.; Formal analysis, W.H.; Writing – original draft, W.H.; Writing – review & editing, L.L. and K.F.; Funding acquisition, L.L. All authors have read and agreed to the published version of the manuscript.

Funding

This study was funded by the National Social Science Foundation of China (Project 20BTJ028).

Institutional Review Board Statement

Not applicable.

Informed Consent Statement

Not applicable.

Data Availability Statement

The original contributions presented in this study are included in the article. Further inquiries can be directed to the corresponding authors.

Acknowledgments

The authors would like to thank all the reviewers who participated in the review during the preparation of this manuscript.

Conflicts of Interest

The authors declare no conflict of interest.

Appendix A

Industry NameNumberIndustry NameNumber
Agriculture, Forestry, Animal Husbandry, and Fishery1Railway, Shipbuilding, and Other Transportation Equipment18
Mining and Quarrying2Other Manufacturing; Repair and Installation of Machinery and Equipment19
Food, Beverage, and Tobacco3Electricity, Gas, Steam, and Air Conditioning Supply20
Textiles, Apparel, Leather, and Footwear4Water Supply; Sewerage, Waste Management, and Remediation Activities21
Wood and Cork Products5Construction22
Paper and Printing6Wholesale and Retail Trade; Repair of Motor Vehicles23
Coke and Refined Petroleum Products7Transportation and Storage24
Chemicals and Chemical Products; Chemical Raw Materials and Chemical Products Manufacturing8Accommodation and Food Service Activities25
Pharmaceuticals, Medicinal Chemicals, and Botanical Products9Information and Communication; Software and Information Technology Services26
Rubber and Plastic Products10Financial Services27
Other Non-Metallic Mineral Products11Real Estate Activities28
Basic Metals12Professional, Scientific, and Technical Activities29
Metal Products Manufacturing13Public Administration and Social Security30
Computers, Electronic, and Optical Equipment14Education31
Electrical Machinery and Equipment Manufacturing15Human Health and Social Work Activities32
Machinery and Equipment, NEC16Arts, Sports, and Entertainment33
Automotive Manufacturing17Other Services34
Category 1
High-Pollution IndustriesClean Industrie
1. Mining and Quarrying1. Agriculture, Forestry, Animal Husbandry, and Fishing
2. Manufacture of Metal Products2. Professional, Scientific, and Technical Activities
3. Basic Metal Manufacturing3. Transportation and Warehousing
4. Manufacture of Other Non-Metallic Mineral Products4. Human Health and Social Work Activities
5. Chemical and Chemical Product Manufacturing5. Accommodation and Food Services Activities
6. Manufacture of Coke and Refined Petroleum Products6. Water Supply, Sewerage, Waste Management, and Remediation Activities
7. Electricity, Gas, Steam, and Air Conditioning Supply7. Information and Communication
8. Manufacture of Paper and Printing Products8. Other Manufacturing
9. Leather and Footwear Manufacturing9. Repair and Installation of Machinery and Equipment
10. Food, Beverage, and Tobacco Manufacturing10. Construction
11. Real Estate Activities
12. Wholesale and Retail Trade
13. Motor Vehicle Repair
14. Education
15. Culture, Sports, and Entertainment
16. Wood and Cork Product Manufacturing
17. Rubber and Plastic Product Manufacturing
18. Automobile Manufacturing
19. Electrical Machinery and Equipment Manufacturing
20. Pharmaceutical, Medicinal, and Botanical Product Manufacturing
21. Administrative, Public Management, and Compulsory Social Security
22. Computer, Electronic, and Optical Equipment Manufacturing
23. Finance
24. Railway, Ship, and Other Transportation Equipment Manufacturing
Category 2
High-Tech IndustriesMedium-Low Tech Industries
1. Computer, Electronic, and Optical Equipment Manufacturing1. Transportation and Warehousing
2. Manufacture of Metal Products2. Human Health and Social Work Activities
3. Railway, Ship, and Other Transportation Equipment Manufacturing3. Accommodation and Food Services Activities
4. Professional, Scientific, and Technical Activities4. Water Supply, Sewerage, Waste Management, and Remediation Activities
5. Information and Communication5. Other Manufacturing
6. Manufacture of Other Non-Metallic Mineral Products6. Repair and Installation of Machinery and Equipment
7. Chemical and Chemical Product Manufacturing7. Other Services
8. Machinery and Equipment, NEC (Not Elsewhere Classified)8. Agriculture, Forestry, Animal Husbandry, and Fishing
9. Rubber and Plastic Product Manufacturing9. Basic Metal Manufacturing
10. Automobile Manufacturing10. Construction
11. Manufacture of Coke and Refined Petroleum Products11. Real Estate Activities
12. Electrical Machinery and Equipment Manufacturing12. Wholesale and Retail Trade
13. Pharmaceutical, Medicinal, and Botanical Product Manufacturing13. Education
14. Culture, Sports, and Entertainment
15. Wood and Cork Product Manufacturing
16. Electricity, Gas, Steam, and Air Conditioning Supply
17. Manufacture of Paper and Printing
18. Textile, Leather, and Footwear Manufacturing
19. Administrative, Public Management, and Compulsory Social Security Services
20. Mining and Quarrying
21. Finance
22. Food, Beverage, and Tobacco Manufacturing.

References

  1. Gu, B.J.; Ge, Y.; Chang, S.X.; Luo, W.D.; Chang, J. Nitrate in groundwater of China: Sources and driving forces. Glob. Environ. Change 2013, 23, 1112–1121. [Google Scholar] [CrossRef]
  2. Zhao, F.J.; Ma, Y.B.; Zhu, Y.G.; Tang, Z.; McGrath, S.P. Soil contamination in China: Current status and mitigation strategies. Environ. Sci. Technol. 2015, 49, 750–759. [Google Scholar] [CrossRef] [PubMed]
  3. Siebert, H. Environmental quality and the gains from trade. In International Trade and the Environment; Routledge: Brighton, UK, 2017; pp. 1–22. [Google Scholar]
  4. Song, Y.; Zhang, X.; Zhang, M. The influence of environmental regulation on industrial structure upgrading: Based on the strategic interaction behavior of environmental regulation among local governments. Technol. Forecast. Soc. Change 2021, 170, 120930. [Google Scholar] [CrossRef]
  5. Li, Z.; Wang, M.; Wang, Q. Job destruction and creation: Labor reallocation entailed by the clean air action in China. China Econ. Rev. 2023, 79, 101945. [Google Scholar] [CrossRef]
  6. Guo, W.; Dai, H.J.; Liu, X.R. Impact of different types of environmental regulation on employment scale: An analysis based on perspective of provincial heterogeneity. Environ. Sci. Pollut. Res. 2020, 27, 45699–45711. [Google Scholar] [CrossRef]
  7. Jing, Y.H.; Hu, M.Z.; Zhao, L.D. The effect of heterogeneous environmental regulations on the employment skill structure: The system-GMM approach and mediation model. PloS ONE 2023, 18, e0290276. [Google Scholar] [CrossRef]
  8. Raff, Z.; Earnhart, D. The effect of environmental enforcement on labor: Environmental workers and production workers. J. Regul. Econ. 2020, 57, 118–133. [Google Scholar] [CrossRef]
  9. Liu, M.D.; Shadbegian, R.; Zhang, B. Does environmental regulation affect labor demand in China? Evidence from the textile printing and dyeing industry. J. Environ. Econ. Manag. 2017, 86, 277–294. [Google Scholar] [CrossRef]
  10. Liao, J.; Zhang, N. Environmental regulation and manufacturing employment: Evidence from China’s eleventh five-year plan. China Econ. Rev. 2024, 87, 102226. [Google Scholar] [CrossRef]
  11. Liu, M.D.; Tan, R.P.; Zhang, B. The costs of “blue sky”: Environmental regulation, technology upgrading, and labor demand in China. J. Dev. Econ. 2021, 150, 102610. [Google Scholar] [CrossRef]
  12. Li, M.J.; Du, W.J.; Tang, S.L. Assessing the impact of environmental regulation and environmental co-governance on pollution transfer: Micro-evidence from China. Environ. Impact Assess. Rev. 2021, 86, 106467. [Google Scholar] [CrossRef]
  13. Kahn, M.E.; Mansur, E.T. Do local energy prices and regulation affect the geographic concentration of employment? J. Public Econ. 2013, 101, 105–114. [Google Scholar] [CrossRef]
  14. Wang, S.H.; Chen, H.X.; Yin, K.D. The employment effect of Chinese industrial enterprises embedded in environmental cost-adjusted global value chains. Environ. Sci. Pollut. Res. 2022, 29, 18160–18176. [Google Scholar] [CrossRef]
  15. Chen, Y. Environmental regulation, local labor market, and skill heterogeneity. Reg. Sci. Urban Econ. 2023, 101, 103898. [Google Scholar] [CrossRef]
  16. Zhong, M.C.; Li, M.J.; Du, W.J. Can environmental regulation force industrial structure adjustment: An empirical analysis based on provincial panel data. China Popul. Resour. Environ. 2015, 25, 107–115. [Google Scholar]
  17. Cao, W.B.; Wang, H.; Ying, H.H. The effect of environmental regulation on employment in resource-based areas of China—An empirical research based on the mediating effect model. Int. J. Environ. Res. Public Health 2017, 14, 1598. [Google Scholar] [CrossRef]
  18. Porter, M.E.; Linde CV, D. Toward a new conception of the environment-competitiveness relationship. J. Econ. Perspect. 1995, 9, 97–118. [Google Scholar]
  19. Bu, T.; Du, W.H.; Tang, C.X.; Liu, Y.H.; Wang, X.Y.; Wang, Y.H.; Tang, D.S. Market-oriented environmental regulations, employment adjustment and transfer path: Quasi-experimental evidence from China’s carbon emissions trading pilot. J. Clean. Prod. 2022, 369, 133292. [Google Scholar] [CrossRef]
  20. Hille, E.; Möbius, P. Do energy prices affect employment? Decomposed international evidence. J. Environ. Econ. Manag. 2019, 96, 1–21. [Google Scholar] [CrossRef]
  21. Nondo, C.; Schaeffer, P.V. Economic growth and environmental regulations: A simultaneous equation estimation. Iup J. Appl. Econ. 2012, 11, 28–49. [Google Scholar]
  22. Qin, B.T.; Liu, L.; Yang, L.; Ge, L.M. Environmental regulation and employment in resource-based cities in China: The threshold effect of industrial structure transformation. Front. Environ. Sci. 2022, 10, 828188. [Google Scholar] [CrossRef]
  23. Wang, Y.; Shi, M.C.; Li, J.M. The impact of environmental regulation on employment: An empirical study of the industry panel data in China. Chin. J. Popul. Sci. 2013, 54–64. Available online: https://www.cnki.net/KCMS/detail/detail.aspx?dbcode=CJFD&dbname=CJFDHIS2&filename=ZKRK201303008&uniplatform=OVERSEA&v=SBeZljFD8Pd0hXwoJB9sDy_SrkHhla868EnEA7iMcGnOund7fVWs9sO6puVUhLND (accessed on 26 January 2025).
  24. Yu, X.; Wang, P. Economic effects analysis of environmental regulation policy in the process of industrial structure upgrading: Evidence from Chinese provincial panel data. Sci. Total Environ. 2021, 753, 142004. [Google Scholar] [CrossRef] [PubMed]
  25. Chakraborty, P.; Chatterjee, C. Does environmental regulation indirectly induce upstream innovation? new evidence from India. Res. Policy 2017, 46, 939–955. [Google Scholar] [CrossRef]
  26. Franco, C.; Marin, G. The effect of within-sector, upstream and downstream environmental taxes on innovation and productivity. Environ. Resour. Econ. 2017, 66, 261–291. [Google Scholar] [CrossRef]
  27. Su, E.D.; Guo, J.J.; Xue, J. Does the “bringing in” of the service industry promote the “going global” of the manufacturing industry: An analysis from the perspective of linkage between upstream and downstream industries. J. Int. Trade 2023, 3, 71–88. [Google Scholar]
  28. Ellison, G.; Glaeser, E.L.; Kerr, W.R. What causes industry agglomeration? Evidence from coagglomeration patterns. Am. Econ. Rev. 2010, 100, 1195–1213. [Google Scholar] [CrossRef]
  29. Helsley, R.W.; Strange, W.C. Matching and agglomeration economies in a system of cities. Reg. Sci. Urban Econ. 1990, 20, 189–212. [Google Scholar] [CrossRef]
  30. Acemoglu, D.; Akcigit, U.; Kerr, W. Networks and the macroeconomy: An empirical exploration. Nber Macroecon. Annu. 2016, 30, 273–335. [Google Scholar] [CrossRef]
  31. Li, Z.; Li, Y. Environmental regulation and employment: Evidence from China’s new Environmental Protection Law. Econ. Anal. Policy 2024, 82, 400–416. [Google Scholar] [CrossRef]
  32. North, D.C. Institutions, Institutional Change and Economic Performance; Cambridge University Press: Cambridge, UK, 1990. [Google Scholar]
  33. Yu, Y.; Zhang, N. Environmental regulation and innovation: Evidence from China. Glob. Environ. Change 2022, 76, 102587. [Google Scholar] [CrossRef]
  34. Zheng, J.J.; He, J.; Shao, X.F.; Liu, W. The employment effects of environmental regulation: Evidence from eleventh five-year plan in China. J. Environ. Manag. 2022, 316, 115197. [Google Scholar]
  35. Mishra, V.; Smyth, R. Environmental regulation and wages in China. J. Environ. Plan. Manag. 2012, 55, 1075–1093. [Google Scholar]
  36. Ren, S.; Liu, D.; Li, B.; Wang, Y.; Chen, X. Does emissions trading affect labor demand? Evidence from the mining and manufacturing industries in China. J. Environ. Manag. 2020, 254, 109789. [Google Scholar]
  37. Huo, T.; Cao, R.; Xia, N.; Hu, X.; Cai, W.; Liu, B. Spatial correlation network structure of China’s building carbon emissions and its driving factors: A social network analysis method. J. Environ. Manag. 2022, 320, 115808. [Google Scholar]
  38. Helbing, D. Globally networked risks and how to respond. Nature 2013, 497, 51–59. [Google Scholar] [CrossRef]
  39. Grassi, B. IO in IO: Competition and Volatility in Input-Output Networks. In Proceedings of the 2017 Annual Meeting of the Society for Economic Dynamics, Edinburgh, Scotland, 22 June 2017; Available online: https://ideas.repec.org/p/red/sed017/1637.html (accessed on 3 January 2025).
  40. Qi, Y.F.; Li, Y.F. Trade frictions in multinational input-output networks—The effects of the trade frictions between China and US on employment and welfare. Financ. Trade Econ. 2019, 40, 83–95. [Google Scholar]
  41. Luo, S. Propagation of financial shocks in an input-output economy with trade and financial linkages of firms. Rev. Econ. Dyn. 2020, 36, 246–269. [Google Scholar]
  42. Steinbrunner, P.R. Boon or bane? On productivity and environmental regulation. Environ. Econ. Policy Stud. 2022, 24, 365–396. [Google Scholar] [CrossRef]
  43. Storper, M.; Venables, A.J. Buzz: Face-to-face contact and the urban economy. Cep Discuss. Pap. 2003, 4, 351–370. [Google Scholar] [CrossRef]
  44. Srinivasan, S. Driven up the wall? role of environmental regulation in innovation along the automotive global value chain. Suchita Srinivasan 2017. Available online: https://repository.graduateinstitute.ch/record/295726/?v=pdf (accessed on 3 January 2025).
  45. Dai, R.; Liang, H.; Ng, L.K. Socially responsible corporate customers. Soc. Sci. Electron. Publ. 2021, 142, 598–626. [Google Scholar]
  46. Chu, Y.; Tian, X.; Wang, W.; Science, M. Corporate innovation along the supply chain. Manag. Sci. 2019, 65, 2445–2466. [Google Scholar]
  47. Ben Kheder, S.; Zugravu-Soilita, N. The Pollution Haven Hypothesis: A Geographic Economy Model in a Comparative Study. Available online: https://shs.hal.science/halshs-00344845 (accessed on 5 December 2008).
  48. Bai, X.J.; Meng, H. Is the service industry greener than manufacturing industry? Based on measurement and decomposition of energy productivity. Ind. Econ. Res. 2017, 3, 1–14. [Google Scholar]
  49. Acemoglu, D.; Carvalho, V.M.; Ozdaglar, A.; Tahbaz-Salehi, A. The network origins of aggregate fluctuations. Econometrica 2012, 80, 1977–2016. [Google Scholar] [CrossRef]
  50. Pesaran, M.H. General diagnostic tests for cross-sectional dependence in panels. Empir. Econ. 2021, 60, 13–50. [Google Scholar]
  51. Yilanci, V.; Cutcu, I.; Cayir, B. Is the environmental Kuznets curve related to the fishing footprint? Evidence from China. Fish. Res. 2022, 254, 106392. [Google Scholar]
  52. Hansen, B.E. Threshold effects in non-dynamic panels: Estimation, testing, and inference. J. Econom. 1999, 93, 345–368. [Google Scholar]
  53. Berman, E.; Bui, L.T. Environmental regulation and labor demand: Evidence from the south coast air basin. J. Public Econ. 2001, 79, 265–295. [Google Scholar]
Figure 1. Flow chart of mechanism analysis.
Sustainability 17 02938 g001
Figure 2. Simplified network diagram of 3 sectors.
Sustainability 17 02938 g002
Figure 3. Threshold estimates of environmental regulation and confidence intervals.
Sustainability 17 02938 g003
Figure 4. Threshold estimates of downstream network impacts and confidence intervals.
Sustainability 17 02938 g004
Table 1. Descriptive statistics of variables.
VariableMeanStd. DevMinMaxVarCVSkewnessKurtosis
ΔlnL0.0170.158−1.0981.1720.0259.263−0.50128.952
lnER3.7091.260.5556.9961.5870.340−0.0462.931
Downstream6.19517.001−33.72861.116289.0442.7440.8383.866
Upstream4.6598.407−15.67638.57170.6771.8040.8484.455
ln GDP12.0940.889.90314.0280.7740.073−0.0902.537
ln Labor4.6751.4322.157.3812.0510.3060.3381.787
ln Wage10.8170.4019.86611.7230.1610.037−0.1202.685
ln Fixed4.8470.9391.3865.820.8820.194−1.5245.232
ln s3.6791.1461.3227.4141.3140.3120.6793.955
Trade0.2470.2710.0011.3090.0731.0991.8416.062
Table 2. Pesaran CD test results.
ΔlnLlnERDownstreamUpstream
CD-test31.8 ***29.81 ***68.39 ***50.93 ***
Prob.0.0000.0000.0000.000
*** p < 0.01.
Table 3. CIPS test results.
ΔlnLΔlnERΔDownstreamΔUpstream
CIPS3.182 ***−2.714 **−3.553 ***−2.456 ***
** p < 0.05, *** p < 0.01.
Table 4. Pedroni cointegration test results.
StatisticProb.
Modified Phillips–Perron6.5185 ***0.000
Phillips–Perron −4.2939 ***0.000
Augmented Dickey–Fuller −3.8494 ***0.000
*** p < 0.01.
Table 5. Analysis of the environmental regulation’s effect on labor employment lLevels.
(1)(2)(3)(4)(5)
ΔlnLΔlnLΔlnLΔlnLΔlnL
lnER−0.32340 **−0.323 *−0.33129 ***−0.32675 **−0.33415 ***
(0.01010)(−1.84)(0.00875)(0.01012)(0.00855)
lnER20.03872 ***0.039 *0.03963 ***0.03841 ***0.03931 ***
D(0.00241)(1.66)
1.267 ***
(3.34)
(0.00136)(0.00355)(0.00203)
Downstream 0.00254 ** 0.00247 **
(0.02812) (0.04531)
Upstream 0.001810.00168
(0.30056)(0.33181)
Ins0.06909 **0.069 *0.06757 **0.06543 **0.06422 **
(0.03131)(1.94)(0.02624)(0.03425)(0.02811)
lnWage−0.000330.005−0.00771−0.00268−0.01440
(0.96291)(0.05)(0.92138)(0.96988)(0.84860)
Trade0.49766 ***−0.103−0.09987−0.13828−0.13270
(0.00001)(−0.79)(0.49382)(0.35037)(0.35545)
lnGDP−0.28108 ***−0.281 ***−0.28124 ***−0.29418 ***−0.29337 ***
(0.00474)(−2.70)(0.00534)(0.00375)(0.00464)
lnFixed−0.10294−0.000−0.00205−0.00105−0.00267
(0.49015)(−0.05)(0.77776)(0.89243)(0.73626)
lnLabor0.004960.498 ***0.49870 ***0.49305 ***0.49439 ***
(0.94520)(3.59)(0.00001)(0.00000)(0.00000)
FEYesYesYesYesYes
REYesYesYesYesYes
_cons1.513050.8851.600391.78067 *1.84564 *
(0.11345)(0.78)(0.13088)(0.06272)(0.08099)
N306306306306306
adj. R20.40260.4890.41000.40460.4114
* p < 0.1, ** p < 0.05, *** p < 0.01.
Table 6. Threshold effect test results.
Independent VariableThreshold VariableNumber of ThresholdsF-StatisticProbCrit10Crit5Crit1Threshold Value
lnERlnERSingle67.420.0032 ***16.401620.286347.19115.0425
Double14.550.120015.501320.474041.0377
DownstreamlnERSingle7.190.0433 **5.99436.73729.97983.4466
Double24.380.0033 ***8.894211.578917.90823.5312
Triple1.950.876722.092135.991362.7190
** p < 0.05, *** p < 0.01.
Table 7. Threshold regression results.
(1)(2)
ΔlnLΔlnL
Independent VariablelnERDownstream
Threshold VariablelnERlnER
Ins0.07311 **0.10231 ***
(0.01001)(0.00782)
lnWage−0.06335−0.31901 ***
(0.49200)(0.00002)
Trade−0.16485−0.02085
(0.27660)(0.91725)
lnGDP−0.26618 **−0.23265 **
(0.02109)(0.01600)
lnFixed0.008560.00656
(0.44419)(0.33170)
lnLabor0.00071 ***
(0.00007)
lnER ( l n E R δ 1 ) 0.12604 **
(0.01259)
lnER ( l n E R > δ 1 ) 0.12604 **
(0.02790)
Lnlabor 0.50916 ***
(0.00005)
Downstream ( l n E R δ 1 ) 0.00097 ***
(0.00163)
Downstream ( δ 1 l n E R δ 2 ) 0.01572 ***
(0.00456)
Downstream ( l n E R > δ 2 ) −0.00046
(0.28894)
_cons2.98445 ***3.49578 ***
(0.00000)(0.00000)
N306306
adj. R20.21750.3679
** p < 0.05, *** p < 0.01.
Table 8. Regression results by pollution intensity categories.
Pollution-Intensive IndustriesClean Industries
(1)(2)(3)(1)(2)(3)
ΔlnLΔlnLΔlnLΔlnLΔlnLΔlnL
lnER0.33757 ***0.31279 ***0.31493 ***−0.18886−0.24076−0.22506
(0.00807)(0.00425)(0.00444)(0.41786)(0.29814)(0.34833)
lnER20.06017 ***0.06451 ***0.06512 ***0.024740.030270.02785
(0.00958)(0.00437)(0.00492)(0.31443)(0.21266)(0.29401)
Downstream 0.00193 ***0.00185 *** 0.00338 **0.00313 *
(0.00727)(0.00760) (0.01485)(0.05102)
Upstream 0.00063 0.00210
(0.34140) (0.42764)
Ins−0.08885−0.09418−0.093740.07863 **0.07767 **0.07289 **
(0.19264)(0.10564)(0.11322)(0.02649)(0.02397)(0.02264)
lnWage0.052150.078220.07407−0.04195−0.03959−0.05052
(0.40299)(0.11904)(0.13931)(0.70243)(0.73136)(0.66304)
Trade0.061660.042700.03532−0.20249−0.18801−0.24082
(0.63434)(0.72915)(0.77547)(0.37122)(0.41030)(0.27124)
lnGDP−0.15653 *−0.17084−0.17568 *0.33973 ***0.35947 ***0.36671 ***
(0.08819)(0.10057)(0.09239)(0.00228)(0.00218)(0.00214)
lnFixed0.01519 *0.01631 **0.01638 **−0.00183−0.00540−0.00638
(0.08178)(0.02687)(0.02800)(0.85862)(0.59379)(0.56505)
lnLabor0.33521 **0.28357 *0.28367 *0.51519 ***0.51465 ***0.50911 ***
(0.01292)(0.05366)(0.05309)(0.00003)(0.00004)(0.00002)
FEYesYesYesYesYesYes
REYesYesYesYesYesYes
_cons0.808910.871880.962332.128052.373272.58783 *
(0.47458)(0.34464)(0.29556)(0.13037)(0.10234)(0.07582)
N909090216216216
adj. R20.78580.80260.80150.39230.40220.4035
* p < 0.1, ** p < 0.05, *** p < 0.01.
Table 9. Regression results by technological level.
High-TechLow-Tech
(1)(2)(3)(1)(2)(3)
ΔlnLΔlnLΔlnLΔlnLΔlnLΔlnL
lnER−0.31323−0.31815−0.331290.35286 **0.35422 **−0.36655 **
(0.26917)(0.25052)(0.21250)(0.01040)(0.01058)(0.01008)
lnER20.04280 *0.04321 *0.04400 *0.04049 ***0.04088 ***0.04113 ***
(0.08864)(0.08191)(0.07216)(0.00464)(0.00317)(0.00346)
Downstream 0.000380.00009 0.00240 *0.00230
(0.76379)(0.95634) (0.06094)(0.10456)
Upstream 0.00164 0.00325
(0.25061) (0.23432)
Ins0.07527 ***0.07419 ***0.06901 ***0.074290.076730.07111
(0.00036)(0.00131)(0.00517)(0.13024)(0.10351)(0.11043)
lnWage−0.04327−0.04194−0.048120.062070.043250.03951
(0.78314)(0.79643)(0.77247)(0.58860)(0.70164)(0.72112)
Trade−0.04930−0.04839−0.04916−0.11578−0.10845−0.20727
(0.86416)(0.86680)(0.86588)(0.59544)(0.61017)(0.36535)
lnGDP0.24822 ***0.24732 ***0.24704 ***−0.28660 **−0.28362 **−0.31921 **
(0.00268)(0.00266)(0.00100)(0.03321)(0.03457)(0.02928)
lnFixed0.000980.000740.000660.00108−0.00014−0.00148
(0.89159)(0.91547)(0.92407)(0.91973)(0.99002)(0.90612)
lnLabor0.46982 ***0.46936 ***0.46349 ***0.50850 ***0.51240 ***0.50540 ***
(0.00000)(0.00000)(0.00000)(0.00084)(0.00094)(0.00046)
FEYesYesYesYesYesYes
REYesYesYesYesYesYes
_cons1.963391.944882.065090.791450.868141.40239
(0.35023)(0.36905)(0.35250)(0.43656)(0.43339)(0.23942)
N117117117189189189
adj. R20.37530.36920.36770.42820.43410.4418
* p < 0.1, ** p < 0.05, *** p < 0.01.
Table 10. Robustness test results.
(1)(2)(3)(4)(5)(6)
ΔlnLΔlnLΔlnLΔlnLΔlnLΔlnL
lnER0.32340 **−0.33129 **−0.33415 **−0.24187−0.26002 *−0.33415 **
(0.01477)(0.01185)(0.01091)(0.10233)(0.08281)(0.01091)
lnER20.03872 ***0.03963 ***0.03931 ***0.02995 **0.03187 **0.03931 ***
(0.00474)(0.00359)(0.00377)(0.04749)(0.03367)(0.00377)
Downstream 0.00254 **0.00247 ** 0.00253 **0.00247 **
(0.02624)(0.03081) (0.02823)−0.33415 **
Upstream 0.00168 0.00168
(0.17782) (0.17782)
Ins0.06909 **0.06757 **0.06422 **0.06906 **0.06749 **0.06422 **
(0.01563)(0.01720)(0.02368)(0.03542)(0.03186)(0.02368)
lnWage0.00496−0.00771−0.01440−0.00181−0.01565−0.01440
(0.96574)(0.94639)(0.89984)(0.98078)(0.84823)(0.89984)
Trade−0.10294−0.09987−0.13270−0.26694 *−0.26013 *−0.13270
(0.48573)(0.49541)(0.37019)(0.07380)(0.08391)(0.37019)
lnGDP0.28108 ***−0.28124 ***−0.29337 ***−0.27772 ***−0.28048 ***−0.29337 ***
(0.00025)(0.00022)(0.00012)(0.00328)(0.00389)(0.00012)
lnFixed−0.00033−0.00205−0.002670.00065−0.00133−0.00267
(0.96913)(0.80880)(0.75304)(0.92528)(0.85028)(0.75304)
lnLabor0.49766 ***0.49870 ***0.49439 ***0.50153 ***0.50230 ***0.49439 ***
(0.00000)(0.00000)(0.00000)(0.00001)(0.00001)(0.00000)
FEYesYesYesYesYesYes
REYesYesYesYesYesYes
_cons0.884800.009451.217401.373741.528401.74009 *
(0.53648)(0.99454)(0.39388)(0.10984)(0.12350)(0.07415)
N306306306288288288
adj. R2——————0.40180.40870.4099
* p < 0.1, ** p < 0.05, *** p < 0.01.
Disclaimer/Publisher’s Note: The statements, opinions and data contained in all publications are solely those of the individual author(s) and contributor(s) and not of MDPI and/or the editor(s). MDPI and/or the editor(s) disclaim responsibility for any injury to people or property resulting from any ideas, methods, instructions or products referred to in the content.

