Article

Evolutionary Patterns and Influencing Factors of Livelihood Resilience in Tourism-Dependent Communities Affected by an Epidemic: An Empirical Study in the Wulingyuan Scenic Area, China

1
School of Civil Engineering and Architecture, Jishou University, Zhangjiajie 427000, China
2
Rural Planning and Development Research Center of Wuling Mountain Area, Zhangjiajie 427000, China
3
Tourism College, Jishou University, Zhangjiajie 427000, China
*
Author to whom correspondence should be addressed.
Sustainability 2025, 17(7), 2937; https://doi.org/10.3390/su17072937
Submission received: 25 February 2025 / Revised: 16 March 2025 / Accepted: 23 March 2025 / Published: 26 March 2025

Abstract

:
Livelihood resilience research is a critical area in contemporary sustainable livelihood studies, offering valuable insights into residents’ livelihood transformation and strategies under sudden shocks or disruptions. This research analyzes 365 households from five towns reliant on tourism in the Wulingyuan Scenic range, situated in the central section of the Wuling Mountain range. The findings reveal that residents’ livelihood resilience decreased by 6.38% from the normal tourism stage (before 2020) to the epidemic disruption stage (2020–2022), followed by a 4.54% increase during the tourism recovery stage (after 2022). Despite fluctuations caused by exogenous shocks like the COVID-19 pandemic, residents’ livelihood resilience remained at a moderate level overall. Spatially, livelihood resilience exhibited a northwest–southeast dispersion trend, with a noticeable shift toward the southeast. Key drivers of resilience included increased material capital, enhanced organizational management capabilities, residents’ clear understanding of livelihood challenges, and positive attitudes. Conversely, constraints included the pandemic’s impacts, limited community participation, reduced tourist numbers, inefficient ecotourism management, insufficient financial capital, weak learning capacities, and monolithic livelihood strategies. The study highlights that those changes in the tourism development environment, coupled with interactive pathways of buffering, adaptation, and transformation capabilities, jointly influence livelihood resilience. Synergistic efforts in these areas can significantly enhance residents’ livelihood resilience.

1. Introduction

Tourism is a key driver of rural revitalization and an important means to improve residents’ economic well-being [1]. It is a crucial component affecting the evolution of citizens’ livelihoods [2]. As a cornerstone industry of the national economy, tourism plays a critical role in enhancing the living conditions of community residents, conserving the ecological environment, and fostering regional economic progress. However, tourism development is highly sensitive to external factors, especially in the context of increasing global risks and challenges since the early 21st century. This has significantly heightened the livelihood vulnerability of residents in tourist areas [3]. Tourism-related business risks, unstable income, and the marginalization of the poor make residents’ livelihoods particularly susceptible to external disturbances, exhibiting strong vulnerability characteristics [4]. The intrinsic unpredictability of tourism endeavors threatens the sustainability of locals’ livelihoods, which, if unmitigated, could result in poverty [5]. Consequently, reducing the adverse effects of tourism on residents’ livelihoods and promoting their livelihood transformation are essential for attaining superior regional development and improving modern government capabilities.
The World Commission on Environment and Development proposed the idea of sustainable livelihoods in 1980, emphasizing the necessity of preserving and enhancing the livelihood assets and capabilities of present and future generations without exhausting natural resources [6]. Contemporary research focuses on poverty reduction, livelihood diversification, adaptability, vulnerability, resilience, and security [7,8,9]. As research has progressed, scholars have increasingly recognized that livelihood issues not only involve objective livelihood capital but also human agency—specifically, the adaptive strategies and behavioral adjustments individuals make when facing external disturbances [7]. In this context, resilience thinking provides a fresh perspective on livelihood studies, emphasizing the capacity of complex systems to adjust, alter, and recuperate in response to disturbances and constraints.
Livelihood resilience is a core idea within the sustainable livelihood framework, characterized as the ability of individuals or groups to preserve or rehabilitate livelihood systems through adaptive capacities in reaction to environmental, economic, and social disruptions [10]. Livelihood resilience emphasizes the sustainability of livelihoods under pressure and shocks, positioning it as a valuable framework for exploring sustainable livelihoods [10]. Research on livelihood resilience has garnered growing interest in both theoretical and practical domains, yet it remains in its nascent phase, with current research predominantly focused on quantitative approaches. The field has transitioned from integrating theoretical frameworks to analyzing empirical studies [11]. Key research areas encompass (1) the analytical frameworks and quantitative measurement of livelihood resilience [12,13], (2) factors influencing livelihood resilience [9,14], and (3) strategies for enhancing resilience [15]. In recent years, research emphasis has progressively transitioned to assessing individual-level livelihood resilience [16,17]. Scholars have primarily examined economically disadvantaged farming households in ecologically fragile regions [13,18], as well as resettled populations and landless residents [17,19,20], with methodologies primarily employing analytical frameworks. Nonetheless, research on the livelihood resilience of residents in tourism-dependent communities, especially in relation to the COVID-19 pandemic, remains limited.
To summarize, while research on the sustainable livelihoods of vulnerable groups is extensive and thorough, studies examining the evolution of livelihood resilience among residents in tourist destinations remain limited. Systematic analyses of how vulnerability contexts influence livelihood resilience are particularly scarce. Most existing studies rely on cross-sectional data, with a paucity of longitudinal studies, which hampers a comprehensive understanding of the dynamic evolution of livelihoods. This study focuses on community residents in the Wulingyuan Scenic Area, recognizing their significant role in tourism destinations within the rural revitalization strategy. The objective is to elucidate the spatial-temporal evolution characteristics and influencing factors of livelihood resilience among residents in tourism communities affected by COVID-19, thereby offering theoretical support and practical guidance for enhancing livelihood resilience and achieving sustainable development in the scenic area. Simultaneously, it offers a scientific foundation for management organizations to address emergencies.

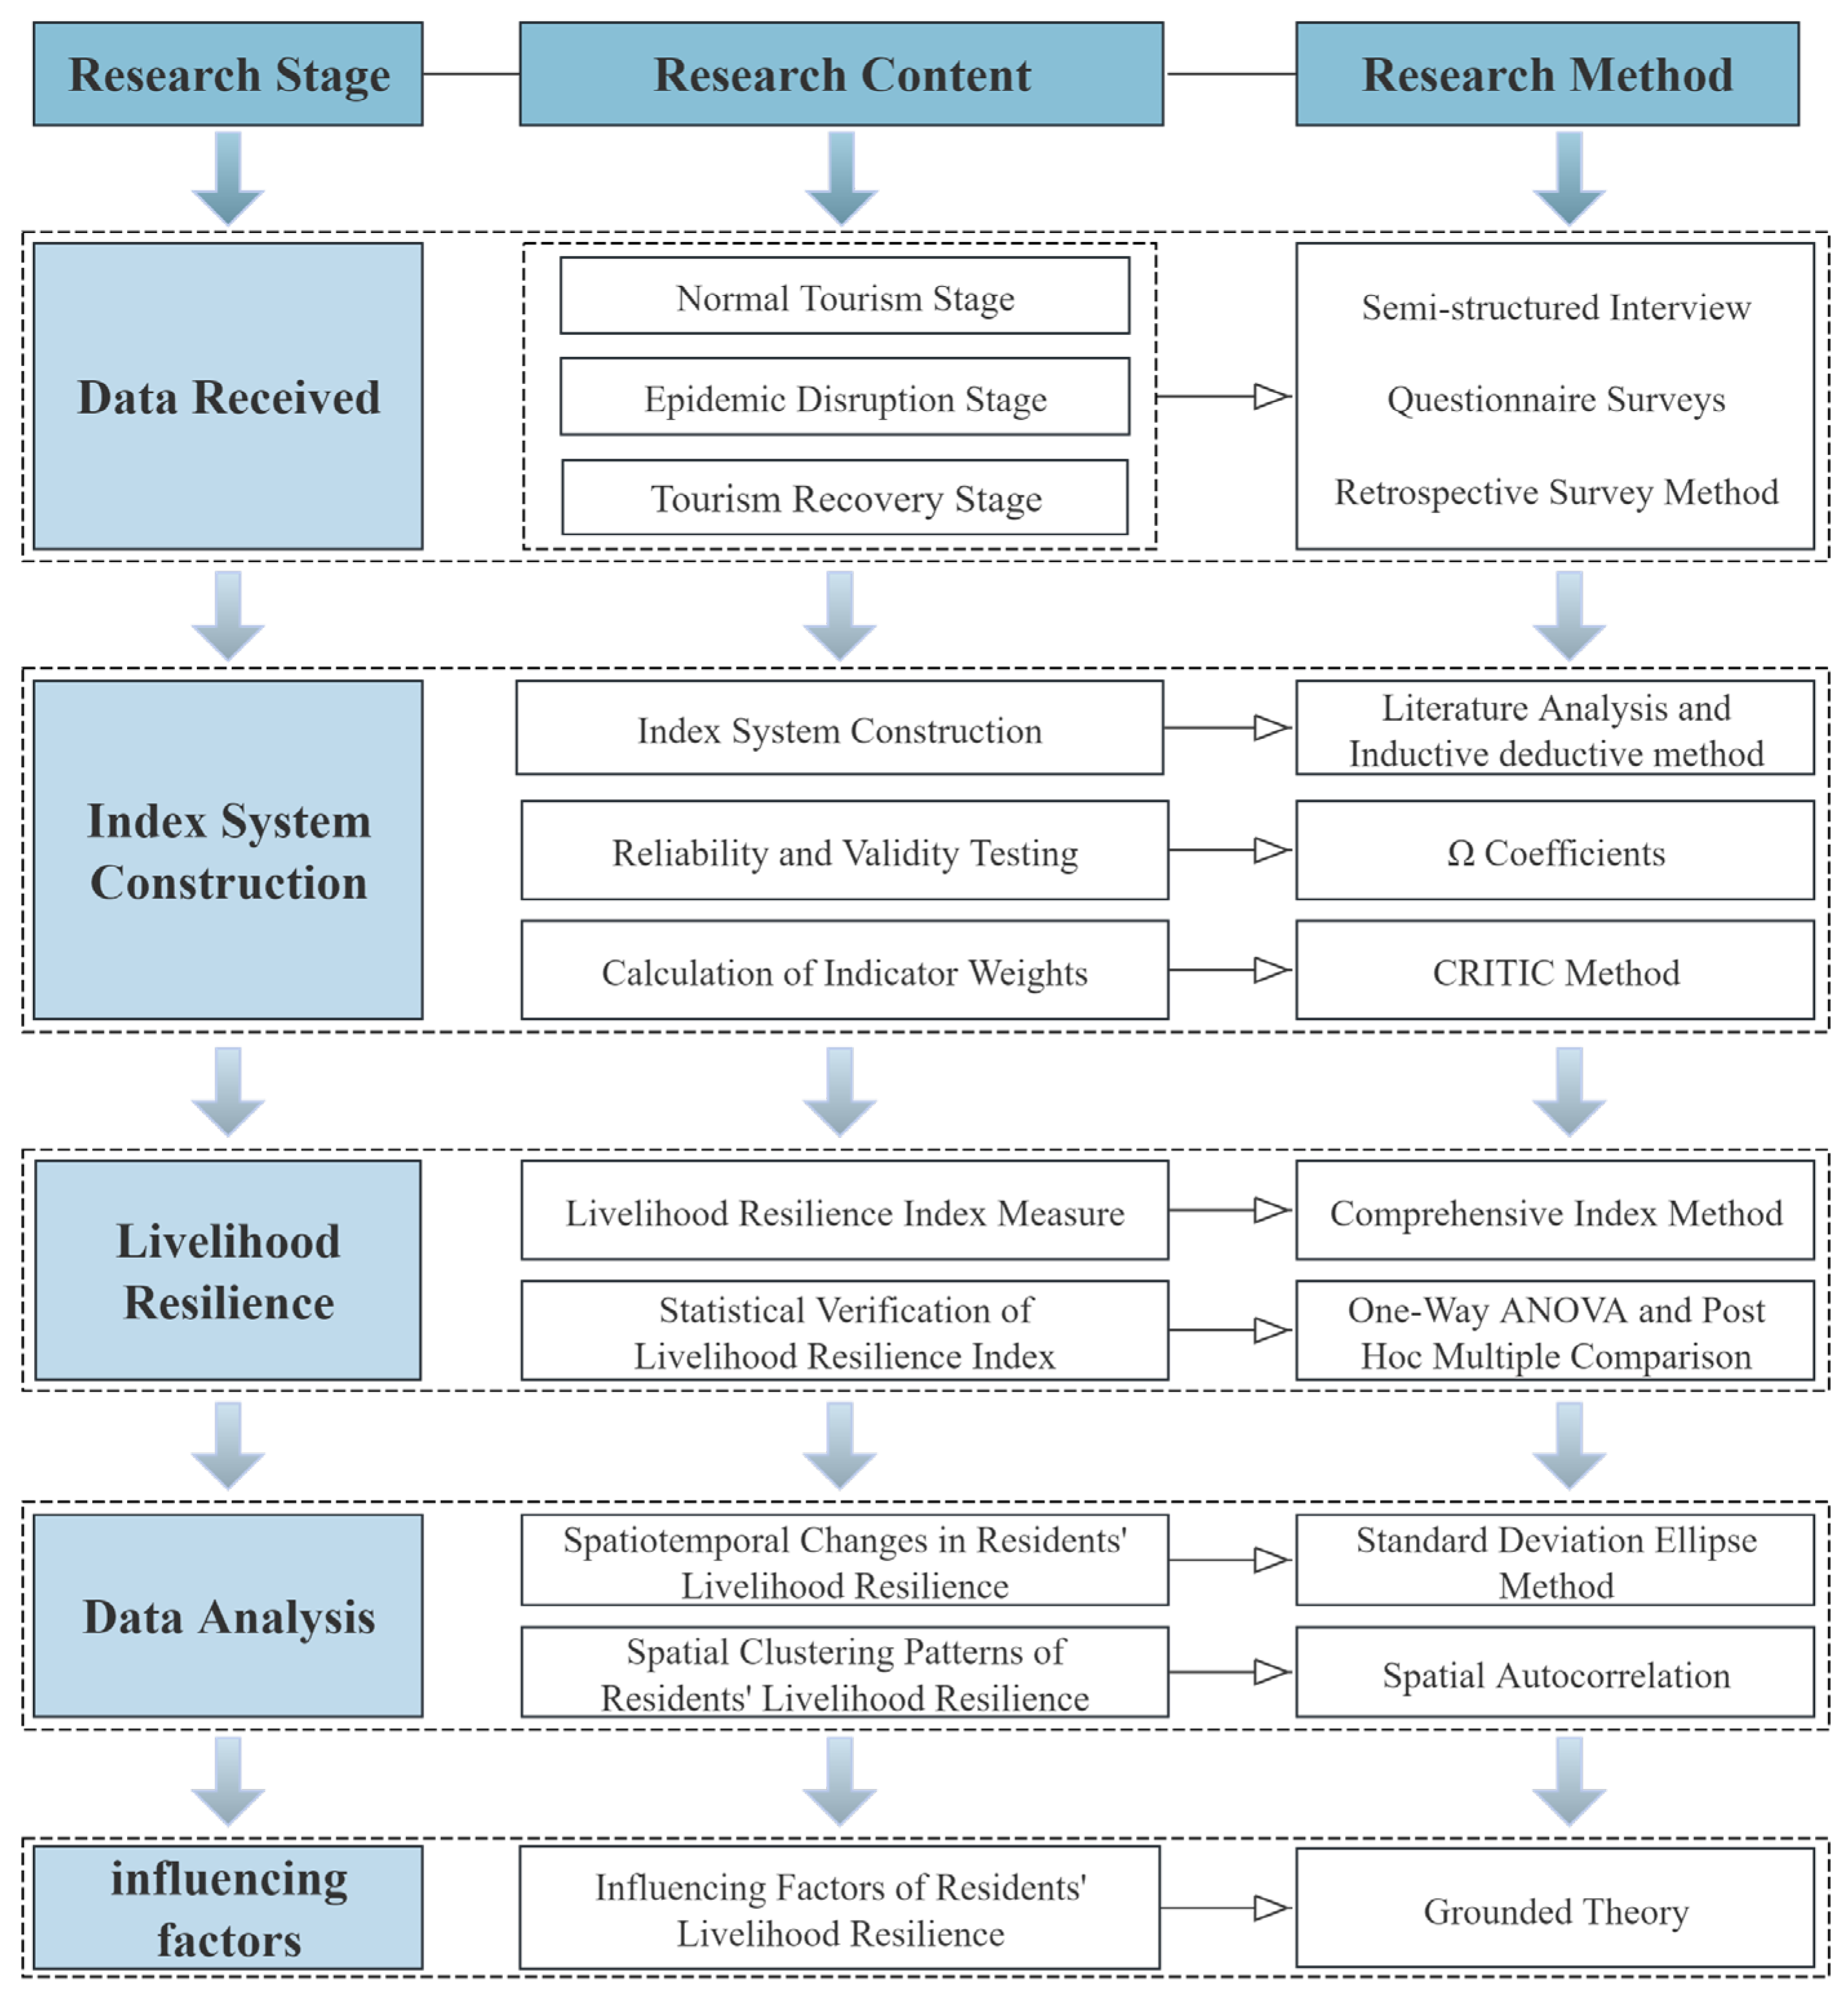
2. Materials and Methods

2.1. Study Area

The Wulingyuan Scenic Area, located in Wulingyuan District, Zhangjiajie City, in northwestern Hunan Province, spans 397.58 square kilometers. It is among the first globally recognized UNESCO World Natural Heritage sites and Global Geoparks, as well as one of China’s earliest national scenic areas, a national 5A-level tourism destination and the nation’s inaugural national forest park. The area is characterized by unique quartz sandstone geological landforms (referred to as “Zhangjiajie landforms”), rich biodiversity, and breathtaking natural landscapes, possessing significant global ecological and geological value. As a tourism-dependent city, Zhangjiajie has leveraged the resource advantages of the Wulingyuan Scenic Area to develop its tourism industry, which has become a key economic driver, providing diversified employment opportunities for residents and significantly shaping their livelihood patterns. This study focuses on five tourism communities within the Wulingyuan Scenic Area—Longweiba Community, Luoguta Community, Yejipu Community, Sinanyu Community, and Wujiayu Community—as the research areas (Figure 1). These communities exhibit the following characteristics: (1) Spatial Interlacing: They are geographically intertwined with the boundaries of the Wulingyuan Scenic Area, forming a spatially intertwined pattern. (2) Industrial Typicality: The tourism and related supporting industries are well developed, exhibiting typical tourism community features. (3) Sustainable Development Potential: Located near the five ticket stations of the Wulingyuan Scenic Area, they demonstrate potential for sustainable development.

2.2. Data

2.2.1. Data Collection and Sources

This study investigates the spatiotemporal evolution characteristics of residents’ livelihood resilience in tourism destinations. Primary household data were collected through semi-structured interviews and questionnaire surveys, supplemented by historical data obtained through retrospective survey methodology [21]. In light of people’ vivid memories of the COVID-19 pandemic’s effects on the tourism sector, the study period was divided into three stages: the normal tourism stage (before 2020), the epidemic disruption stage (2020–2022), and the tourism recovery stage (after 2022).
The data collection process was implemented in three sequential phases:
(1)
Preparation Phase: A literature review was conducted to synthesize existing frameworks of livelihood resilience. Measurement indicators were defined based on prior studies, and both survey instruments and interview protocols were designed.
(2)
Preliminary Survey Phase: In November 2023, field research was conducted in relevant departments of Wulingyuan District, Zhangjiajie City, to collect basic data on social, economic, and ecological environments, establishing a research background framework. Subsequently, pre-surveys were conducted in five typical communities within the core scenic area. A random sample of 10–15 households from each community was selected for questionnaire testing. Based on the pre-survey results, the questionnaire design was further optimized, including rephrasing ambiguous questions, deleting redundant questions, and adding new questions to address gaps identified during the pilot survey.
(3)
Formal Survey Phase: From January to February 2024, following the route of Longweiba–Luoguta–Yejipu–Sinanyu–Wujiayu, a stratified random sampling method was adopted to select 70–77 households from each community for a 20-day formal household survey. To ensure data representativeness and reliability, collected data subsets were cross-checked for consistency and completeness, and follow-up interviews were conducted to verify data in cases of discrepancies.
This study administered a total of 372 questionnaires. Upon the exclusion of invalid questionnaires, 365 valid responses were collected, yielding a response rate of 98.12%. Analysis of the sample’s basic characteristics indicated that the respondents were predominantly male household heads (64.38%), with most aged 40 and above (83.56%). The ethnic composition was dominated by the Tujia ethnic group (93.97%), with a small proportion of Bai and Han ethnic groups. Household sizes were mostly 3~6 people, aligning with local family structure characteristics.

2.2.2. Index System Construction and Variable Description

Livelihood resilience theory highlights the interaction between humans and social systems. Its essence is characterized by the ability of livelihood systems to self-regulate, learn, adapt, and promote transformation in response to external disturbances, thus maintaining normal system operations and achieving optimized development [22]. As a central focus in sustainable livelihood research, the construction of a livelihood resilience analysis framework is crucial for scientifically assessing the livelihood resilience levels of resident households [23]. The three-dimensional analysis framework (buffer capacity, self-organization capacity, and learning capacity) proposed by Speranza et al. [11] has gained widespread academic acceptance. However, this framework lacks consideration of the adaptability of resilience subjects to external environments. In fact, residents’ livelihood resilience is influenced by both internal structural factors and external environmental disturbances. Based on this, this study extends the work of Speranza et al. by constructing a livelihood resilience evaluation index system from three dimensions—buffer capacity, adaptive capacity, and transformation capacity (Table 1)—to better capture the multidimensional characteristics of residents’ livelihood resilience.
Buffer capacity is defined as the degree to which a system can absorb disturbances and changes without compromising its original structure, functions, characteristics, and feedback mechanisms [11]. For residents, buffer capacity is mainly manifested as the ability to utilize existing asset resources to cope with external disturbances and maintain or enhance livelihood outputs [9], forming the foundation for improving livelihood resilience. This study adopts livelihood capital as a proxy for buffering capacity, with greater accumulation of livelihood capital corresponding to enhanced buffering capabilities.
Adaptive capacity refers to residents’ ability to actively respond to external disturbances through internal interactive mechanisms such as cognition, learning, and organizational management [24]. The stronger the residents’ cognitive, learning, and organizational management abilities, the greater their adaptability to external environmental changes and their capacity to cope with shocks.
Transformation capacity is defined as residents’ ability to achieve livelihood strategy transformation through their own efforts or government support when facing external shocks [7]. This study evaluates transformation capacity from three dimensions: policy support, transformation pathways, and livelihood diversity. Policy support offers residents new livelihood options, while a higher livelihood diversity index indicates greater transformative capacity.

2.3. Research Methods

2.3.1. Assessment of Residents’ Livelihood Resilience

(1)
Reliability and Validity Testing
The constructed evaluation system was assessed using the Ω coefficient. As shown in Table 2, the Ω coefficients for the three dimensions of residents’ livelihood resilience exceed 0.600, indicating that the reliability of the constructed evaluation dimensions is acceptable [25].
(2)
Calculation of Indicator Weights
The CRITIC method, an objective weighting technique, considers both the degree of variation of the index and the correlation among the indicators. Compared to the entropy weight method, the CRITIC method offers greater advantages in comprehensive evaluations involving multiple indicators and objects [26]. Therefore, this study employs the CRITIC method to objectively assign weights based on the variability and conflict between resilience indicators (Table 2).
➀ Standardize the raw data to construct matrix Y. The formula for standardization is as follows:
Y i j = x i j m i n ( x j ) m a x ( x j ) m i n ( x j )
where Yij denotes the standardized value of the jth indicator for the ith sample, max(xj) represents the maximum value of the jth indicator, and min(xj) represents the minimum value of the jth indicator.
➁ Measure the variability of the evaluation indicators, represented by the standard deviation Sj:
S j = i 1 n X i j X j ¯ 2 n 1
In the formula, Sj denotes the standard deviation of the jth indicator, reflecting the degree of variability of indicator j. Specifically, a higher Sj value indicates greater variability of indicator j, necessitating an increase in its weight appropriately.
➂ Calculate the correlation between indicators, and the conflict of indicators is represented by Vj.
V j = i = 1 n 1 r i j
where rij denotes the correlation coefficient between evaluation indicators i and j. The larger the rij value, the stronger their correlation, thus reducing information overlap by assigning lower weights.
➃ Compute the information entropy Cj:
C j = S j × i = 1 n 1 r i j = S j × V j
➄ Calculate the weight Wj:
W j = C j j = 1 n C j
Refer to Table 1 for the weight values according to the indices of the sample livelihood resilience assessment.
(3)
Comprehensive Index Method
This study characterizes livelihood resilience as a holistic expression of three dimensions: buffer capacity, adaptive capacity, and transformation ability. The complete index approach [15,22] is utilized to compute the livelihood resilience index (Ri) of residents in tourism communities. The value range of each dimension index spans from 0 to 1. The nearer the Ri value is to 1, the greater the residents’ livelihood resilience. This study establishes grading standards for assessing the livelihood resilience of inhabitants in tourism communities around World Natural Heritage sites, based on the categorization criteria of the livelihood resilience index found in prior research [27,28,29], as detailed in Table 2:
(4)
Paired t-test and one-way ANOVA
Paired t-tests [30] and one-way ANOVA [31] were employed to analyze the significance of differences in resilience indices across the three stages. Paired t-tests were used to compare the mean resilience indices between consecutive stages, while ANOVA was applied to assess overall variations across all three stages. A threshold of p < 0.05 indicated that changes in the resilience index were not due to random fluctuations.

2.3.2. Spatiotemporal Evolution of Residents’ Livelihood Resilience

(1)
Standard Deviation Ellipse Method
The standard deviation ellipse provides a visual and intuitive means to depict the spatial representation and multidimensional characteristics of livelihood resilience. In this study, parameters of the standard deviation ellipse—such as area, major axis, minor axis, shape index, and centroid—are employed to identify the spatial layout of livelihood resilience among residents in the Wulingyuan Scenic Area. These parameters capture the multidimensional features of centrality, expansiveness, directionality, and spatial form, thereby providing an intuitive portrayal of the spatiotemporal evolution of livelihood resilience in the region. Specifically, if livelihood resilience exhibits a clustering trend, the distribution ellipse will contract spatially; if it shows a dispersed aggregation trend, the ellipse will expand spatially; and if it follows a stable growth pattern, the distribution ellipse will remain relatively stable.
(2)
Spatial Autocorrelation
Spatial autocorrelation [32] is a methodological tool used to assess the spatial clustering of attributes across spatial units, primarily characterized by two metrics: global Moran’s I and local Moran’s I. Building on the assessment outcomes of livelihood resilience among rural households in the tourism community of Wulingyuan Scenic Area, this study applies the global Moran’s I index to examine the presence of spatial clustering in rural households’ livelihood resilience at a global scale. Additionally, the local spatial autocorrelation technique, specifically “cluster and outlier analysis”, is utilized to analyze the spatial clustering patterns of rural households’ livelihood resilience.
The formula for calculating the global Moran’s I index is as follows:
I = i = 1 n j = 1 n w i j R i R ¯ R j R ¯ i = 1 n j = 1 n w i j i = 1 n R i R ¯ 2
In the formula, I represents the Moran’s I index; Ri and Rj represent the average livelihood resilience in the i-th and j-th evaluation units, respectively; R ¯ denotes the average livelihood resilience across the entire region; wij represents the elements of the spatial weight matrix, indicating the spatial relationship (weight) between spatial units i and j.
This study was conducted according to the following route, as shown in Figure 2:

2.3.3. Influencing Factors of Residents’ Livelihood Resilience

Utilizing materials derived from non-participatory observation and semi-structured interviews, alongside the current circumstances of the case region, the procedural coding method in grounded theory research is employed to analyze the interview data [33]. The conceptual categories and logical relationships of influencing elements are delineated to ascertain the determinants of people’s livelihood resilience.
(1)
Open Coding
In the open-coding stage, we strictly adhere to the principle of being close to the data. First, carefully read and analyze the interview text data and sort out the descriptive statements closely related to the research topic. Then, coding elements are extracted accordingly to determine the corresponding concepts and categories. Second, NVivo 15 software is used to automatically code the original text data. Through discrimination, screening, and optimization, 105 basic concepts are finally extracted. Based on the conceptualization and the logical relationship between the research topic and the concepts, a total of 16 categories are extracted (see Table 3 for coding examples).
(2)
Axial Coding
Axial coding is based on extracting and exploring the logical relationships between different concepts and categories in open coding. Based on the inter-relationships and logical relationships between categories, further classification and comparison are conducted. The basic concepts and categories are re-classified, and the main categories that dominate other categories are selected [33]. A total of 7 main categories are selected (Table 4).
(3)
Selective Coding
Based on axial coding, selective coding further abstracts and integrates the main categories. Ultimately, the core categories are summarized into two dimensions: livelihood shock situation and livelihood coping strategies, which significantly influence the livelihood resilience of residents in tourism communities under the impact of the epidemic (Table 5).

3. Results

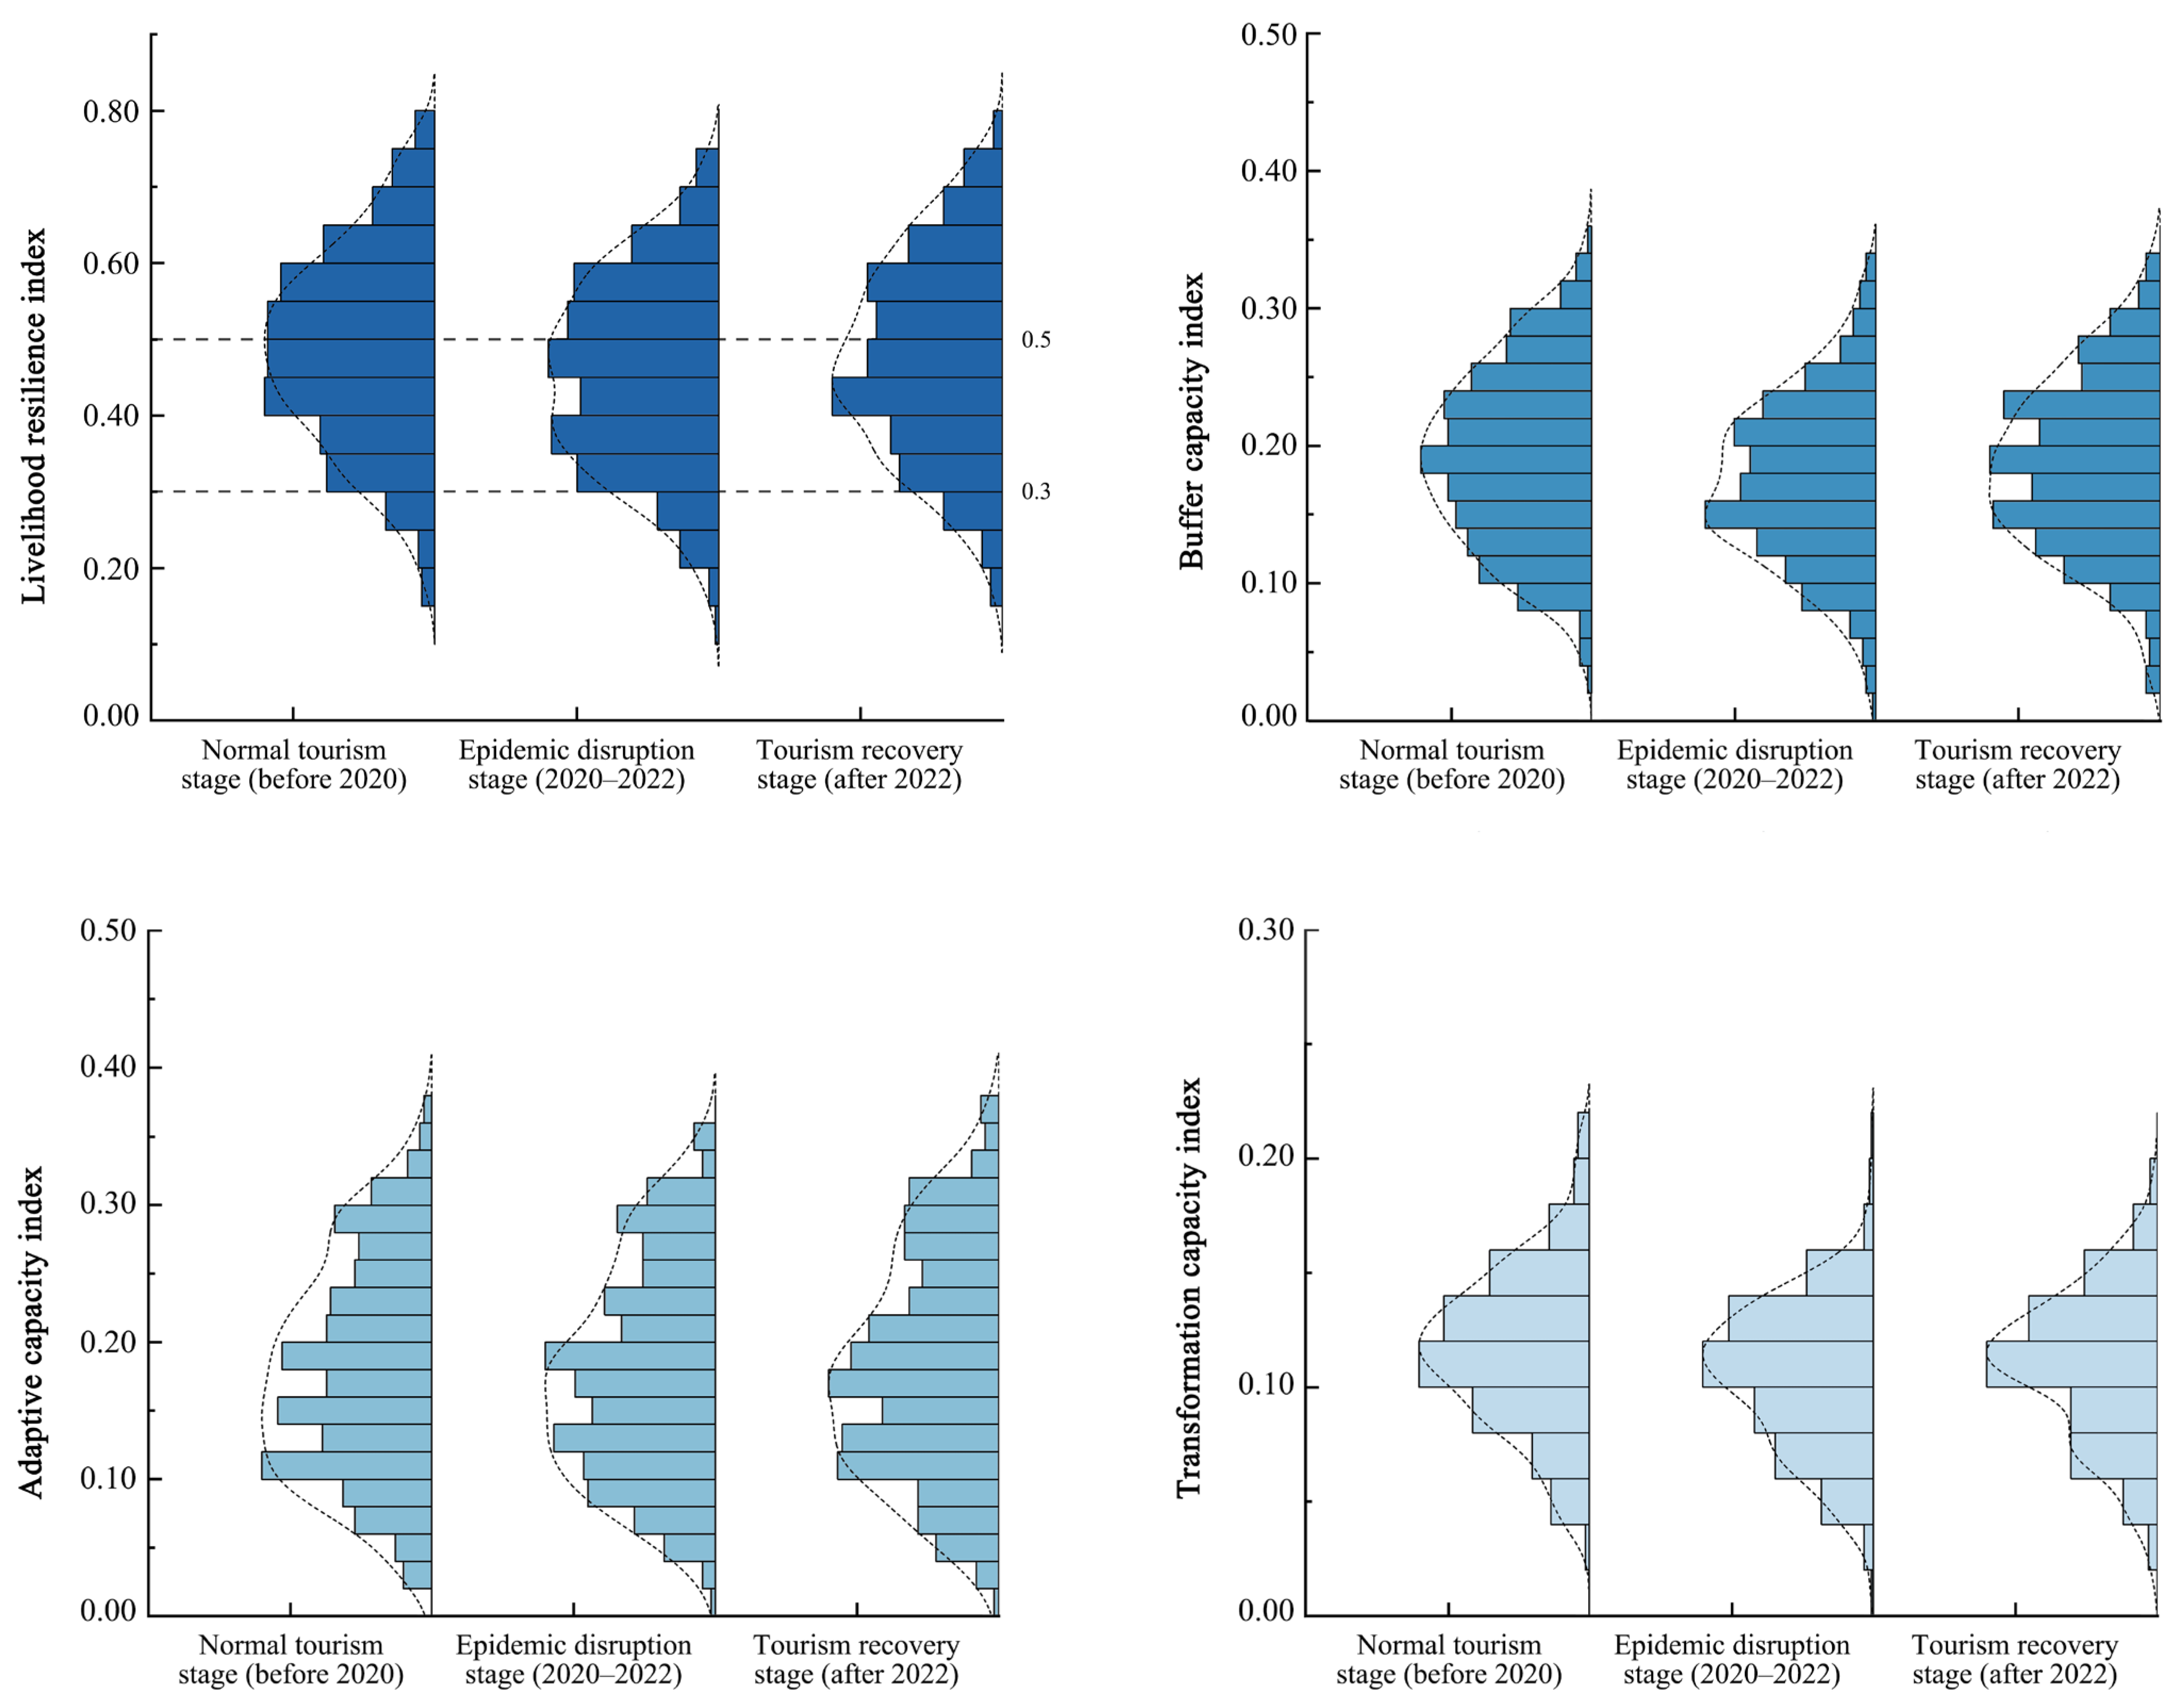
3.1. Temporal Dynamics of Livelihood Resilience in Tourism-Dependent Communities

Temporal Evolution of Livelihood Resilience

Amid the COVID-19 pandemic, the livelihood resilience index of residents in the Wulingyuan Scenic Area, a tourism-dependent community, showed noticeable fluctuations. The mean livelihood resilience index values were 0.4866 during the normal tourism stage (before 2020), 0.4556 during the epidemic disruption stage (2020–2022), and 0.4763 during the tourism recovery stage (after 2022). The index decreased by 6.38% from the normal tourism stage (before 2020) to the epidemic disruption stage (2020–2022) (Table 6) and increased by 4.54% from the epidemic disruption stage (2020–2022) to the tourism recovery stage (after 2022). Despite fluctuations due to external disruptions, residents’ livelihood resilience remained at a moderate level overall. Notably, during the tourism recovery stage (after 2022), the resilience demonstrated strong recovery, indicating enhanced adaptability and resilience to changes (Figure 3).
A closer examination of the changes in the capacity indices across dimensions reveals that the structure of residents’ livelihood resilience transitioned from “buffer capacity > adaptive capacity > transformation capacity” to “adaptive capacity > buffer capacity > transformation capacity” and then back to “buffer capacity > adaptive capacity > transformation capacity”. During the normal tourism stage (before 2020), buffer capacity served as the primary dimension, playing a central role in maintaining resilience through existing assets and resources. Due to the unique geographical characteristics of the Wulingyuan Scenic Area, most community residents relied heavily on tourism development as their primary income source. During the epidemic disruption stage (2020–2022), the implementation of containment measures drastically reduced off-site employment opportunities, while limited alternative livelihood options led to a decline in livelihood capital and weakened buffer capacity. Households proactively adjusted livelihood strategies to cope with the abrupt reductions in tourism income, resulting in significantly enhanced adaptive capacity to address emerging challenges and uncertainties. During the tourism recovery stage (after 2022), both buffer and adaptive capacities demonstrated stronger recovery resilience, especially adaptive capacity, with its mean value surpassing that of the epidemic disruption stage (2020–2022). However, buffer capacity and adaptive capacity exhibited robust recovery during the tourism recovery stage (after 2022). Although transformation capacity experienced partial recovery during the tourism recovery stage (after 2022), it still failed to reach the level of the normal tourism stage (before 2020), suggesting that significant challenges remain in the transformation process. This dynamic evolution deepens the understanding of resilience mechanisms in tourism-dependent communities, revealing phase-specific flexibility and adaptive traits that underscore the recoverability and sustainability of livelihoods. Overall, the livelihood system in Wulingyuan could buffer certain shocks and adapt to specific disturbances but exhibited limited self-adjustment and transformative capacities, constraining breakthroughs toward higher stability beyond existing livelihood models.

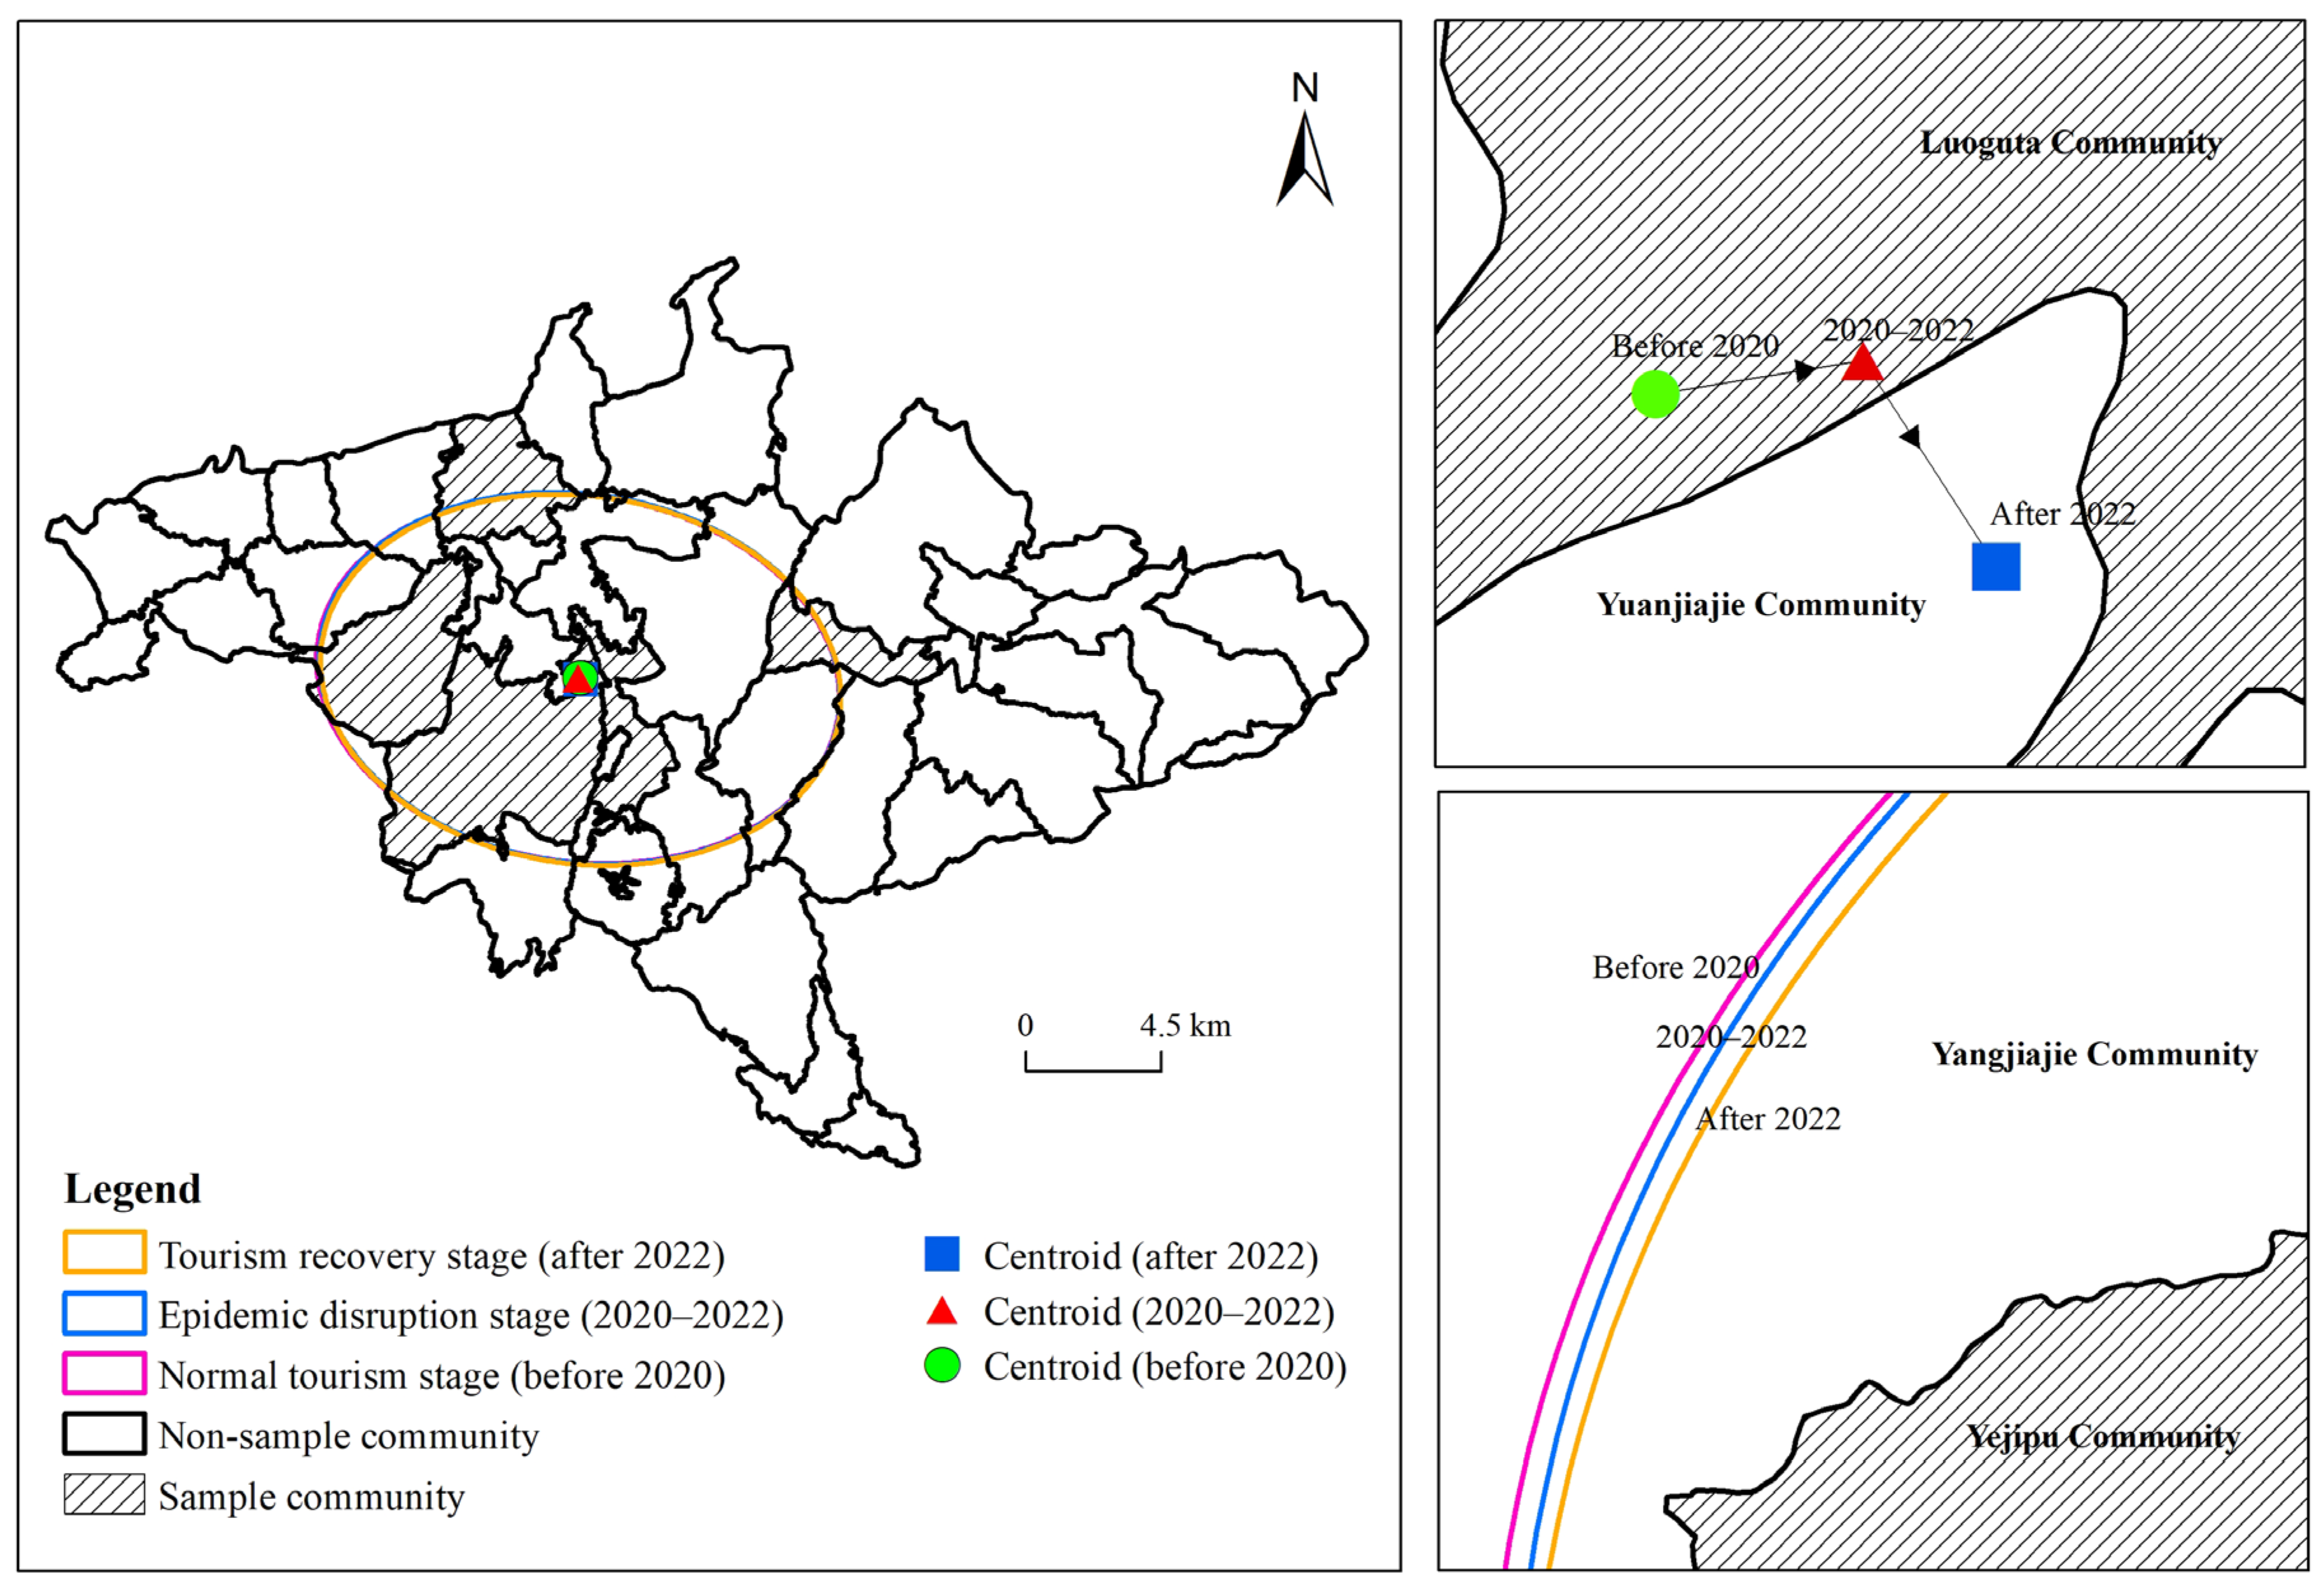
3.2. Spatial Evolution Pattern of Livelihood Resilience in Tourism Community Residents

Using the standard deviation ellipse method, the spatial distribution of livelihood resilience among community residents was calculated, as shown in Figure 4. From the normal tourism stage (before 2020) to the tourism recovery stage (after 2022), the spatial pattern of livelihood resilience extended from northwest to southeast and gradually shifted towards the southeast. The central point of livelihood resilience moved northeast by 52.52 km from coordinates (110°27′26″ E, 20°20′51″ N) to (110°27′28″ E, 29°20′51″ N) and then shifted further southeast by 61.41 km, reaching (110°27′28″ E, 29°27′29″ N). This shift indicates that during the study period, livelihood resilience exhibited a spatial-temporal evolution pattern, where the northwest region showed an initial increase, followed by the southeast region catching up. The area of the ellipse initially increased slightly from 165.44 km2 to 165.75 km2, before decreasing to 165.18 km2. This suggests that the spatial heterogeneity of livelihood resilience first expanded slightly and later contracted, showing a tendency towards greater concentration. The long axis of the ellipse shortened from 523.29 km to 512.21 km, while the short axis expanded from 363.69 km to 383.17 km. The shape index persisted in its ascent, signifying that the geographical distribution of livelihood resilience evolved towards a more circular form over time, demonstrating a gradual enhancement in radial spatial equilibrium.
Before 2020, residents of Wujiayu Community maintained a high level of livelihood resilience due to their historically accumulated livelihood assets, the provision of service infrastructure, geographical market advantages, and the growth potential of the tertiary sector. However, from 2020 to 2022, the COVID-19 pandemic caused unprecedented disruptions to Wulingyuan’s tourism industry. Strict COVID-19 prevention measures severely impacted tourist experiences, leading to a sharp decline in tourist numbers, reduced resident incomes, and notable consumption downgrading. This trend severely disrupted the production and daily life of communities near scenic areas like Yejipu, Sinanyu, and Longweiba, necessitating rapid enhancements in their livelihood systems’ buffering and adaptive capacities. The government implemented timely market regulations, laying a solid foundation for post-pandemic tourism recovery. The alterations validated the pandemic’s detrimental influence on the livelihood resilience of tourist-reliant communities, emphasized its significant repercussions on regional economic equilibrium, and accentuated the critical role of tourism in maintaining regional economic stability.
The spatial autocorrelation of livelihood resilience among 365 households across five communities was examined utilizing the ArcGIS’s Spatial Autocorrelation Tool (Table 6). All global Moran’s I index values were positive and statistically relevant at the 1% level (p-Value < 0.01, Z-Score > 2.58), signifying substantial positive spatial autocorrelation and the existence of “high-high” or “low-low” clustering patterns. During the study period, the spatial autocorrelation of livelihood resilience followed a “U-shaped” trend: Moran’s I values decreased from the normal tourism stage (before 2020) to the epidemic disruption stage (2020–2022) and then rose significantly during the tourism recovery stage (after 2022). The process is still in an unstable stage, and “high-high” or “low-low” spatial clustering may be a significant trend in the future.
Spatial clustering analysis of livelihood resilience among 365 households in five communities was performed using ArcGIS’s Cluster and Outlier Analysis tool. Before 2020, residents with “high-high” clustering were concentrated in Luoguta Community near the Forest Park ticket station, while those with “low-low” clustering were mainly distributed in Longweiba and Sinanyu Communities. After 2020, the re-emergence of the COVID-19 pandemic caused significant fluctuations in livelihood resilience, particularly in Sinanyu Community, where the number of residents with “high-high” clustering was comparable to those with “low-low” clustering. During the post-pandemic recovery phase, residents in four communities (excluding Longweiba) exhibited “high-high” clustering. This distribution pattern may be closely linked to the level of socio-economic development, spatial population distribution, and mobility patterns. Specifically, communities with high tourist numbers and dense populations exhibited “low-low” clustering under the pandemic’s impact, while those with fewer tourists and sparse populations, being less affected, showed “high-high” clustering. These spatial patterns suggest that the pandemic’s impact on livelihood resilience varied across communities, closely tied to their socio-economic development levels and population distribution characteristics.

3.3. Influencing Factors of Tourism Community Residents’ Livelihood Resilience

3.3.1. Livelihood Shock Conditions

(1)
Livelihood Vulnerability
The COVID-19 pandemic caused significant global economic impacts, plunging the world into a deep recession and delivering unprecedented shocks to China’s economic and social development. As a major tourist destination in China, the Wulingyuan Scenic Area, with its highly tourism-dependent economy, exhibited significant vulnerability to the pandemic’s impacts. China’s comprehensive, strict, and thorough COVID-19 prevention measures effectively curbed the pandemic’s spread but also profoundly impacted the livelihoods of residents in Wulingyuan’s tourism communities. In the pandemic’s initial stages, tourism activities halted completely, scenic areas closed, residents’ incomes plummeted, and livelihood vulnerability increased significantly. The pandemic caused cash flow shortages, supply chain breakdowns, and shrinking market demand for tourism enterprises, leading to reduced consumer goods supply and rising prices. Residents faced rising living costs and heightened employment pressure, especially those in tourism-dependent communities, such as homestay operators, tour guides, and small merchants, who experienced income disruptions and livelihood challenges. Amid these challenges, residents’ consumption attitudes shifted significantly, with widespread consumption reduction. For instance, residents cut non-essential spending and prioritized basic daily needs, leading to persistently low demand for tourism-related services and delaying the tourism economy’s recovery. As a result, livelihood vulnerability in Wulingyuan increased significantly, and resilience correspondingly weakened.
(2)
Tourism Development Conditions
➀ Decrease in Visitors
The pandemic significantly impacted Wulingyuan Scenic Area. Residents, due to perceived risks, avoided travel to minimize virus exposure, leading to a sharp decline in consumer confidence, travel intentions, and capacity. Strict COVID-19 prevention measures not only weakened tourist experiences but also significantly reduced visitors to Wulingyuan, a World Natural Heritage site. The decline in tourists caused direct economic losses, severely impacting tourism-dependent residents, especially those relying on tourism for their livelihoods. After the pandemic, pent-up travel demand surged. Wulingyuan implemented large-flow emergency measures and a strict reservation-based entry system, limiting tourist access and further reducing visitor numbers. Hotels, homestays, restaurants, and agritainment businesses faced operational challenges, reducing employment opportunities and significantly increasing livelihood vulnerability for related workers.
➁ Management Deficiencies
The core scenic area of Wulingyuan faces issues like inadequate resident participation mechanisms and inequitable benefit distribution. For instance, residents’ direct involvement in tourism activities is limited, and collaboration opportunities with tourism companies are scarce. Conflicts of interest between enterprises and residents have become increasingly prominent, requiring urgent resolution. Due to insufficient integrated planning, infrastructure in and around the scenic area is incomplete, and construction projects are disorganized, highlighting these issues. For example, the lack of overall planning, community hospitals, service stations, supermarkets, and other supporting infrastructure, as well as intermittent construction projects, have caused inconvenience to both tourists and residents.
Tourism development is influenced by both tourist numbers and the management of tourism operations. The COVID-19 pandemic caused a sharp decline in tourist numbers, leading to operational challenges for scenic area-related businesses. Insufficient tourists made operations unsustainable, significantly increasing livelihood vulnerability. Prominent benefit distribution conflicts, imperfect participation mechanisms, the lack of overall tourism planning, and weak infrastructure collectively created an unfavorable tourism environment. Residents’ interests were unmet, and their participation in tourism projects was limited, further reducing livelihood resilience.
(3)
Livelihood Capital Conditions
Tourism development in Wulingyuan has boosted regional infrastructure. Residents increased investments in utilities like water, electricity, and heating to improve business and living environments. Some residents increased their income by providing food ingredients and accommodation services to tourists. Increased physical capital investment enhanced residents’ ability to cope with external shocks like natural disasters, improving their livelihood resilience.
After Wulingyuan’s development, traditional farming-based livelihoods around the scenic area were restricted. Some residents’ crops were damaged by protected wildlife, and arable land decreased, limiting natural capital. Agricultural production was severely constrained, preventing natural capital from serving as a buffer income source. The lack of human capital further weakened households’ livelihood capacity, as labor loss and health crises reduced the available workforce. Simultaneously, financial capital shortages made it difficult for residents to access external support when facing risks. The pandemic exacerbated these issues, making residents more vulnerable to sudden shocks. Restricted labor mobility and frequent health issues (e.g., illness-induced poverty) significantly reduced household labor capacity, further increasing economic burdens. The tourism stagnation directly impacted returns on investments like homestays, significantly reducing residents’ income sources. Meanwhile, basic living expenses during the pandemic and the need to recoup existing investments placed residents under dual economic pressure, causing severe income–expenditure imbalances and financial capital shortages, further worsening their economic difficulties. These factors collectively reduced residents’ livelihood resilience, hindering their ability to recover and adapt quickly to sudden events.
With optimized pandemic measures and the gradual recovery of the tourism market, the revival of tourism brought new economic opportunities to residents, particularly in homestays, catering, transportation, and specialty goods sales. The recovery of tourism income improved residents’ financial capital levels, alleviating pandemic-induced economic pressure. This enabled residents to gradually resume productive investments and daily expenses, enhancing their ability to buffer against risks and sudden events. This enhanced capacity directly improved residents’ livelihood resilience.

3.3.2. Livelihood Coping Strategies

(1)
Coping Capacity
With the development of the Wulingyuan Scenic Area, the residents’ organizational and management capabilities have improved, particularly in terms of establishing and utilizing social networks, which has demonstrated notable flexibility and adaptability. For instance, residents have continuously refined their guesthouse management models by collaborating with relatives, neighbors, and learning from industry leaders. This improvement in social networks has provided crucial emotional support and resource-sharing channels, which have played a key role in stabilizing their livelihoods and strengthening their ability to cope with risks, both during and after the pandemic.
Despite this, challenges persist, particularly in the areas of market dynamics, training opportunities, and educational investment, which have hindered the development of residents’ coping capacities. The pandemic highlighted the residents’ limited understanding of market trends, the shortage of skill training opportunities, and inadequate educational resources. For example, some residents struggled to meet the recovery demands of the tourism market, especially regarding guesthouse renovations and service upgrades, due to insufficient professional knowledge and skills. Moreover, the lack of training opportunities and limited educational investment further obstructed their ability to acquire new skills, thereby restricting their capacity to diversify their livelihoods and manage risks.
The changes in residents’ adaptive capacity during the pandemic display a dual characteristic. On one hand, the strengthening of social capital and organizational management has significantly facilitated the recovery of livelihood resilience. On the other hand, gaps in learning abilities have limited further improvements in their resilience.
(2)
Transformation Potential
Residents’ limited livelihood diversification, over-reliance on tourism, and underdevelopment of other industries resulted in limited job opportunities and insufficient capacity for transformation during the pandemic. The mono-industrial structure made it difficult for residents to transition quickly when tourism income declined sharply, exacerbating their livelihood vulnerability. The lack of financial resources, technological deficiencies, and limited participatory capacity collectively hindered residents’ proactive transformation initiatives. For instance, when establishing homestays or developing services related to tourism, some residents struggled to adapt rapidly to market changes due to insufficient financial investment or technical support. During the pandemic, this capacity gap became increasingly evident, making livelihood transformation more difficult for residents and significantly diminishing their risk resilience.
(3)
Psychological State
The sudden outbreak of the pandemic exceeded the residents’ usual perceptions and expectations, manifesting in psychological responses such as “unforeseen, at a loss, unprecedented, and unimaginable”. This psychological gap and confusion significantly affected the residents’ ability and confidence to cope with the pandemic. Some residents, due to their pessimistic outlook on the tourism market, were forced to abandon or postpone business plans, which not only reduced their income but also made their livelihoods unstable, further weakening their livelihood resilience. Despite the impact of the pandemic, some residents still demonstrated a certain level of positivity and confidence, showing the possibility of gradually improving their transformation capacity. Firstly, residents’ trust in national policies and confidence in tourism resources provided psychological support for the recovery of their livelihoods. Additionally, some residents have adjusted their guesthouse decorations and services based on market demand to cater to tourists’ preferences, indicating that residents are gradually adapting to market changes and enhancing their transformation capabilities. The residents’ positive attitude and gradually improving market adaptability provide a foundation for the recovery of their livelihood resilience.
(4)
Relief Measures
Tourism experiences and supply are often constrained by institutional policies, and policy interventions have played a significant role in alleviating residents’ livelihood difficulties and supporting their recovery and adaptation [34]. However, the “mobility controls” imposed on tourism policies during the pandemic directly led to a reduction in tourist activity, which impacted the livelihood capacities and recovery processes of residents in tourism-dependent communities. Phrases such as “suspension of tourism activities” and “gradual recovery of individual tourists” reflect the evolving nature of tourism policies in response to the pandemic. During the early stages of the pandemic, government measures like suspending tourism activities and banning group tours caused tourism to effectively stop, leading to a sharp decline in residents’ income. As restrictions eased and individual and group tourism gradually resumed, opportunities for residents’ income recovery arose, which was crucial for restoring and enhancing their livelihood resilience. Meanwhile, tourism communities and industry professionals implemented marketing strategies such as promotional campaigns, advertising, and the distribution of tourism vouchers to boost the attractiveness of tourism products and services, increase tourist traffic, and raise residents’ income. These measures played a pivotal role in the rapid recovery and rebound of residents’ livelihood resilience after the crisis. Thus, the relief measures during the pandemic helped mobilize residents’ intrinsic motivation and provided stability for the ongoing development of livelihood resilience, serving as a key factor in strengthening their ability to cope with future uncertainties.

4. Discussion

Livelihood resilience, a critical component within the realm of sustainable development studies, significantly contributes to global poverty alleviation efforts [7]. Prior research on livelihood resilience has predominantly centered on rural tourism communities and farming households, investigating the interplay among various factors such as vulnerability contexts [35], livelihood capital [36,37], livelihood strategies [38], livelihood outcomes [39], and land use [40]. Additionally, studies have examined residents’ attitudes toward tourism [41] and their mental health and social impacts [42], as well as risk perception and safety management [43]. Attention has also been directed toward diverse categories of farming households, including those recovering from disasters [23], those lifted out of poverty [44], those residing in ecologically fragile zones [10], and those undergoing relocation [19]. In response to public health emergencies, certain tourism-dependent regions have implemented strategies such as supply-side contraction [43], digital transformation, and financial relief policies [45], offering valuable case studies for optimizing livelihood recovery pathways in Wulingyuan. Nevertheless, gaps remain in understanding the characteristics and determinants of tourism residents’ livelihood resilience amidst public health crises. Grounded in the theory of livelihood resilience and the sustainable livelihood analysis framework, this study develops an evaluation index system to assess household livelihood resilience in World Natural Heritage sites, encompassing three dimensions: buffer capacity, adaptive capacity, and transformation capacity. It further investigates spatiotemporal evolution and influencing factors of tourism farming households’ livelihood resilience under pandemic conditions, providing insights for analogous tourism regions in enhancing the resilience of their farming communities.
Currently, the tourism industry has revealed significant vulnerabilities in the face of sudden disruptions, with its monolithic industrial structure rendering the livelihoods of tourism community residents highly susceptible to shocks. From a governmental perspective, there is an urgent need to enhance tourism support policies. Governments should leverage the strategies of industrial diversification employed in rural revitalization initiatives, increase investments in tourism community infrastructure, and foster synergistic development between the tourism sector and other industries. Furthermore, governments must develop a robust, long-term policy support system to ensure policy comprehensiveness and continuity, facilitate social capital investment in tourism community development, and create additional employment and entrepreneurial opportunities for residents. As the primary platform for both residents’ daily lives and tourism operations, communities play an indispensable role in bolstering residents’ livelihood resilience. Strengthening mechanisms for community participation is critical. By establishing diverse communication channels and providing training in homestay operations, tour guide services, and specialty handicraft production, residents can actively engage in tourism development planning and daily management, which is essential for achieving sustainable community tourism. Residents’ proactive efforts are equally central to enhancing livelihood resilience. In the rapidly evolving tourism market, residents should actively acquire new skills and enhance their competencies. This not only enables them to better adapt to market demands but also opens up development opportunities across various facets of the tourism industry. The sudden outbreak of the COVID-19 pandemic had a significant adverse impact on tourism at World Natural Heritage sites, particularly in areas with high dependency on the tourism industry. The global lockdowns and travel bans resulting from the pandemic led to a dramatic decline in visitor numbers, pushing many heritage sites into an unprecedented economic crisis. This, in turn, directly affected the livelihoods of local communities, diminishing their access to and accumulation of livelihood capital, and weakening household resilience.
Previous studies on the effects of the pandemic on tourism destinations and residents have primarily focused on residents’ attitudes towards tourism [32], mental health impacts, and social consequences [33], as well as risk perception and safety management [34]. However, few studies have explored the relationship between household livelihood resilience and public health events. This study builds upon community-level economic and social emergency survey data from three phases: the normal tourism stage (before 2020), the epidemic disruption stage (2020–2022), and the tourism recovery stage (after 2022). It develops a livelihood resilience measurement framework for World Natural Heritage tourism sites, computes the livelihood resilience index (LRI) for these three periods, and applies spatial analysis tools such as standard deviation ellipses and global Moran’s I to explore the spatial evolution of livelihood resilience in the sample communities. Additionally, grounded theory is used to identify the core factors influencing this resilience. This study expands on the spatial distribution of household livelihood resilience, regional resilience, and overall livelihood resilience through multi-scale analysis, enhancing both the depth and scope of livelihood research within the context of public health crises. As such, it contributes to advancing current research on livelihood resilience in tourism-dependent regions.
The survey revealed that economic and social development has enabled residents to accumulate certain livelihood assets to cope with external risk shocks. However, the pandemic still significantly impacted the production and daily lives of affected residents. Post-pandemic, LRI levels showed a gradual decline [35], while during the recovery phase, LRI levels gradually increased but did not return to pre-pandemic levels. Changes in the structure of livelihood resilience, particularly the adjusted weights of buffering, adaptive, and transformation capacities, highlight the profound impact of external shocks on resilience composition. During the pandemic disruption phase, enhanced adaptive capacity served as a strategy to cope with uncertainties. As tourism recovered, buffer capacity re-emerged as the primary component, demonstrating the restorative and sustainable nature of residents’ livelihoods.
Under the complex interplay of household structure, individual conditions, and external environments, residents with different livelihood types showed varying resilience levels. Tourism-dependent households exhibited significantly higher resilience than other types, indicating their ability to better leverage tourism-related economic opportunities to enhance resilience. Labor-oriented households showed weaker resilience, primarily due to their reliance on external employment. Pandemic-induced labor market uncertainties further weakened their resilience. Therefore, future resilience enhancement should focus not only on tourism recovery but also on strengthening non-tourism industries, especially in severely impacted regions. Diversifying livelihood pathways may reduce dependence on a single industry.
In terms of spatial distribution, the analysis of livelihood resilience evolution revealed a northwest-to-southeast extension trend in Wulingyuan Scenic Area. This trend is closely tied to the distribution of tourism resources, transportation infrastructure, and geographical conditions. Regional disparities in resilience reflect spatial imbalances in tourism development and resource allocation. Post-pandemic, the spatial clustering effect shifted from gradual reduction to rapid increase, highlighting regional imbalances in resilience recovery. Therefore, northwest communities should strengthen resilience-building efforts, particularly in infrastructure development, social capital accumulation, and community-level governance, to promote balanced resilience enhancement.
While tourism has enhanced residents’ livelihood assets and expanded livelihood channels, pandemic-induced vulnerabilities revealed limitations in the existing economic and social structures. Tourism recovery faces multiple challenges, especially in communities overly dependent on tourism, where livelihood diversification urgently needs strengthening. Post-pandemic, tourism has shown signs of recovery, but tourist numbers remain below pre-pandemic levels, leaving livelihood resilience below pre-pandemic levels. This suggests that over-dependence on tourism may re-expose vulnerabilities in future pandemics or emergencies. Therefore, future efforts should focus on enhancing social capital and community engagement, improving community resilience, promoting industrial diversification, and creating diversified and sustainable livelihood strategies.
Overall, enhancing resilience in World Heritage communities requires not only tourism revival but also comprehensive consideration of social, economic, and environmental factors. Future research could explore strategies to comprehensively improve resilience under public health crises, particularly for low-resilience groups, enhancing their adaptability and transformative capacity to address potential uncertainties under globalization.

5. Conclusions

This study builds upon community-level economic and social emergency survey data from three phases: the normal tourism stage (before 2020), the epidemic disruption stage (2020–2022), and the tourism recovery stage (after 2022). It develops a livelihood resilience measurement framework for World Natural Heritage tourism sites, computes the livelihood resilience index (LRI) for these three periods, and applies spatial analysis tools such as standard deviation ellipses and global Moran’s I to explore the spatial evolution of livelihood resilience in the sample communities. Additionally, grounded theory is used to identify the core factors influencing this resilience.
The findings reveal the following: (1) The livelihood resilience index of households in the study area declined the epidemic disruption stage (2020–2022) [46] but increased during the tourism recovery stage (after 2022), maintaining an overall moderate level. (2) The dynamic interaction and evolution of buffer capacity, adaptive capacity, and transformation capacity collectively contribute to the evolution of residents’ livelihood resilience. (3) The spatial distribution of the livelihood resilience index extends from northwest to southeast, shifting toward the southeast, exhibiting clustering effects and undergoing an unstable evolutionary process. (4) Pandemic impacts, tourism management practices, and changes in livelihood capital reduced household livelihood resilience, while improvements in residents’ organizational management capabilities, tourism recovery, and related policies had a positive impact on household livelihood resilience. Insufficient learning capabilities and livelihood homogeneity limit the improvement of livelihood resilience.
We acknowledge that our study has certain limitations. The timeliness and geographical coverage of the data are constrained, with tracking data only available up to early 2024, and do not encompass the long-term effects of emerging trends such as virtual tourism. Furthermore, the sample is concentrated in ethnic minority communities in the Wulingyuan mountainous area, and the generalizability of the findings to other geographical and cultural contexts necessitates further validation. Future research should investigate the adaptive expansion of the resilience framework in diverse regional contexts and conduct comparative studies.

Author Contributions

Conceptualization, J.W., Q.C.; methodology, Q.C., W.O.; software W.O. and B.C.; formal analysis, J.W., S.L. and W.X.; investigation, Q.C. and Y.S.; writing—original draft preparation, Q.C.; writing—review and editing, Q.C., J.W. and S.L.; supervision, J.W., S.L. and W.X.; funding acquisition, J.W. All authors have read and agreed to the published version of the manuscript.

Funding

This research was funded by the National Natural Science Foundation of China (Grant Number: 42361032) and Philosophy and Social Science Foundation of Hunan Province (Grant Number: 22YBX007).

Institutional Review Board Statement

Not applicable.

Informed Consent Statement

Not applicable.

Data Availability Statement

Data are contained within the article.

Acknowledgments

We thank the anonymous reviewers for their constructive feedback.

Conflicts of Interest

The authors declare no conflicts of interest.

References

  1. Wang, Y.; Su, Y. Rural revitalization: A new strategy for Rural development in China. J. Cent. Inst. Soc. 2017, 6, 49–55. [Google Scholar]
  2. Srijuntrapun, P.; Fisher, D.; Rennie, H.G. Assessing the sustainability of tourism–related livelihoods in an urban World Heritage Site. J. Herit. Tour. 2018, 13, 395–410. [Google Scholar] [CrossRef]
  3. Wang, X.; Huai, J. Multi-risk assessment of agricultural meteorological disasters based on a three-level hierarchical framework. J. Nat. Resour. 2020, 35, 1460–1471. [Google Scholar]
  4. Rasoolimanesh, S.M.; Jaafar, M.; Ahmad, A.G.; Barghi, R. Community participation in World Heritage Site conservation and tourism development. Tour. Manag. 2017, 58, 142–153. [Google Scholar] [CrossRef]
  5. Lasso, A.; Dahles, H. Are tourism livelihoods sustainable? Tourism development and economic transformation on Komodo Island, Indonesia. Asia Pac. J. Tour. Res. 2018, 23, 473–485. [Google Scholar] [CrossRef]
  6. Chambers, R.; Conway, G. Sustainable Rural Livelihoods: Practical Concepts for the 21st Century; Institute of Development Studies: Brighton, UK, 1992; IDS IDS Discussion Paper 296. [Google Scholar]
  7. Xiao, Y.; Liu, S.; Zuo, J.; Yin, N.; Wu, J.; Xie, W. Farmer Households’ Livelihood Resilience in Ethnic Tourism Villages: A Case Study of the Wuling Mountain Area, China. Sustainability 2022, 15, 662. [Google Scholar] [CrossRef]
  8. Wu, J.; Liu, S.; Zhou, C. A study on the adaptability of rural households in traditional villages under the background of rural tourism development: A case study of four villages in Zhangjiajie. Econ. Geogr. 2017, 37, 232–240. [Google Scholar]
  9. Sun, Y.; Zhao, X. The evolution of livelihood resilience and its influencing factors among poverty-alleviated households in Longnan Mountainous Area. Sci. Geogr. Sin. 2022, 42, 2160–2169. [Google Scholar]
  10. Tanner, T.; Lewis, D.; Wrathall, D.; Bronen, R.; Cradock-Henry, N.; Huq, S.; Thomalla, F. Livelihood resilience in the face of climate change. Nat. Clim. Change 2015, 5, 23–26. [Google Scholar] [CrossRef]
  11. Speranza, C.I.; Wiesmann, U.; Rist, S. An indicator framework for assessing livelihood resilience in the context of social–ecological dynamics. Glob. Environ. Change Hum. Policy Dimens. 2014, 28, 109–119. [Google Scholar] [CrossRef]
  12. Nyamwanza, A.M.; New, M. Anticipatory adaptation and the role of decadal climate information in rural African livelihood systems Lessons from the Mid–Zambezi Valley, Zimbabwe. Int. J. Clim. Change Strateg. Manag. 2016, 8, 236–252. [Google Scholar]
  13. Wen, T.; Shi, Y.; Yang, X.; Wang, T. A study on livelihood resilience and its influencing factors of rural households in the semi-arid region of the Loess Plateau: A case study of Yuzhong County. Chin. J. Agric. Resour. Reg. Plan. 2018, 39, 172–182. [Google Scholar]
  14. Quandt, A. Measuring livelihood resilience: The Household Livelihood Resilience Approach (HLRA). World Dev. 2018, 107, 253–263. [Google Scholar]
  15. Zheng, D.; Huang, X.; Wang, C. Evaluation and optimization strategies of rural household livelihood resilience in the Loess Plateau of Northern Shaanxi: A case study of Yanchuan County. J. Arid Land Resour. Environ. 2020, 34, 9–16. [Google Scholar]
  16. Ye, W.L.; Wang, Y.; Min, D.; Yang, X. Temporal and spatial evolution law of the decoupling relationship between farmers’ livelihood resilience and multidimensional poverty in ecologically fragile areas: A case study of Jiaxian County, Shaanxi Province. J. Arid. Land Resour. Environ. 2021, 35, 7–15. [Google Scholar]
  17. Li, C.; Gao, M.; Li, S.Z.; Lei, H. The impact of farmers’ livelihood resilience on multidimensional poverty–Evidence from the resettlement areas for poverty alleviation in Shaanxi. China Popul. Resour. Environ. 2021, 31, 150–160. [Google Scholar]
  18. Liu, W.; Li, J.; Xu, J. Effects of disaster-related resettlement on the livelihood resilience of rural households in China. Int. J. Disaster Risk Reduct. 2020, 49, 101649. [Google Scholar]
  19. Ji, T.N.; Zhou, Z.F.; Niu, Z.H.; Zhang, J.S. Comparison of rural household livelihood resilience before and after relocation for poverty alleviation: A case study of the resettlement site in Zhexiang Town, Zhenfeng County, Guizhou Province. J. Ecol. Rural Environ. 2022, 38, 1406–1414. [Google Scholar]
  20. Su, F.; Zheng, Y.; Tong, L.; Zhang, P.; Lin, Q. A study on the livelihood resilience of landless farmers in the urban fringe of economically developed regions: A case study of Hangzhou City. Sci. Geogr. Sin. 2022, 42, 2047–2056. [Google Scholar]
  21. Cutter, S.L.; Barnes, L.; Berry, M.; Burton, C.; Evans, E.; Tate, E.; Webb, J. A place-based model for understanding community resilience to natural disasters. Glob. Environ. Change 2008, 18, 598–606. [Google Scholar]
  22. Liu, J.L.; Ma, H.Q.; Xi, J.C.; Li, Z.; Li, W. Measuring and analyzing the livelihood resilience and its influencing factors of residents in heritage tourism destinations: A case study of Pingyao Ancient City, Shanxi. Tour. Trib. 2023, 38, 70–83. [Google Scholar]
  23. Fang, Y.P.; Zhu, F.B.; Qiu, X.P.; Zhao, S. Effects of natural disasters on livelihood resilience of rural residents in Sichuan. Habitat Int. 2018, 76, 19–28. [Google Scholar] [CrossRef]
  24. Wu, J.; Xiao, Y.; Liu, S.; Zuo, J.; Yin, N.; Xie, W. Evaluation of rural household livelihood resilience and analysis of barrier factors in ethnic tourism villages: A case study of 10 villages in the Wuling Mountain area of Hunan and Hubei. Econ. Geogr. 2024, 44, 174–184. [Google Scholar]
  25. Shao, Z.; Tang, Y.; Zhang, J. Technical report on the second round of social and emotional skills assessment of Chinese adolescents. J. East China Norm. Univ. (Educ. Sci.) 2024, 42, 58–71. [Google Scholar]
  26. Li, Z.; Shi, L.; Zhang, C. Vulnerability assessment and differentiated response strategies of rural territorial systems in counties from a socio-ecological perspective. Econ. Geogr. 2022, 42, 175–184. [Google Scholar]
  27. Cui, X.; Chen, J.; Yang, X. A study on the sustainable livelihoods of rural households influenced by rural tourism: A case study of Ankang in the Qinba Mountain area. Mt. Res. 2017, 35, 85–94. [Google Scholar]
  28. Xie, S.; Nie, L.; Tian, W.; Huang, M.; Qiao, H. Construction and empirical study of a livelihood resilience evaluation index system for rural households in mountainous tourist areas in China: A case study of Enshi Prefecture, Hubei Province. J. Southwest Univ. (Nat. Sci. Ed.) 2024, 46, 131–143. [Google Scholar]
  29. Zhang, X.; Chen, H.; Geng, T.; Shi, Q.; Liu, D. Spatial differentiation and influencing factors of rural household livelihood resilience in the Loess Hilly and Gully Region: A case study of Shigou Town, Mizhi County, Northern Shaanxi. Geogr. Geo-Inf. Sci. 2020, 36, 100–106. [Google Scholar]
  30. McDonald, J.H. Handbook of Biological Statistics; Sparky House Publishing: Baltimore, MD, USA, 2014; pp. 188–206. [Google Scholar]
  31. Lee, S.; Lee, D.K. What is the proper way to apply for the multiple comparison test? Korean J. Anesthesiol. 2018, 71, 353–360. [Google Scholar] [CrossRef]
  32. Moran, P.A. The interpretation of statistical maps. J. R. Stat. Soc. Ser. B (Methodol.) 1948, 10, 243–251. [Google Scholar] [CrossRef]
  33. Chen, R.; Xie, Y.; Liu, Y. Defining, conceptualizing, and measuring organizational resilience: A multiple case study. Sustainability 2021, 13, 2517. [Google Scholar] [CrossRef]
  34. Lai, P.-H.; Morrison-Saunders, A.; Grimstad, S. Operating small tourism firms in rural destinations: A social representations approach to examining how small tourism firms cope with non-tourism induced changes. Tour. Manag. 2017, 58, 164–174. [Google Scholar] [CrossRef]
  35. Hahn, M.B.; Riederer, A.M.; Foster, S.O. The Livelihood Vulnerability Index: A pragmatic approach to assessing risks from climate variability and change-A case study in Mozambique. Glob. Environ. Change-Hum. Policy Dimens. 2009, 19, 74–88. [Google Scholar] [CrossRef]
  36. Xiao, Y.; Tan, X.; Pan, L. Difference of Farmers’ Livelihood Capital before and after Rural Tourism Development. Computational Intelligence and Neuroscience Comput. Intell. Neurosci. 2022, 1, 4138220. [Google Scholar]
  37. Yu, P.; Zhang, J.; Wang, Y.; Wang, C.; Zhang, H. Can tourism development enhance livelihood capitals of rural households? Evidence from Huangshan National Park adjacent communities, China. Sci. Total Environ. 2020, 748, 141099. [Google Scholar] [CrossRef]
  38. Duan, X.; Huang, Z. Study on the willingness of rural households in nature reserves to change livelihood strategies under the background of ecotourism: A case study of Mount Lu National Nature Reserve. J. Arid Land Resour. Environ. 2023, 37, 48–56. [Google Scholar]
  39. Chakraborty, A. Can tourism contribute to environmentally sustainable development? Arguments from an ecological limits’ perspective. Environ. Dev. Sustain. 2021, 23, 8130–8146. [Google Scholar] [CrossRef]
  40. Pandya, R.; Dev, H.S.; Rai, N.D.; Fletcher, R. Rendering land touristifiable: (eco) tourism and land use change. Tour. Geogr. 2023, 25, 1068–1084. [Google Scholar] [CrossRef]
  41. Kamata, H. Tourist destination residents’ attitudes towards tourism during and after the COVID-19 pandemic. Curr. Issues Tour. 2022, 25, 134–149. [Google Scholar] [CrossRef]
  42. Li, Y.; Wang, Y.; Jiang, J.; Valdimarsdóttir, U.A.; Fall, K.; Fang, F.; Song, H.; Lu, D.; Zhang, W. Psychological distress among health professional students during the COVID-19 outbreak–Corrigendum. Psychol. Med. 2021, 51, 1960. [Google Scholar] [CrossRef]
  43. Zenker, S.; Kock, F. The coronavirus pandemic–A critical discussion of a tourism research agenda. Tour. Manag. 2020, 81, 104164. [Google Scholar] [PubMed]
  44. He, L.; Yang, Z. The impact of livelihood strategy choices on the stability of rural household poverty alleviation: Evidence from a survey of 1133 targeted poverty alleviation households in the Liangshan Region, Sichuan. Econ. Theory Bus. Manag. 2023, 43, 85–101. [Google Scholar]
  45. Díez-Gutiérrez, M.; Babri, S. Tourists’ perceptions of economic instruments as sustainable policies in protected areas: The case of Geiranger fjord in Norway. J. Outdoor Recreat. Tour. 2022, 39, 100526. [Google Scholar]
  46. Dong, X.; Qiu, S. Measuring and analyzing the livelihood resilience of residents in national park communities: A case study of Pudacuo National Park during the COVID-19 pandemic. J. For. Econ. 2024, 44, 250–260. [Google Scholar]
Figure 1. Geographic distribution of Wulingyuan District and the study areas. Note: The inset map of China is derived from the standard map provided by the Standard Map Service website of the Ministry of Natural Resources, authorized under license number GS(2019)1822. The base map remains unaltered.
Sustainability 17 02937 g001
Figure 2. Research route diagram of the evolution characteristics and influencing factors of tourism community residents’ livelihood resilience.
Sustainability 17 02937 g002
Figure 3. Livelihood resilience index and capability indexes across various dimensions of residents in tourism communities at different stages.
Sustainability 17 02937 g003
Figure 4. Livelihood standard deviation ellipse analysis of residents’ livelihood resilience.
Sustainability 17 02937 g004
Table 1. Livelihood resilience evaluation index system for tourism-dependent communities.
Dimension LayerCriteria LayerIndex LayerVariable Description and AssignmentWeight
Buffer capacityNatural capitalPer capita cultivated land area B11 = below 67 m2; 2 = 67–201 m2; 3 = 201–402 m2; 4 = 402–666 m2; 5 = above 666 m20.0776
Financial capitalAnnual per capita household income B21 = below CNY 20,000; 2 = CNY 20,000–30,000; 3 = CNY 30,000–40,000; 4 = CNY 40,000–50,000; 5 = above CNY 50,000 0.0625
Human capitalProportion of household labor force B31 = 0–20%; 2 = 20–40%; 3 = 40–60%; 4 = 60–80%; 5 = above 80%0.0469
Number of household members engaged in tourism B41 = none; 2 = 1 person; 3 = 2 people; 4 = 3 people; 5 = more than 3 people0.0480
Physical capitalTotal household fixed assets B51 = below CNY 20,000; 2 = CNY 20,000–40,000; 3 = CNY 40,000–60,000; 4 = CNY 60,000–80,000; 5 = above CNY 80,0000.0620
Social capitalMonthly mobile phone communication cost B61 = CNY 0–100; 2 = CNY 100–200; 3 = CNY 200–300; 4 = CNY 300–400; 5 = above CNY 4000.0548
Adaptive capacityCognitive abilityHighest education level in the household A11 = illiterate; 2 = primary school; 3 = junior high school; 4 = senior high school/vocational high school; 5 = college degree and above0.0403
Awareness of policies A21 = 0 types; 2 = 1 type; 3 = 2 types; 4 = 3 types; 5 = more than 3 types0.0626
Learning abilityAnnual household education expenses A31 = below CNY 2000; 2 = CNY 2000–10,000; 3 = CNY 10,000–20,000; 4 = CNY 20,000–30,000; 5 = above CNY 30,0000.0737
Opportunities for skill training A41 = none; 2 = 1 time; 3 = 2 times; 4 = 3 times; 5 = more than 3 times0.0493
Organizational management abilityHousehold participation in social affairs management A51 = none; 2 = 1 time; 3 = 2 times; 4 = 3 times; 5 = more than 3 times0.0696
Number of relatives in public service positions A61 = none; 2 = 1 person; 3 = 2 people; 4 = 3 people; 5 = more than 3 people0.0709
Transformation capacityPolicy supportTypes of subsidies received by the household T11 = none; 2 = 1 type; 3 = 2 types; 4 = 3 types; 5 = more than 3 types0.0371
Condition of access roads to the household T21 = farmland road; 2 = branch road; 3 = rural road; 4 = sub-arterial road; 5 = arterial road0.0416
Transformation pathDegree of financial support T31 = none; 2 = 1 type; 3 = 2 types; 4 = 3 types; 5 = more than 3 types0.0413
Number of migrant work trips T41 = none; 2 = 1 time; 3 = 2 times; 4 = 3 times; 5 = more than 3 times0.0542
Diversity indexProportion of tourism income T51 = none; 2 = 0–30%; 3 = 30–60%; 4 = 60–90%; 5 = greater than or equal to 90%0.0653
dataLivelihood diversity index T61 = 1 type; 2 = 2 types; 3 = 3 types; 4 = 4 types; 5 = more than 4 types0.0423
Table 2. Evaluation criteria for livelihood resilience of residents in tourism communities.
Livelihood Resilience LevelLowMediumHigh
Index Score[0, 0.3)[0.3, 0.5](0.5, 1]
Table 3. Example of open coding.
CategoryConceptExample of Original Statements
External ChangesTemporary closure of scenic area“Due to the pandemic, the scenic area had to be temporarily closed. Some tourists had already arrived at the area but were unable to enter”.
Internal ThreatsLow resilience to external shocks“Most shops in the picturesque region are modest in size and possess restricted financial resources. In comparison to external firms, the epidemic’s impact is more severe and the capacity for resilience is diminished”.
Decrease in TouristsLow occupancy rate“The scenic area now rarely receives tourists. The number of visitors during peak seasons has decreased significantly, and many rooms remain unoccupied…”
Management DeficienciesInadequate infrastructure“If the management were similar to urban residential areas, with centralized facilities like community hospitals and supermarkets, it would make life much more convenient for both residents and tourists”.
Changes in Material CapitalProperty construction“My old house is no longer sufficient for operating a homestay, so I need to build a new house and renovate it”.
Lack of Human CapitalInsufficient household labor“He is ill and can only rest at home, so I am the only one in the family who goes out to sell items for living expenses”.
Financial Capital DilemmaIncome–expenditure imbalance“I invested 200,000 yuan in renovating the homestay, but I have not yet earned back the principal investment…”
Organizational CooperationSupport from relatives“During the pandemic, it was difficult to find work, so during the peak season, relatives asked me to help manage their shop”.
Insufficient Learning CapacityLow frequency of training“We rarely organize employment or skills training here, and there are few opportunities for us to participate in such training…”
Regional Development ImbalanceDisparities between scenic area and surrounding areas“People outside the scenic area are operating agritourism and homestays, and their business is thriving. But inside the scenic area, development is restricted, and we can only watch others profit”.
Expectation BreakdownUnforeseen consequences“We never anticipated that the pandemic would last for such an extended period, and the impact on the business of the scenic area shop has been unprecedented, almost unimaginable”.
Positive AttitudeTrust in government“Notwithstanding the considerable effects of the pandemic on the tourism sector, we assert that post-pandemic, the government will implement policies to facilitate the recovery and advancement of tourism”.
Total of 16 CategoriesTotal of 105 concepts……
Table 4. Main categories selected in axial coding.
Main CategoriesCorresponding CategoriesExamples of Related Concepts
Livelihood VulnerabilityExternal ChangesTemporary closure of tourist attractions, delay in reception of visitors, restrictions on visitor numbers, and operational disruptions
Internal ThreatsSmall-scale operations, traditional closures, resource depletion, low resilience to shocks, limited funding, and high dependency on tourism
Tourism Development ConditionsDecrease in VisitorsLow tourist retention, visitors not staying long, low occupancy rates, reduced number of tourists during peak season, and limited ticket sales
Management DeficienciesLack of participation mechanisms, restrictions on livelihood activities, conflicts in profit-sharing, insufficient planning, inadequate infrastructure, and changes to scenic spot names
Livelihood Capital ConditionsChanges in Material CapitalIncreased participation costs, facility investments, house construction, and renovations
Limited Natural CapitalLand acquisition, reduction in arable land, limitations on farming conditions, and wildlife damage
Lack of Human CapitalInsufficient labor, loss of workforce, inability to work, and health crises
Financial Capital ChallengesUnpaid wages, reduced income, income–expenditure imbalance, and low return on investment
Response CapacityEnhanced Organizational CollaborationFamily support, collective development, material assistance, emotional support, and shared interests
Limited Learning CapacityInsufficient market awareness, limited exposure, infrequent training opportunities, lack of investment in education, and lack of qualified instructors
Transformation PotentialMonolithic Livelihood StrategiesSingle-industry livelihoods, limited job opportunities, lack of capital and technology, and restricted livelihood capacity
Imbalanced Regional DevelopmentDifferences in policy support, disparities between areas within and outside the scenic spots, unequal livelihood opportunities, and income disparities
Psychological StateDisruption of ExpectationsUnexpected events, feelings of helplessness, unprecedented situations, unimaginable impacts, and collapse
Positive AttitudeMental adjustment, confidence in tourism development, trust in government support, positive perceptions from tourists, and catering to tourists’ preferences
Relief MeasuresTourism PoliciesSuspension of tourism activities, ban on group tours, gradual recovery of individual tourism, and resumption of group tours
Marketing StimulusPromotions, advertising, price reductions, bundled consumption, discounts, and travel coupons
Table 5. Core categories derived from selective coding analysis.
Core CategoriesMain Categories
Livelihood Shocks ConditionsLivelihood Vulnerability
Tourism Development Conditions
Livelihood Capital Conditions
Livelihood Coping StrategiesCoping Capacity
Transformation Potential
Psychological State
Relief Measures
Table 6. Global Moran’s I values of residents’ livelihood resilience.
StageMoran’s Ip-ValueZ-Score
Normal tourism stage (before 2020)0.12730.0000 5.6405
Epidemic disruption stage (2020–2022)0.11200.0001 5.6405
Tourism recovery stage (after 2022)0.1475 0.0000 6.5152
Disclaimer/Publisher’s Note: The statements, opinions and data contained in all publications are solely those of the individual author(s) and contributor(s) and not of MDPI and/or the editor(s). MDPI and/or the editor(s) disclaim responsibility for any injury to people or property resulting from any ideas, methods, instructions or products referred to in the content.

