
Sustainability Management Through the Assessment of Instability and Insecurity Risk Scenarios in Romania’s Energy Critical Infrastructures

 , , , , , , , ,
  ,
,  and
and 
Abstract
1. Introduction—The Condition of the Romanian National Energy System
1.1. Previous Studies
- (a)
- Global and economic energy crises: Studies on electricity crises are often linked to general energy crises, which include energy resource shortages and fluctuating fossil fuel prices. A relevant example can be found in the analysis of the global energy economy, as discussed in Thomas Homer-Dixon’s work on energy security and the conflict generated by scarce resources. In his book, The Upside of Down: Catastrophe, Creativity, and the Renewal of Civilization (2006), Homer-Dixon examines how resource crises can trigger political and economic instability, and electricity plays a key role in this dynamic [3].
- (b)
- Economic theories of energy crises: An influential study in the analysis of electricity crises was conducted by James O’Connor in The Fiscal Crisis of the State (1973), which argues that energy crises are often linked to economic structure and state policies. He suggests that too much dependence on external energy sources can undermine the stability of national economies, and fluctuations in energy prices can generate economic instability [4].
- (c)
- Technical aspects of electricity crises: Another area of research is related to electricity generation and distribution technologies, which can contribute to energy crises. Paul Sabin in his work The Bet: Paul Ehrlich, Julian Simon, and Our Gamble over Earth’s Future iscusses how technological innovations can play an important role in preventing or worsening electricity crises through advances in renewable energy sources, energy storage, and energy efficiency [5].
- (d)
- Impact of energy policies and climate change: Electricity crises can be aggravated by unsustainable energy policies or the effects of climate change, which can reduce the availability of traditional energy sources. For example, in his study Energy Crisis: A Global Problem (2011), Richard Heinberg points out how the transition from fossil energy sources to renewable sources can help prevent long-term energy crises, but also how the urgent need to combat climate change can create new challenges in ensuring stable electricity production [6].
- (e)
- Energy crisis management: In addressing electricity crises, authors such as Pablo del Rio Gonzalez (2009) explored crisis management in the context of national and regional energy systems, highlighting how effective policies and the interconnection of electricity grids can improve the impact of electricity crises [7].
- (a)
- Jean-Michel Glachant (2017) has studied the impact of energy crises on electricity markets and how market regulation and alignment of regional strategies can play a key role in managing electricity crises [8].
- (b)
- David MacKay, in Sustainable Energy—Without the Hot Air (2009), discusses how energy crises can be avoided through sustainable strategies, based on renewable energy sources and innovative energy storage solutions [9].
1.2. Recent Evolutions
- Identifying the two most plausible serious risk scenarios:
- a.
- Risk scenario 1—220–750 kV Power Substation Natural Calamity → Blackout;
- b.
- Risk scenario 2—220–750 kV Power Substation Terrorist Attack → Blackout.
- Assessment of risk scenarios by means of the following:
- a.
- Probability approximation;
- b.
- Seriousness or impact level approximation;
- c.
- Risk level calculation;
- d.
- Recalculation of risk level following the proposed measures.
- Elaboration of the security strategy for Romania’s national power system following the proposed measures, which can improve and strengthen the European Power System ENTSO-E.
- Identification and technical description through the analysis and manner of approach towards the critical infrastructures connected to Europe, and the elements providing connection and interdependence with other critical infrastructures belonging to Romania’s national power system;
- Identification, through critical analysis, of the most serious plausible risk scenarios;
- Description, through cause–effect critical analysis, of all most serious plausible risk scenarios;
- Sequence scrolling through developing all the stages of the risk scenarios identified, from source to effect;
- Assessment of risk scenarios within Romania’s national power system;
- Elaboration of the security strategy for Romania’s national power system;
- Adaptation and flexible use of the study for all energy systems that include critical infrastructures.
2. Critical Analysis and Results Regarding the Most Plausible Serious Risk Scenarios
2.1. Identifying Risk Scenarios
- Risk scenario 1—220–750 kV Power substation natural calamity → Blackout;
- Risk scenario 2—220–750 kV Power substation terrorist attack → Blackout.
2.2. Describing the Risk Scenarios
- Risk scenario 1—220–750 kV Power substation natural calamity → Blackout.
- 2.
- Risk scenario 2—220–750 kV Power substation terrorist attack → Blackout.
2.3. Sequence Scrolling of Risk Scenarios
| RISK SCENARIO 1 |
| 220–750 kV POWER SUBSTATION NATURAL CALAMITY |
| Extreme meteorological phenomena (earthquakes, floods, avalanches, volcanoes, fires, tsunamis, meteorite showers, etc.) on → Energy critical infrastructures (energy groups in power substations, overhead powerlines for transporting electric energy 220–750 kV, power substations 220–750 kV) → Instability of the national power system → Blackout |
| RISK SCENARIO 2 |
| 220 kV–750 kV POWER SUBSTATION TERRORIST ATTACK |
| Explosion determined by a bomb (terrorist) and/or a cybernetic attack determined by a virus (hacker) → Physical and/or cybernetic security personnel errors on → Energy critical infrastructures (energy groups in power substations, overhead powerlines for transporting electric energy 220 kV–750 kV, 220 kV–750 kV power substations) → Instability of the national power system → Total exit from operation of the national power system → Blackout |
2.4. Assessment of the Risk Scenarios
- Risk scenario 1—Natural calamity → Total/partial operation exit of the national power system;
- Risk scenario 2—Terrorist attack → Total/partial operation exit of the national power system.
- (a)
- Settling the probability
| Associated Level/Score | Defining Probability | Periods | |
| X | 1. Very low | The event has a very low occurrence probability. Usual measures for monitoring the evolution of the event are required. | Over 13 years |
| 2. Low | The event has a low occurrence probability. Efforts are required to reduce the probability and/or reduce the impact produced. | 10–12 years | |
| 3. Average | The event has a significant occurrence probability. Significant efforts are required to reduce the probability and/or reduce the impact produced. | 7–9 years | |
| 4. High | The event is probable to occur. Priority efforts are required to reduce the probability and attenuate the impact produced. | 4–6 years | |
| 5. Very high | The event is considered imminent. Immediate and extreme measures are required for protecting the objective and for evacuation to a safe location in the case that the impact requires this. | 1–3 years | |
| The colors green, brown, yellow, orange and red represent probability level (green is very low, brown is low, yeloow is average, orange is high and red is very high) | |||
- (b)
- Settling the seriousness of the consequences of the proposed scenario
2.4.1. Impact
| Associated Level/Score | Seriousness of Consequences | |
| 1. Very low | The event determines a minor disruption of the activity, without material damages. | |
| 2. Low | The event determines minor material damages and limited disruption of the activity. | |
| 3. Average | Injuries of the personnel and/or certain equipment and utilities losses as well as delays in providing the service. | |
| 4. High | Serious injuries of the personnel, significant equipment, installation, and facility losses, and delays and/or shutting of services. | |
| X | 5. Very high | Consequences are catastrophic, resulting in deaths and serious injuries of the personnel, important equipment, installations, and facility losses, and shutting of the service. |
| The colors green, brown, yellow, orange and red represent seriousness of consequences level (green is very low, brown is low, yeloow is average, orange is high and red is very high) | ||
- (c)
- Calculation of the risk level
| P R O B A B I L I T Y | Very high 5 | |||||
| High 4 | ||||||
| Average 3 | ||||||
| Low 2 | ||||||
| Very low 1 | Scenario 1 DAMAGE | |||||
| 0 | Very low 1 | Low 2 | Average 3 | High 4 | Very high 5 | |
| S E R I O U S N E SS /C O N S E Q U E N C E S | ||||||
| The colors green, brown, yellow, orange and red represent risk level (green is very low, brown is low, yeloow is average, orange is high and red is very high) | ||||||
| Note: Risk is determined by the position between the occurrence probability of a hazard/threat and the seriousness of its consequences. | ||||||
| The calculated risk is 5 (probability 1 x seriousness 5) As a result, there is a LOW OCCURRENCE RISK for the chosen scenario | CALCULATED LEVEL OF RISK | |
| LEVEL | SCORE | |
| Very low | 1–3 | |
| Low | 4–6 | |
| Average | 7–12 | |
| High | 13–16 | |
| Very high | 17–25 | |
| The colors green, brown, yellow, orange and red represent risk level (green is very low, brown is low, yeloow is average, orange is high and red is very high) | ||
- (d)
- Risk treatment
- (e)
- Recalculation of the seriousness of the consequences.
| Associated Level/Score | Seriousness of Consequences | |
| 1. Very low | The event determines a minor disruption of the activity, without material damages. | |
| 2. Low | The event determines minor material damages and limited disruption of the activity. | |
| 3. Average | Injuries of the personnel and/or certain equipment and utilities losses as well as delays in providing the service. | |
| X | 4. High | Serious injuries of the personnel, significant equipment, installations and facilities losses, delays and/or shutting of services. |
| 5. Very high | Consequences are catastrophic, resulting in deaths and serious injuries of the personnel, important equipment, installations and facilities losses and shutting of the service. | |
| The colors green, brown, yellow, orange and red represent seriousness of consequences level (green is very low, brown is low, yeloow is average, orange is high and red is very high) | ||
- (f)
- Risk level after applying the decrease measures.
| P R O B A B I L I TY | Very high 5 | |||||
| High 4 | ||||||
| Average 3 | ||||||
| Low 2 | ||||||
| Very low 1 | Risk scenario 1 | |||||
| 0 | Very low 1 | Low 2 | Average 3 | High 4 | Very high 5 | |
| S E R I O U S N E S S/C O N S E Q U E N C E S | ||||||
| The colors green, brown, yellow, orange and red represent risk level (green is very low, brown is low, yeloow is average, orange is high and red is very high) | ||||||
| Note: Risk is determined by the position between the occurrence probability of a hazard/threat and the seriousness of its consequences. | ||||||
| The calculated risk is 4 (probability 1 x seriousness 4) As a result, there is a LOW OCCURRENCE RISK for the chosen scenario | CALCULATED LEVEL OF RISK | |
| LEVEL | SCORE | |
| Very low | 1–3 | |
| Low | 4–6 | |
| Average | 7–12 | |
| High | 13–16 | |
| Very high | 17–25 | |
| The colors green, brown, yellow, orange and red represent risk level (green is very low, brown is low, yeloow is average, orange is high and red is very high) | ||
- (a)
- Settling the probability
| Associated Level/ScorE | Defining Probability | Periods | |
| 1. Very low | The event has a very low occurrence probability. Usual measures for monitoring the evolution of the event are required. | Over 13 years | |
| 2. Low | The event has a low occurrence probability. Efforts are required to reduce the probability and/or reduce the impact produced. | 10–12 years | |
| X | 3. Average | The event has a significant occurrence probability. Significant efforts are required to reduce the probability and/or reduce the impact produced. | 7–9 years |
| 4. High | The event is probable to occur. Priority efforts are required to reduce the probability and attenuate the impact produced. | 4–6 years | |
| 5. Very high | The event is considered imminent. Immediate and extreme measures are required for protecting the objective and for evacuation to a safe location in the case that the impact requires this. | 1–3 years | |
| The colors green, brown, yellow, orange and red represent probability level (green is very low, brown is low, yeloow is average, orange is high and red is very high) | |||
- (b)
- Settling the seriousness of the consequences of the proposed scenario.
2.4.2. Impact Analysis
| Associated Level/Score | Seriousness of Consequences | |
| 1. Very low | The event determines a minor disruption of the activity, without material damages. | |
| 2. Low | The event determines minor material damages and limited disruption of the activity. | |
| 3. Average | Injuries of personnel and/or certain equipment and utilities losses as well as delays in providing the service. | |
| 4. High | Serious injuries of the personnel, significant equipment, installations and facilities losses, delays and/or shutting of services. | |
| X | 5. Very high | Consequences are catastrophic, resulting in deaths and serious injuries of the personnel, important equipment, installations and facilities losses, and shutting of the service. |
| The colors green, brown, yellow, orange and red represent seriousness of consequences level (green is very low, brown is low, yeloow is average, orange is high and red is very high) | ||
- (c)
- Calculation of risk level
| P R O B A B I L I T Y | Very high 5 | |||||
| High 4 | ||||||
| Average 3 | Risk scenario 2 | |||||
| Low 2 | ||||||
| Very low 1 | ||||||
| 0 | Very low 1 | Low 2 | Average 3 | High 4 | Very high 5 | |
| S E R I O U S N E S S/C O N S E Q U E N C E S | ||||||
| The colors green, brown, yellow, orange and red represent risk level (green is very low, brown is low, yeloow is average, orange is high and red is very high) | ||||||
| Note: Risk is determined by the position between the occurrence probability of a hazard/threat and the seriousness of its consequences. | ||||||
| The calculated risk is 15 (probability 3 x seriousness 5) As a result, there is a HIGH OCCURRENCE RISK for the chosen scenario | CALCULATED LEVEL OF RISK | |
| LEVEL | SCORE | |
| Very low | 1–3 | |
| Low | 4–6 | |
| Average | 7–12 | |
| High | 13–16 | |
| Very high | 17–25 | |
| The colors green, brown, yellow, orange and red represent risk level (green is very low, brown is low, yeloow is average, orange is high and red is very high) | ||
- (d)
- Risk treatment
- (e)
- Recalculation of the seriousness of the consequences.
| Associated Level/Score | Seriousness of Consequences | |
| 1. Very low | The event determines a minor disruption of the activity, without material damages. | |
| 2. Low | The event determines minor material damages and limited disruption of the activity. | |
| 3. Average | Injuries of personnel and/or certain equipment and utilities losses as well as delays in providing the service. | |
| X | 4. High | Serious injuries of personnel, significant equipment, installations and facilities losses, delays and/or shutting of services. |
| 5. Very high | Consequences are catastrophic, resulting in deaths and serious injuries of the personnel, important equipment, installations and facilities losses and shutting of the service. | |
| The colors green, brown, yellow, orange and red represent seriousness of consequences level (green is very low, brown is low, yeloow is average, orange is high and red is very high) | ||
- (f)
- Risk level after applying the decrease measures
| P R O B A B I L I T Y | Very high 5 | |||||
| High 4 | ||||||
| Average 3 | Risk scenario 2 | |||||
| Low 2 | ||||||
| Very low 1 | ||||||
| 0 | Very low 1 | Low 2 | Average 3 | High 4 | Very high 5 | |
| S E R I O U S N E S S/C O N S E Q U E N C E S | ||||||
| The colors green, brown, yellow, orange and red represent risk level (green is very low, brown is low, yeloow is average, orange is high and red is very high) | ||||||
| Note: Risk is determined by the position between the occurrence probability of a hazard/threat and the seriousness of its consequences. | ||||||
| The calculated risk is 12 (probability 3 x seriousness 4) As a result, there is an AVERAGE OCCURRENCE RISK for the chosen scenario | CALCULATED RISK LEVEL | |
| LEVEL | SCORE | |
| Very low | 1–3 | |
| Low | 4–6 | |
| Average | 7–12 | |
| High | 13–16 | |
| Very high | 17–25 | |
| The colors green, brown, yellow, orange and red represent risk level (green is very low, brown is low, yeloow is average, orange is high and red is very high) | ||
3. Results and Discussion
- (a)
- Risk scenario 1—220 kV–750 kV Power substation natural calamity → Blackout;
- Settling the probability: level/score—1 (stays stable);
- Settling the seriousness of the consequences: level/score—5;
- Calculation of the risk level: value 5 → Low risk;
- Recalculation of the seriousness of the consequences: level/score—4;
- Recalculation of the risk level: value 4 → Low risk.
- (b)
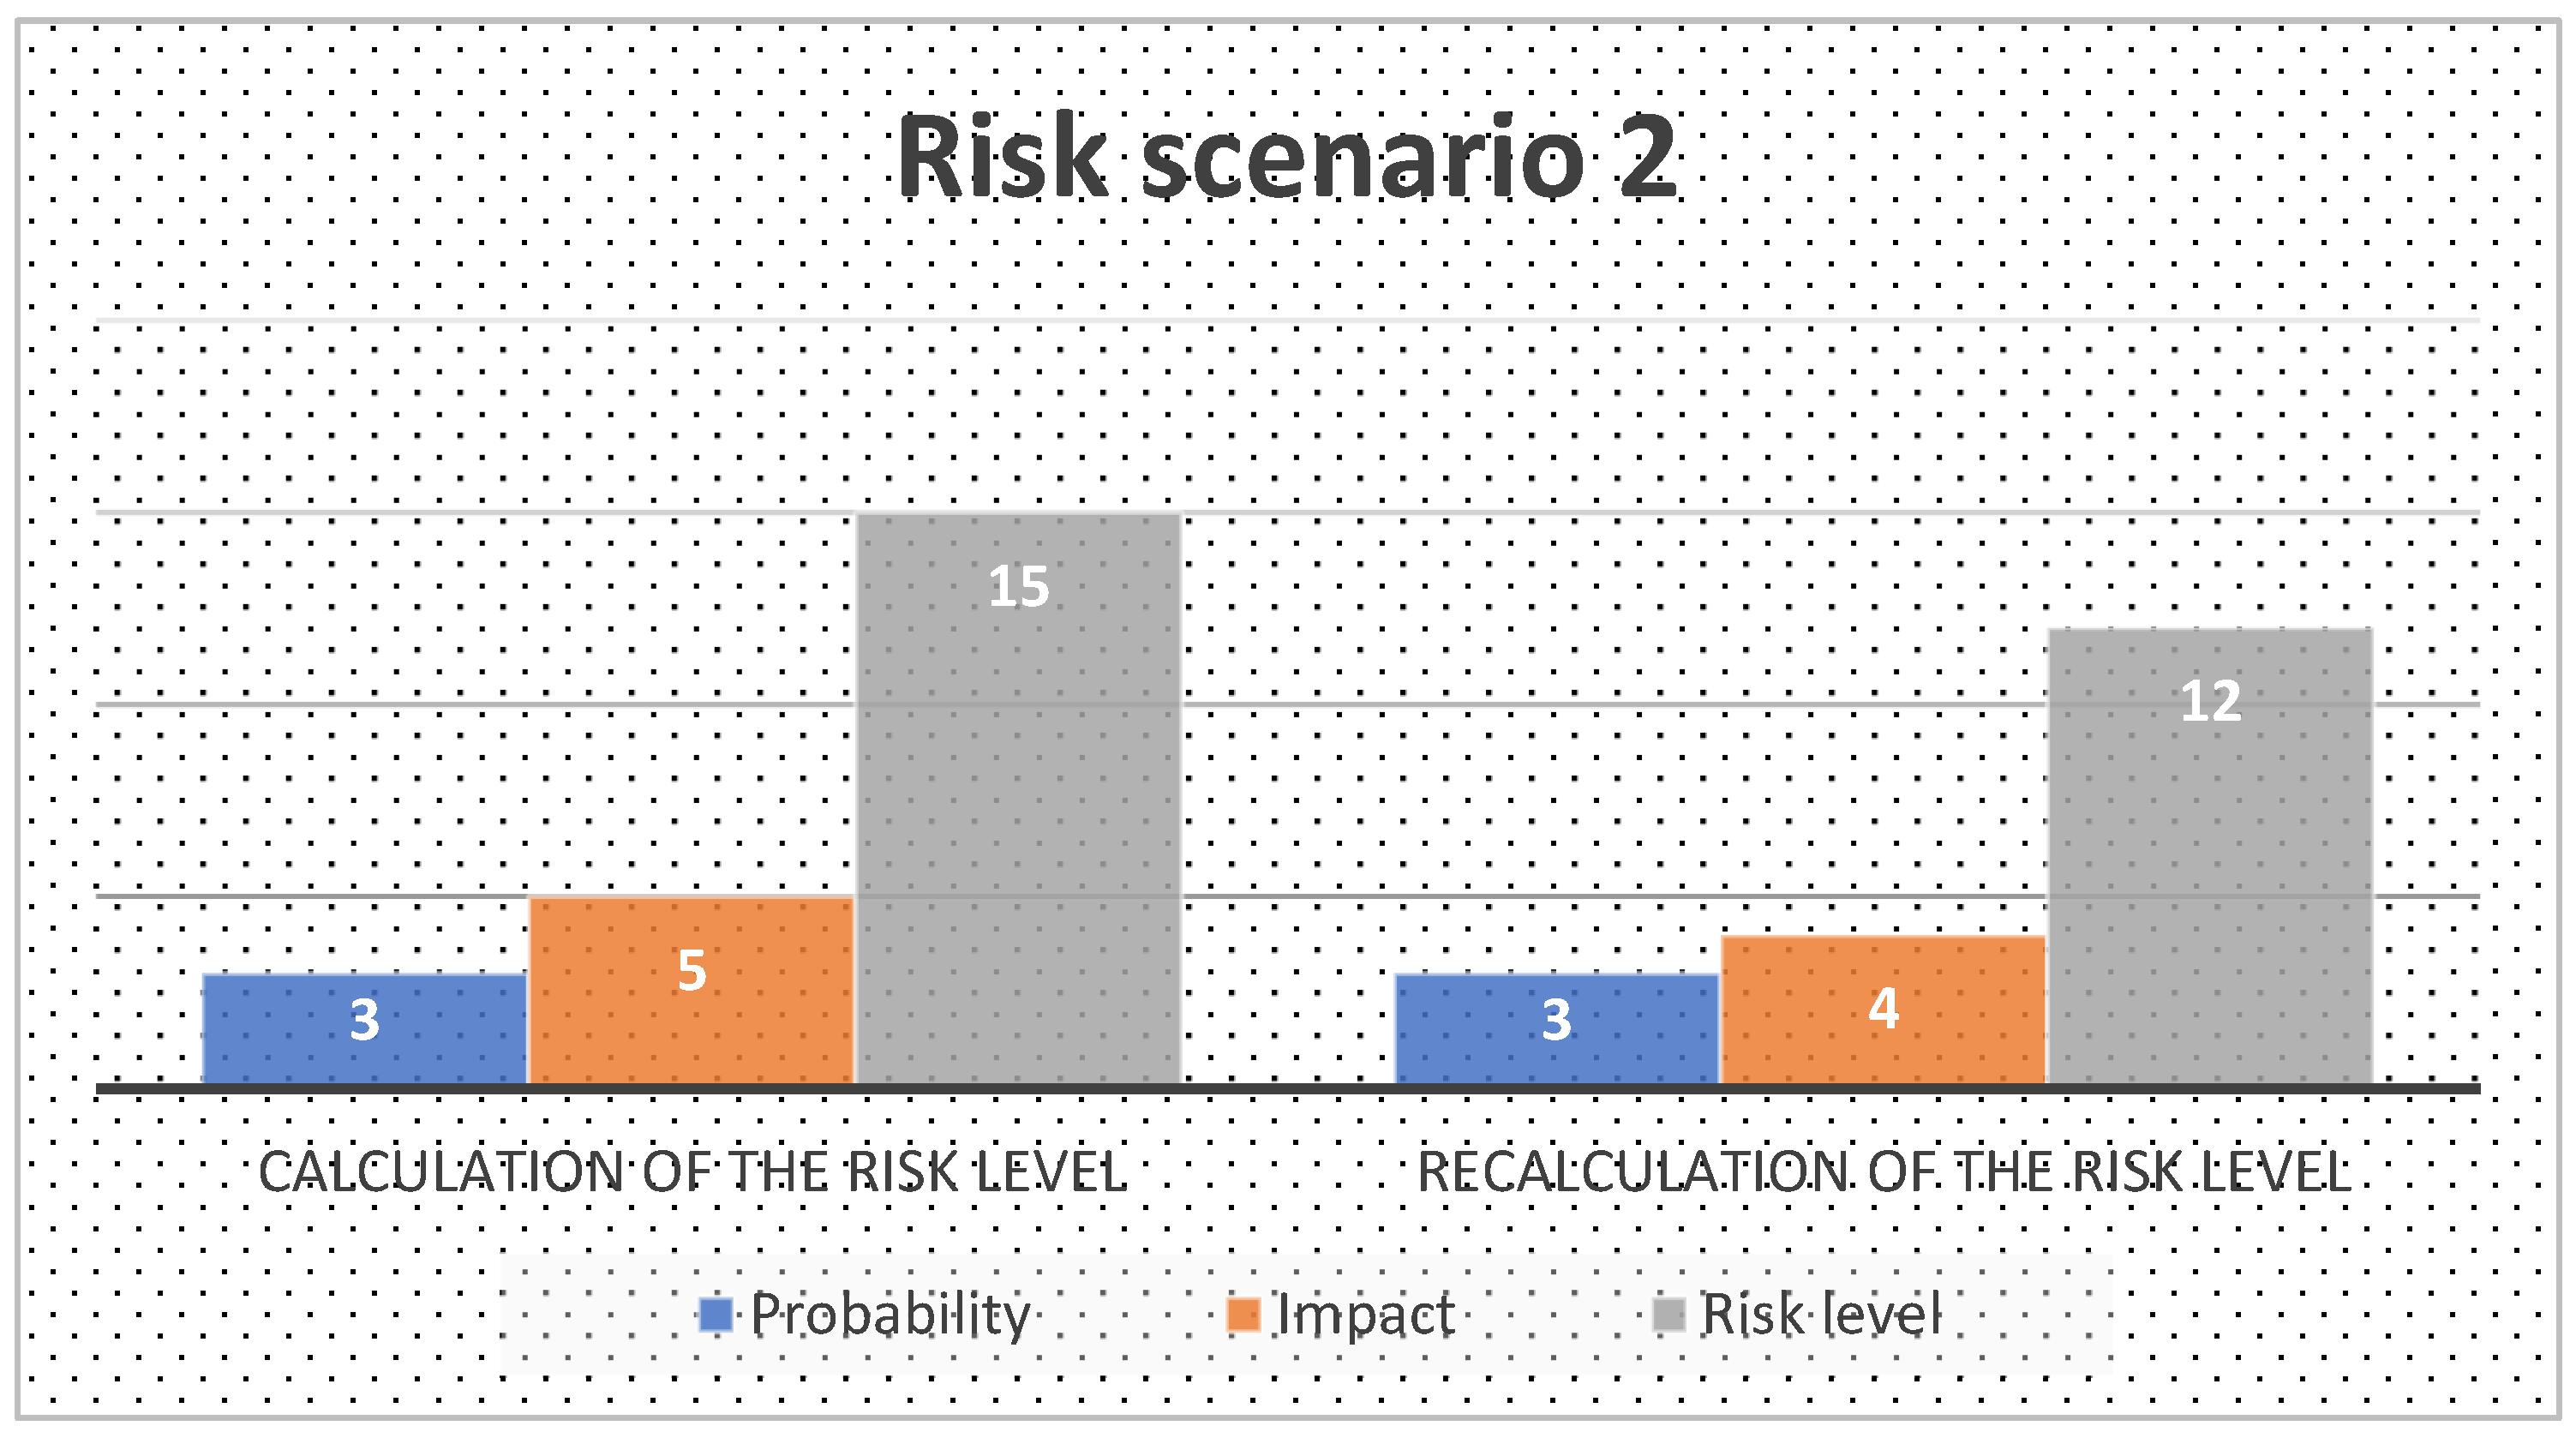
- Risk scenario 2—220 kV–750 kV Power substation terrorist attack → Blackout.
- Settling the probability: level/score—3 (stays stable);
- Settling the seriousness of the consequences: level/score—5;
- Calculation of the risk level: value 15 → High risk;
- Recalculation of the seriousness of the consequences: level/score—4;
- Recalculation of the risk level: value 12 → Average risk.
- Providing a unitary character for the identification, designation, and protection procedures for the national and European energy critical infrastructures;
- Designing and operationalizing the national system for early warning, through integrating all the existing informational and organizational networks and capabilities;
- Correctly assessing the level of vulnerability of energy critical infrastructures and identifying the measures required for preventive interventions and decreasing vulnerabilities;
- Developing national, regional, and international cooperation relations in the domain of the protection and security of energy critical infrastructures.
4. Conclusions
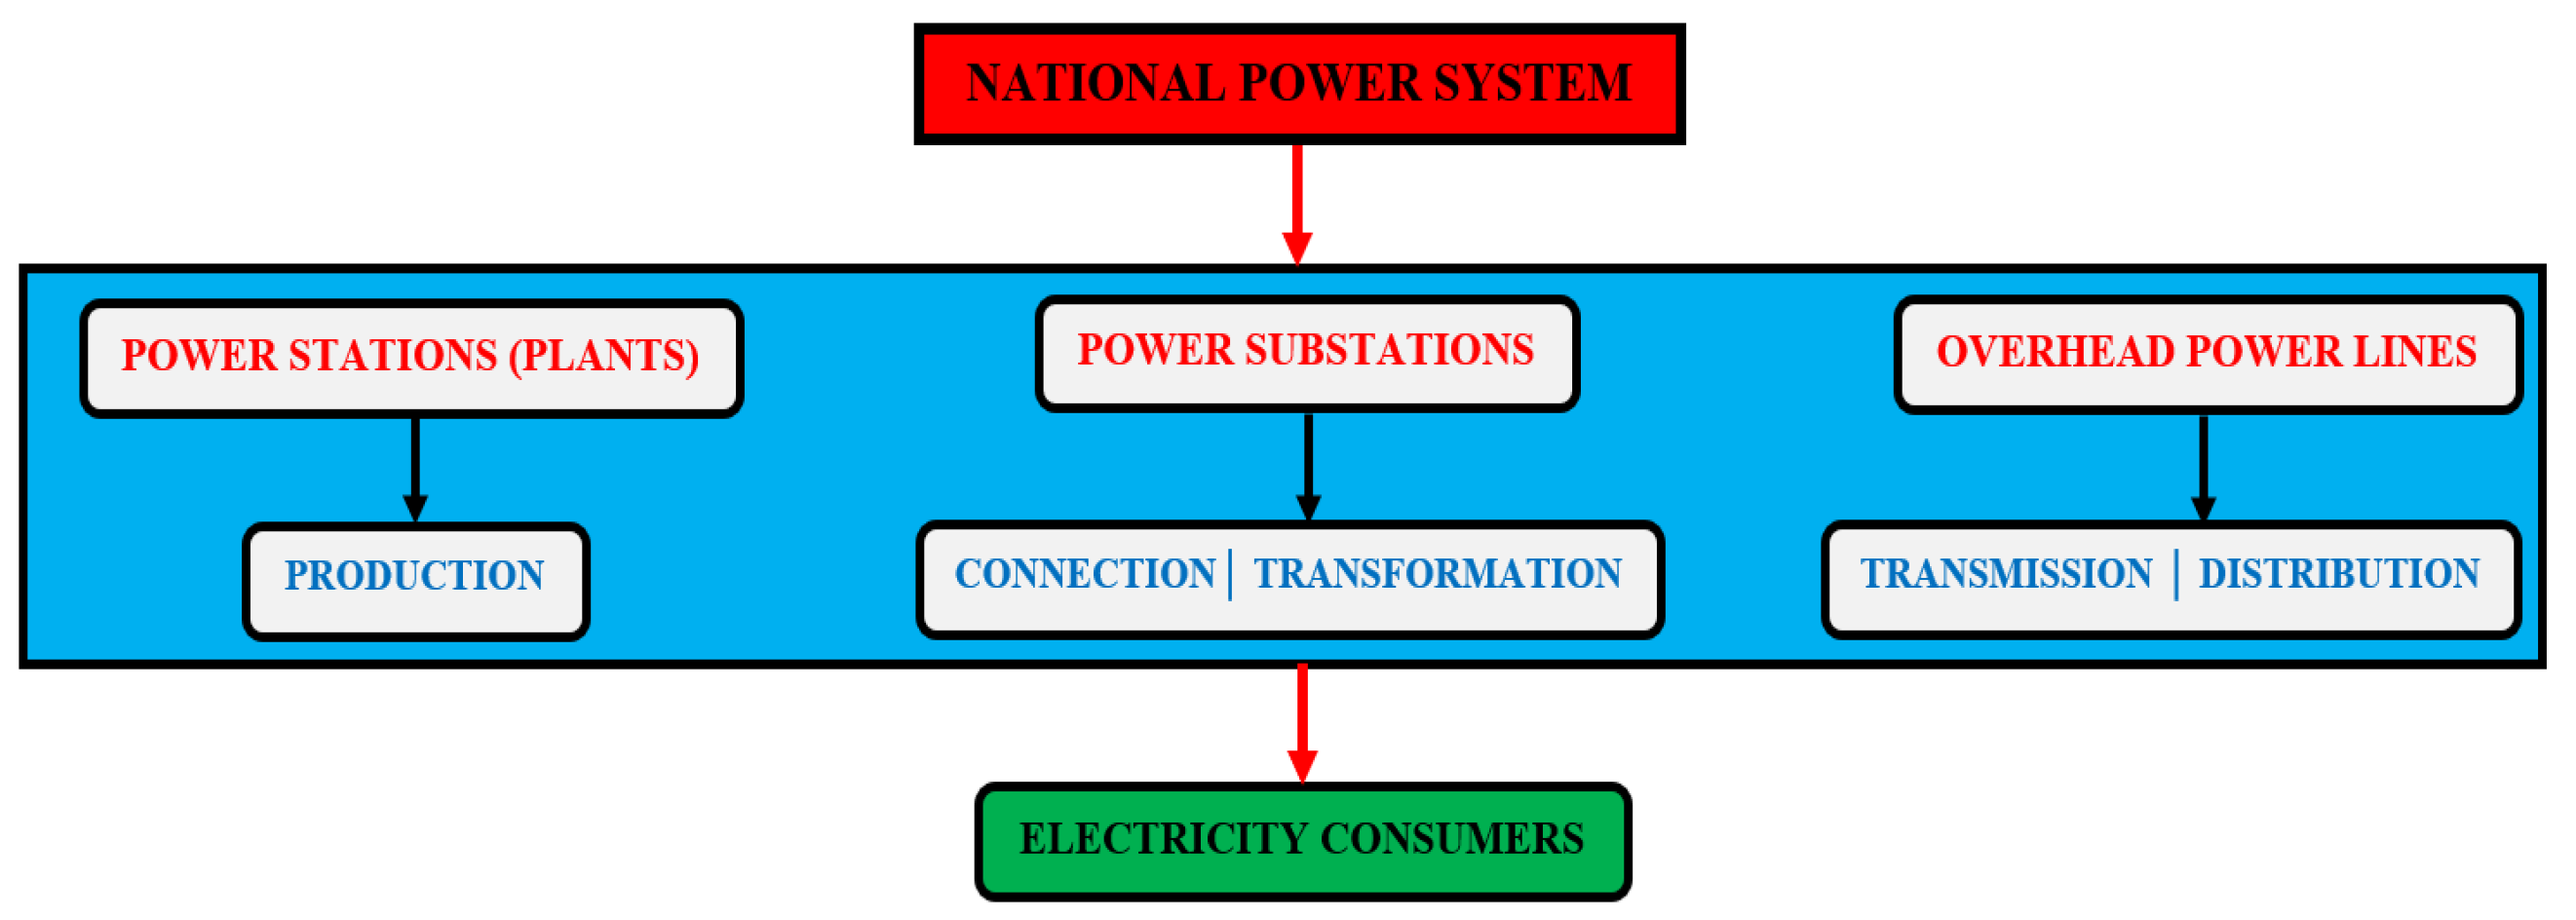
- Stability and reliability of the power grid:
- Power substations ensure the transformation and distribution of electricity at different voltage levels, maintaining the stability of the grid;
- They allow load balancing and energy flow management to avoid overloads and voltage drops.
- Integration of renewable energy sources:
- Power substations are essential for the efficient integration of renewable energy, such as wind farms and photovoltaics;
- Emphasis on energy conversion and adaptation to grid requirements, contributing to the energy transition.
- Reduction in the risks of interruptions and damages:
- By using protective and automation equipment, electrical stations help prevent major damage;
- Modern power substations have SCADA (Supervisory Control and Data Acquisition) systems that allow real-time monitoring and control, reducing the risk of extended power outages.
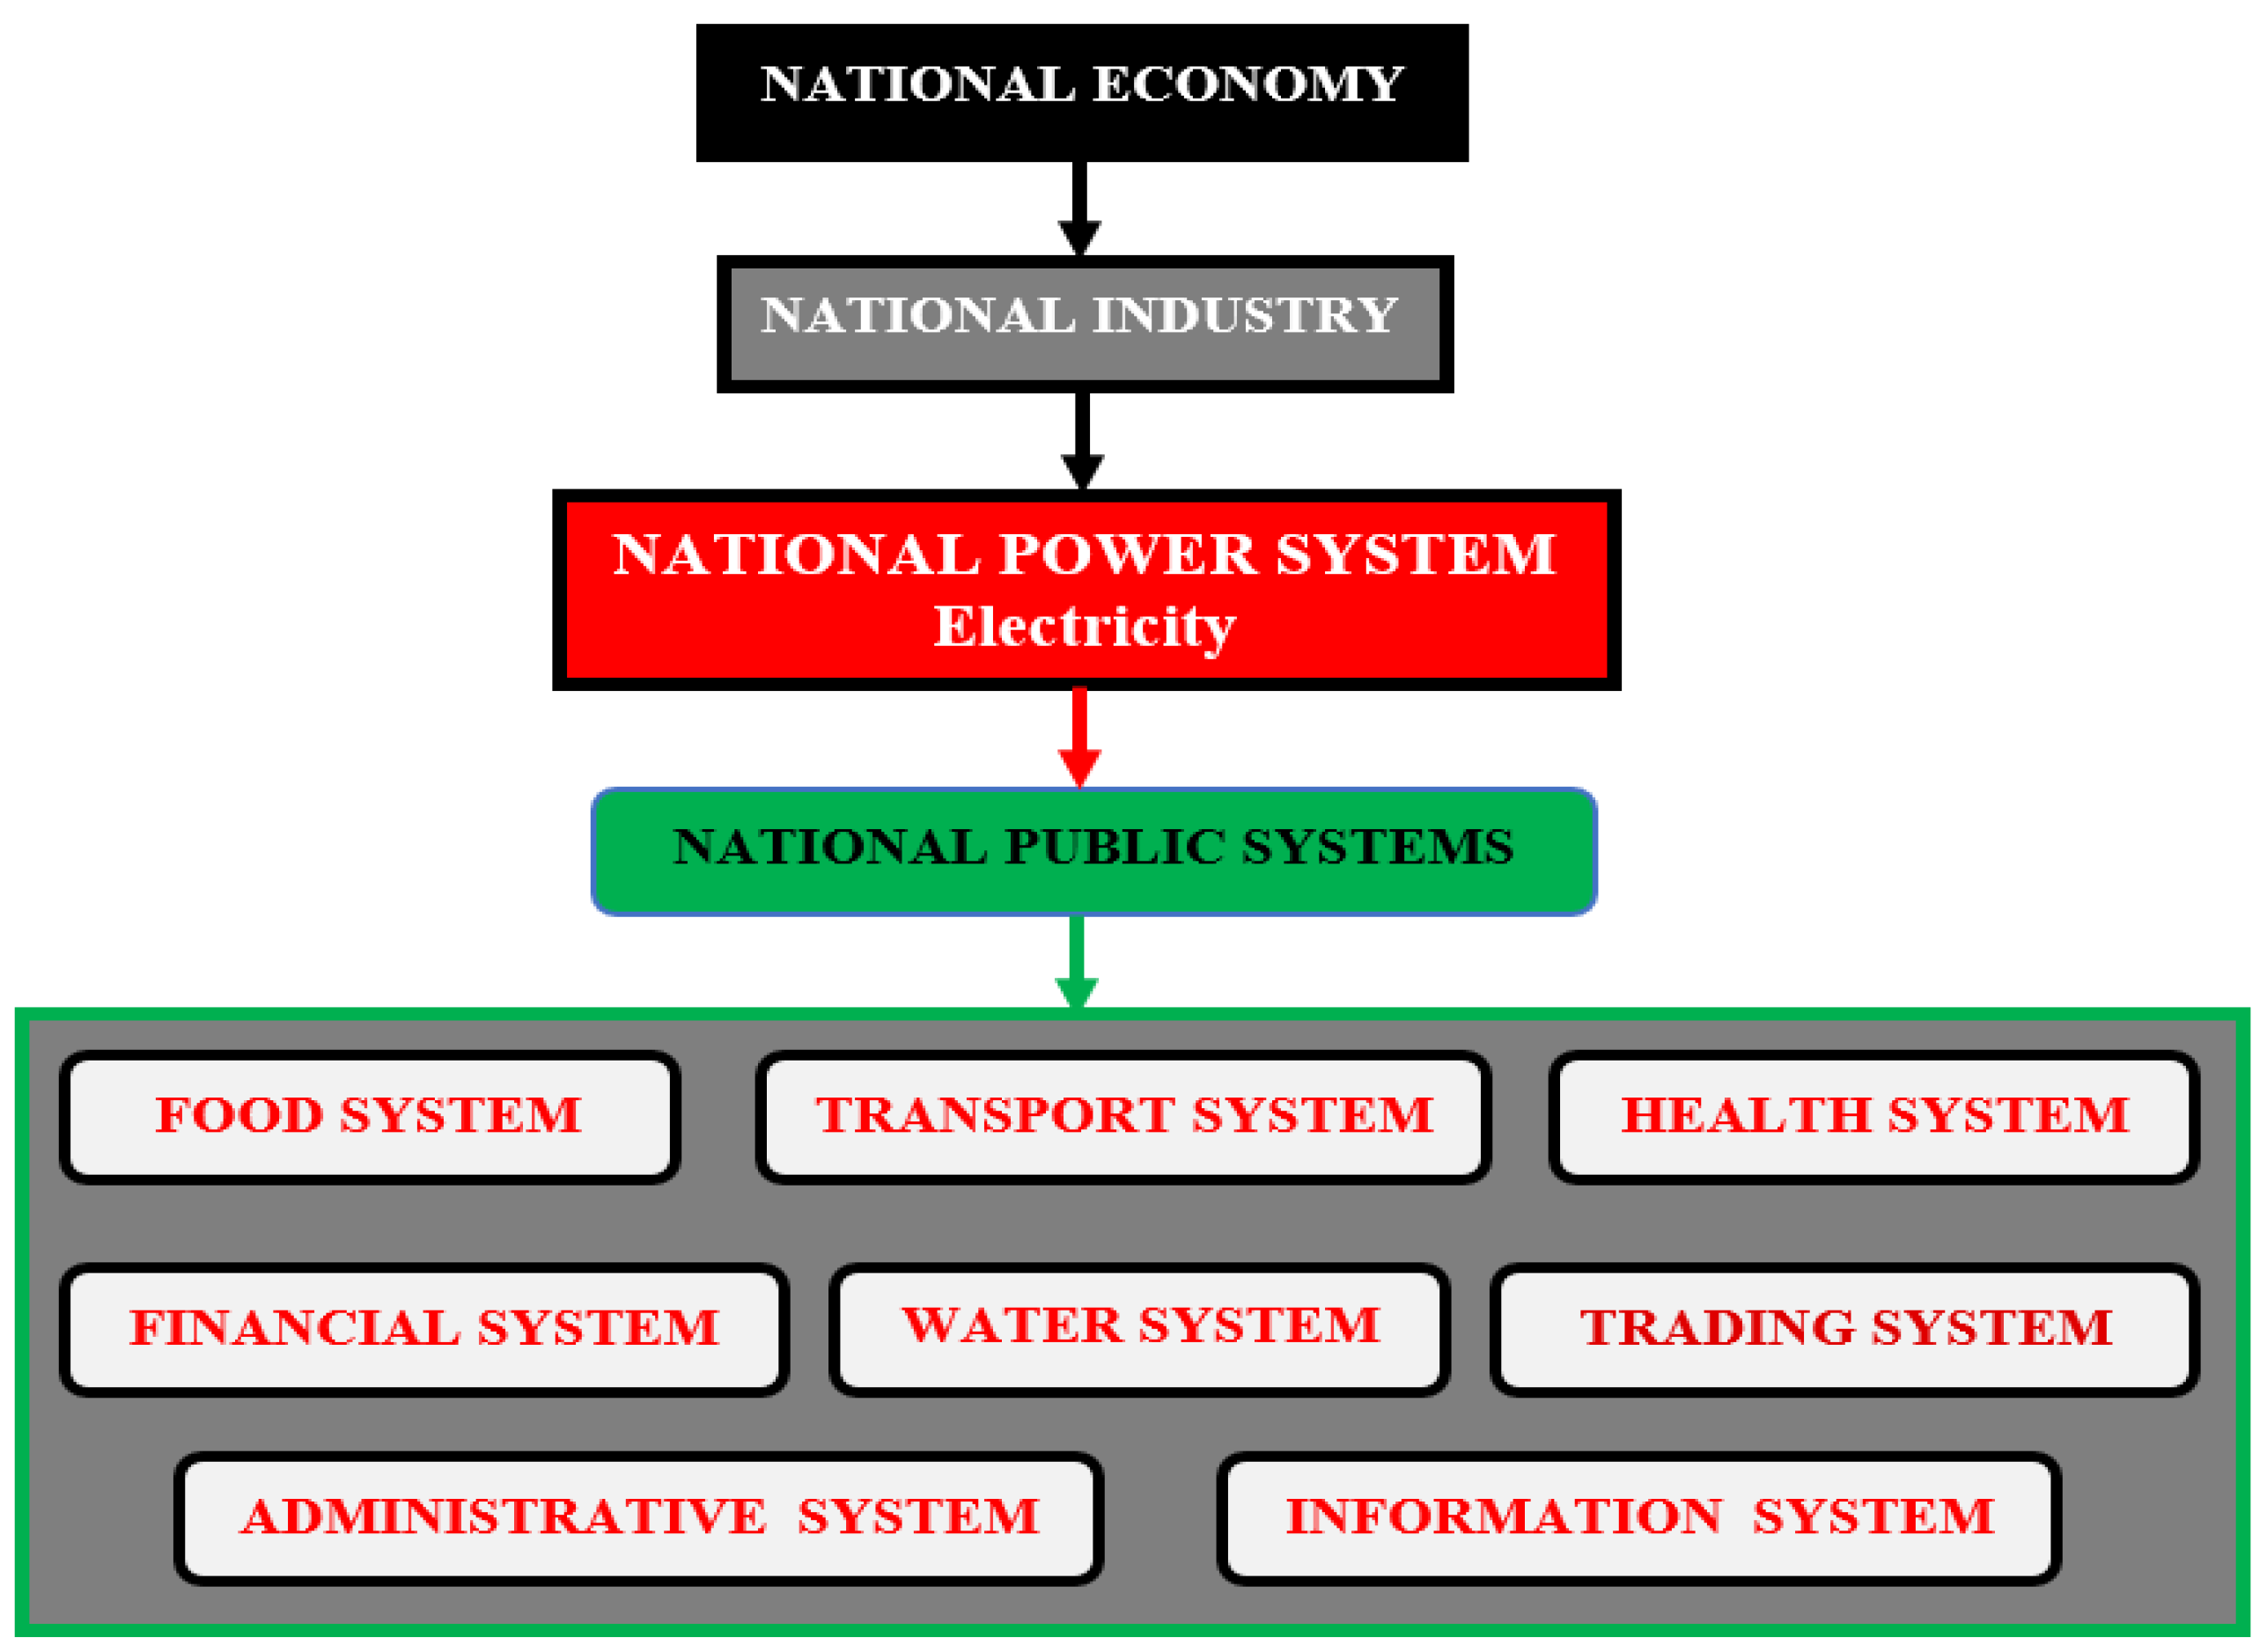
- National energy security:
- Power substations are critical infrastructures for national security, ensuring the continuity of electricity supply in key sectors such as health, industry, and transport;
- In the case of unforeseen events (natural disasters, cyber, or physical attacks), well-protected power substations can keep the energy system running.
- Economic efficiency and loss reduction:
- The well-equipped power network with modern substations can reduce transmission and distribution losses, which leads to financial savings and more efficient use of energy resources;
- By upgrading power substations, it improves the performance of the entire energy system, reducing operating and maintenance costs.
- (a)
- Practical Applications of Research:
- Improvement of Smart Grids—Studies help optimize energy distribution through advanced monitoring technologies and automated control systems.
- Integration of Renewable Sources—Research supports the development of solutions for efficiently integrating solar and wind energy, reducing reliance on fossil fuels.
- Energy Storage—Advances in batteries and other storage methods (e.g., green hydrogen) are applied to stabilize the power grid.
- Strategies for Reducing Consumption—Policies and technologies for energy efficiency and demand management are being developed.
- Backup and Resilience Systems—Research contributes to the creation of infrastructures that better withstand power outages or cyberattacks.
- (b)
- Limitations of Research:
- High Costs—Developing and implementing innovative solutions require significant investments.
- Institutional and Political Resistance—The adoption of changes can be hindered by rigid regulations and economic interests.
- Dependence on Existing Infrastructure—Many power grids are outdated and cannot be modernized quickly.
- Unpredictability of External Factors—Extreme events (storms, cyberattacks, wars) can affect the effectiveness of proposed solutions.
- Lack of Data and Predictive Models—Research requires precise data and reliable predictive models to propose effective solutions.
Author Contributions
Funding
Institutional Review Board Statement
Informed Consent Statement
Data Availability Statement
Conflicts of Interest
References
- Fita, N.D.; Ilieva Obretenova, M.; Schiopu, A.M. National Security—Elements Regarding the Optimization of the Energy Sector; Lambert Academic Publishing: London, UK, 2024. [Google Scholar]
- Barb, C.M.; Fita, N.D. A Comparative Analysis of Risk Assessment Techniques from the Risk Management Perspective. In Proceedings of the 9th International Conference on Manufacturing Science and Education—MSE 2019: Trends in New Industrial Revolution, Sibiu, Romania, 5–7 June 2019; Volume 290. [Google Scholar]
- Homer-Dixon, T. The Upside of Down: Catastrophe, Creativity, and the Renewal of Civilization; Paperback—Illustrated, January 31; Knopf Canada Publisher: Toronto, ON, Canada, 2008. [Google Scholar]
- O’Connor, J. The Fiscal Crisis of the State; Routledge: New York, NY, USA, 2001. [Google Scholar]
- Sabin, P. The Bet: Paul Ehrlich, Julian Simon, and Our Gamble over Earths; Yale University Press Publisher: London, UK, 2013. [Google Scholar]
- Heinberg, R. Blackout: Coal, Climate and the Last Energy Crisis; New Society Publishers: Gabriola Island, BC, Canada, 2009. [Google Scholar]
- Gernego, I.; Liakhova, O.; Dyba, M. Crisis management in the energy sector in conditions of increasing epidemiological risks. Polityka Energetyczna—Energy Policy J. 2022, 25, 25–44. [Google Scholar] [CrossRef]
- Glachant, J.-M. Reforming the EU Internal Electricity Market in the Middle of a Huge Energy Crisis: An Absolute Short-Term Emergency or Preparation for the Future? Working Paper, EUI RSC, 2023/03; European University Institute: Florence, Italy, 2022; Available online: https://cadmus.eui.eu/handle/1814/73658 (accessed on 29 January 2025).
- MacKay, D.J.C. Sustainable Energy—Without the Hot Air; UIT Cambridge Ltd. Publisher: Cambridge, UK, 2009. [Google Scholar]
- Gheorghe, A.; Katina, K. Resilience and Engineering System—Research Trends and Challenges. Int. J. Crit. Infrastruct. 2014, 10, 193–199. [Google Scholar]
- Volkanovski, A.; Čepin, M.; Mavko, B. Application of the Fault Tree Analysis for Assessment of Power System Reliability. Reliab. Eng. Syst. Saf. 2009, 94, 1116–1127. [Google Scholar] [CrossRef]
- Alhelou, H.H.; Hamedani-Golshan, M.E.; Njenda, T.C.; Siano, P. A Survey on Power System Blackout and Cascading Event: Research Motivations and Challenges. Energies 2019, 12, 682. [Google Scholar] [CrossRef]
- Muresan, L. European Security and Defense Policy—An Element Influencing Romania’s Actions in the Field of Security and Defense Policy; Study no. 4.; European Institute of Romania: Bucharest, Romania, 2004. [Google Scholar]
- Petrilean, D.C.; Irimie, S.I. Operational Influence on the Energetic Efficiency of a Gas Cogenerated Operated Electricity Generator. J. Environ. Prot. Ecol. 2016, 17, 1464–1471. [Google Scholar]
- Curt, C.; Tacnet, J.M. Risk Anal. 2018, 38, 2441–2458. [CrossRef]
- European Commission. Commission Staff Working Document Impact Assessment Accompanying the Document Proposal for a Directive of the European Parliament and of the Council on the Resilience of Critical Entities; European Commission: Brussels, Belgium, 2020.
- Petrilean, D.C.; Irimie, S.I. Solutions for the capitalization of the energetic potential of sludge collected in Danutoni Wastewater Treatment Plant. J. Environ. Prot. Ecol. 2015, 16, 1203–1211. [Google Scholar]
- Zhang, Y.; Xu, Y.; Dong, Z.Y. Robust Ensemble Data Analytics for Incomplete PMU Measurements-Based Power System Stability Assessment. IEEE Trans. Power Syst. 2018, 33, 1124–1126. [Google Scholar]
- Amini, S.; Pasqualetti, F.; Mohsenian-Rad, H. Dynamic load altering attacks against power system stability: Attack models and protection schemes. IEEE Trans. Smart Grid 2018, 9, 2862–2872. [Google Scholar]
- Ahmad, I.; Khan, F.; Khan, S.; Khan, A.; Tareen, A.W.; Saeed, M. Blackout Avoidance through Intelligent Load Shedding in Modern Electrical Power Utility Network. J. Appl. Emerg. Sci. 2018, 8, 48–57. [Google Scholar]
- Zamani, R.; Hamedani-Golshan, M.E.; Alhelou, H.H.; Siano, P.; Pota, H.R. Islanding detection of synchronous distributed generator based on the active and reactive power control loops. Energies 2018, 11, 2819. [Google Scholar] [CrossRef]
- ISO 31000:2018; Risk Management. ISO—International Organization for Standardization: Geneva, Switzerland, 2024.
- Carreras, B.A.; Reynolds-Barredo, J.M.; Dobson, I.; Newman, D.E. Validating the OPA Cascading Blackout Model on a 19402 Bus Transmission Network with Both Mesh and Tree Structures. In Proceedings of the 52nd Hawaii International Conference on System Sciences (HICSS), Wailea, HI, USA, 8–11 January 2019. [Google Scholar]
- Xu, D.; Wang, H. Blackout Risk Assessment of Cascading Outages Considering Wind Power Uncertainty. In Proceedings of the 2018 IEEE International Conference on Energy Internet (ICEI), Beijing, China, 21–25 May 2018; pp. 252–257. [Google Scholar]
- Liu, B.; Zhou, B.; Jiang, D.; Yu, Z.; Yang, X.; Ma, X. Distributed Accommodation for Distributed Generation–From the View of Power System Blackouts. In Advances in Green Energy Systems and Smart Grid; Springer: New York, NY, USA, 2018; pp. 236–246. [Google Scholar]
- Ilieva-Obretenova, M. Information System Functions for SmartGrid Management. Sociol. Study 2016, 6, 96–104. [Google Scholar] [CrossRef]
- Vasilescu, G.D.; Petrilean, C.D.; Kovacs, A.; Vasilescu, G.V.; Pasculescu, D.; Ilcea, G.I.; Burduhos-Nergis, D.-P.; Bejinariu, C. Methodology for Assessing the Degree of Occupational Safety Specific to Hydro-Technical Construction Activities, in order to Increase Their Sustainability. Sustainability 2021, 13, 1105. [Google Scholar] [CrossRef]


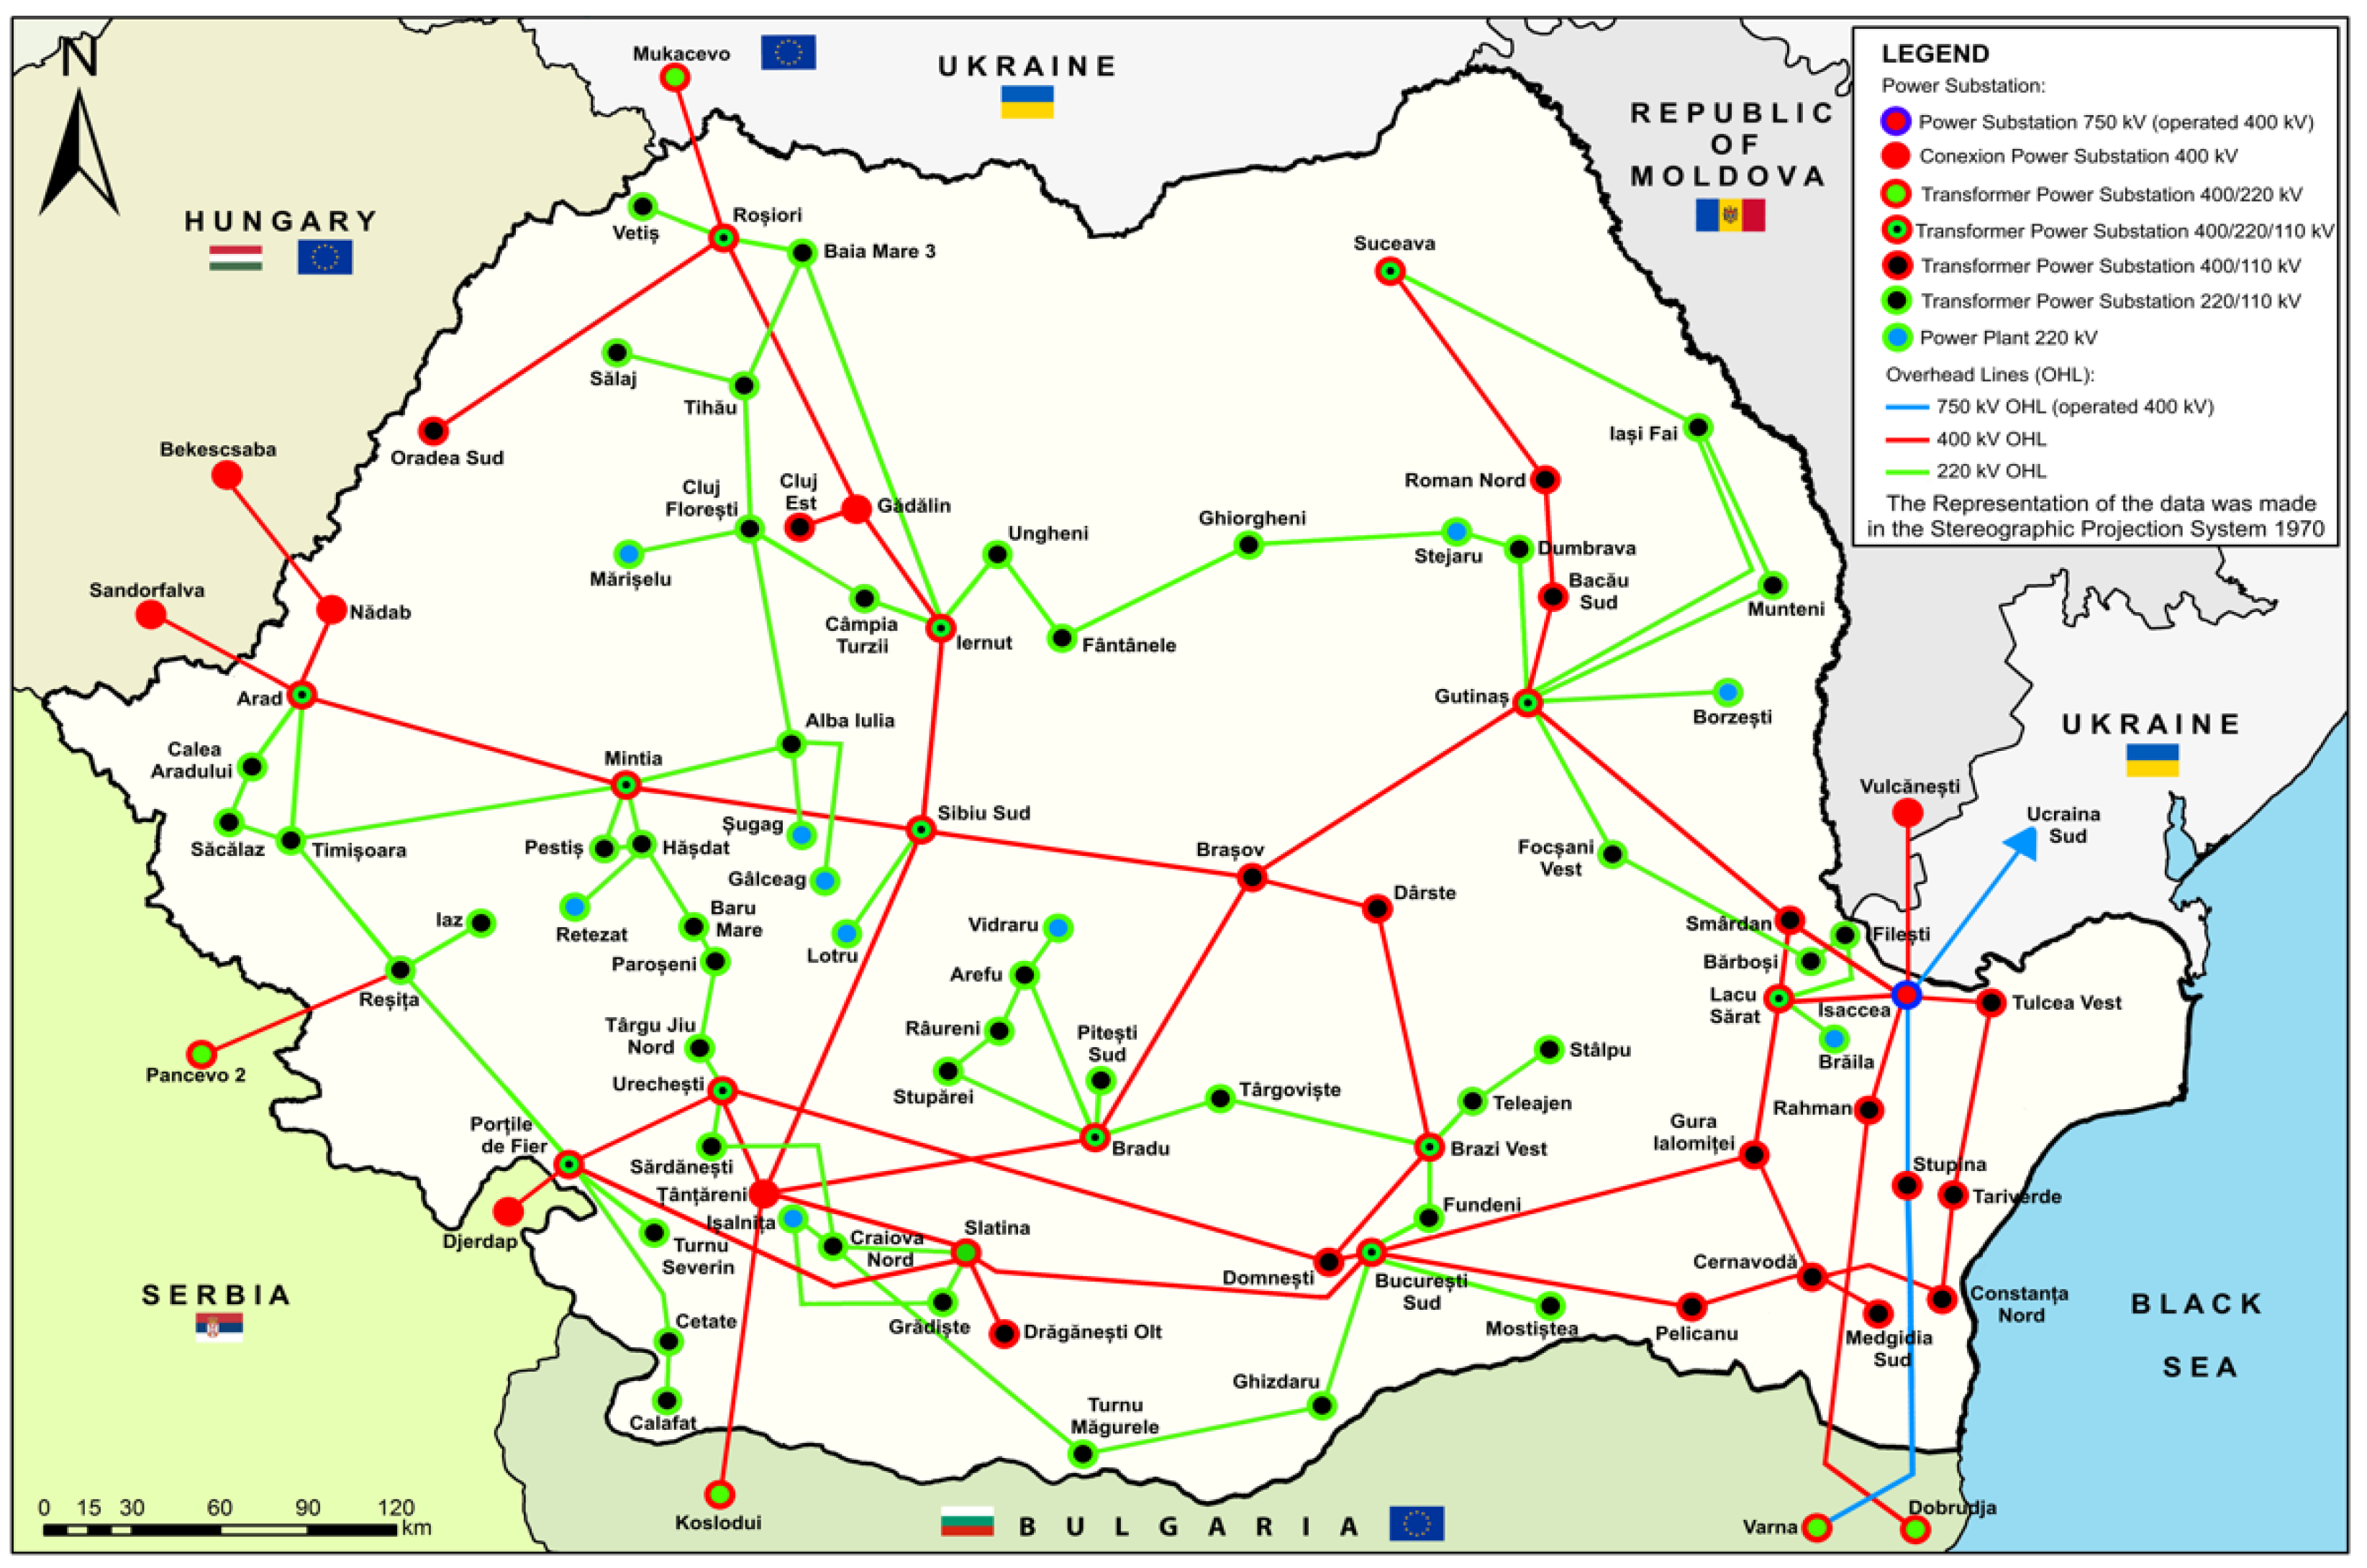
| Country | Type of Connection (Overhead Electric Line) | Voltage Level |
|---|---|---|
| UKRAINE | Roșiori—Mukacevo | 400 kV—connection to EU, through ENTSO-E |
| Isaccea—South Ukraine | 400 kV (750 kV)—disabled line | |
| HUNGARY | Nădab—Bekescsaba | 400 kV—connections to EU, through ENTSO-E |
| Arad—Sandorfalva | ||
| SERBIA | Reșița—Pancevo 2 | 400 kV—connections to EU |
| Porțile de Fier—Djerdap | ||
| BULGARIA | Țânțăreni—Kosloduy | 400 kV—connections to EU, through ENTSO-E |
| Rahman—Dobrudja | ||
| Stupina—Varna | 400 kV (750 kV)—connection to EU | |
| REPUBLIC OF MOLDOVA | Isaccea—Vulcănești | 400 kV |
Causes:
| Effects:
|
Causes:
| Effects:
|
| Scenario 1: Failure Vulnerabilities and Capabilities | Level |
|---|---|
| 1. Poor/wrong design of the power substations and overhead powerlines against earthquakes | Very low |
| Low | |
| Average | |
| High | |
| Very high | |
| 2. Risk of tsunami occurrence after an earthquake | Very low |
| Low | |
| Average | |
| High | |
| Very high | |
| 3. Lack of personnel or insufficiently trained personnel for crisis, natural calamity, or risk management. | Very low |
| Low | |
| Average | |
| High | |
| Very high |
| Impacts | Level | |
|---|---|---|
| 1. Huge damages determined by the lack of electric energy | 1. Very low | Temporarily |
| 2. Low | Important damages | |
| 3. Average | Average damages | |
| 4. High | High damages | |
| 5. Very high | Very high damages | |
| 2. Huge damages determined by the interdependence with other systems | 1. Very low | 0–10% of VIC |
| 2. Low | 11–20% of VIC | |
| 3. Average | 21–30% of VIC | |
| 4. High | 31–40% of VIC | |
| 5. Very high | Over 41% of VIC | |
| 3. Potential damages of the environment | 1. Very low | 0–20% |
| 2. Low | 21–40% | |
| 3. Average | 41–60% | |
| 4. High | 61–80% | |
| 5. Very high | Over 81% | |
| 4. Powerful social impacts | 1. Very low | 0–10% of PC |
| 2. Low | 11–20% of PC | |
| 3. Average | 21–30% of PC | |
| 4. High | 31–40% of PC | |
| 5. Very high | Over 41% of PC |
| Vulnerability and/or Capability | Measures Proposed |
| 1. Poor/wrong design of the power substations and overhead powerlines against earthquakes |
|
| 2. Lack of personnel or insufficiently trained personnel for crises, natural calamity, or risk management. |
|
| Scenario 1: Failure Vulnerability | Identified | After Applying the Measures |
| 1. Very low | 1. Very low |
| 2. Low | 2. Low | |
| 3. Average | 3. Average | |
| 4. High | 4. High | |
| 5. Very high | 5. Very high |
| Scenario 2: Failure Vulnerabilities and Capabilities | Level |
|---|---|
| 1. Failure to observe fire safety and physical security standards | Very low |
| Low | |
| Average | |
| High | |
| Very high | |
| 2. Lack of training for personnel dealing with the management of the critical infrastructure protection | Very low |
| Low | |
| Average | |
| High | |
| Very high | |
| 3. Lack of personnel/insufficient training of cybernetic security personnel. Insecurity of hardware and software systems. Insecure communication. Lack of investments in cybernetic security. | Very low |
| Low | |
| Average | |
| High | |
| Very high |
| Impacts | Level | |
|---|---|---|
| 1. Huge damages determined by the lack of electric energy | 1. Very low | Temporarily |
| 2. Low | Important damages | |
| 3. Average | Average damages | |
| 4. High | High damages | |
| 5. Very high | Very high damages | |
| 2. Huge damage determined by the interdependence with other systems | 1. Very low | 0–10% of VIC |
| 2. Low | 11–20% of VIC | |
| 3. Average | 21–30% of VIC | |
| 4. High | 31–40% of VIC | |
| 5. Very high | Over 41% of VIC | |
| 3. Potential damage to the environment | 1. Very low | 0–20% |
| 2. Low | 21–40% | |
| 3. Average | 41–60% | |
| 4. High | 61–80% | |
| 5. Very high | Over 81% | |
| 4. Powerful social impact | 1. Very low | 0–10% of PC |
| 2. Low | 11–20% of PC | |
| 3. Average | 21–30% of PC | |
| 4. High | 31–40% of PC | |
| 5. Very high | Over 41% of PC |
| Vulnerability and/or Capability | Measures Proposed |
|---|---|
| 1. Failure to observe fire safety and physical security standards. |
|
| 2. Lack of training for personnel dealing with the management of the critical infrastructure protection. |
|
| 3. Lack of personnel/insufficient training of the cybernetic security personnel. Insecurity of hardware and software systems. Insecure communication. Lack of investments in cybernetic security. |
|
| Scenario 2: Failure Vulnerability | Identified | After Applying the Measures |
|---|---|---|
| Failure to observe fire safety and physical security standards Lack of training for personnel dealing with the management of critical infrastructure protection -Lack of personnel/insufficient training of the cybernetic security personnel. Insecurity of hardware and software systems. Insecure communication. Lack of investments in cybernetic security. | 1. Very low | 1. Very low |
| 2. Low | 2. Low | |
| 3. Average | 3. Average | |
| 4. High | 4. High | |
| 5. Very high | 5. Very high |
| Risk Scenario | Vulnerability and/or Capability | Measures Proposed |
|---|---|---|
| Risk scenario 1 | 1. Poor/wrong design of the power stations and aerial electric lines against earthquakes |
|
| 2. Lack of personnel or personnel who are insufficiently trained for crises, natural calamities, or risk management |
| |
| Risk scenario 2 | 1. Failure to observe fire safety and physical security standards |
|
| 2. Lack of personnel training in the management of the critical infrastructures’ protection |
| |
| 3. Lack of personnel/insufficient training of the personnel in cybernetic security. Insecure hardware and software systems. Insecure communication. Lack of investments in cybernetic security. |
|
Disclaimer/Publisher’s Note: The statements, opinions and data contained in all publications are solely those of the individual author(s) and contributor(s) and not of MDPI and/or the editor(s). MDPI and/or the editor(s) disclaim responsibility for any injury to people or property resulting from any ideas, methods, instructions or products referred to in the content. |
© 2025 by the authors. Licensee MDPI, Basel, Switzerland. This article is an open access article distributed under the terms and conditions of the Creative Commons Attribution (CC BY) license (https://creativecommons.org/licenses/by/4.0/).
Share and Cite
Petrilean, D.C.; Fîță, N.D.; Vasilescu, G.D.; Ilieva-Obretenova, M.; Tataru, D.; Cruceru, E.A.; Mateiu, C.I.; Nicola, A.; Darabont, D.-C.; Cazac, A.-M.; et al. Sustainability Management Through the Assessment of Instability and Insecurity Risk Scenarios in Romania’s Energy Critical Infrastructures. Sustainability 2025, 17, 2932. https://doi.org/10.3390/su17072932
Petrilean DC, Fîță ND, Vasilescu GD, Ilieva-Obretenova M, Tataru D, Cruceru EA, Mateiu CI, Nicola A, Darabont D-C, Cazac A-M, et al. Sustainability Management Through the Assessment of Instability and Insecurity Risk Scenarios in Romania’s Energy Critical Infrastructures. Sustainability. 2025; 17(7):2932. https://doi.org/10.3390/su17072932
Chicago/Turabian StylePetrilean, Dan Codruț, Nicolae Daniel Fîță, Gabriel Dragoș Vasilescu, Mila Ilieva-Obretenova, Dorin Tataru, Emanuel Alin Cruceru, Ciprian Ionuț Mateiu, Aurelian Nicola, Doru-Costin Darabont, Alin-Marian Cazac, and et al. 2025. "Sustainability Management Through the Assessment of Instability and Insecurity Risk Scenarios in Romania’s Energy Critical Infrastructures" Sustainability 17, no. 7: 2932. https://doi.org/10.3390/su17072932
APA StylePetrilean, D. C., Fîță, N. D., Vasilescu, G. D., Ilieva-Obretenova, M., Tataru, D., Cruceru, E. A., Mateiu, C. I., Nicola, A., Darabont, D.-C., Cazac, A.-M., & Bejinariu, C. (2025). Sustainability Management Through the Assessment of Instability and Insecurity Risk Scenarios in Romania’s Energy Critical Infrastructures. Sustainability, 17(7), 2932. https://doi.org/10.3390/su17072932