Article

Depopulation and the Development of Peri-Urban Green Areas of Large Cities: Lessons Learned from Romania

Institute of Geography, Romanian Academy, 023993 Bucharest, Romania
*
Author to whom correspondence should be addressed.
Sustainability 2025, 17(7), 2925; https://doi.org/10.3390/su17072925
Submission received: 12 February 2025 / Revised: 21 March 2025 / Accepted: 24 March 2025 / Published: 26 March 2025
(This article belongs to the Special Issue Urban Green Areas: Benefits, Design and Management Strategies)

Abstract

:
The migration of the population from large urban centers to green areas in peri-urban areas is a characteristic phenomenon for large metropolises in Central and Eastern Europe, in the context of the accentuation of globalizing flows. Romania is a good example in this regard. The paper analyzes the impact of urban–peri-urban migration in the general context of the demographic decline in this country and the regional differentiations of the dynamics of the depopulation phenomenon. Five regional metropolises with macro-territorial polarization functions were selected as case studies: Bucharest, Cluj-Napoca, Timișoara, Iași and Constanța. The study aims to carry out a spatio-temporal correlative analysis on the development of the peri-urban areas bordering large cities, in order to fill a gap in the scientific literature on these aspects. It attempts to explain the causes of the atypical trajectories of these localities in the general context of the demographic decline affecting the countries of Central and Eastern Europe, through a complex analysis of the interdependencies between factors, drawing attention to the fragility of these areas in terms of green infrastructure and elaborating a series of forecasts regarding integrated urban–rural development. This paper contributes to the literature on spatial planning and in particular on the post-industrial reconversion of the areas bordering large urban centers, as a result of the phenomena of depopulation and exurbanization. It can serve as a reference for the stage of development of the peri-urban areas of the capital and the main regional metropolises in Romania, cities representative of the urban development trajectories in Central and Eastern Europe.

1. Introduction

The economic and social changes determined by the collapse of political and ideological barriers in the eighth decade of the last century generated both changes in demographic behavior and in the reorientation of migratory flows. In the context of the removal of legislative constraints on the migration of people, the states of Central and South-Eastern Europe that belonged to the former Communist Bloc formed the main emigration area on the European continent. In some situations, especially in the ex-Soviet and ex-Yugoslav areas, affected by armed conflicts, the migration deficit was amplified by the natural one, resulting in sharp population declines (Rep. Moldova −31%, Georgia −30%, Latvia −29%, Ukraine −28%, Bosnia and Herzegovina −28%, Lithuania −23%), and in others (Bulgaria −23%, Croatia −19%, Romania −17%, Albania −14% and Hungary −7%) [1], the population deficit was partially offset by labor immigration from Asia (especially from China and the Indian subcontinent). On the other hand, there were also large changes in internal migration. Against the overall background of depopulation, some areas with atypical demographic developments determined by certain local particularities emerged [2]. Such a situation is represented by the peri-urban areas of large cities.
Recent demographic developments in peri-urban areas bordering large cities represent a less researched topic in current scientific literature. Its complexity results from the multitude of factors, closely interdependent, that contribute to the individualization of these evolutionary trajectories: the economic crisis (which influences the dynamics of real estate investments and apartment prices); the proximity of the conflict in Ukraine and regional and international geopolitical instability (which determines the increase in EU spending on rearmament, at the expense of other categories of budgetary expenditure); deindustrialization and tertiarization (which influence migrations, including urban–peri-urban ones, but also changes in land use); the connectivity system (which influences the location of investments and the location of the population); location and natural setting (which conditions the degree of accessibility); the relocation of work favored by the coronavirus pandemic (which contributes to limiting population flows), etc.
In this general context, the present paper aims to analyze the dynamics of the peri-urban areas of the regional metropolises in Romania in the context of depopulation, but also of the exurbanization phenomena determined by the migration of the population from the metropolitan centers to the green areas in the peri-urban space. The development of peri-urban areas by extending the built stock and urban functions beyond the administrative territories of the large cities constitutes a characteristic of contemporary urbanization in Central and Eastern Europe [3], and Romania is a good example in this regard.
The study carries out a spatio-temporal correlative analysis (for five large cities located relatively uniformly across the surface of Romania, and the information from the last two national censuses, from 2011 and 2021, as reference elements) on the development of the peri-urban area bordering large cities, thus contributing to filling a gap in the scientific literature on this aspect. It attempts to explain the causes for the atypical trajectories of these localities in the general context of the demographic decline affecting the countries of Central and Eastern Europe, through a complex analysis of the interdependencies between factors, drawing attention to the fragility of these areas from the point of view of green infrastructures, and elaborating a series of forecasts regarding integrated urban–rural development.

2. Research Methodology and Resources

As we already mentioned, the methodological approach is based on the correlative analysis of several categories of indicators: demographic, housing infrastructure, as well as the structure of the land fund and the dynamics of green and recreational spaces in the vicinity of cities with regional metropolis functions in Romania. In this regard, the following case studies were selected: Bucharest, the capital of Romania, a city with macro-regional functions, as well as the following four regional metropolises in the demographic hierarchy of Romania: Cluj-Napoca, Timișoara, Iași and Constanța.
Their selection was made based on their demographic size (between 250,000 and 300,000 inhabitants, excluding the capital, which has 1.7 million inhabitants) (Table 1), their potential for economic and social polarization [4,5], functional complexity, but also on their most balanced distribution across the territory of Romania (Figure 1).
Bucharest, the capital of Romania, is the main polarizing nucleus in the south of this country, and the other four selected regional metropolises constitute the main polarizing nuclei for a distinct historical–geographic region: Transylvania, Moldova, Dobrogea and Banat.
Some analyses were also extended to other large cities in Romania, in order to better highlight the place of case studies at the level of cities with regional polarization functions in this country.
On the other hand, the dynamics of localities in their peri-urban crowns were analyzed in relation to the distribution and dynamics of green areas based on land-use/land cover datasets derived from satellite images, bibliographic resources, and also on the authors’ own observations made in the field during the period 2020–2023. The analysis focused on two levels, which are closely interdependent: population and housing stock, aspects considered representative of the overall evolution of the respective localities and which highlight the migratory trend of both urban–peri-urban and rural–peri-urban.
Bibliographic resources from Romanian and international scientific literature were used, focusing on specific issues, but also on correlative aspects between the analyzed case studies and similar situations in other European countries with similar demographic profiles. Thus, for the issues related to exurbanization, two studies considered representative of two distinct temporal moments were analyzed: [8,9], respectively; for those related to internal migrations, the studies of [10,11]; for the analysis of urban migration policies, the article written by [12] was consulted. The particularities of the socio-spatial segregation of urban spaces were documented through the works of [13,14], respectively, in close correlation with those related to urban physiognomy [15,16,17] and urban accessibility [18], respectively. In addition, there are studies documenting comparative analyses of representative case studies from Europe (both from the EU and outside it), with the case studies selected in this paper. The particularities of the Romanian capital and its peri-urban area have been analyzed in comparison with those of European metropolises such as Budapest (through the studies of [19,20]), Prague [21], Berlin [22,23], Copenhagen [24], or Moscow [25], and the particularities of regional metropolises in Romania were analyzed through comparative aspects with Krakow [2,26], and other medium and small cities in Poland [27], respectively.
The data used were taken from official Romanian [6,7,28] and international [1,29] statistics, and the maps were created by processing statistical information and spatial land use/land cover datasets available at the European level on the Copernicus (“This publication has been prepared using European Union’s Copernicus Land Monitoring Service information; <DOI (vector): https://doi.org/10.2909/71c95a07-e296-44fc-b22b-415f42acfdf0; DOI (vector): https://doi.org/10.2909/916c0ee7-9711-4996-9876-95ea45ce1d27 https://doi.org/10.2909/5c1f2e03-fcba-47b1-afeb-bc05a47bada0>”) Land Monitoring Service (CLMS) and Emergency Management Service (CEMS) websites [30,31,32].
The CLMS and CEMS datasets, obtained by interpreting a variety of satellite images, used to illustrate the dynamics of land and vegetation-covered areas, together with normative acts and documents from the legislation of the European Union [33,34,35] and Romania regulating human settlement systems and urban green spaces [36,37,38,39,40,41] and the organization of peri-urban and metropolitan areas [42], were processed. In addition, data and information taken from the central and local media in Romania, from the National Environmental Guard, as well as from non-governmental organizations specialized in environmental protection (GreenPeace, GreenCommunity, etc.), were added.
The reasoning of the analysis starts from the macro-territorial level, first highlighting the demographic particularities of Romania in the European and regional context, and the causes that contributed to the current demographic decline; this is followed by a brief analysis at the national level, focused on regional/county demographic differentiation and trajectories, as a preamble to the local level analysis, on the five selected case studies, highlighting the atypical trajectories of the LAUs in the peri-urban crowns bordering large urban centers and the causes that generated these development trajectories.
In order to better quantify the housing stock development trend, data and information on migration flows were correlated with those on the evolution of real estate prices in the major urban centers in Romania and their peri-urban areas. This analysis was carried out considering two categories of residential areas: (1) those made up of old homes, built during the great socialist urbanization period (1965–1989), characteristic of central and semi-central urban areas, where the optimization of the ratio between built and green areas was taken into account, and (2) those made up of new homes, built after 1990, located in peripheral urban areas and peri-urban areas with a deficit of green and recreational areas. Current data and information regarding the evolution of apartment and land prices, which influence the dynamics of the built stock in large cities and their peri-urban areas, were taken from the websites of some representative companies for the real estate sector in Romania [43,44].

3. Results and Discussions

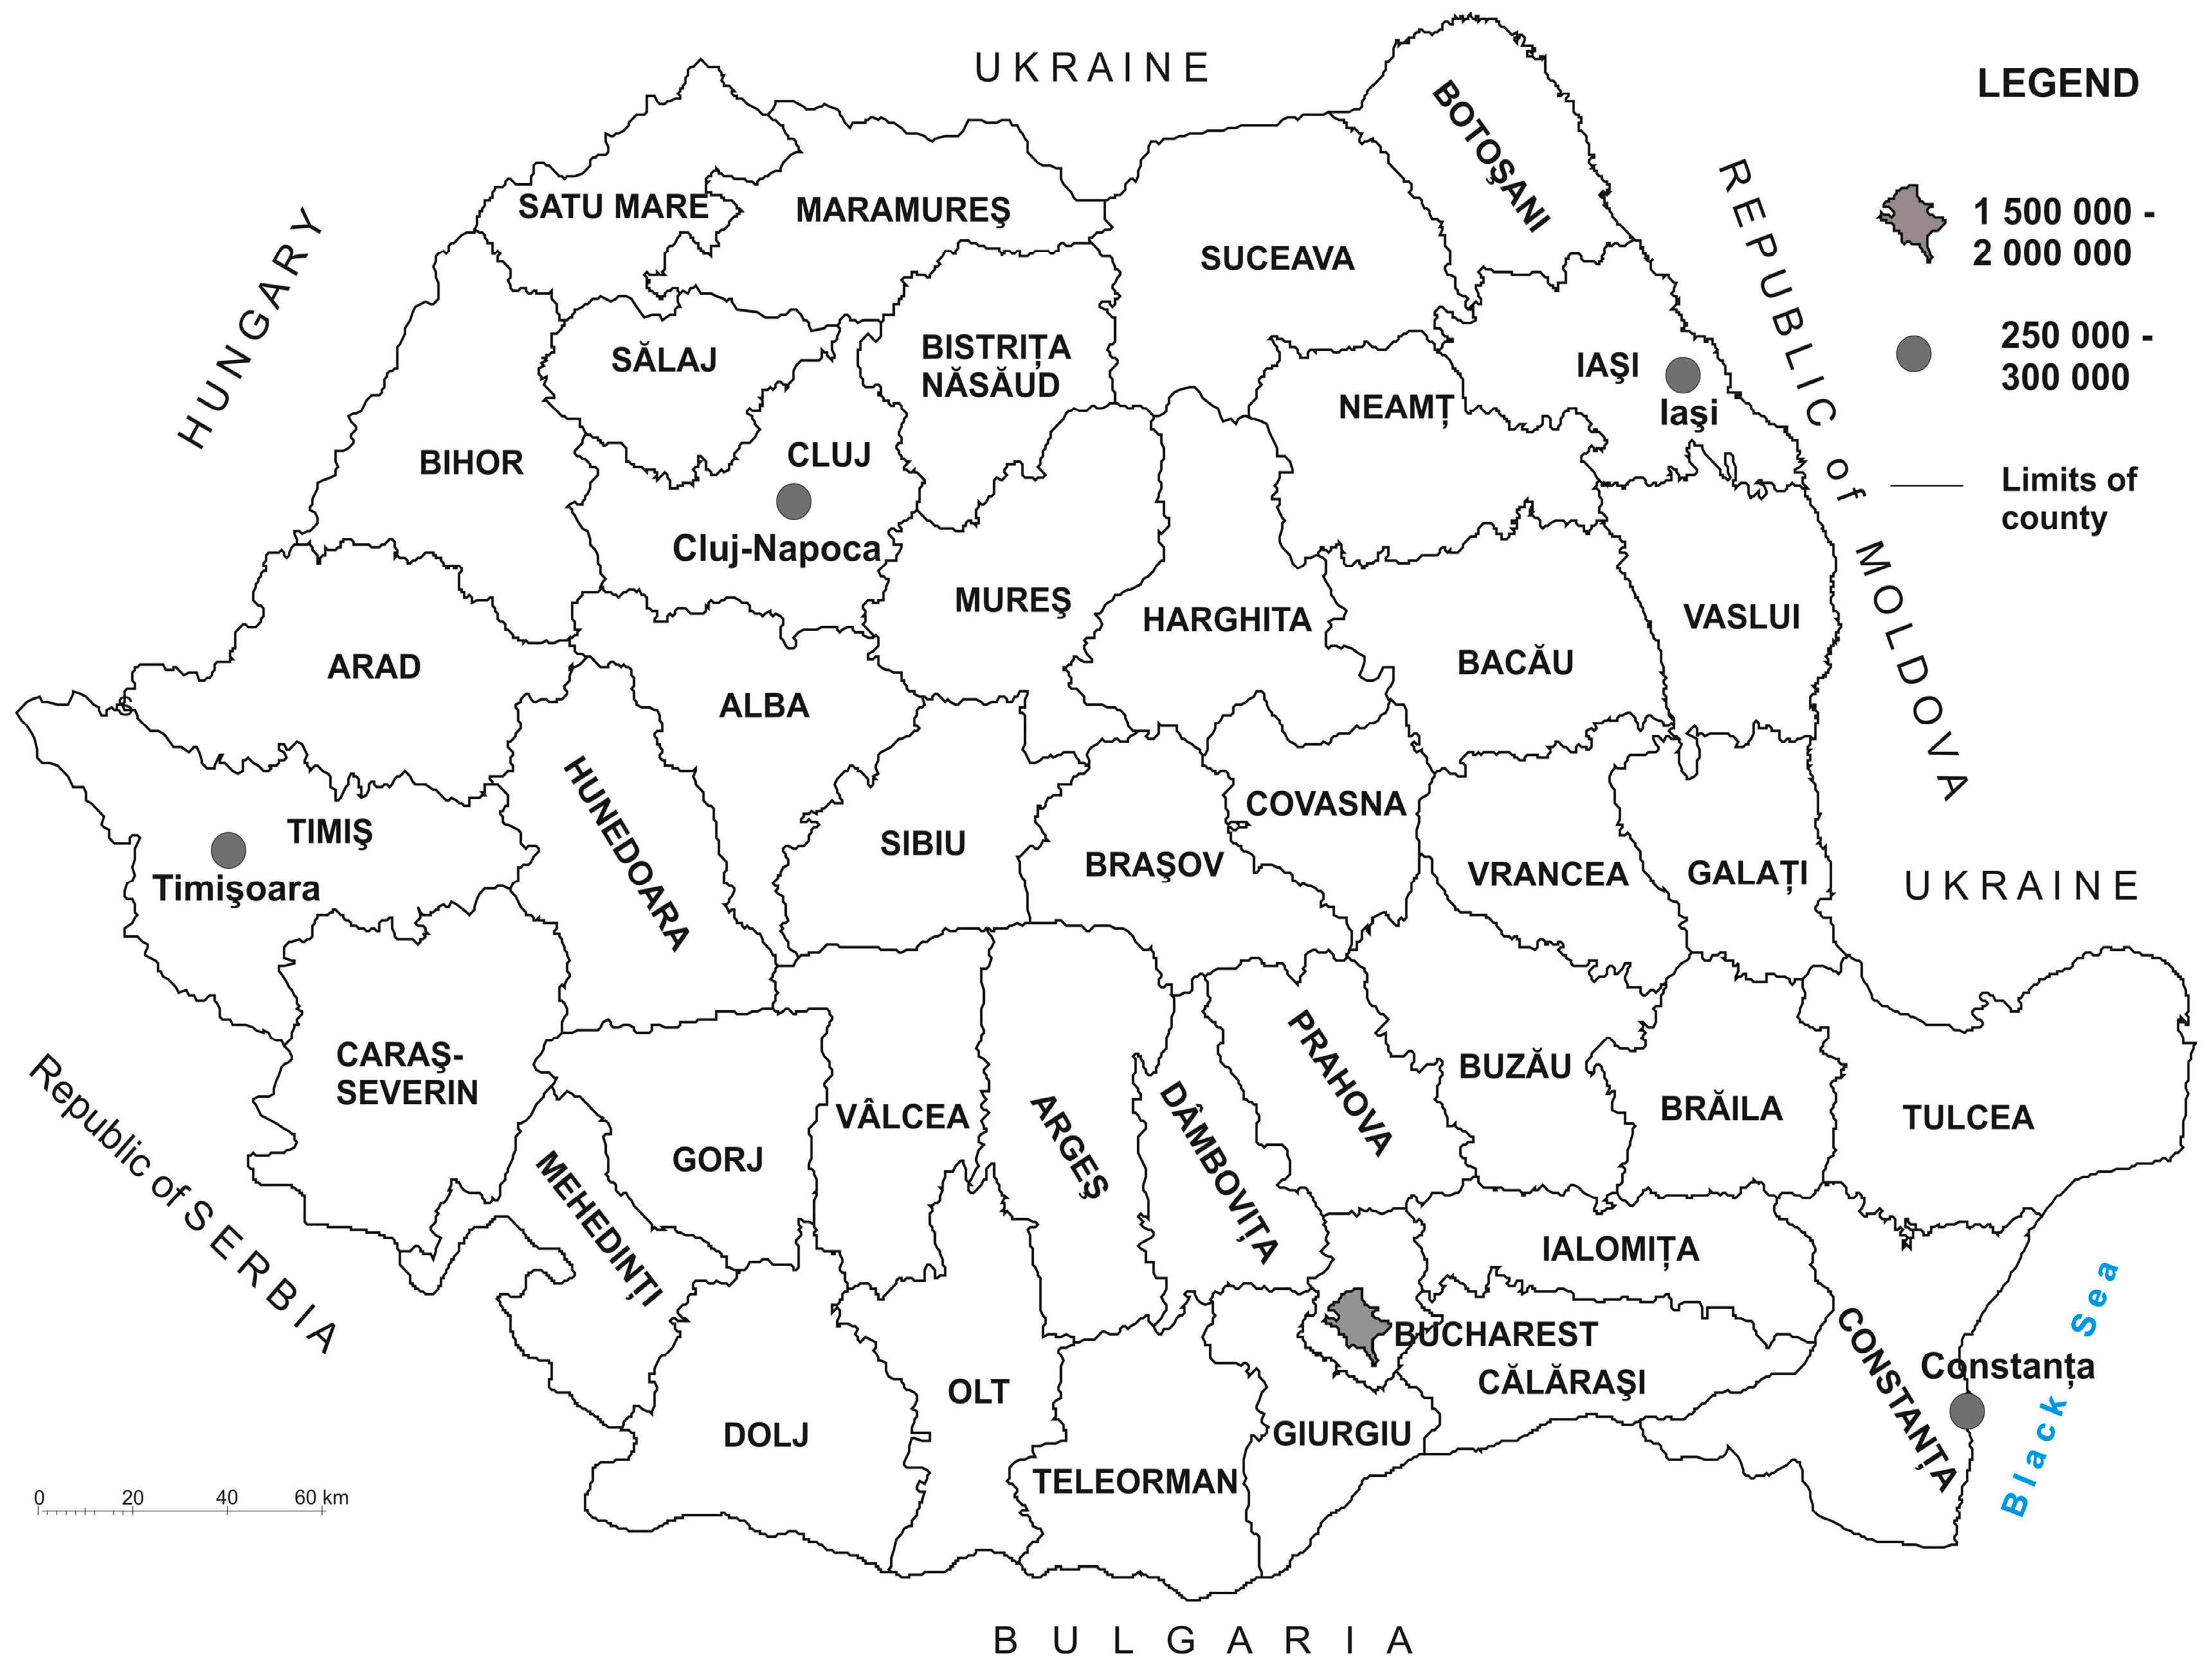
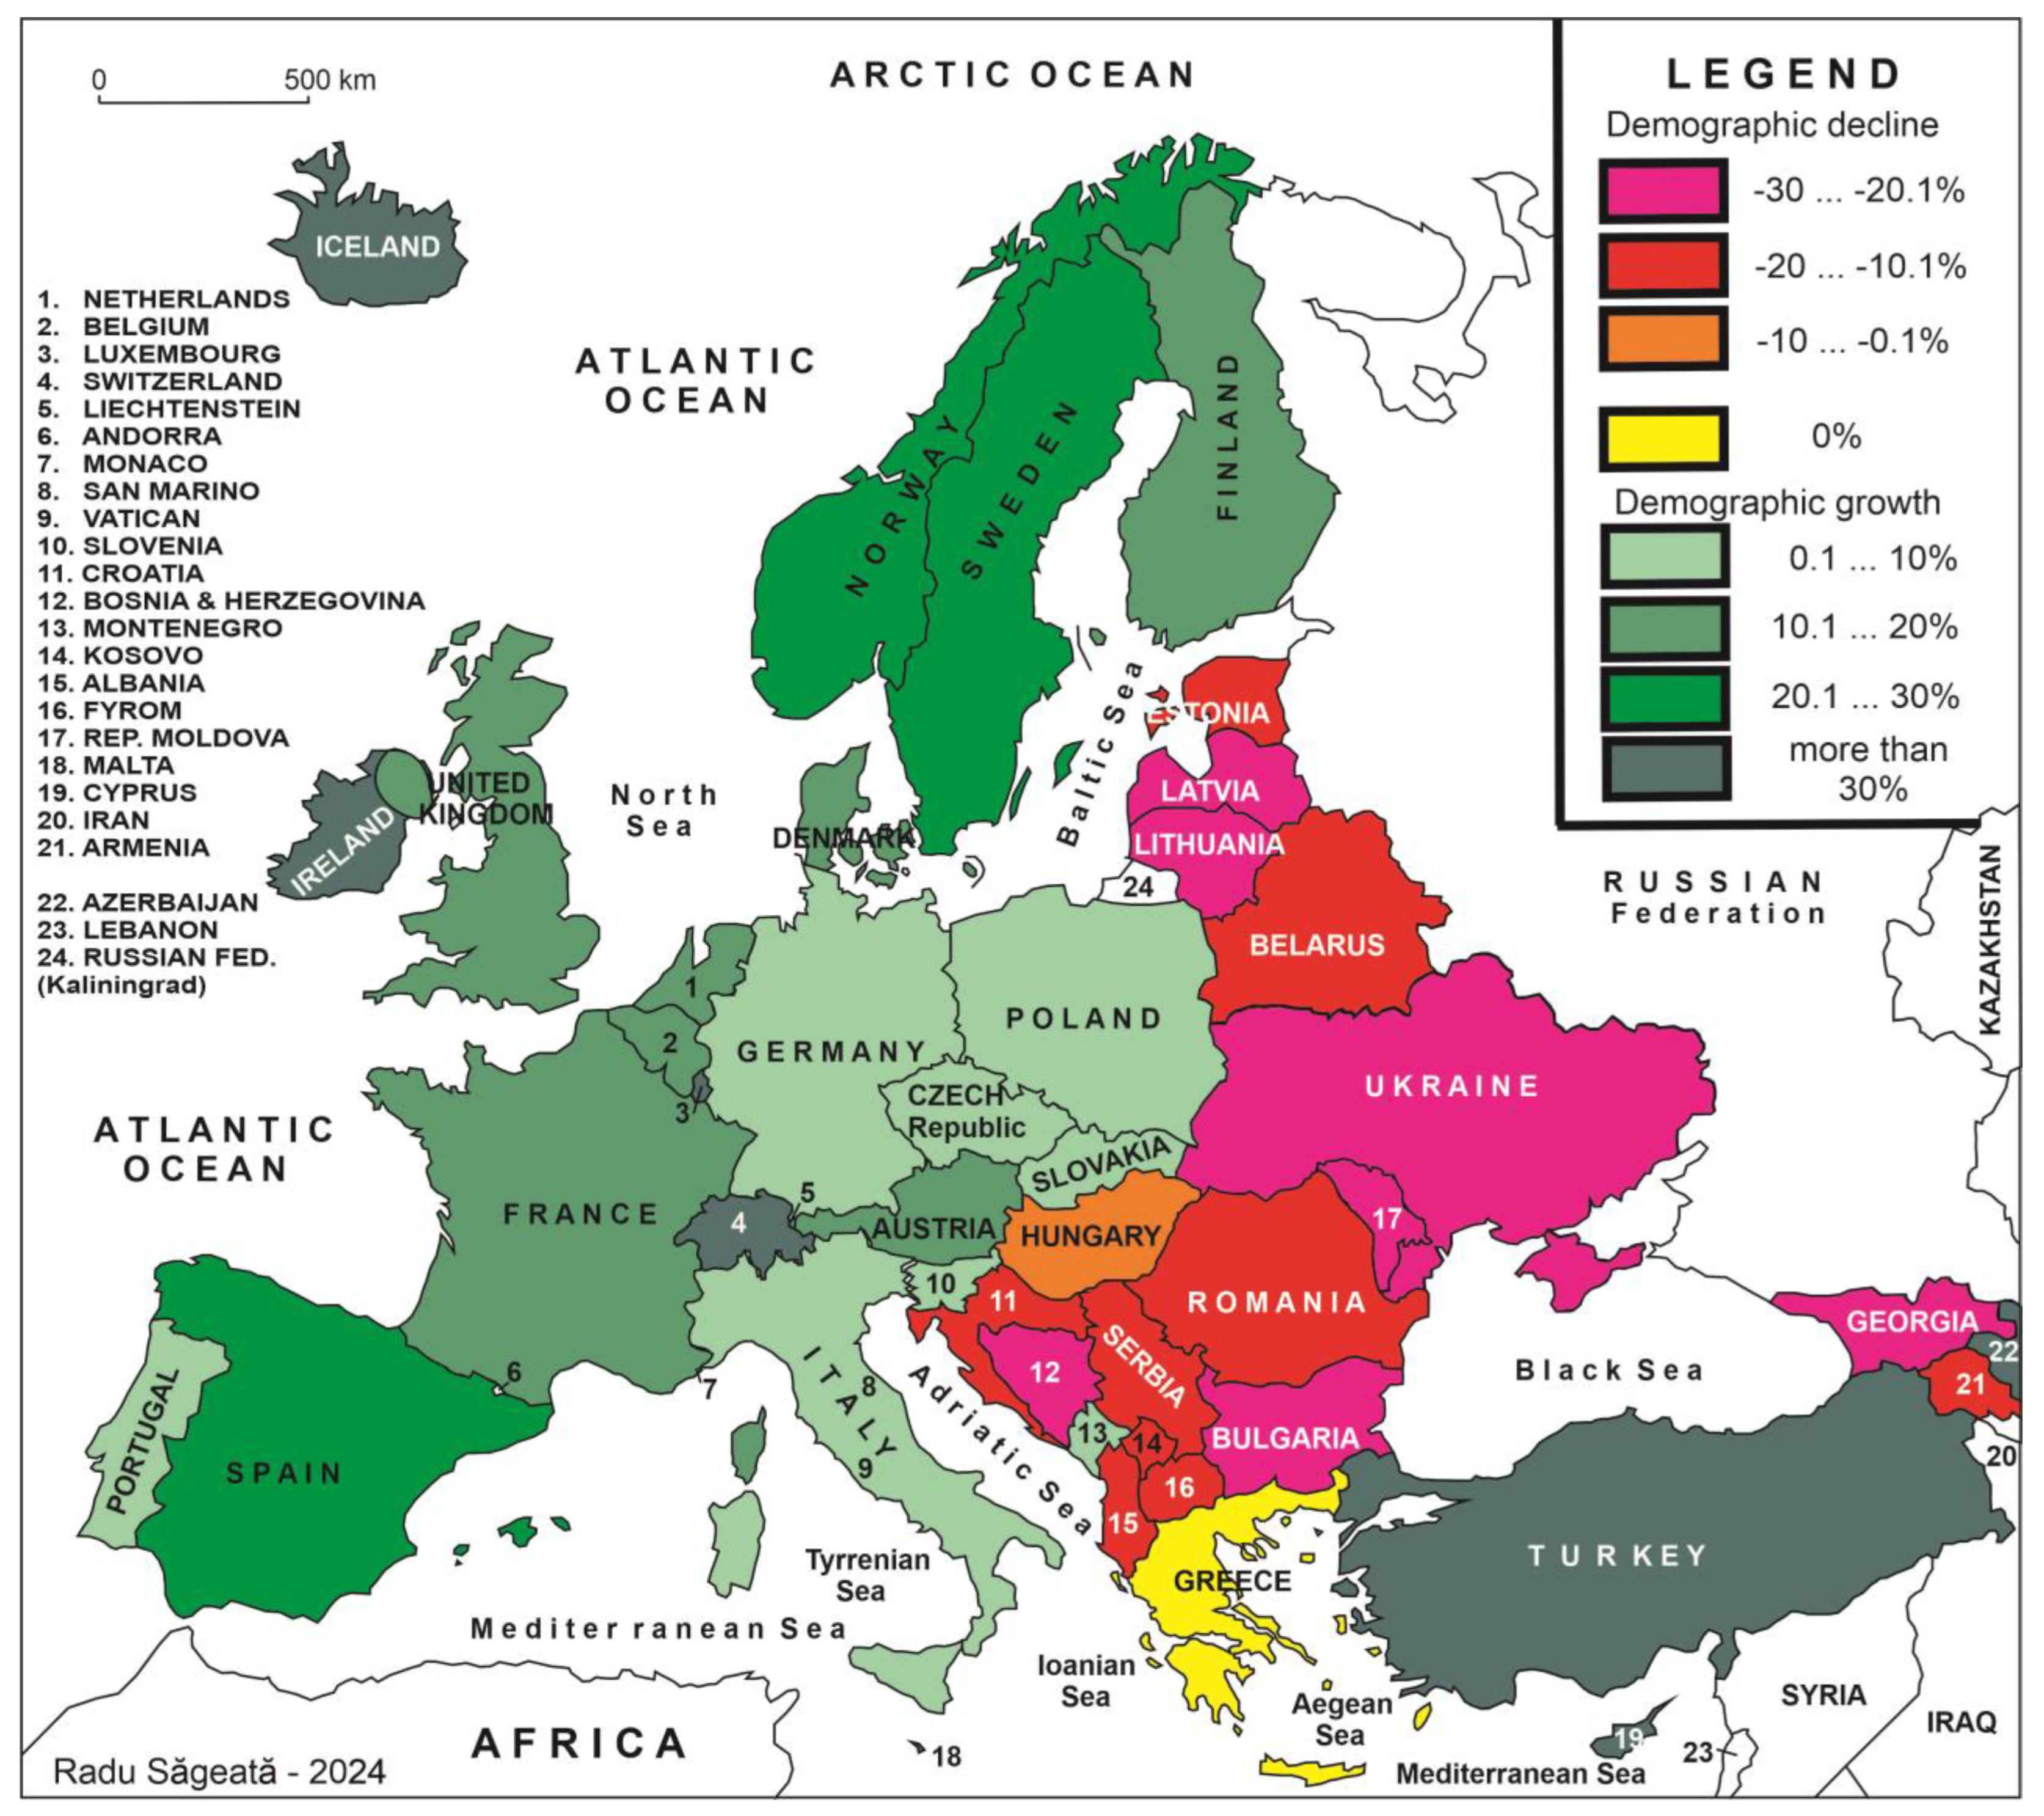
3.1. Romania’s Population Dynamics in a European and Regional Context

An analysis of the demographic evolution of the European continent over the last three decades (1990–2023) marked by the collapse of the bipolar geopolitical system and the generalization of globalizing flows [1] highlights a Central-Eastern Europe characterized by demographic decline, in contrast to Central-Western Europe, which is characterized by an upward demographic evolution (Figure 2).
In this general context, negative externalities are found in states that belonged to the former Soviet and Yugoslav spaces, characterized by heterogeneous ethnic structures, in which the collapse of legislative constraints generated, on the one hand, migratory flows of return of allochthonous communities to their states of origin against the background of policies of reorientation towards national values, and on the other hand, migrations with an economic substrate due to the gaps between the east and west of the continent. Added to these were the flows of refugees generated by armed conflicts due to territorial claims against the backdrop of relict borders arbitrarily drawn during the period of totalitarianism and the resulting ethnic minority communities. This is the situation of the Republic of Moldova, a state belonging to the Romanian ethnic bloc that recorded the largest demographic losses in Europe during the analyzed period (−31% of the population) as a result of a combination of factors: reduced natural growth and demographic aging; migration for work to Romania and Western European countries, the tense situation in Transnistria; Georgia (−30% of the population) (return of ethnic Russians to the Russian Federation and the conflicts in Abkhazia and South Ossetia); Latvia (−23%) (departure of Russians, emigration with an economic substratum); Bosnia and Herzegovina (−28%) (economic emigration, armed conflict with an ethnic-confessional substratum, 1992–1995); Bulgaria and Lithuania (−23% in both situations) (predominantly economic emigration), followed by Croatia (−19% of the population); Romania and Armenia (−17% in both cases); Serbia and Albania (−14%); Estonia (−13%), the losses being due to emigration as a labor force. Thus, between 2007 and 2017 alone, 3.4 million Romanian citizens (17% of the total population) left to work abroad, most of them settled permanently in their adopted countries. The main causes of these departures are poverty, corruption and legislation that overtaxes work (in Romania, 43% of salaries are withheld by the state in the form of taxes, compared to 32.6%, the EU average) [45].
At the opposite pole, the largest demographic increases characterized by the states in the west and north-west of the continent (Iceland, 52%; Ireland, 48%; followed by Norway, 30%), against the background of emigration flows and policies to stimulate the birth rate, but also Turkey (population growth by 56%) against the background of a demographic behavior marked by Islamic cultural traditions, this state surpassing Germany in population and becoming the most populous state in the ”Wider Europe” (By the concept of “Wider Europe”, we designated the states geographically bordering Europe that share the European value system and aspirations to join the EU (Turkey; the states on the southern slope of the Caucasus-Armenia, Azerbaijan and Georgia, and Israel, respectively)). To these are added a series of mini-states with spectacular demographic developments due to emigration flows and reduced population (Luxembourg, 74%; Cyprus, 71%; Andorra, 54%; San Marino, 44%, etc.).
Future forecasts indicate that these contrasts will deepen. A forecast published by [29] places the Republic of Moldova in first place in the demographic decline (with a dramatic population decrease of 53.84%, from 4,021,000 in 2020 to only 1,856,000 in 2100), followed by two Balkan states (Bulgaria −50.5% and Bosnia and Herzegovina −48.9%) and Romania (−43.2%).
Forecasts for Romania, based on the average evolution of fertility, suggest a sharp decrease in population over the next 80 years, by about 43%, from 19,053,815 inhabitants at the 2021 census to only 10,700,000 inhabitants. By comparison, at the peak of the demographic maximum reached in 1989, this country had 23.2 million inhabitants [29]. At the regional level, however, demographic dynamics register significant differences.

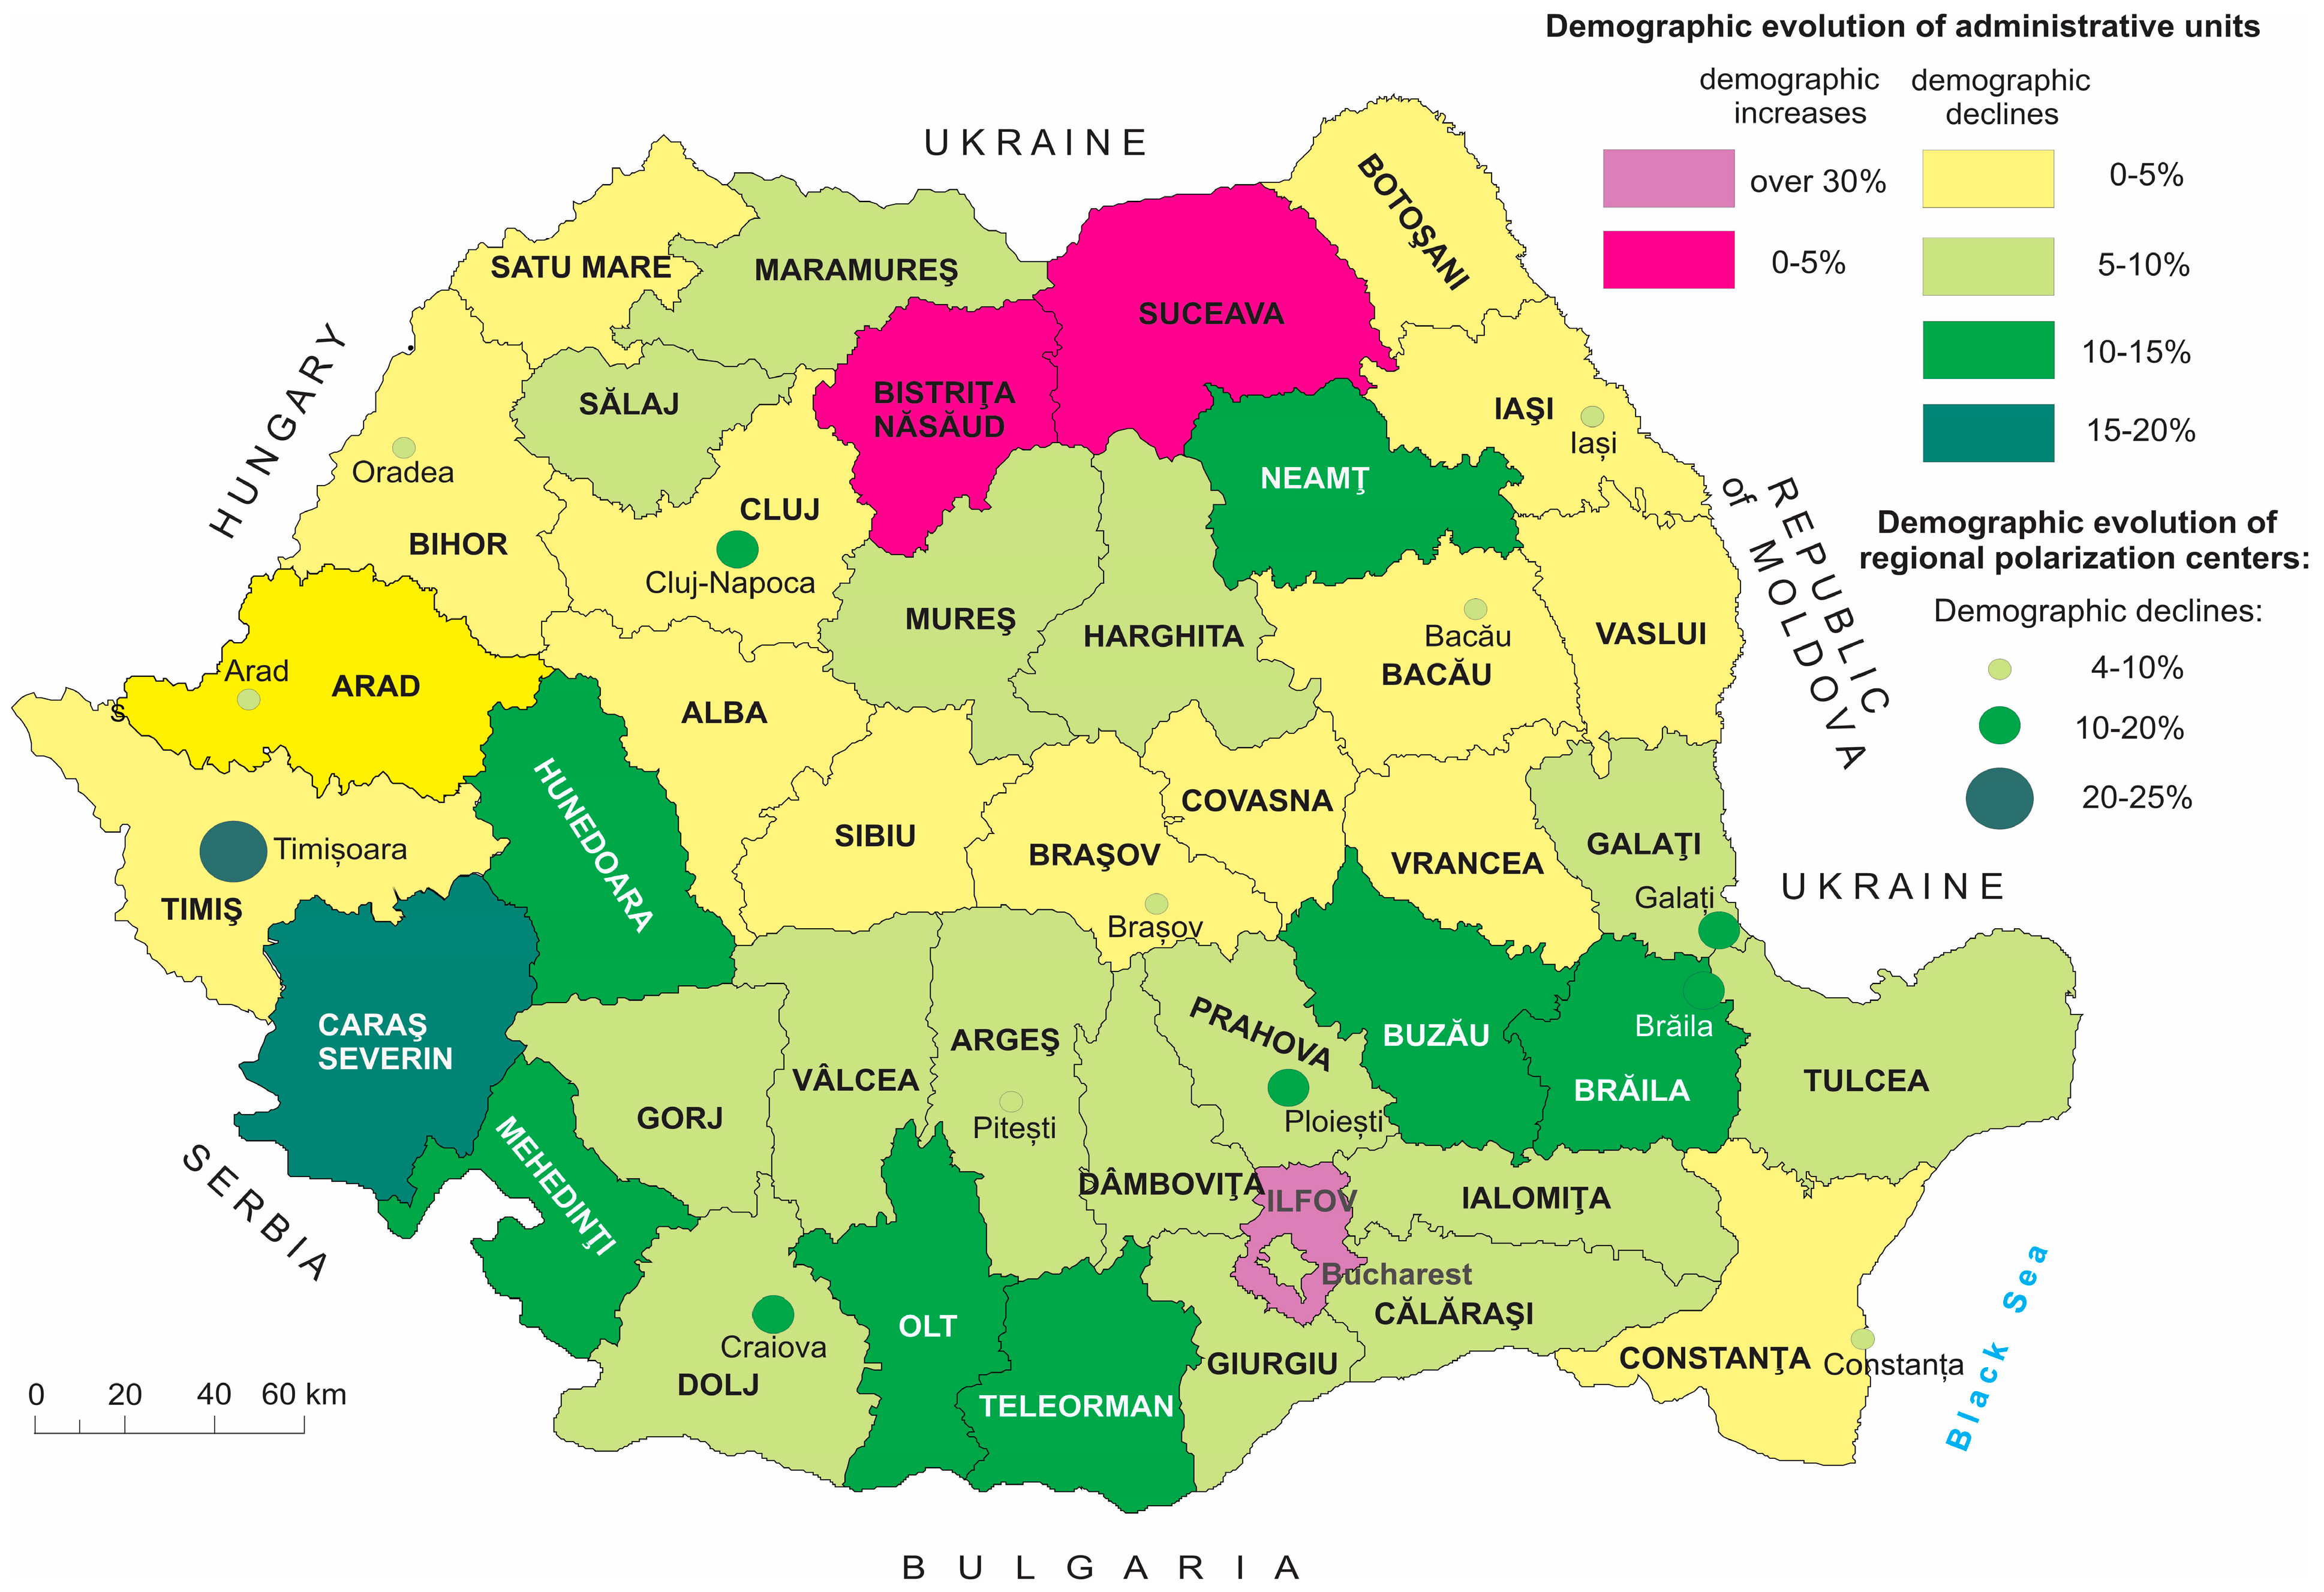
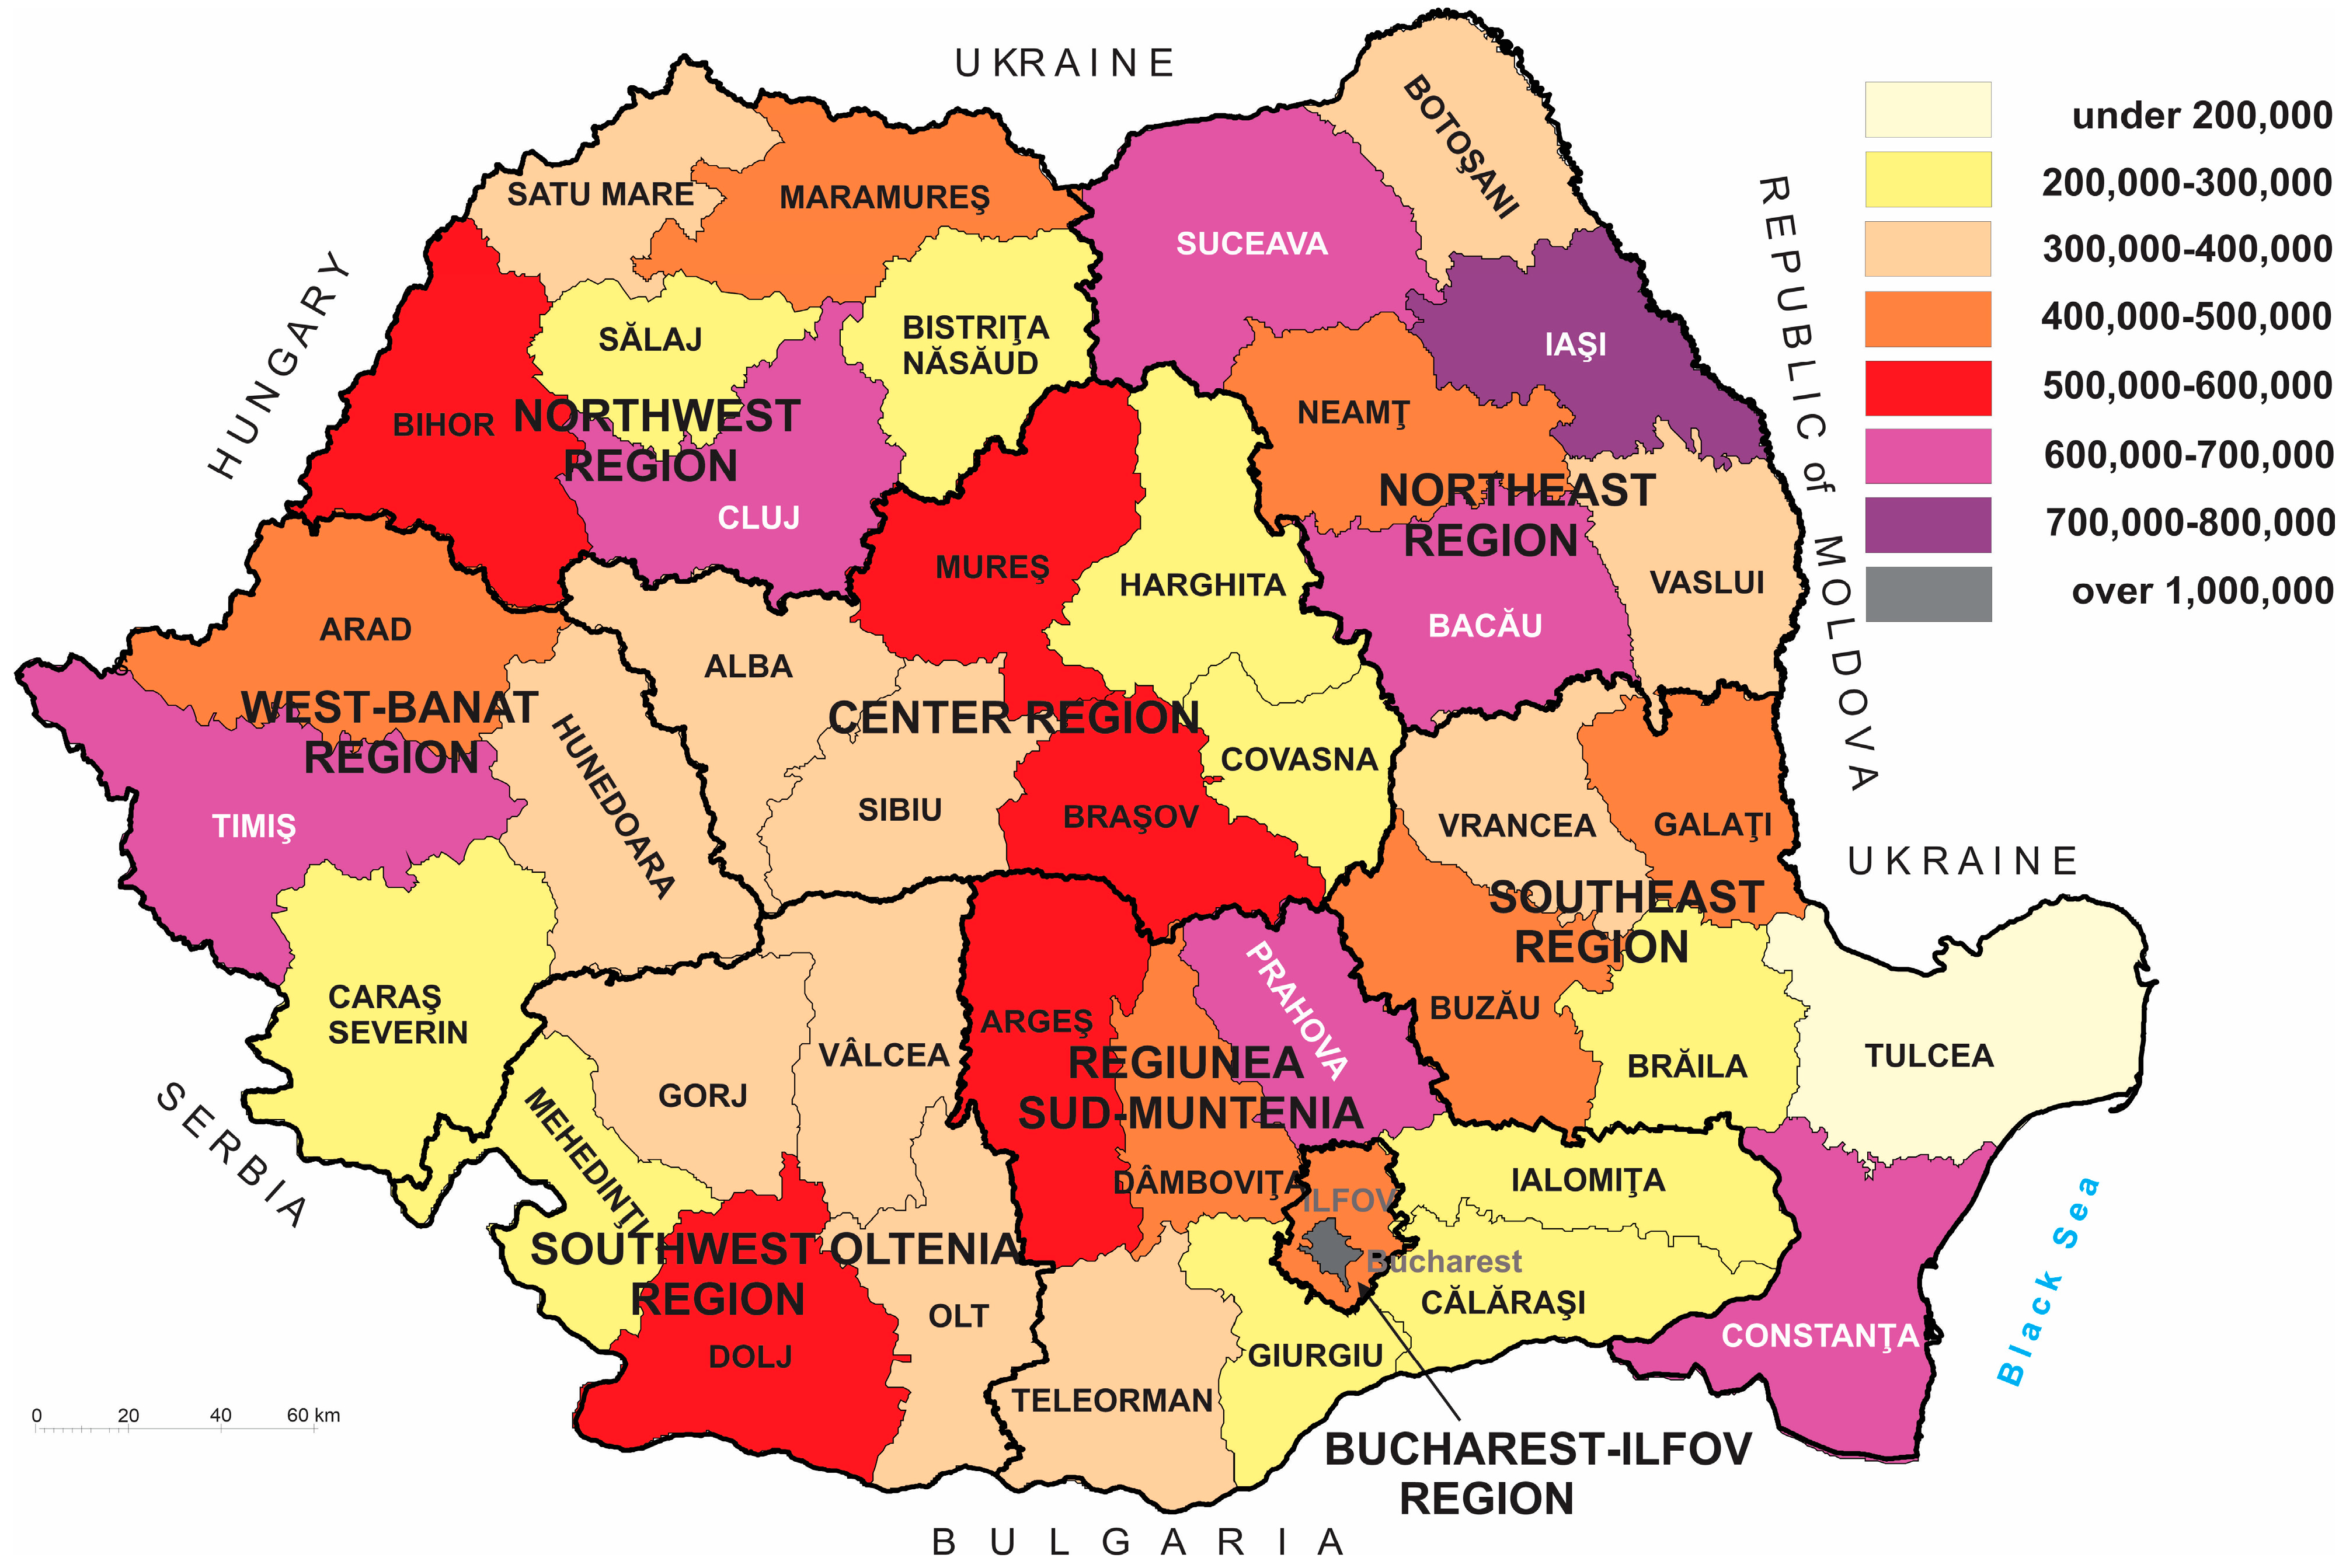
3.2. Depopulation and Demographic Increases in Romania: Regional Differences

The 2021 census data highlighted obvious regional differences in Romania’s demographic dynamics. Against a general background characterized by a sharp and constant decrease in the population, as a result of the accumulation of natural and migratory dynamics, three administrative-territorial units with population increases stand out: Ilfov (34.86%), Bistrița-Năsăud (3.3%) and Suceava (1.2%) counties. If in the first case, the demographic growth is due to the migration of the urban functions of the capital to the urban and metropolitan spaces, where bedroom-type settlements have developed, the situation of Bistrița-Năsăud and Suceava counties is totally different; they occupy a relatively peripheral position nationally, at a great distance from urban metropolises with a regional polarization function (Cluj-Napoca, Iași, Timișoara, etc.) (Figure 3).
The positive dynamics of these counties are due precisely to this externality, as they themselves turn into nuclei of regional development by the return of many of those who went to work abroad because of the economic decline in the adoptive countries (Italy, Spain, France, Germany, the United Kingdom, etc.) generated by the Coronavirus pandemic.
From the point of view of the demographic evolution in the territorial profile, at the level of the administrative units in Romania, in the period 2011–2021, six classes of evolution can be distinguished, registered in two typologies (Figure 3):
A. Demographic increases: (1) over 30%: Ilfov county (34.86%); between 0 and 5%: the counties of Bistrita-Năsăud (3.3%) and Suceava (1.2%).
B. Demographic decreases: (3) between 0 and 5%: the counties of Brașov (−0.47%), Vrancea (−1.47%), Iași (−1.5%), Cluj (−1.73%), Bacău (−2.4%), Botoșani (−2.87%), Satu Mare (−3.97%), Constanta (−4.11%), Bihor (−4.18%), Vaslui (−4.74%), Arad (−4.76%), Alba and Covasna (−4.8%), and Timiș (−4.82%), respectively; 4) between 5 and 10%: the counties of Sălaj (−5.42%), Maramureș (−5.47%), Mureș (−5.93%), Harghita (−6.8%), Giurgiu (−6.88%), Argeș (−6.94%), Galati (−7.32%), Călărași (−7.57%), Dâmbovița (−7.58%), Gorj (−7.88%), Vâlcea (−8.03%), Ialomița (−8.51%), Bucharest Municipality (−8.83%), and the counties of Prahova (−8.88%), Dolj (−9.25%) and Tulcea (−9.26%), respectively; (5) between 10 and 15%: the counties of Buzău (−10.22%), Neamț (−10.48%), Mehedinți (−11.7%), Olt (−12.17%), Brăila (−12, 37%), Hunedoara (−13.6%) and Teleorman (−14.89%); (6) between 15 and 20%, a category of which only Caraș-Severin county is a part (−16.57%).
The south of Romania, including Muntenia (with the exception of the peri-urban area of the capital—Ilfov county), Oltenia and the south of Banat, is characterized by the largest population decreases, against the background of massive emigrations as a result of the reduced possibilities of occupational diversification, in the context of an economy based largely on an agriculture lacking competitiveness and faced more and more frequently with weather-climatic hazards. Added to these are counties such as Hunedoara, Caraș-Severin or Neamț, faced with strong emigration flows as a result of the reconversion of some traditional economic activities (mining, steel industry and machine construction, chemical industry), which generated unemployment [46,47]. At the opposite pole, lower population decreases were recorded in the counties in the west of the country, more attractive from the point of view of the location of new investments, and those in Moldova, characterized by a high natural growth, which partly compensated for the migratory deficit. A particular case is the counties with large urban centers, with the function of regional polarization (Cluj, Timiș, Iași, Dolj, Constanța and Brașov) also attractive for investment, which has registered a strong development of the peri-urban areas of these cities.
Large cities in their totality recorded demographic decreases ranging between 21.4% (Timișoara) and 5.7% (Bacău) (Table 1) mainly due to urban-peri-urban migrations, in the conditions of the often chaotic development of the built stock and infrastructure in peri-urban localities. Municipalities such as Chiajna, Dobroeși, Pantelimon, Ștefăneștii de Jos, Corbeanca or Tunari in the peri-urban area of the Romanian capital; Florești, Apahida or Feleacu from the Cluj-Napoca peri-urban area; Dumbrăvița, Giroc or Moșnița Nouă in the peri-urban area of Timișoara or Miroslava near Iași have doubled or even tripled their population over the last decade, despite the decrease in the population of the polarizing urban core. The phenomenon is not new, but has been amplified since the 1990s through the migration of some urban functions (new housing complexes, warehouses, large shopping centers) to peri-urban spaces against the background of the decline of agricultural activities and the lower price of land [48].
The demographic evolution of the last decade, statistically recorded through the 2011 and 2021 census data, also generated changes in the demographic size of the administrative-territorial units in Romania. These vary between 1,716,983 inhabitants (Bucharest municipality) and 193,355 inhabitants (Tulcea county), with a ratio of 1:8.88. The hypertrophy of the capital in relation to the second most populated administrative-territorial unit (Iași County) is 1:2.25.
The differences in demographic size between the administrative-territorial units of Romania allowed the individualization of eight categories (Figure 4): (1) under 200,000 inhabitants, a category of which only Tulcea county is a part; (2) between 200,000 and 300,000 inhabitants: Bistrita-Năsăud, Brăila, Caraș-Severin, Călărași, Covasna, Giurgiu, Harghita, Ialomița, Mehedinți and Sălaj counties; (3) between 300,000 and 400,000 inhabitants: Alba, Botoșani, Gorj, Hunedoara, Olt, Satu Mare, Sibiu, Teleorman, Vaslui, Vâlcea and Vrancea counties; (4) between 400,000 and 500,000 inhabitants: Arad, Buzău, Dolj, Galați, Ilfov, Maramureș and Neamț counties; (5) between 500,000 and 600,000 inhabitants: Argeș, Bihor, Brașov, Dolj and Mureș counties; (6) between 600,000 and 700,000 inhabitants: the counties of Bacău, Cluj, Constanța, Prahova, Suceava and Timiș; (7) between 700,000 and 800,000 inhabitants, a category of which only the county of Iasi is a part and (8) over 1,000,000 inhabitants—the municipality of Bucharest (Figure 4).
In this sense, the major share of large urban nuclei in the total population of the administrative-territorial units of which they are a part is obvious; the most populated counties being those that have large cities as their residences (counties such as Iași, Timiș, Cluj, Constanța, Brașov, Dolj) or well-developed urban systems (counties such as Prahova, Suceava or Mureș).

3.3. Case Studies Analysis

3.3.1. Some Conceptual Delimitation with Particularization in Romania

In Romanian geographical literature, the concept of peri-urban area designates an area located on the outskirts of a city that is affected by profound demographic and socio-economic transformations as a result of its reciprocal relations with the city [49,50]. This is usually included in the metropolitan area, which is defined in Romanian legislation as an area established by association, based on voluntary partnership, between large urban centers (the capital and I-st-rank municipalities (Romanian legislation includes the following urban centers, regional metropolises, in the category of rank I municipalities: Bacău, Brașov, Brăila, Cluj-Napoca, Constanța, Craiova, Galați, Iași, Oradea, Ploiești and Timișoara. The capital is considered a rank 0 urban locality [36])) and urban and rural localities located in the immediate area, at distances of up to 30 km, between which cooperative relations have developed on multiple levels [36].
The migration of urban functions (residential, commercial or industrial) to the suburban [51] but also beyond these, in the peri-urban rural areas, generates profound changes in the landscape by reducing agricultural and forest areas and green spaces in favor of built-up areas [52]. Peri-urbanization, therefore, in Romania, and also in other Central and Eastern European states (Germany, Poland, Czech Republic, Hungary, Russian Federation), is characterized by a recent residential character (in most cases, after 1990), concomitant with insufficient development of the technical–urban infrastructure, communications and services [53]. Added to this is the prevalence of commuting migrations in relation to urban cores. Their intensity is directly proportional to the size of the urban center and the extension of urban influence areas in the territory, and to the intensity of the connections between the city and its area of influence, respectively [54].
Based on these considerations, the case studies analyzed will be limited to the peri-urban crowns where the influence of urban cores is strongest and where significant exurbation phenomena have been recorded. Thus, depending on the demographic size and the degree of polarization, 10 UATs were selected for the peri-urban crown of the capital, and between 4 and 6 UATs for the peri-urban crowns of the four regional metropolises (Cluj-Napoca, Timișoara, Iași and Constanța).
These also include green belts, defined as areas delimited around the capital and first-rank municipalities, in order to protect elements of the natural environment, prevent the uncontrolled expansion of these municipalities and provide additional spaces for leisure and recreation [36]. However, in most cases, both the capital and the regional metropolises analyzed constitute contiguous built areas between the peripheral neighborhoods in the urban area and those located in the bordering peri-urban area (peri-urban crowns). Green belts aim to improve the urban microclimate by reducing pollutants, thus contributing to increasing the quality of urban life standards [55]. Other functions are also added to these: forests, productive plantations, orchards, cemeteries, conservation of historical and archaeological sites, etc.
Recreation areas consist of green spaces located in peri-urban areas and include natural elements of particular attraction (forests, rivers, lakes, rocks, etc.), accessible to visitors, which have a complex of facilities necessary, especially for weekend rest and recreation [50,56]. In the areas analyzed, the most common recreational areas are of the forest park type, arranged from forests in which some ornamental and floricultural dendrological species are introduced and access routes (roads, alleys) and facilities of a utilitarian and service nature (public catering units, sports and leisure grounds, facilities for short-term rest, etc.).
Green areas in the peri-urban areas of large urban centers tend to compensate for the deficit of green spaces in their urban areas, one of the major problems affecting the quality of life in Romanian cities in the context of the intensification of phenomena generated by pollution and global warming. Thus, if the European Union standards provide for a minimum of 26 m2 of green spaces/inhabitant, and the World Health Organization recommends a minimum of 50 m2/inhabitant, many cities in Romania, especially those located in plain areas, have below this value (Bucharest, Constanța, Pitești, Giurgiu, Vaslui, Râmnicu-Vâlcea, Focșani) (according to data provided by the National Environmental Guard, 2022) or in its vicinity (Cluj-Napoca, Iași, Oradea) (Table 2).
Another problem is the inaccurate or erroneous reporting by local administrations, given that many cities do not have the Green Space Register, a mandatory document according to Romanian legislation [37,40,41]. Thus, according to checks carried out by the National Environmental Guard (2022), out of a sample of 184 cities checked, 46 did not have this document, and 58 had not updated it [58]. Under these conditions, there are obvious discrepancies between the data reported by local administrations and those resulting from the checks of the National Environmental Guard. For the capital alone, the Environmental Guard reported 8 m2 of green space/inhabitant, and the Court of Auditors 9.86 m2/inhabitant [59], while local authorities calculated 23.21 m2/inhabitant, because they also considered private green spaces [60]. By comparison, capitals in central and northern Europe have over 80 m2 of green spaces/person (Vienna 120 m2/person, Helsinki 100 m2/person, Stockholm 86 m2/person.). In Romania, only Brașov, a city favored by its geographical position in a depression area, has a green space area comparable to these capitals (118.54 m2 of green space/person.) [57]. However, Brașov, due to its industrial area, is among the most polluted cities in Romania [59].

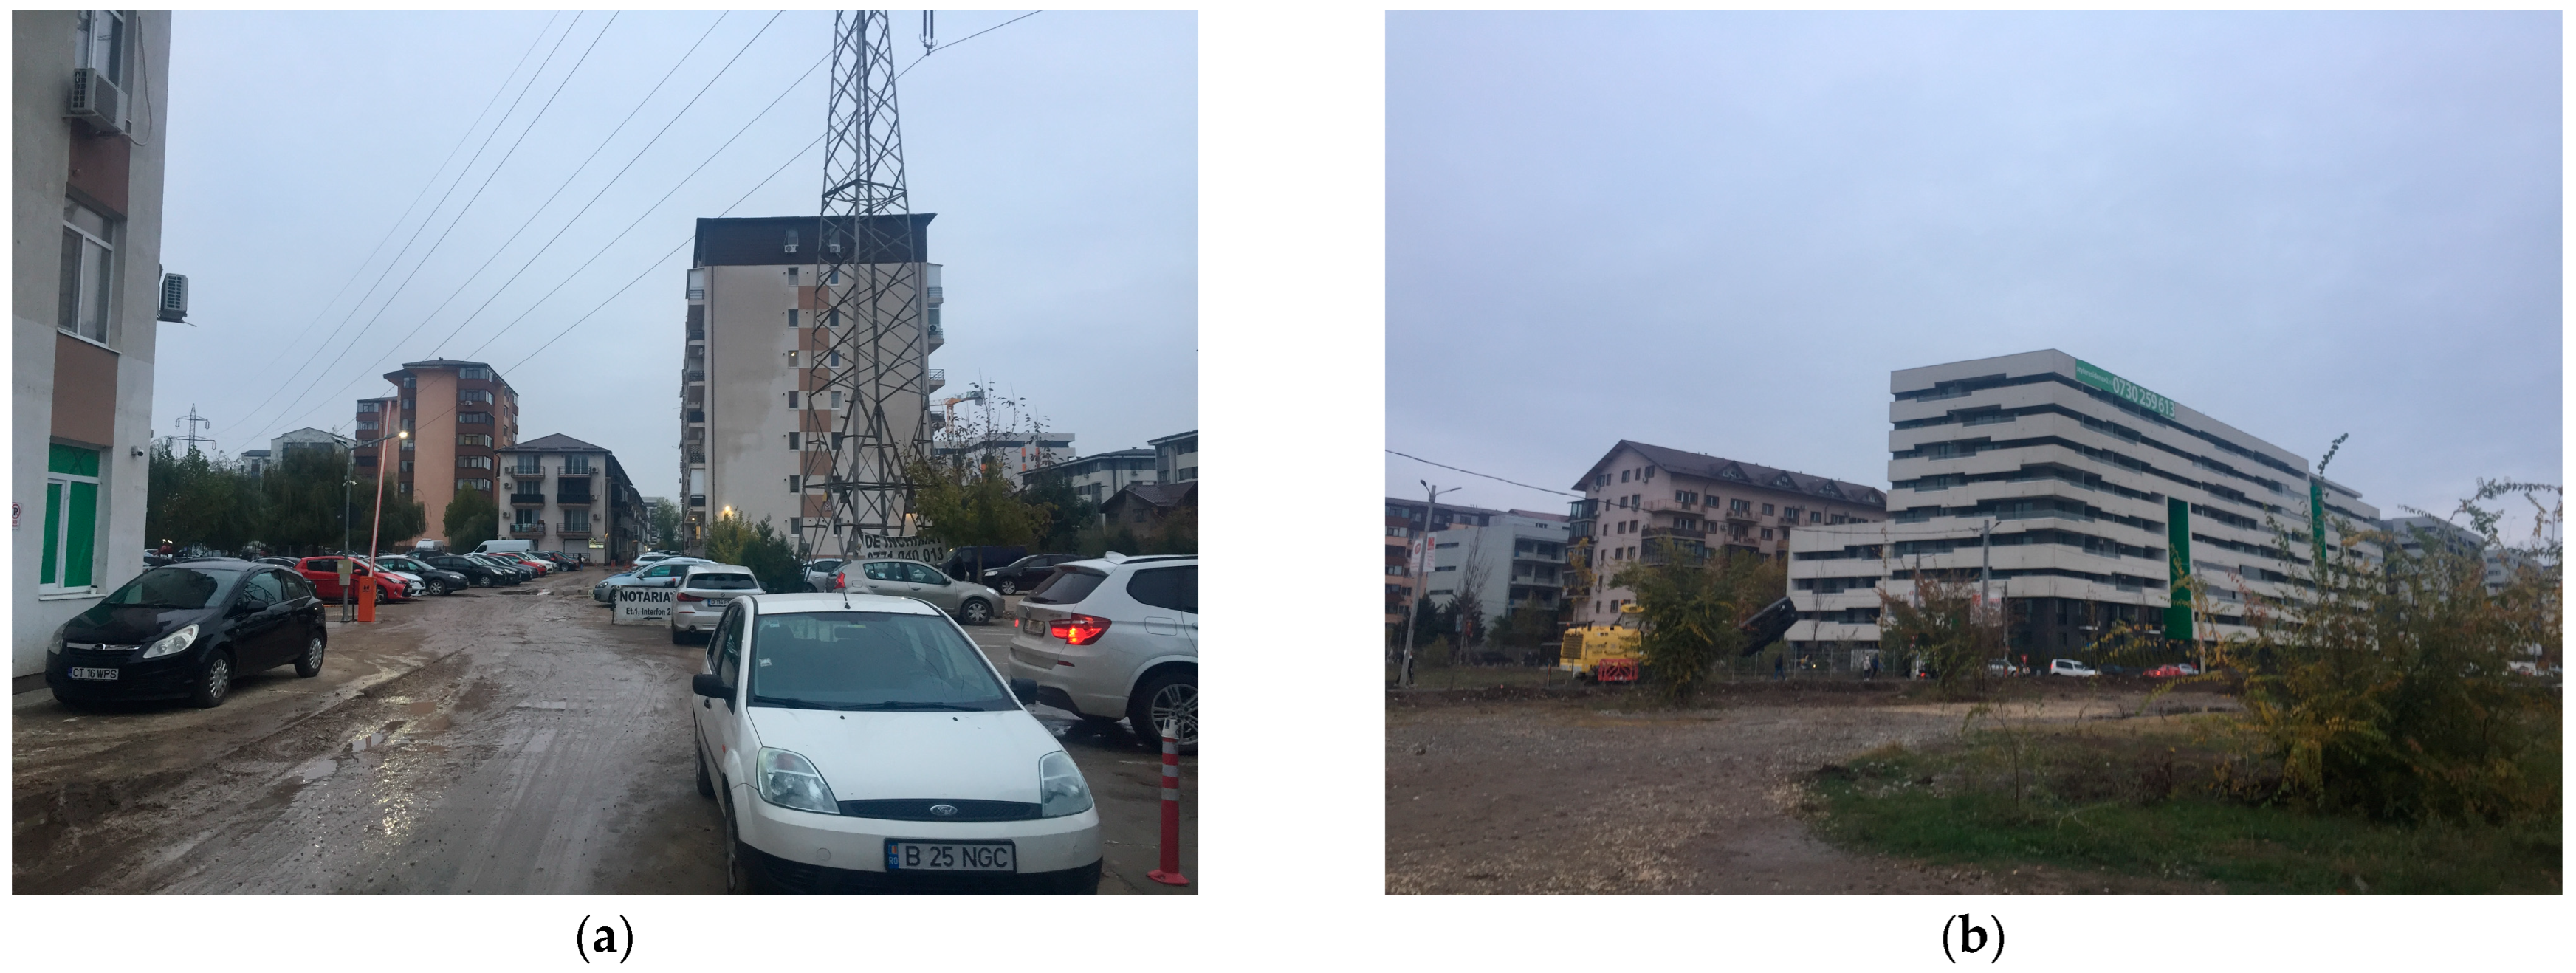
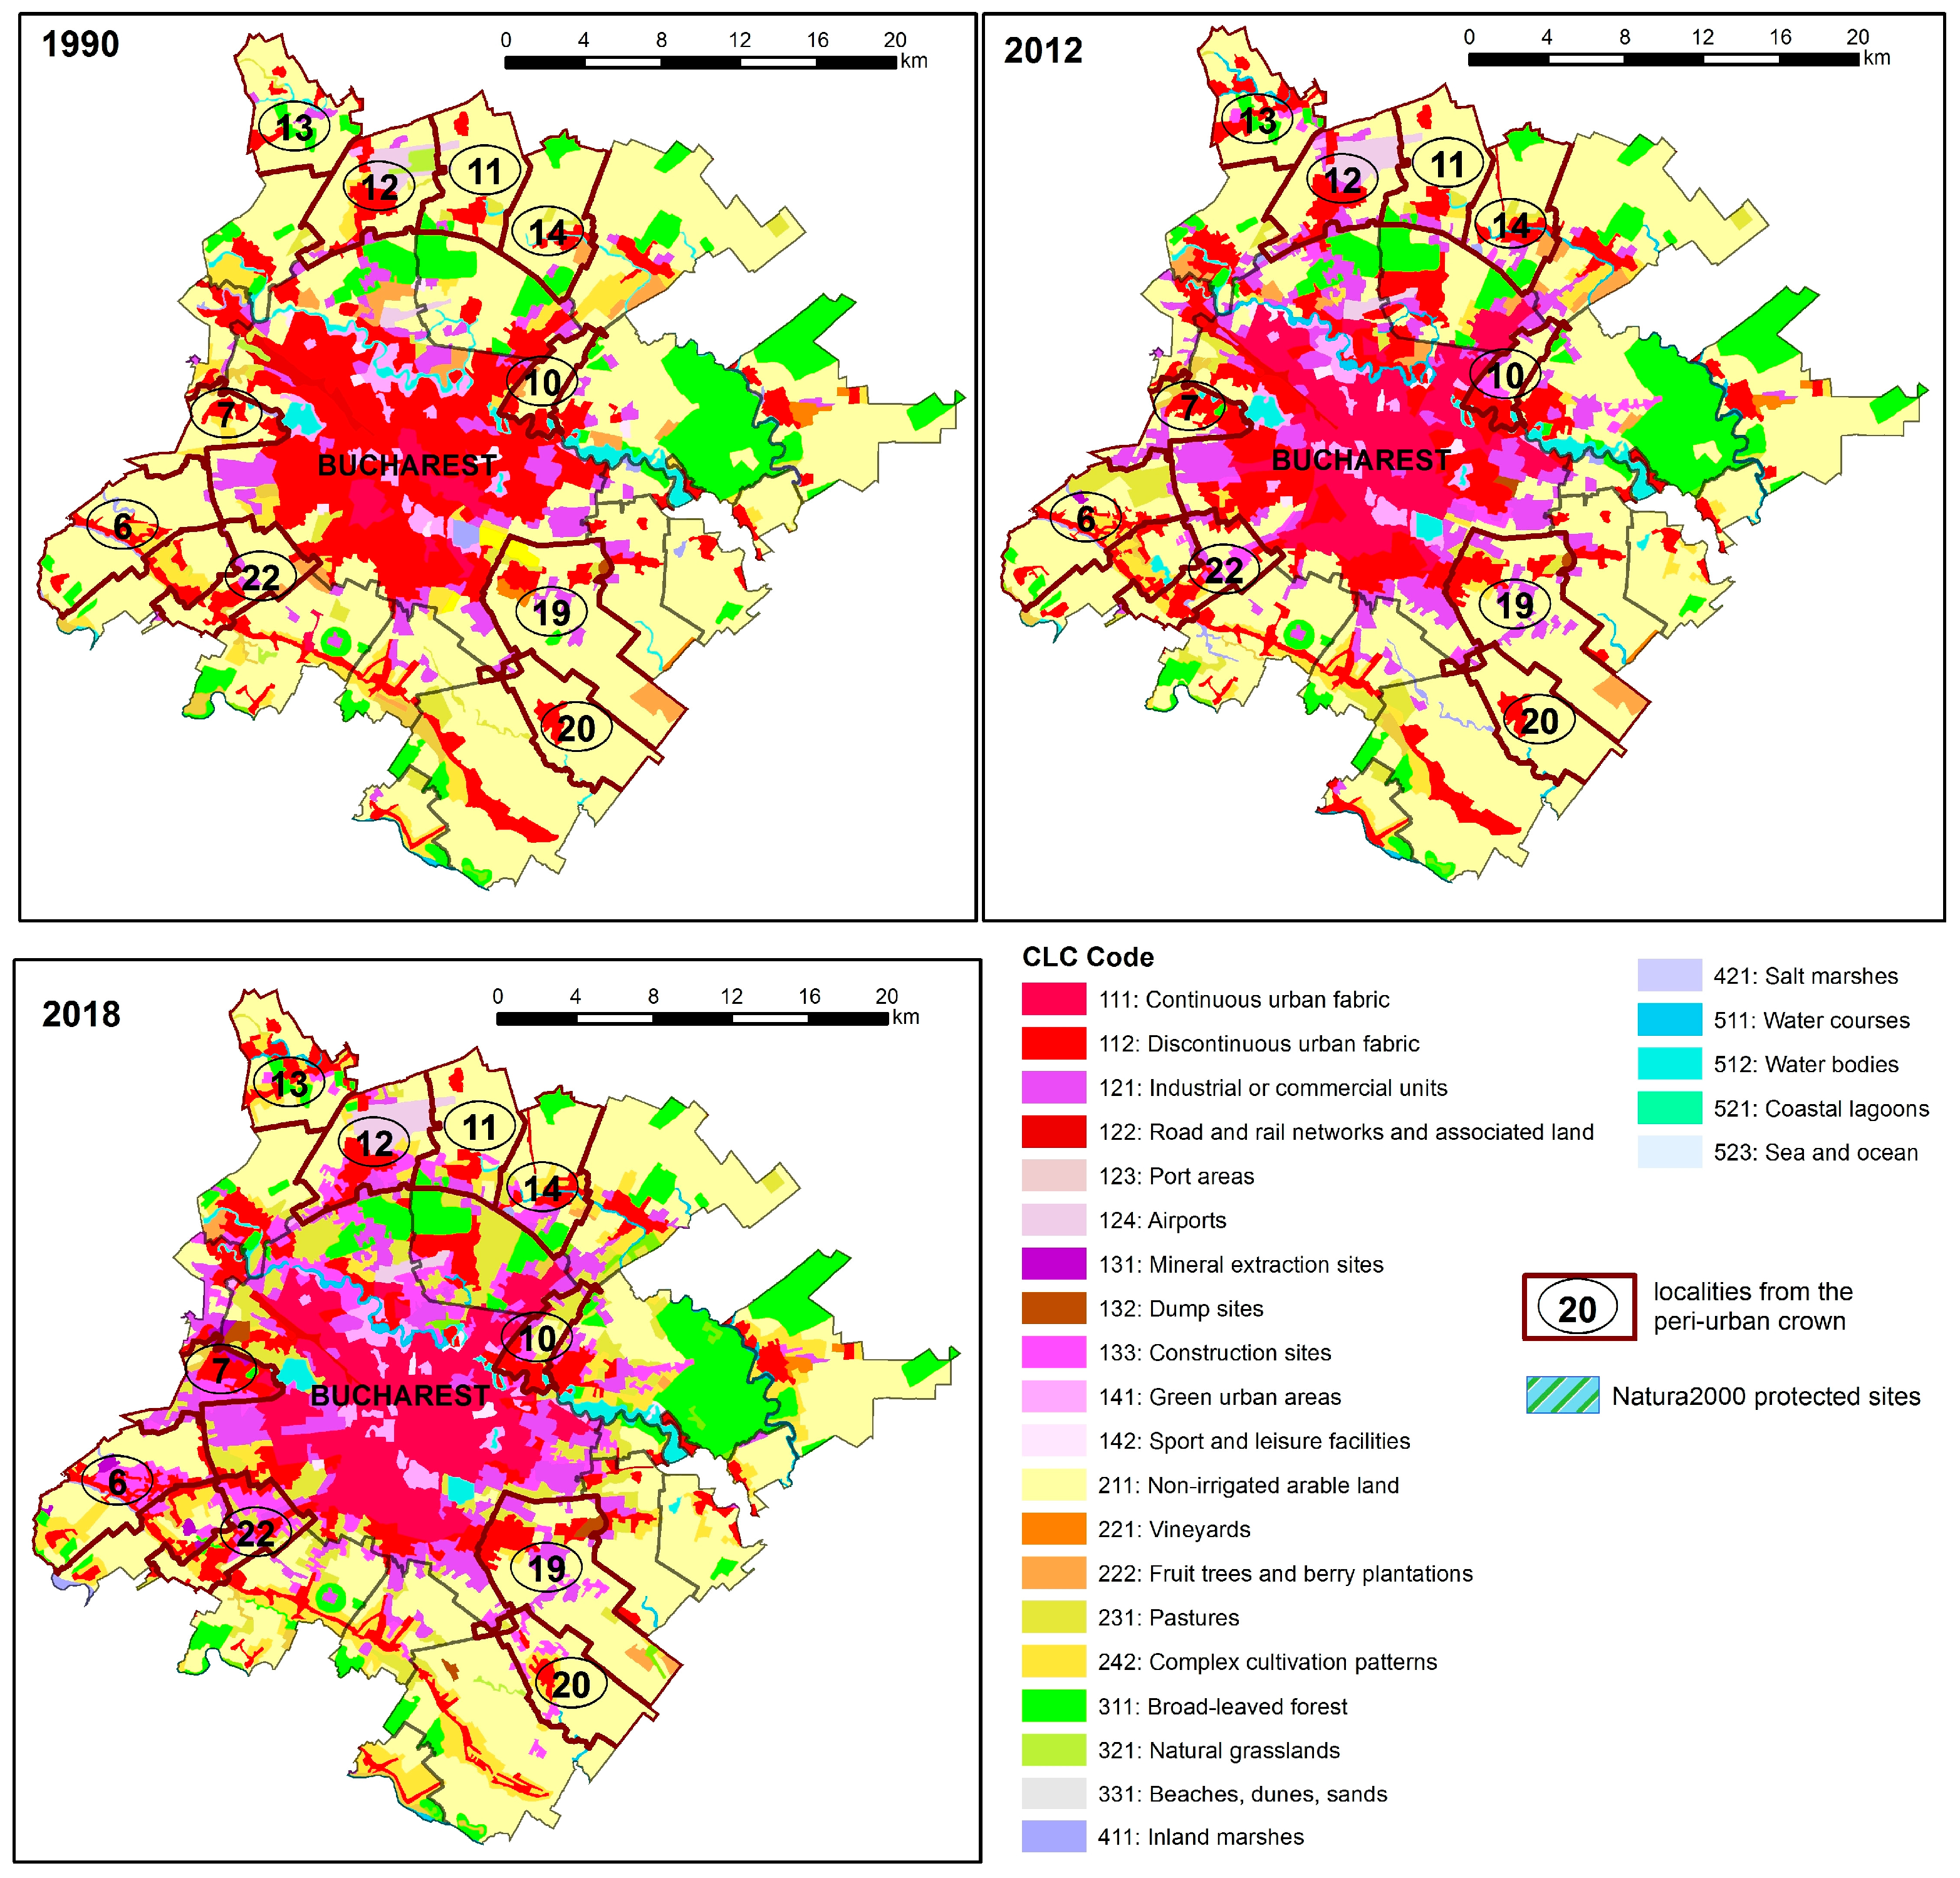
3.3.2. Bucharest and Its Peri-Urban Crown

Romania is part of the category of states in which the capital is strongly hypertrophied in relation to the city located on the second rank in the national urban hierarchy (the hypertrophy index Ih being 5.99), surpassed in Central Europe only by Hungary, where the Ih is 8.43. In the absence of an intermediate urban level between the capital and the main regional metropolises (places 2 to 5 in the national urban hierarchy) (Table 1), selected here as case studies, there is also a considerable difference between their polarization areas. This is the reason why the peri-urban crowns of the selected cities, where the most pronounced exurbation phenomena are, vary between 10 and 4 UATs (Bucharest and Constanta, respectively).
The 10 ATUs included in the peri-urban crown of the capital (Table 3) total over 290 km2, larger than the area of the polarizing urban core (240 km2). From a demographic point of view, however, profound contrasts are recorded, with the population of the urban crown being about 8 times smaller than that of the capital. Also, the demographic dynamics analyzed during the interval between the last two censuses in Romania (2011–2021) indicate different trajectories: while the population of the capital decreased by 8.8%, that of the analyzed peri-urban sample doubled, with increases being recorded in all ATUs with percentages ranging between 205.7% and 48.1%. This evolutionary trend is also proven on a larger scale: the population of Ilfov County increased by almost 40%, with demographic increases being recorded in 38 of the 40 UATs that make up this county [6,7].
The migratory contribution was achieved through three paths: short-distance migrations from the capital to the peri-urban area (the peri-urban residence being most often a secondary residence); medium-distance migrations (from the country to the peri-urban area of the capital-migrations for work or studies) and long-distance migrations (migrants from the former Soviet space or South Asia—especially migrations for work). Thus, the population of communes such as Ștefăneștii de Jos, Dobroești, Tunari, Corbeanca or cities such as Popești-Leordeni or Bragadiru doubled in a decade, or even tripled (in the case of Chiajna commune).
Accordingly, there were increases in the built stock both in the urban area (by 22.9%), and especially in the bordering peri-urban crown with weights varying between 70.4% and 540.6%. This results in an increase in the number of dwellings over 9 times higher in the peri-urban crown compared to the urban core, a dynamic proportional to that of the number of inhabitants (Table 3).
The increase in the number of homes was achieved as a result of the processes of deindustrialization and tertiarization [61,62] which led to the reconversion of some industrial areas into residential and service spaces, a process also favored by the lower prices and taxes in the peri-urban countryside. Large residential complexes were thus rapidly developed at prices much more affordable than those in the built-up area. For example, the large residential complexes that administratively belong to the Chiajna commune (Figure 5a,b) were developed about 1–3 km away from the limit of the built-up area of the capital, through the purchase and consolidation by local businessmen of land areas that belonged to the communal land, in the immediate vicinity of the Militari Shopping Center commercial area in the western part of the Romanian capital, which in turn was developed on the land of former disused industrial units [63]. The development of these residential areas was favored by the economic crisis of 2008, with homes built and sold here being priced well below those built before the crisis. Also, in the eastern part of the capital, Bragadiru was another attraction for real estate developers due to its accessibility and low land prices. In the southern part of the urban area, the city of Popești-Leordeni experienced a similar dynamic favored on the one hand by low land prices resulting from the decommissioning of some industrial units, and on the other hand, by the accessibility provided by the capital’s metro network. A somewhat particular case is the city of Voluntari, where the population grew by only 10% and the housing stock by over 50%, a situation owing to its attractiveness, especially for office buildings [64], as the city is located in the proximity of a large commercial and business center integrated into the Chinatown Bucharest neighborhood.
The average price of apartments is a significant variable for analyzing the dynamics of the built stock. The average price per square meter of new homes in Bucharest, located mostly on the outskirts of the built-up area and in the urban crown adjacent to it, does not seem to be conditioned by the demographic size or the potential for polarization of the capital disproportionately compared to other regional metropolises, being below that of Cluj-Napoca, Brașov and Constanța, but above Timișoara, Iași, Sibiu, Craiova and Oradea (Table 4).
Due to the location of the Romanian capital in the middle of a plain and the good connectivity in all directions, exurbation phenomena were recorded both to the north, on the Bucharest-Ploiești axes (Otopeni, International Airport); Bucharest-Târgoviște (Mogoșoaia, Chitila); Bucharest-Urziceni (road axis continued towards Moldova, in the absence of a highway: Voluntari, Ștefăneștii de Jos); east, favored by the Bucharest-Constanța highway (Dobroești, Pantelimon); south, favored by lower land prices (about 6–7 times lower than in the northern peri-urban crown of the capital) (Popești-Leordeni, Bragadiru, Măgurele); and especially to the west, favored by the Bucharest-Pitești highway (Chiajna).
The development of the built stock in the peri-urban area of the capital led to the removal of important areas from the agricultural production circuit, a fact highlighted by comparing the land-use/land-cover datasets from 1990, 2012 and 2018 available (Figure 6). Thus, [65] documents the following forest areas in the peri-urban area bordering the capital: the Pustnicul and Cernica forests (which also include the Cernica forest park) in the eastern part of the built-up area; the Vulpache and Băneasa-Tunari forests in the north, in the administrative perimeters of Ștefăneștii de Jos and Tunari, and Râioasa and Dragomirești, respectively, in the west of the built-up area. Two decades later, Refs. [54,66] record the considerable reduction of forest areas (with over 4 ha in Băneasa-Tunari forested area; over18 ha in Corbeanca commune; over 46 ha in Popești-Leordeni commune, etc.), the main forested areas still remaining in the northern and eastern half of the peri-urban area (over 8000 ha). This results in obvious anthropogenic pressure on forest ecosystems and green areas in general, due to the amplification of exurbation processes. Most of those reductions are registered between 1990 and 2012. Based on the analysis of the land-use/land-cover datasets, it is estimated that after 1990, Bucharest lost about 1600 hectares of green space, which significantly contributes to the amplification of pollution and the increase in temperatures felt during the summer [67]. The forests in the entire Ilfov County, which make up the green belt of the capital, occupy only 16% of the county’s surface (24,000 ha), playing a major role in combating pollution and stopping heat waves.
The concept of “green zone” has been an important asset in promoting new real estate investments in the peri-urban crown of the Romanian capital, and many of the names of these residential complexes suggest the proximity of green and recreational areas: Greenfield Băneasa, Park Lake City, Green Garden, Green City Residence, Green Arcades Herăstrău, Green Place Tunari, etc.
On the other hand, real estate development, strongly amplified over the last decade, has had the effect of shrinking green areas and intensifying pollution in the capital’s green belt. Thus, research conducted by an NGO in 2021 based on sensors located inside Popești-Leordeni city (south of Bucharest) showed considerable high values for the measured indicators, this locality being among the most polluted near the capital due to real estate development (over 17,000 homes between 2010 and 2021, according to the INS statistics; the built-up area growing from 590 ha in 1990 to 1138 ha in 2012 and to over 1179 ha in 2018) (Figure 6), the proximity of a large landfill (in Glina), to which pollution was added due to the illegal burning of waste, originating mainly from car dismantling [68]. The same situation is recorded in the peri-urban crown in the north of the capital, an area recognized for its recreation and leisure function, and in the western one, both affected by rapid and often chaotic development of the built stock to the detriment of green areas. According to the green space registers compiled by local authorities, Otopeni, a city located in the north of the capital where the largest airport in Romania is located, has 16.26 m2 of green space per inhabitant, and Bragadiru, located in the peri-urban crown in the west of it, has only 12.82 m2 of green space/inhabitant.

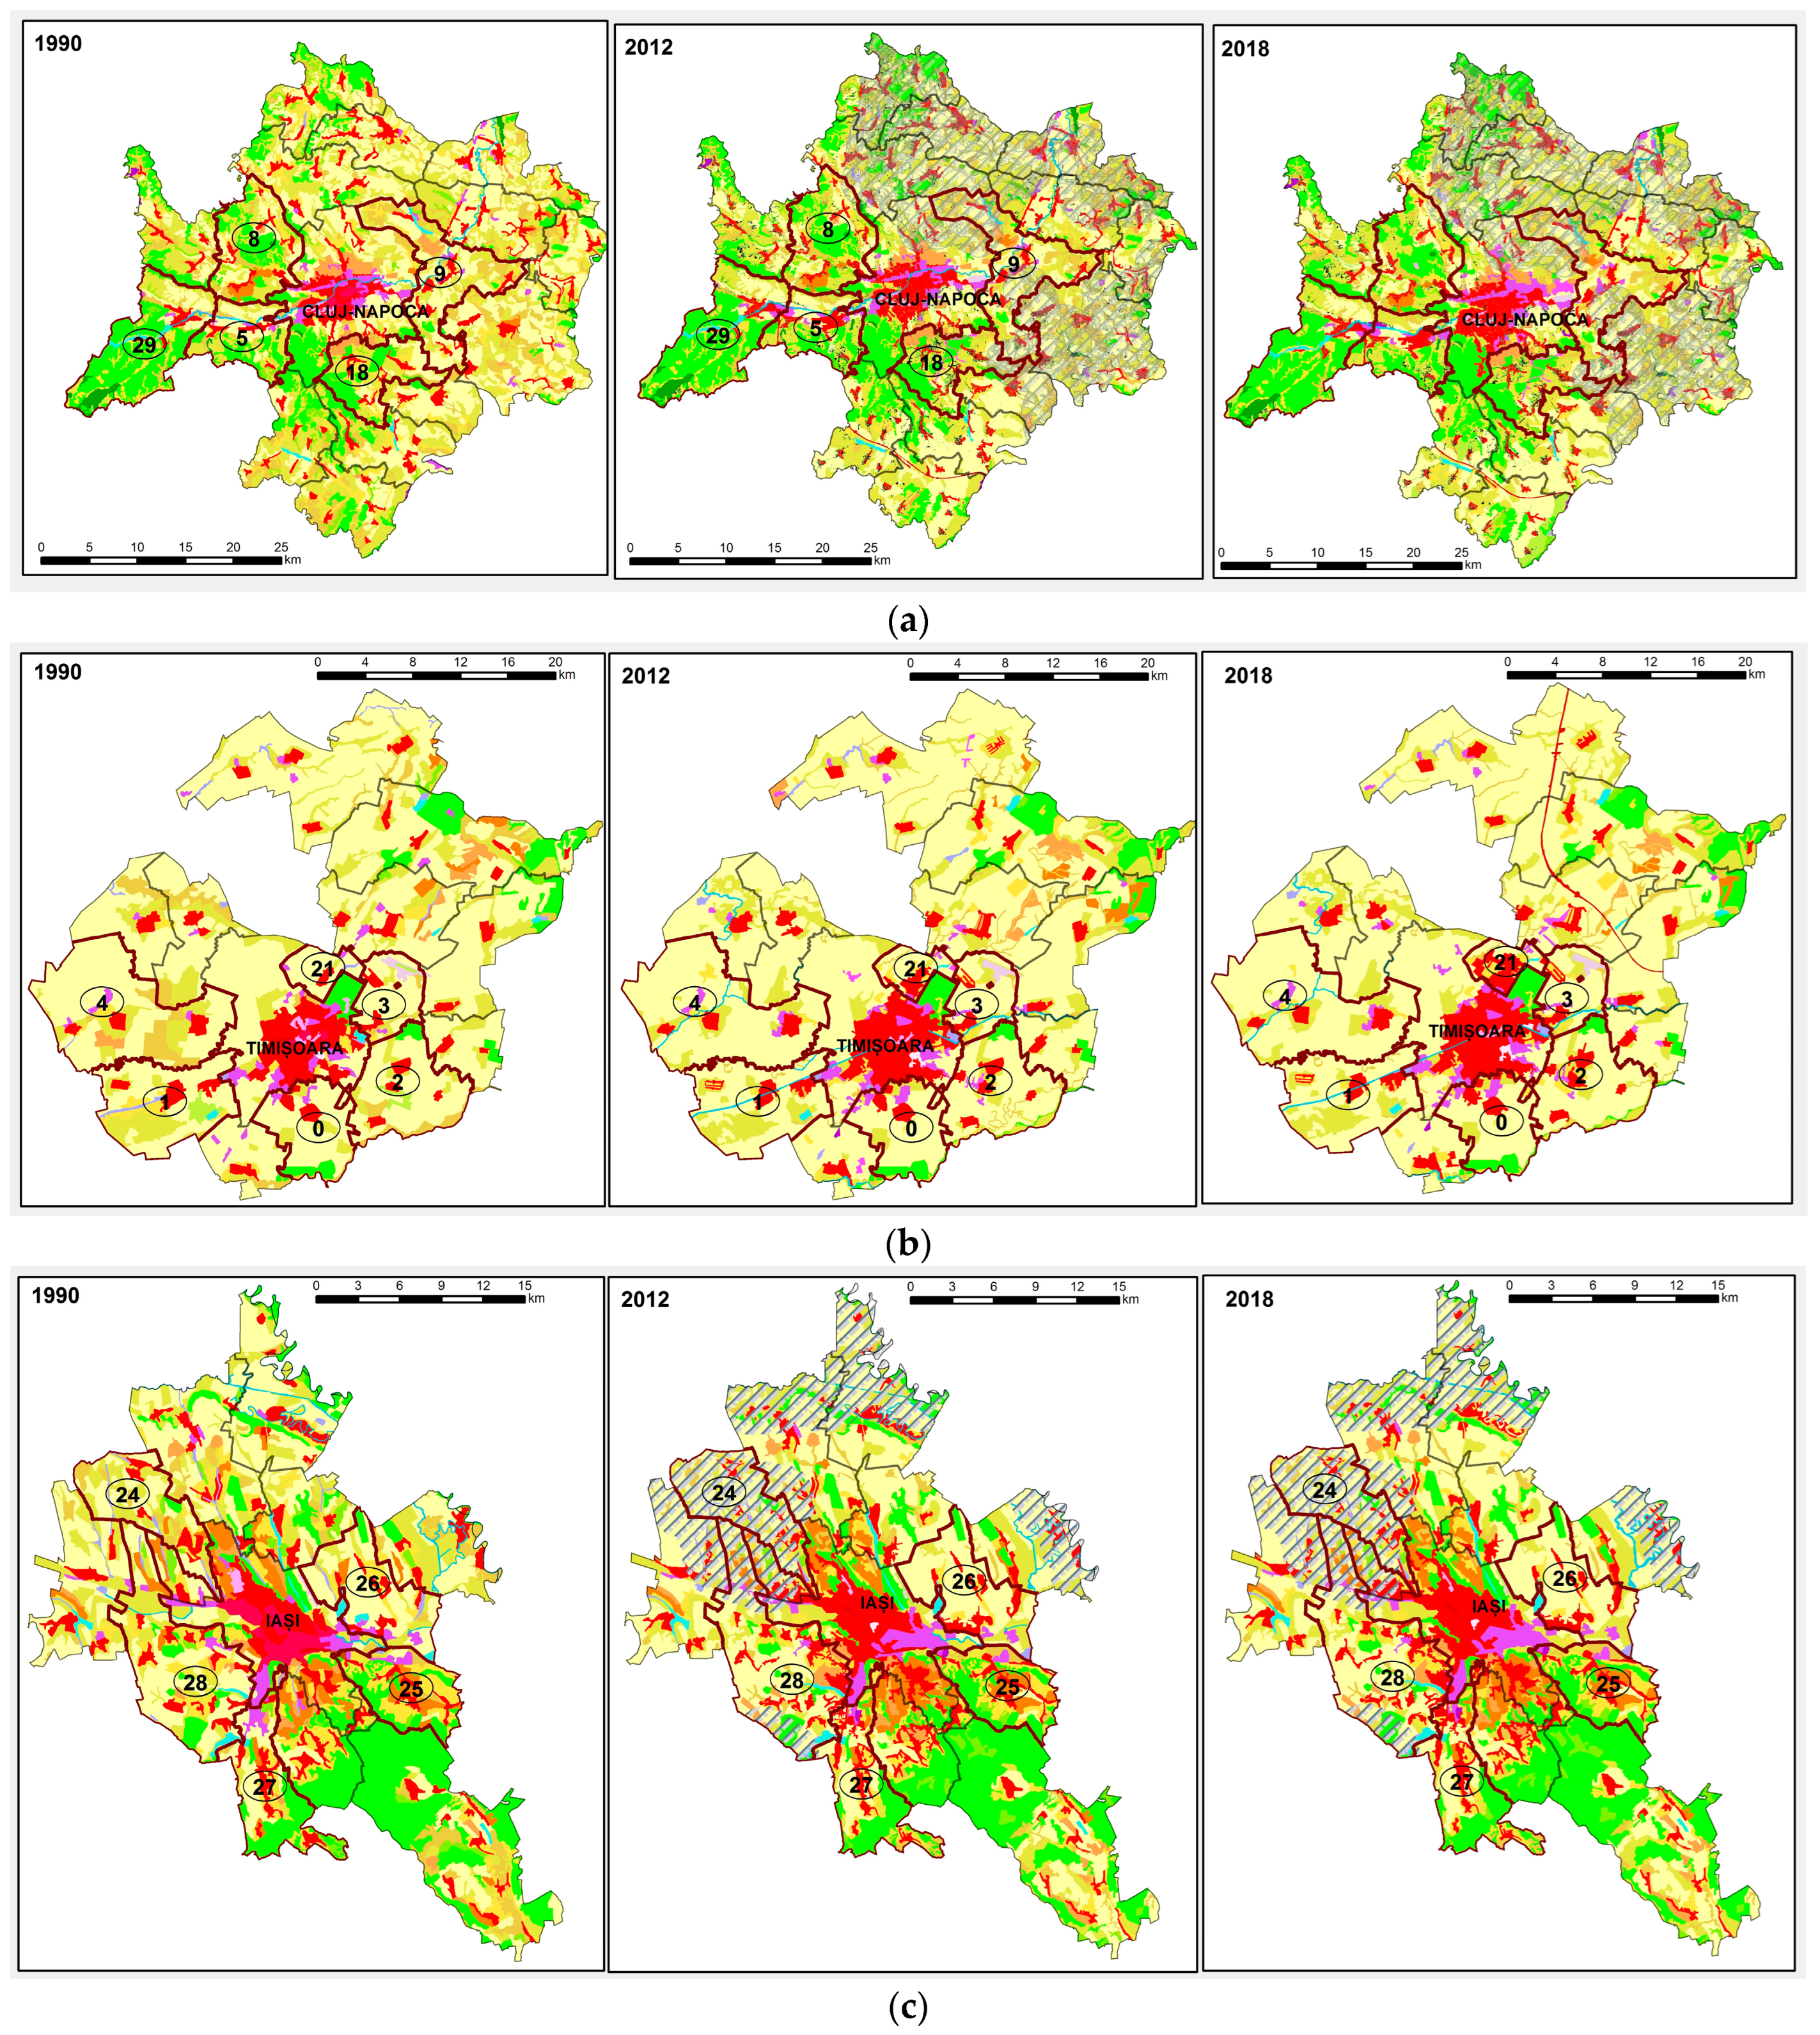
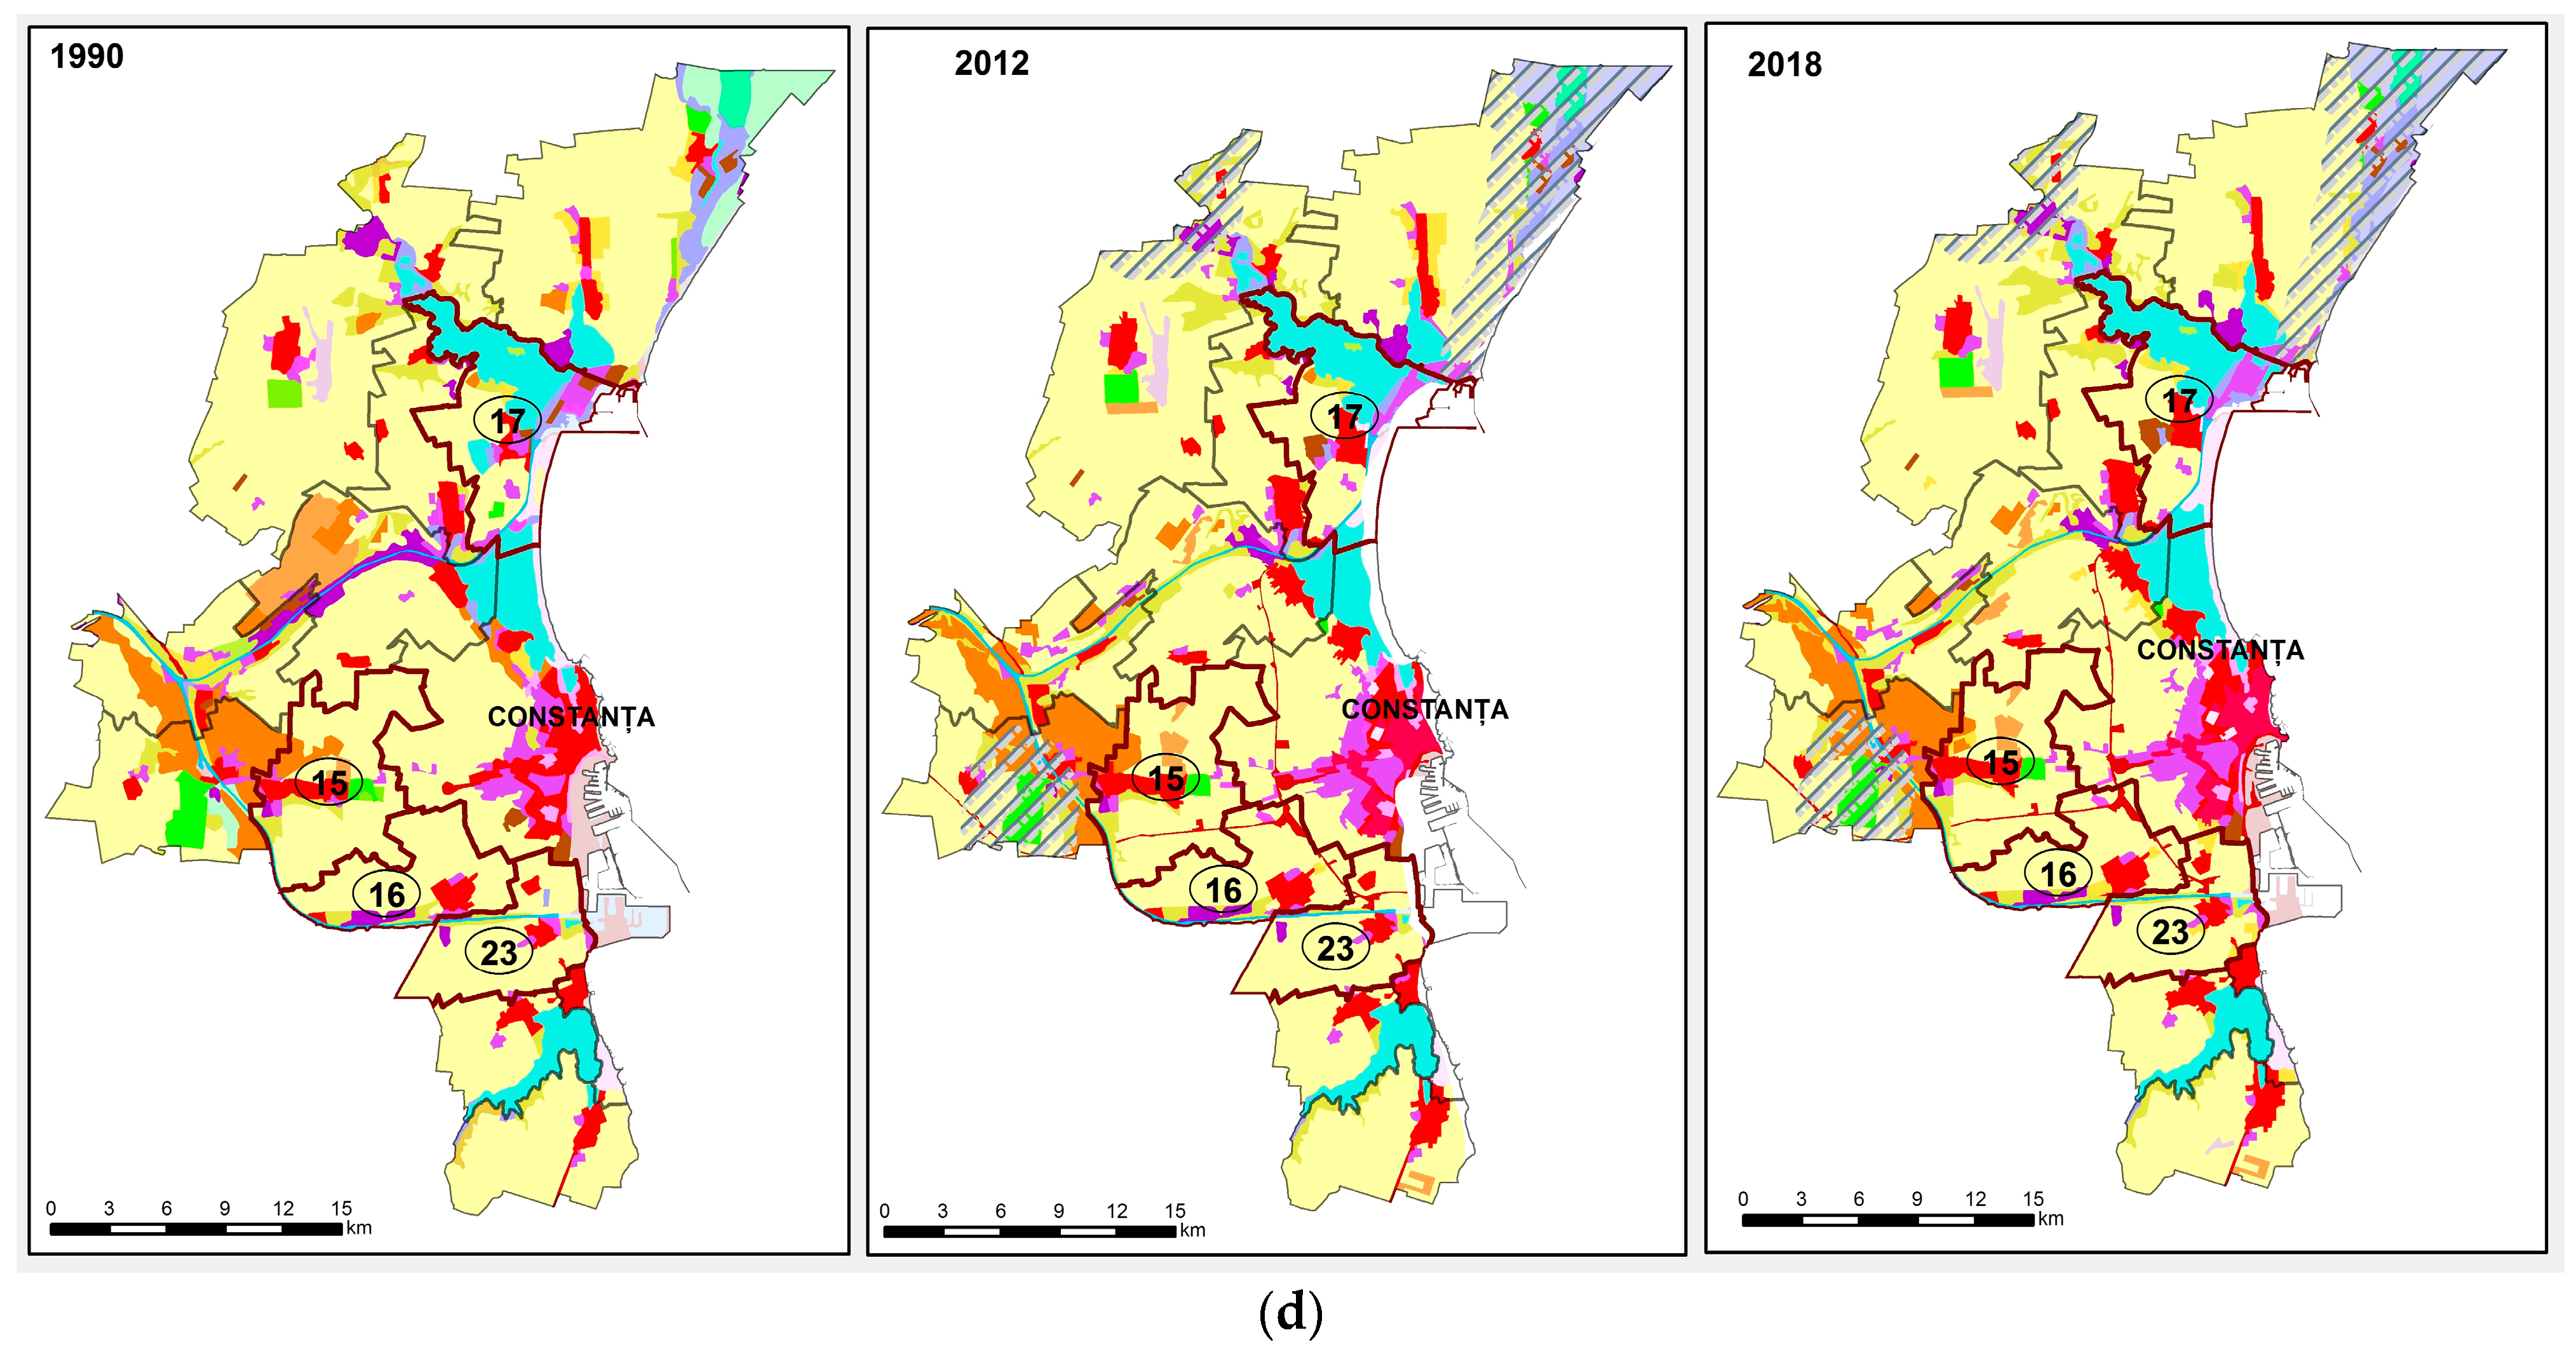
3.3.3. The Peri-Urban Crowns of the Regional Metropolises Cluj-Napoca, Timișoara, Iași and Constanța: Similar Dynamics

The four regional metropolises selected as case studies (ranked 2 to 5 in the urban hierarchy in Romania) range between 250,000 and 290,000 inhabitants, 6–7 times smaller than the capital. The peri-urban crowns in their immediate vicinity, directly subjected to exurbation processes through the pressure of urban residential functions, vary between 240 and 341 km2, being comparable in area to that of the capital (291.17 km2), but well below its demographic size (between 98,500 and 74,500 inhabitants, compared to almost 224,000 inhabitants, in the case of the peri-urban crown polarized by the capital). It follows that the intensity of the exurbation phenomena varied directly proportionally to the demographic size of the polarizing centers.
Thus, in the case of Cluj-Napoca, the largest regional metropolis in Transylvania, the urban crown analyzed has a surface area double that of the polarizing core, but a demographic size about three times smaller. Exurbanization was predominantly carried out in a western direction in the administrative territory of Florești commune (with a demographic increase of 131.2% and a 105.6% increase in the built stock), well above the average of the analyzed ATUs. There is also a correlation between the demographic evolution and that of the built stock (Table 5), with a maximum in Florești, where the built-up area doubled its size (from 469 ha in 1990 to 827 ha in 2012, up to 937 ha in 2018) (Figure 7a, locality 5), and a minimum in Baciu, where the built-up area grew from 673 ha in 1990 to just 737 ha in 2018 (Figure 7a, locality 8). In the case of the Florești commune, the increase in the size of the built space was performed at the expense of agricultural areas, which shrank by about 335 ha between 1990 and 2012, and another 100 ha between 2012 and 2018, and less at the expense of forestry areas.
Apartment prices in Cluj-Napoca are about 1000 euro/m2, higher than those in the Romanian capital [43], being the highest of all Romanian cities (Table 4) and even in some Central European capitals (Budapest, Prague, Warsaw, etc.).
Timișoara, in turn, is the main regional metropolis in western Romania and in the historical Banat region. Its demographic dynamics also registered a strong downward trend between the last two censuses (−21.4%) in contrast to that of its peri-urban crown, where the population doubled in the same time interval (Table 6). It is the regional metropolis that registered the largest demographic decline in the analyzed period, losing two places in the urban hierarchy of Romania. This situation comes from the accumulation of two factors: natural population deficit, as a result of the Banat-type demographic behavior characterized by a low birth rate (with roots in the cultural pattern of this region—family with one child, so as not to share the inheritance), and on the other hand, external emigration flows.
Exurbanization was predominantly carried out in the eastern and southern parts of the urban core (in the administrative territories of the communes of Dumbrăvița, Moșnița Nouă and Giroc) (Figure 7b), favored by the communication axes towards the interior of the country. These ATUs recorded demographic growths higher by about 50% than the average of the peri-urban crown analyzed, standing out also in terms of the growth of the built stock (185–307%, compared to the 169.5% average of the ATUs bordering the urban core).
From the point of view of territorial reconversion, new real estate and service investments are of the brownfield type [69,70] and oriented mainly in two directions: (1) on empty land, by removing high-productivity agricultural land from the productive circuit, (2) by reconverting former disused industrial areas into residential and service areas, predominantly commercial [71]. For the first direction, we can point to the Dumbrăvița commune, where over 664 ha were taken out of agricultural use, of which 425 ha were before 2012, and the rest between 2012 and 2018 (Figure 7b, locality 21). As for the second direction, we have the Ghiroda commune, where over 5 ha were transformed from a former industrial area into a commercial one in the period 1990–2012 (Figure 7b, locality 3).
Until the unification of the Romanian Principalities (1859), Iași served as the capital of Moldova, competing with the current capital, Bucharest (In the 1831 census, the last before the Union of the Romanian Principalities, Bucharest had 58,794 inhabitants and Iași 48,514 inhabitants, the hypertrophy index between the two cities being 1.21. Currently, the hypertrophy index has increased to 6.32.). During the communist period, its polarization zone was greatly diminished by the proximity and imperviousness of the Prut border. This situation was corrected after 1990, with the collapse of political–ideological barriers and the restoration of traditional ties at the level of the Romanian ethnic bloc on both banks of the Prut, but Romania’s accession to NATO (2004) and the EU (2007) imposed the need to secure its eastern border against illegal immigration flows from the ex-Soviet space, which generated insecurity at the level of the community bloc [72]. Added to this were the effects of the military conflict in Ukraine.
In this geopolitical context, the trend of increasing pressure generated by the border on the area of influence of Iași resumed, with exurbanization processes taking place predominantly westward, in the direction opposite the border (Miroslava, Rediu, Ciurea). Thus, at the level of the polarizing urban core, the population decreased by 6.4%, and in the ATUs located east of it, towards the border (Holboca, Tomești), moderate increases were recorded, and the communes of Miroslava and Rediu recorded explosive increases in both population and built stock (Table 7).
Under these conditions, the price of new apartments in Iași remains at a lower level than in the capital and other regional metropolises, the counties of the origins of migrants (Botoșani, Iași and Vaslui) being among the poorest in Romania, leaving their mark on this price evolution.
Over the last three decades, for the analyzed localities belonging to the peri-urban crown of Iași—from the land-use/land-cover point of view (Figure 7c)—the built-up area expanded over the agricultural land, abandoned orchards, pastures, heterogeneous agricultural areas and forests, but the amplitude of land-use/land-cover changes do not exceed some hundreds of hectares. For the Miroslava and Rediu communes, the existence of the Natura 2000 Sites of Community Importance (SCI) (Valea lui David-ROSCI0265; The forest and meadows of Mârzeşti-ROSCI0171; Bârca Grasslands-ROSCI0077 and the other three perimeters) restrict the land-use/land-cover changes in those protected areas.
Constanța, the main seaport in Romania and in the entire Pontic basin, owes its development to this function. It ranks fourth in the urban hierarchy of Romania, being the main polarizing nucleus in the Romanian sector of Dobrogea. However, the tourist function has imprinted certain particularities on this urban nucleus and the neighboring peri-urban settlements: simultaneously with a moderate demographic decline (lower than the analyzed regional metropolises, with the exception of Iași) (Table 1), the housing stock has developed without being supported by demographic growth, with most of the new homes being intended for hotel rental. This explains an increase of almost 70% in the number of homes in Năvodari, a city on the Black Sea, in conditions of a demographic growth of only 4.3%, with its industrial function increasingly strongly competing with the tourist one. The tourist function generated investments in the coastal ATUs (Năvodari, Agigea), while the most important demographic increases were recorded along the entrance axes to Constanța from the capital (in Valu lui Traian and Cumpăna communes) (Table 8).
The increases, both demographic and in terms of the number of homes in the settlements bordering Constanța, are lower than those recorded in the peri-urban crowns of the other regional metropolises analyzed, a situation owing to the relatively high price of land and homes, comparable to that in the capital, due to the suitability for tourist activities. The development of touristic activities has led to the reconversion of agricultural areas, abandoned pastures natural grassland, and also the bare land close to the shore into land occupied mainly by buildings intended for tourist accommodation, for leisure and sports and for commercial activities. This situation is most visible in Năvodari, where the build-up surface doubled, from 180 he in 1990 to 338 ha in 2018, and the leisure and sports facilities grew from 317 ha in 1990, to 361 ha in 2012 up to 488 ha in 2018 (Figure 7d, locality 17). In all the other three localities belonging to the peri-urban crown of Constanța, the situation is the same, but the surfaces changed were smaller (Figure 7d, localities 15, 16 and 23).
One aspect of this tourist development is the lack of surrounding green spaces, with the buildings being very close to each other, in order to make the most of the available space in terms of profit. In this context in Năvodari, the green space/inhabitant is 12.82 m2, and in the other three (Agigea, Cumpăna and Valu lui Traian), it is less than 10 m2, which is lower than the EU norm.

4. Conclusions

In the context of an overall demographic decline in Romania’s population, one of the most pronounced at the European level, affecting both areas of residence, the peri-urban areas of large cities and especially the UATs located in their proximity were the only ones that recorded positive dynamics both in terms of population and number of dwellings. In some situations, these developments were explosive (Chiajna, Bragadiru, Popești-Leordeni in the vicinity of the capital; Florești, near Cluj-Napoca; Dumbrăvița, Giroc, Moșnița Nouă near Timișoara; Miroslava and Rediu near Iași, etc.), the situations owing to exurbation phenomena in the context of increasing migratory flows to large cities against the background of increasing discrepancies between large cities and rural areas (including small towns) in terms of living standards, and increasing external labor immigration (especially from Asia).
The advantages of living eco-friendly as far away from the polluted centers of large cities constitute real estate promotion brands that support ex-urbanization processes, being widespread in most large cities, but also in the regional metropolises analyzed in this study. The limits of the expansion of cities beyond the administrative territories seem to be given by the inability of transport systems to ensure connections with urban centers, especially during peak hours. The reorganization of the urban transport system in Bucharest, which aimed to reduce the distances of bus routes, is a good example in this regard.
On the other hand, however, the relocation of labor, amplified after the coronavirus pandemic, supports this process and amplifies migrations to peri-urban areas. The viability of policies that encourage telework and distance learning has been demonstrated by their continuation in the post-pandemic period, both among employees of private companies and within university teaching activities (especially in Master’s studies).
The exurbanization of peri-urban areas is most often chaotic, with the development of housing stock not being supported by infrastructure, especially by communications infrastructure, resulting in traffic jams, especially during peak periods. This is the reason why, in most large cities in Romania, price increases for old apartments are higher than those for new apartments. In some cases (Timișoara, Iași, Brașov), the differences are significant (Table 3). On the other hand, these differences are conditioned by the discrepancies in the economic and social development between the different regions and counties of Romania, which also condition the degree of attractiveness for investments [73].
Urban centers, although they recorded demographic declines in all the analyzed situations, had increases in the level of the built stock resulting in an improvement in the quality of housing. However, real estate prices increased, both for new and old homes in large urban centers, being supported by the continuously growing demand. Real estate development, both in urban areas and in the localities in their peri-urban crowns, was most often performed by restricting green areas, which increased pollution and increased temperatures felt by the population. The existence of green spaces has an impact on multiple levels of urban living: on the social level, creating socializing opportunities, and the development of cultural and social events; on the health level, by promoting a healthy lifestyle and creating opportunities to spend free time; it also has an impact of particular importance from an aesthetic point of view, and even on an economic level—it was observed that residents place a high value on areas with quality green spaces. In this regard, firm measures are required to tighten the legislation that allows the transformation of green areas into buildable land, as a result of their transfer to private property, as well as blocking legislative projects in this regard. The restitution of hundreds of hectares of green space from parks in the Romanian capital, as well as green spaces between apartment buildings, playgrounds or fruit nurseries, and their transformation into land suitable for construction, given the high land prices and the profitability of investments in the real estate sector, have been documented in the last 20 years [74]. At the national level, the situation is similar.
Through the analyses carried out, this paper contributes to the literature on spatial planning and in particular on the post-industrial redevelopment of the areas bordering large urban centers, as a result of exurbation phenomena. It can serve as a reference point on the stage of development of the peri-urban areas of the capital and of several regional metropolises in Romania, cities representative of the urban development trajectories in Central and South-Eastern Europe.
The paper draws attention to the development disparities between peri-urban areas attractive for migration and real estate developments, and rural areas (including small towns), which are facing a strong depopulation phenomenon.
The limitations of the research seem to be given by the uncertainties regarding the forecasts of the evolution of these areas in the context of economic recession and the evolution of housing prices, but also against the background of the deficient infrastructure in these areas. In this regard, several directions for continuing the research can be outlined: (1) extending the research to other regional metropolises in Romania (the bipolar conurbation of Galați-Brăila, the cities of Brașov, Craiova, Oradea, etc.) and highlighting the existing dysfunctions; (2) highlighting examples of good practices regarding the expansion of green space areas in accordance with European standards and regulations, in relation to local environmental particularities; (3) analyzing the impact generated by the international and regional geopolitical and geoeconomic context on urban environmental policies, with their reflection at the level of case studies; and (4) analyzing the impact of depopulation on environmental components with highlighting territorial differentiations at regional and local levels depending on natural particularities.

Author Contributions

Conceptualization, R.S.; methodology, R.S. and C.D.; software, C.D.; validation, R.S., C.D. and D.B.; formal analysis, R.S.; investigation, R.S. and C.D.; resources, R.S. and C.D.; data curation, R.S.; writing—original draft preparation, R.S.; writing—review and editing, R.S.; visualization, R.S.; supervision, R.S., C.D. and D.B.; project administration, R.S.; funding acquisition, R.S. All authors have read and agreed to the published version of the manuscript.

Funding

This research received no external funding.

Institutional Review Board Statement

Not applicable.

Informed Consent Statement

Not applicable.

Data Availability Statement

The original contributions presented in this study are included in the article. Further inquiries can be directed to the corresponding author.

Acknowledgments

The research for this paper was conducted under the research plan of the Romanian Academy “Geographical studies on the evolution of population in Romania” and under the joint academic research project “Cross-border Cooperation in the Middle and Lower Danube Basin. Geographical Studies with focus on Hungarian and Romanian Cities”.

Conflicts of Interest

The authors declare no conflicts of interest.

References

  1. United Nations. World Population Prospects. 30 Years of Population Change in Europe (1990–2023). In Pallavi R. Mapped: How Europeʼs Population Has Changed (1990–2023). 2024. Available online: https://www.visualcapitalist.com/mapped-how-europes-population-has-changed-1990-2023/ (accessed on 15 May 2024).
  2. Kurek, S.; Wójłowicz, M.; Gałka, J. The changing role of migration and natural increase in suburban population growth: The case of non-capital post-socialist city (The Krakow Metropolitan Area, Poland). Morav. Geogr. Rep. 2015, 23, 59–70. [Google Scholar] [CrossRef]
  3. Sassen, S. The Global City; Princeton University Press: New York, NY, USA; London, UK; Tokyo, Japan; Princeton, NJ, USA; Oxford, UK, 2001. [Google Scholar]
  4. Ianoș, I. Orașele și organizarea spațiului geografic. Studiu de geografie economic asupra teritoriului României [Towns and the Organization of the Geographical Space. Studies of Economic Geography on Romania’s Territory]; Romanian Academy Publishing House: Bucharest, Romania, 1987. [Google Scholar]
  5. Ianoş, I. Dinamica Urbană. Aplicaţii la Oraşul şi Sistemul Urban Românesc [Urban Dynamics. Applications on the City and the Romanian Urban System]; Technic Publishing House: Bucharest, Romania, 2004. [Google Scholar]
  6. National Institute of Statistics. Recensământul populației și al locuințelor din 21–31 october 2011 [The Population and Housing Census of 21–31 October 2011]. 2012. Available online: http://www.recensamantromania.ro/rpl-2011/rezultate-2011/ (accessed on 16 May 2024).
  7. National Institute of Statistics. Recesământul Populației și al Locuințelor. Rezultate Definitive [The Population and housing census. Final Results]. 2022. Available online: https://www.recensamantromania.ro/rezultate-rpl-2021/rezultate-definitive-caracteristici-demografice/ (accessed on 11 June 2024).
  8. Nelson, A.-C.; Dueker, K.-J. The exurbanization of America and its planning policy implications. J. Plan. Educ. Res. 1990, 9, 91–100. [Google Scholar] [CrossRef]
  9. Esparza, A.-X. Exurbanization and Aldo Leopold’s human-land community. In The Planner’s Guide to Natural Resource Conservation; Esparza, A.-X., McPherson, G., Eds.; Springer: New York, NY, USA, 2009; pp. 3–26. [Google Scholar]
  10. Kuhn, R. Internal Migration: Developing Countries. In International Encyclopedia of Social & Behavioural Sciences, 2nd ed.; Wright, J.-D., Ed.; Elsevier: Amsterdam, The Netherlands, 2015; pp. 433–442. [Google Scholar] [CrossRef]
  11. Frey, W.-H. Internal migration: What does the future hold? In Internal Migration in the Developed World. Are we becoming less mobile? Champion, T., Coohe, T., Shuttleworth, I., Eds.; Routledge: London, UK, 2018. [Google Scholar]
  12. Kennedy, S.-M. Urban policy mobilities, argumentation and the case of the model city. Urban Geogr. 2016, 37, 96–116. [Google Scholar] [CrossRef]
  13. Van Ham, M.; Tammaru, T. New perspectives on ethnic segregation over time and space. A domains approach. Urban Geogr. 2016, 37, 953–962. [Google Scholar] [CrossRef]
  14. Musterd, S.; Marcińzak, S.; van Ham, M.; Tammaru, T. Socio-economic segregation in European capital cities. Increasing separation between poor and rich. Urban Geogr. 2017, 38, 1062–1083. [Google Scholar] [CrossRef]
  15. Cudny, W. The study of the landscape physiognomy of urban areas—The methodology development. Methods Landsc. Res. Diss. Comm. Cult. Landsc. 2008, 8, 74–85. [Google Scholar]
  16. Solon, J. Spatial context of urbanization: Landscape pattern and changes between 1950 and 1990 in the Warsaw metropolitan area, Poland. Landsc. Urban Plan. 2009, 93, 250–261. [Google Scholar] [CrossRef]
  17. Fenster, T. Creative destruction in urban planning procedures: The language of “renewal” and “exploitation”. Urban Geogr. 2019, 40, 37–57. [Google Scholar] [CrossRef]
  18. Wenner, F.; Dang, K.-A.; Hölzl, M.; Pedrazzoli, A.; Schmidkunz, M.; Wang, J.; Thierstein, A. Regional Urbanization through Accessibility?—The “Zweite Stammstrecke” Express Rail Project in Munich. Urban Sci. 2020, 4, 2. [Google Scholar] [CrossRef]
  19. Berényi, I. Transformation of the Urban Structure of Budapest. GeoJournal 1994, 32, 403–414. [Google Scholar]
  20. Farkas, Z.; Szigeti, C.; Harangozó, G. Assessing the sustainability of urbanization at the sub-national level: The Ecological Footprint and Biocapacity accounts of the Budapest Metropolitan Region, Hungary. Sustain. Cities Soc. 2022, 84, 104022. [Google Scholar] [CrossRef]
  21. Sýkora, L. Changes in the Internal Spatial Structure of Post-Communist Prague. GeoJurnal 1999, 49, 79–89. [Google Scholar] [CrossRef]
  22. Neill, W.; Schwedler, H.-U. (Eds.) Urban Planning and Cultural Inclusion. Lessons from Belfast and Berlin; Palgrave Macmillan: Basingstoke, UK, 2001. [Google Scholar]
  23. Thierfelder, H.; Kabisch, N. Viewpoint Berlin: Strategic urban development in Berlin—Challenges for future urban green space development. Environ. Sci. Policy 2016, 62, 120–122. [Google Scholar] [CrossRef]
  24. Zasada, I.; Fetner, C.; Piorr, A.; Nielsen-Thomas, S. Peri-urbanization and multifunctional adaptation of agriculture around Copenhagen. Dan. J. Geogr. 2011, 111, 59–72. [Google Scholar] [CrossRef]
  25. Churkina, N.; Zaverskiy, S. Challenges of Strong Concentration in Urbanization: The Case of Moscow in Russia. Procedia Eng. 2017, 198, 398–410. [Google Scholar] [CrossRef]
  26. Romańczyk, K.-M. Krakow—The City profile revisited. Cities 2018, 73, 138–150. [Google Scholar] [CrossRef]
  27. Majewska, A.; Malgorzata, D.; Krupowicz, W. Urbanization Chaos of Suburban Small Cities in Poland: “Tetris Development”. Land 2020, 9, 461. [Google Scholar] [CrossRef]
  28. National Institute of Statistics. România—Un Secol de Istorie. Date Statistice. [Romania—A Century of History. Statistical Data]; National Institute of Statistics: Bucharest, Romania, 2018. [Google Scholar]
  29. United Nations. Top 30 Countries with the Greatest Projected Population Increase and Decrease Between 2020–2100; FactsMaps: 2021. Available online: https://factsmap.com/countries-greatest-projected-population-increase-decrease-2020-2100/ (accessed on 12 June 2024).
  30. Copernicus Land Management Service (CLMS). 2024. Available online: https://land.copernicus.eu/en/products (accessed on 12 June 2024).
  31. Emergency Management Service (CEMS). 2024. Available online: https://human-settlement.emergency.copernicus.eu/copernicus.php#inline-nav-1 (accessed on 12 June 2024).
  32. Melchiorri, M.; Kemper, T. Establishing an operational and continuous monitoring of global built-up surfaces with the Copernicus Global Human Settlement Layer. In Proceedings of the Joint Urban Remote Sensing Event (JURSE), Heraklion, Greece, 17–19 May 2023; pp. 1–4. [Google Scholar] [CrossRef]
  33. European Environment Agency. How Green Are European Cities? Green Space Key to Well-Being-But Access Varies. 2023. Available online: https://www.eea.europa.eu/highlights/how-green-are-european-cities (accessed on 15 June 2024).
  34. European Urban Initiative. Greening Cities. 2023. Available online: https://www.urban-initiative.eu/innovative-actions-greening-cities (accessed on 15 June 2024).
  35. European Commission. Urban Nature Platform. Supporting Towns and Cities in Restoring Nature and Biodiversity. 2024. Available online: https://environment.ec.europa.eu/topics/urban-environment/green-city-accord_en (accessed on 15 June 2024).
  36. Romanian Parliament. Legea nr. 351 din 6 iulie 2001 privind aprobarea Planului de amenajare a teritoriului national—Secțiunea a IV-a: Rețeaua de localități [Law no. 351 of July for the approval of the National Territory Planning Scheme, Section IV: Settlement Network]. Monitorul Oficial al României/Official Journal of Romania, 24 July 2001; p. 408.
  37. Romanian Parliament. Legea nr. 24 din 15 ianuarie 2007 privind reglementarea și administrarea spațiilor verzi din interiorul localităților [Law No. 24 of 15 January 2007 on the Regulation and Administration of Green Spaces within Localities]. Monitorul Oficial al României/Official Journal of Romania, 18 January 2007; p. 36.
  38. Romanian Parliament. Lege nr. 313 din 12 octombrie 2009 pentru modificarea și completarea Legii nr. 24/2007 privind reglementarea și administrarea spațiilor verzi din zonele urbane [Law No. 313 of 12 October 2009 Aamending and supplementing Law No. 24/2007 on the Regulation and Management of Green Spaces in Urban Areas]. Monitorul Oficial al României/Official Journal of Romania, 15 October 2009; p. 694.
  39. Romanian Parliament, Legea nr. 135 din 15 oct. 2014 pentru modificarea alin. (5) al art. 21 din Legea nr. 10/2001 privind regimul juridic al unor immobile preluate abuziv în perioada 6 martie 1945—22 decembrie 1989, precum și pentru completarea art. 18 din Legea nr. 24/2007 privind reglementarea și administrarea spațiilor verzi din interiorul localităților [Law no. 135 of 15 October 2014 amending paragraph (5) of art. 21 of Law no. 10/2001 on the Legal Regime of Properties Taken Over Abusively between 6 March 1945 and 22 December 1989, as well as supplementing art. 18 of Law no. 24/2007 on the Regulation and Administration of Green Spaces within Localities]. Monitorul Oficial al României/Official Journal of Romania, 16 October 2014; p. 753.
  40. Romanian Government, Ordonanță de urgență nr. 195 din 22 decembrie 2005 privind protecția mediului [Emergency Ordinance No. 195 of December 22, 2005 on Environmental Protection], Monitorul Oficial al României/Official Journal of Romania, 30 December 2005; p. 196.
  41. Romanian Government, Ministerul Dezvoltării, Lucrărilor Publice și Locuințelor, Ordinul nr. 1 549/2008 privind aprobarea Normelor tehnice pentru elaborarea Registrului local al spațiilor verzi [Order No. 1 549/2008 on the Approval of the Technical Norms for the Development of the Local Register of Green Spaces]. Monitorul Oficial al României/Official Journal of Romania, 10 December 2008; p. 829.
  42. Romanian Parliament, Legea nr. 246 din 20 iulie 2022 privind zonele metropolitane, precum și pentru modificarea și completarea unor acte normative [Law No. 246 of 20 July 2022 on Metropolitan Areas, as well as for amending and supplementing certain normative acts]. Monitorul Oficial al României/Official Journal of Romania, 25 July 2022; p. 745.
  43. Storia.ro Analiză Storia—um au evoluat prețurile apartamentelor în principalele orașe din țară [How Apartment Prices Have Evolved in the Main Cities in the Country]. Available online: https://www.storia.ro/blog/newsroom/stiri/analiza-storia-cum-au-evoluat-preturile-apartamentelor-in-principalele-orase-din-tara-2 (accessed on 11 May 2024).
  44. Imobiliare.ro. Apartamentele noi Continuă să se Scumpească. La Nivel Național, Prețul Apartamentelor Atinge o Nouă Valoare Record [New Apartments Continue to Rise in Price. Nationally, Apartment Prices Reach a New Record high]. June 2024. Available online: https://www.imobiliare.ro/imoexpert/apartamentele-noi-continua-sa-se-scumpeasca-la-nivel-national-pretul-apartamentelor-atinge-o-noua-valoare-record_db/ (accessed on 21 July 2024).
  45. Lipchin, T. Angajații Români Achită Cele Mai Mari Impozite și Taxe. Aproape 43% din Salariul Brut al Unui Angajat din România Ajunge la Bugetul de stat [Romanian Employees Pay the Highest Taxes and Fees. Almost 43% of the Gross Salary of an Employee in Romania Goes to the State Budget]. Available online: https://www.euronews.ro/articole/angajatii-romani-achita-cele-mai-mari-impozite-si-taxe-aproape-43-din-salariul-br (accessed on 21 July 2024).
  46. Mocanu, I. Șomajul din România. Dinamică și diferențieri geografice [Unemployment in Romania. Dynamics and Geographical Differentiation]; University Publishing House: Bucharest, Romania, 2008. [Google Scholar]
  47. Dumitrescu, B. Oraşele Monoindustriale din România Între Industrializare Forţată şi Declin Economic, [One-Industry Town in Romania between Forced Industrialization and Economic Decline]; University Publishing House: Bucharest, Romania, 2008. [Google Scholar]
  48. Draghia, M. The peri-urbanisation effect: Emerging functional spatial patterns in Romania. Case-study for 4 major cities: Brașov, Cluj-Napoca, Iași and Timișoara. J. Urban Landsc. Plan. 2021, 6, 98–113. [Google Scholar]
  49. Iordan, I. Zona Peri-Urbană a Bucureştilor [The Peri-Urban Area of Bucharest]; Romanian Academy Publishing House: Bucharest, Romania, 1973. [Google Scholar]
  50. Erdeli, G.; Cândea, M.; Braghină, C.; Costachie, S.; Zamfir, D. Dicționar de geografie umană [Dictionary of Human Geography]; Corint Publishing House: Bucharest, Romania, 1999. [Google Scholar]
  51. Nicolae, I. Suburbanismul ca Fenomen Geografic în România [Suburbanism, as a Geographical Phenomenon in Romania]; Meronia Publishing House: Bucharest, Romania, 2002. [Google Scholar]
  52. Neacşu, M.-C. Oraşul sub lupă. Concepte Urbane. Abordare geografică [The City Under the Magnifying Glass. Urban Concepts. Geographic Approach]; Pro-Universitaria Publishing House: Bucharest, Romania, 2010. [Google Scholar]
  53. Muntele, I. Urbanisation et countreurbanisation dans lʼEurope dʼaprès-guerre [Urbanisation and counterurbanisation in post-war Europe]. Rev. Roum. De Géographie Rom. J. Geogr. 2009, 53, 233–245. [Google Scholar]
  54. Grigorescu, I.; Kucsicsa, G.; Mitrică, B. Assessing spatio-temporal dynamics of urban sprawl in the Bucharest Metropolitan Area over the last century. In Land Use/Cover Changes in Selected Regions in the World; International Geographical Union, Charles University: Prague, Czech Republic, 2015; pp. 19–27. [Google Scholar]
  55. Nae, M. Geografia Calităţii vieţii Urbane. Metode de Analiză [Geography of Urban Quality of Life. Methods of Analysis]; University Publishing House: Bucharest, Romania, 2006. [Google Scholar]
  56. Muja, S. Dezvoltarea Spațiilor Verzi în Sprijinul Conservării Mediului Înconjurător în România [Developing Green Spaces to Support Environmental Conservation in Romania]; Ceres Publishing House: Bucharest, Romania, 1994. [Google Scholar]
  57. Greencommunity.ro; Dinu, C. Cât de Verzi Sunt Șase Dintre Cele Mai Mari Orașe Din România. Studiu Comparative Despre Cum arată Situația Spațiilor Verzi în București, Cluj, Timișoara, Iași, Brașov și Oradea [How Green Are Six of the Largest Cities in Romania? Comparative Study on the Situation of Green Spaces in Bucharest, Cluj, Timisoara, Iași, Brașov and Oradea]. Available online: https://greencommunity.ro/top-orase-verzi-romania-registrul-spatiilor-verzi/ (accessed on 19 September 2023).
  58. Focuspress.ro. Constanța Rămâne cu o Suprafață de Spațiu Verde pe cap de Locuitor Mai Mică Decât cea Prevăzută de Lege [Constanta Remains with a Green Space Area Per Capita Smaller Than That Required by Law. Available online: https://focuspress.ro/constanta-ramane-cu-o-suprafata-de-spatiu-verde-pe-cap-de-locuitor-mai-mica-decat-cea-prevazuta-de-lege/ (accessed on 5 September 2022).
  59. Greenpeace.org; Tănase, A. Spațiile verzi din București, sub 10 mp/cap de locuitor [Green Spaces in Bucharest, Under 10 m2/capita]. Available online: https://www.greenpeace.org/romania/articol/4401/spatiile-verzi-din-bucuresti-sub-10mp-cap-de-locuitor/ (accessed on 23 June 2020).
  60. Europa Liberă & România; Benea, I. Cât Spațiu Verde (nu) au Locuitorii Marilor Orașe. Marea Păcăleală de la București [How much green space do residents of big cities (not) have? The great hoax from Bucharest]. Available online: https://romania.europalibera.org/a/c%C3%A2t-spa%C8%9Biu-verde-nu-au-locuitorii-marilor-ora%C8%99e-marea-minciun%C4%83-de-la-bucure%C8%99ti/31259488.html (accessed on 17 May 2021).
  61. Chelcea, L. Bucureştiul Postindustrial. Memorie, Dezindustrializare şi Regenerare Urbană [Post-Industrial Bucharest. Memory, Deindustrialization and Urban Regeneration]; Polirom Publishing House: Iași, Romania, 2008. [Google Scholar]
  62. Paraschiv, M.; Nazarie, R. Regenerarea urbană a siturilor de tip brownfield. Studiu de caz: Zonele industriale din sectorul III, Municipiul București [Urban regeneration of brownfield land. Case Study: Industrial areas in sector III, Bucharest Municipality]. Analele Asoc. Prof. A Geogr. Din România 2010, 1, 95–107. [Google Scholar]
  63. Cepoiu, A.-L. Rolul activităților industriale în dezvoltarea așezărilor din spațiul metropolitan al Bucureștilor [The Role of Industrial Activities in the Development of Settlements in the Metropolitan Area of Bucharest]; University Publishing House: Bucharest, Romania, 2009. [Google Scholar]
  64. Popescu, D. România de suburbie [Suburban Romania]. Available online: https://panorama.ro/romania-de-suburbie-marea-migratie-oras-periferie-recensamant/ (accessed on 29 March 2023).
  65. Iordan, I. Împrejurimile Bucureștilor. Ghid Turistic [The Surroundings of Bucharest. Touristic Guide]; Societatea R Publishing House: Bucharest, Romania, 1992. [Google Scholar]
  66. Dordea, D.; Sprînceană, V.; Casapu, I.; Dobrescu, A. Atlasul Regiunii București-Ilfov. Evaluarea Factorilor de Mediu [Atlas of the Bucharest-Ilfov Region. Evaluation of environmental Factors]; National Library of Romania Publishing House: Bucharest, Romania, 2011. [Google Scholar]
  67. Pressone.ro; Popa, L. Atunci vs. Acum. Imaginile din Satelit Arată cum au Dispărut Spațiile Verzi din București în Ultimii 20 de ani [Then vs. Now. Satellite Images Show How Green Spaces in Bucharest Have Disappeared in the Last 20 Years]. Available online: https://pressone.ro/atunci-vs-acum-imaginile-din-satelit-arata-cum-au-disparut-spatiile-verzi-din-bucuresti-in-ultimii-20-de-ani (accessed on 4 August 2024).
  68. Financiar, Z.; Vasiliu, A.-E. Pagina verde. Reportaj Ziarul Financiar. O viață între Betoane. Cum a Ajuns Popești-Leordeni să se „sufoce” în Poluare ? „Nu Există Parcuri, cu Excepția Unuia Singur, mic, unde băncile Sunt Insuficiente, iar Dacă Mergi în week-End, nu ai loc să arunci un ac” [A life Among Concrete. How Did Popești-Leordeni End Up “Suffocating” in Pollution? “There are no Parks, Except for One Small One, Where There are not Enough Benches, and if You Go on the Weekend, You Have no Place to Throw a Needle”]. Ziarul Financiar, 12 February 2023. Available online: https://www.zf.ro/economia-verde/pagina-verde-reportaj-zf-viata-intre-betoane-ajuns-popesti-leordeni-21582921 (accessed on 1 July 2024).
  69. Cobârzan, R. Brownfield redevelopment in Romania. Transylv. Rev. Adm. Sci. 2017, 21E, 28–46. [Google Scholar]
  70. Marian-Potra, A.-C.; Ișfănescu-Ivan, R.; Ancuța, C.-A.; Pavel, S. Temporary Uses of Urban Brownfields for Creative Activities in a Post-Socialist City. Case-Study: Timișoara, Romania. Sustainability 2020, 12, 8095. [Google Scholar] [CrossRef]
  71. Voiculescu, S.; Creţan, R.; Ianăş, A.; Satmari, A. The Romanian Post-Socialist City: Urban Renewal and Gentrification; West University Publishing House: Timișoara, Romania, 2009. [Google Scholar]
  72. Săgeată, R. Cross-Border Co-operation Euro-regions at the European Union Eastern Border within the Context of Romania’s Accession to the Schengen Area. Georg. Pannonica 2011, 15, 127–135. [Google Scholar] [CrossRef]
  73. Guran-Nica, L. Investiții străine directe și dezvoltatea sistemului de așezări din România [Foreign direct investments and the development of the settlement system in Romania]; Technic Publishing House: Bucharest, Romania, 2002. [Google Scholar]
  74. Hotnews.ro; Ivanov, C. Ce spații verzi poate să piardă Bucureștiul dacă Parlamentul dă liber la Betonarea Spațiilor Verzi Private [What Green Spaces Could Bucharest Lose if Parliament Gives the Green Light to Concreting Private Green Spaces?]. Available online: https://hotnews.ro/ce-spatii-verzi-poate-sa-piarda-bucurestiul-daca-parlamentul-da-liber-la-betonarea-spatiilor-verzi-private-57785 (accessed on 28 June 2023).
Figure 1. The location of the urban case studies analyzed.
Sustainability 17 02925 g001
Figure 2. Demographic evolution in Europe (1990–2023). Source: [1], processed by the authors.
Sustainability 17 02925 g002
Figure 3. Demographic evolution of administrative units and large cities with a regional polarization function in Romania (2011–2021). Sources: [6,7].
Sustainability 17 02925 g003
Figure 4. Demographic size of administrative-territorial units in Romania. Source: [7].
Sustainability 17 02925 g004
Figure 5. (a,b) New residential neighborhoods in Chiajna commune, west of the Romanian capital. (photo R. Săgeată).
Sustainability 17 02925 g005
Figure 6. CORINE Land Cover databases for the Bucharest municipality and its peri-urban crown for 1990, 2012 and 2018 which capture the changes in land-use/cover distribution that have occurred in the last 30 years. Legend for the peri-urban localities discussed: 6—Domnești; 7—Chiajna; 10—Dobroești; 11—Tunari; 12—Otopeni; 13—Corbeanca; 14—Ștefăneștii de Jos; 19—Popești—Leordeni; 20—Berceni; 22—Bragadiru).
Sustainability 17 02925 g006
Figure 7. (a,d) CORINE Land Cover databases for the Cluj-Napoca (a), Timișoara (b), Iași (c) and Constanța (d) municipalities and their peri-urban crowns for 1990, 2012 and 2018, which capture the changes in land-use/cover distribution that have occurred over the last 30 years. The Legend for the CORINE Land Cover databases is the same as in the case of Bucharest (Figure 6). (a). Legend for the peri-urban localities discussed: 5—Florești; 8—Baciu; 9—Apahida; 18—Feleacu; 29—Gilău. (b). Legend for the peri-urban localities discussed: 0—Giroc; 7—Chiajna; 1—Sânmihaiu Român; 2—Moșnița Nouă; 3—Ghiroda; 4—Săcălaz; 21—Dumbrăvița. (c). Legend for the peri-urban localities discussed: 24—Rediu; 25—Tomești; 26—Holboca; 27—Ciurea; 28—Miroslava. (d). Legend for the peri-urban localities discussed: 15—Valu lui Traian; 16—Cumpăna; 17—Năvodari; 23—Agigea.
Sustainability 17 02925 g007aSustainability 17 02925 g007b
Table 1. Population of large cities in Romania at the 2011 and 2021 censuses.
CityPopulation
(Inhabitants)
Population Decline
(% in 2021 Compared to 2011)
20112021
Bucharest *1,883,4251,716,983−8.9
Cluj-Napoca *324,576286,598−11.7
Iași *290,422271,692−6.4
Constanța *283,872263,707−7.1
Timișoara *319,279250,849−21.4
Brașov253,200237,589−6.2
Craiova269,506234,140−14.1
Galați249,432217,851−12.7
Oradea196,367183,105−6.8
Ploiești209,945180,539−14.0
Brăila180,302154,686−14.2
Arad159,074145,078−8.8
Pitești155,383141,275−9.1
Bacău144,307136,102−5.7
Data source: [6,7]. * Case studies discussed in this paper.
Table 2. Area of green spaces/inhabitants in the main large cities in Romania.
Constanța *17.7 m2/inh.
Bucharest *23.21 m2/inh.
Iași *26.15 m2/inh.
Oradea27.56 m2/inh.
Cluj-Napoca *28.64 m2/inh.
Timișoara *41.82 m2/inh.
Brașov118.54 m2/inh.
Sources: Data provided by local administrations (taken from [57]) and from Constanța Environmental Guard (taken from [58]). * Case studies in this paper.
Table 3. The peri-urban crown of Bucharest.
Name of ATUAdministrative
Status
Surface
(sqkm)
Number of Component Villages/LocalitiesPopulation (inh.)Demographic
Evolution
(%)
Number of HomesEvolution of the Number of Homes
2021201120212011
ChiajnaCommune16.1343,58414,259+205.737,9005916+540.6
BragadiruTown21.79140,08015,329+161.524,6237696+219.9
Popești-LeordeniTown55.8153,43421,895+144.030,6959520+225.8
BerceniCommune24.5113,7665942+131.7Md.Md.Md.
Ștefăneștii de JosCommune29.0310,5885775+83.368112489+173.3
DobroeștiCommune11.0216,8759325+81.097453682+164.7
TunariCommune32.0296175336+80.248451939+149.9
OtopeniTown32.0221,75013,871+56.912,1155930+104.3
CorbeancaCommune30.18411,4127072+61.460313163+90.7
DomneștiCommune38.8212,8618682+48.157303363+70.4
Total peri-urban crown7 communes
3 towns
291.1721233,967107,476+117.7138,49543,705+216.88
BucharestMunicipality240.0-1,716,9831,883,425−8.81,038,266844,541+22.9
Data source: [6,7]. Md.—Missing data.
Table 4. Average price for apartments for sale in main cities in Romania.
CityPrice of New Apartments (Euro/sqm)
(September 2024)
Price of New Apartments
(September 2023–September 2024)
Price of Old Apartments (Euro/sqm) (September 2024)Price Evolution of Old Apartments
(September 2023–September 2024)
Bucharest *1833+18%1942+12%
Cluj-Napoca *2853+13%2811+15%
Timișoara *1666+11%1693+17%
Iași *1623+13%1702+21%
Constanța *1854+11%1775+13%
Brașov2068+7%1963+20%
Craiova1695+15%1654+14%
Oradea1727+14%1598+19%
Sibiu1554+21%1742+21%
Data source: [43]. * Case studies discussed in this paper.
Table 5. The peri-urban crown of Cluj-Napoca.
Name of ATUAdministrative
Status
Surface
(km2)
Number of Component Villages/LocalitiesPopulation (inh.)Demographic
Evolution
(%)
Number of HomesEvolution of the Number of Homes
2021201120212011
FloreștiCommune61.0352,73522,813+131.228,89614,057+105.6
ApahidaCommune106.0817,23910,685+61.381425138+58.5
FeleacuCommune48.41556933923+45.124922050+21.6
BaciuCommune8.75713,92210,317+34.969924426+58.0
GilăuCommune116.82389808300+8.239753491+13.9
Total peri-urban crown5 communes340.982698,56956,038+75.950,49729,162+73.16
Cluj-NapocaMunicipality179.5-286,598324,576−11.7157,784135,419+16.5
Data source: [6,7].
Table 6. The peri-urban crown of Timișoara.
Name of ATUAdministrative
Status
Surface
(sqkm)
Number of Component Villages/LocalitiesPopulation (inh.)Demographic
Evolution
(%)
Number of HomesEvolution of the Number of Homes
2021201120212011
DumbrăvițaCommune18.98120,0147522+166.110,5383064+243.9
GirocCommune55.28222,2708388+165.513,3903285+307.6
Moșnița NouăCommune66.37516,4246203+164.866632337+185.1
GhirodaCommune34.13288666200+43.028992192+32.3
Sânmihaiu RomânCommune75.26384196121+37.5Md.Md.Md.
SăcălazCommune119.49392237204+28.033422786+20.0
Total peri-urban crown6 communes369.511685,21641,638+104.6636,83213,664+169.56
TimișoaraMunicipality130.5-250,849319,279−21.4150,916137,199+10.0
Data source: [6,7]. Md.—missing data.
Table 7. The peri-urban crown of Iași.
Name of ATUAdministrative
Status
Surface
(sqkm)
Number of Component Villages/LocalitiesPopulation (inh.)Demographic
Evolution
(%)
Number of HomesEvolution of the Number of Homes
2021201120212011
MiroslavaCommune82,571328,53411,958+138.614,1324909+184.9
RediuCommune41.6482954577+81.245502063+120.6
CiureaCommune28.76717,25411,640+48.278474507+74.1
HolbocaCommune50.04713,69711,971+14.450074562+14.4
TomeștiCommune37.11412,16911,051+10.154394463+21.9
Total peri-urban crown5 communes240.083579,94951,197+56.1636,97520,504+80.33
TimișoaraMunicipality94.0-271,692290,422−6.4152,220122,505+24.3
Data source: [6,7].
Table 8. The peri-urban crown of Constanța.
Name of ATUAdministrative
Status
Surface
(sqkm)
Number of Component Villages/LocalitiesPopulation (inh.)Demographic
Evolution
(%)
Number of HomesEvolution of the Number of Homes
2021201120212011
NăvodariTown70.31234,39832,981+4.323,75514,073+68.8
Valu lui TraianCommune63.29116,61712,376+34.358694242+38.4
AgigeaCommune45.28487226992+24.739192847+37.7
CumpănaCommune50.64214,75712,333+19.752794101+28.7
Total peri-urban crown3 communes
1 town
229.52974,49464,682+15.1738,82225,263+53.67
ConstanțaMunicipality124.89-263,707283,872−7.1136,293123,090+10.7
Data source: [6,7].
Disclaimer/Publisher’s Note: The statements, opinions and data contained in all publications are solely those of the individual author(s) and contributor(s) and not of MDPI and/or the editor(s). MDPI and/or the editor(s) disclaim responsibility for any injury to people or property resulting from any ideas, methods, instructions or products referred to in the content.

