Article

Combining Novel Membrane Technologies for Sustainable Nutrient Recovery from Digestate: Effect of Solid Content

by
Berta Riaño
1,
Verónica Oliveira
2,3,*,
Celia Dias-Ferreira
3,4,
Beatriz Molinuevo-Salces
5 and
Maria Cruz García-González
5
1
Agricultural Technological Institute of Castilla y León (ITACyL), Ctra. Burgos, km. 119, 47071 Valladolid, Spain
2
Polytechnic University of Coimbra, Rua da Misericórdia, Lagar dos Cortiços—S. Martinho do Bispo, 3045-093 Coimbra, Portugal
3
Research Center for Natural Resources, Environment and Society (CERNAS), Polytechnic University of Coimbra, Bencanta, 3045-601 Coimbra, Portugal
4
CEG—Centro de Estudos Globais, Departamento de Ciências e Tecnologia, Universidade Aberta, R. Alexandre Herculano, 52, 3000-019 Coimbra, Portugal
5
Department of Agroforestry Sciences, Escuela Técnica Superior de Ingenierías Agrarias de Palencia, University of Valladolid, Avenida de Madrid 44, 34004 Palencia, Spain
*
Author to whom correspondence should be addressed.
Sustainability 2025, 17(7), 2917; https://doi.org/10.3390/su17072917
Submission received: 8 February 2025 / Revised: 11 March 2025 / Accepted: 21 March 2025 / Published: 25 March 2025

Abstract

:
Nutrient recovery from anaerobic digestate has gained increasing importance in recent years due to its potential to reduce resource dependency and to close nutrient cycles. The aim of this work is to evaluate the influence of a previous solid–liquid separation phase on nutrient recovery efficiency using two innovative membrane technologies, namely, gas-permeable membranes (GPM) and electrodialytic (ED) processes, applied individually or in combination. The obtained results were compared with those obtained through the centrifugation of the raw digestate and direct chemical precipitation followed by centrifugation in terms of the efficiency in the recovery of N (nitrogen) and P (phosphorous). A total of nine scenarios of digestate processing were compared. GPM technology allowed for the recovery of 65% of the N content in the raw digestate (41.5 g total solids (TS) kg−1) and 67% of N in the liquid fraction (28.0 g TS kg−1), without any significant difference between the two scenarios. However, the results revealed significant differences in the P recovery with ED from the raw digestate (15%) and the liquid fraction (34%), suggesting that phosphorous extraction can be improved by the application of a prior solid–liquid phase. The recovery of N with the GPM technology also enhanced the further recovery of total P with the ED processes. Furthermore, the combination of these technologies allowed for the recovery of N- and P-rich solutions, which were used to precipitate secondary struvite with an efficiency of up to 85%. This research provides a practical framework for sustainable nutrient management, advancing solutions for resource efficiency and environmental stewardship.

1. Introduction

Anaerobic digestion (AD) is a process commonly used for the recovery of energy as methane from agro-food wastes [1]. During this process, organic matter is converted into methane, while such nutrients as ammonia and phosphate are not removed [2,3]. Thus, the effluent obtained after AD (i.e., digestate) has a high amount of such nutrients as nitrogen (N) and phosphorus (P), as well as solids [4]. The most common digestate management practice is its use as organic fertilizer, which allows for the recycling of nutrients while reducing the requirements of chemical fertilizer produced from non-renewable sources such as phosphate rock [5]. However, the local use of digestate as an organic fertilizer in intensive agro-livestock areas and limited agricultural land can result in environmental problems related to nutrient overdoses. In this case, their transportation to other nutrient demanding regions implies high operating costs; thus, alternative solutions should be implemented. The application of solid–liquid separation technologies is widely performed to partly solve the problems related to high transportation costs [5]. The most common solid–liquid separation processes applied in full-scale plants are screw pressing, vibrating screening, and centrifugation [6,7]. The solid fraction represents 10–20% of the total mass of digestate and contains a high percentage of P (between 55–65%) [8]. However, only 25–35% of the total N is retained in the solid fraction [8]. On the contrary, most of the N, in the form of ammonium, is present in the liquid fraction, and, to avoid the transportation costs for the ex situ use of nutrients, a further separation and concentration phase is required. In this vein, recovering N and P from digestate as easily transportable and marketable products has gained increasing importance over the last few years [5].
The most common method for the simultaneous recovery of ammonium and phosphate from wastewater is struvite (MgNH4PO4·6H2O) precipitation [9,10]. Struvite formation requires a molar ratio of Mg:N:P of 2:2:1 [11]. However, digestate is generally rich in ammonium, whereas magnesium and phosphate contents are lower [12]. As a result: (1) the recovery of ammonium is low; and (2) to obtain a maximum efficiency of P recovery, Mg2+ must be added to the digestate. In addition, one of the main challenges of the application of this process is the presence of contaminants in the digestate, such as competitive ions, which can affect the P precipitation as well as the quality of the recovered products [11,12,13]. Digestate is a complex matrix rich in several ions (such as Ca2+ and Na+, among others) that may affect the nucleation and growth of the struvite crystals in terms of morphology and size [14]. The application of innovative membrane technologies could solve this problem. Thus, Oliveira et al. [11] recently tested the combination of two independent membrane processes, namely, the electrodialytic (ED) process to extract P and gas-permeable membrane (GPM) technology for N extraction, so as to recover highly purified nutrient solutions for use in struvite production. The ED technique is based on electromigration, which is the application of a voltage drop across the waste material that causes the migration of the soluble ions under the electric field towards the electrode of opposite charge [15,16]. Phosphorous is mostly present as a negatively charged species and migrates to the anode during the ED process, while contaminants, such as heavy metals, are usually positively charged and move to the cathode. As a result, a P-rich solution, virtually free of metal cations and other positive or neutral pollutants, is obtained at the end of the ED process [11]. When ED is applied as a single-process, it is necessary to add a synthetic source of ammonium for secondary struvite precipitation, which would represent an additional cost and environmental burden in future large-scale plants [11]. On the other hand, the GPM technology employs a microporous, hydrophobic, gas-permeable membrane in the form of a hollow tube, which is immersed in wastewater containing high concentrations of ammonia (NH3). Inside the membrane, an acidic solution continuously circulates. Ammonia diffuses across the membrane and is absorbed by the acidic solution, resulting in the formation of an ammonium salt solution [17]. Fillingham et al. [17] investigated the recovery of ammonium from digestate using GPM technology, reaching a daily capture of ammonia of 12.8%, without further P recovery. However, the two purified nutrient solutions (i.e., the P-rich solution and the ammonium salt solution) can then be used in the synthesis of an organic-based fertilizer (secondary struvite) through precipitation. Only a few studies have investigated the production of secondary struvite. Oliveira et al. [11] successfully extracted 81% of the P and 74% of the total ammonia nitrogen (TAN) contained in municipal solid waste digestate. These solutions were used for the synthesis of secondary struvite, with a precipitation efficiency of 99.5%. To the best of our knowledge, González-García et al. [18] is the only study that evaluates the use of GPM technology followed by the ED process for the recovery of ammonium and P from agro-industrial digestate. These authors obtained recovery efficiencies of N and P of 94% and 74% from anaerobically digested swine manure, respectively, showing a great potential for combining these novel membrane technologies in agro-industrial wastewaters. Alongside the synthesis of secondary struvite with high purity, the combination of GPM and ED processes would make the ED process faster and more energy efficient, because of the prior removal of NH4+ ions [11]. Due to the limited number of works, further studies are required to evaluate the best strategy for obtaining high added value fertilizers from anaerobic digestate, including the influence of a prior solid–liquid separation phase on the recovery efficiency.
This study focuses on investigating two key research questions: (i) Does the solid–liquid separation affect the efficiency of the nutrient recovery processes? (ii) Is it possible to improve the recovery of nutrients (N and P) from digestates in the form of high-quality struvite using novel membrane technologies? Thus, N and P recovery was compared in the raw digestate and in the liquid fraction after solid–liquid separation. Nitrogen from raw digestate and from the liquid fraction was recovered using the GPM technology in an acidic trapping solution. The recovery of P was achieved by applying the ED process to obtain an anolyte solution. The two purified nutrient solutions were subsequently used in the synthesis of secondary struvite through precipitation. The results were compared with those obtained through the centrifugation of the raw digestate and direct chemical precipitation followed by centrifugation in terms of efficiency in the recovery of N and P. A total of nine scenarios of digestate processing were compared.

2. Materials and Methods

2.1. Origin of the Raw Digestate and the Liquid Fraction

The raw anaerobic digestate was obtained from a biogas plant, located in Palencia (Spain), that treated agro-food wastes such as sludge from agro-industrial wastewater treatment plants, slaughterhouse waste, and vegetable waste. Raw digestate was collected directly from the mesophilic digester, placed in a plastic container, and then kept at 4 °C until needed for further experiments. The liquid fraction was separated by spinning the digestate at 5000 rpm using a centrifuge (Centrifuge Digtor20, Ortoalresa, Madrid, Spain) for 5 min. The chemical characterization of both substrates is shown in Table 1.

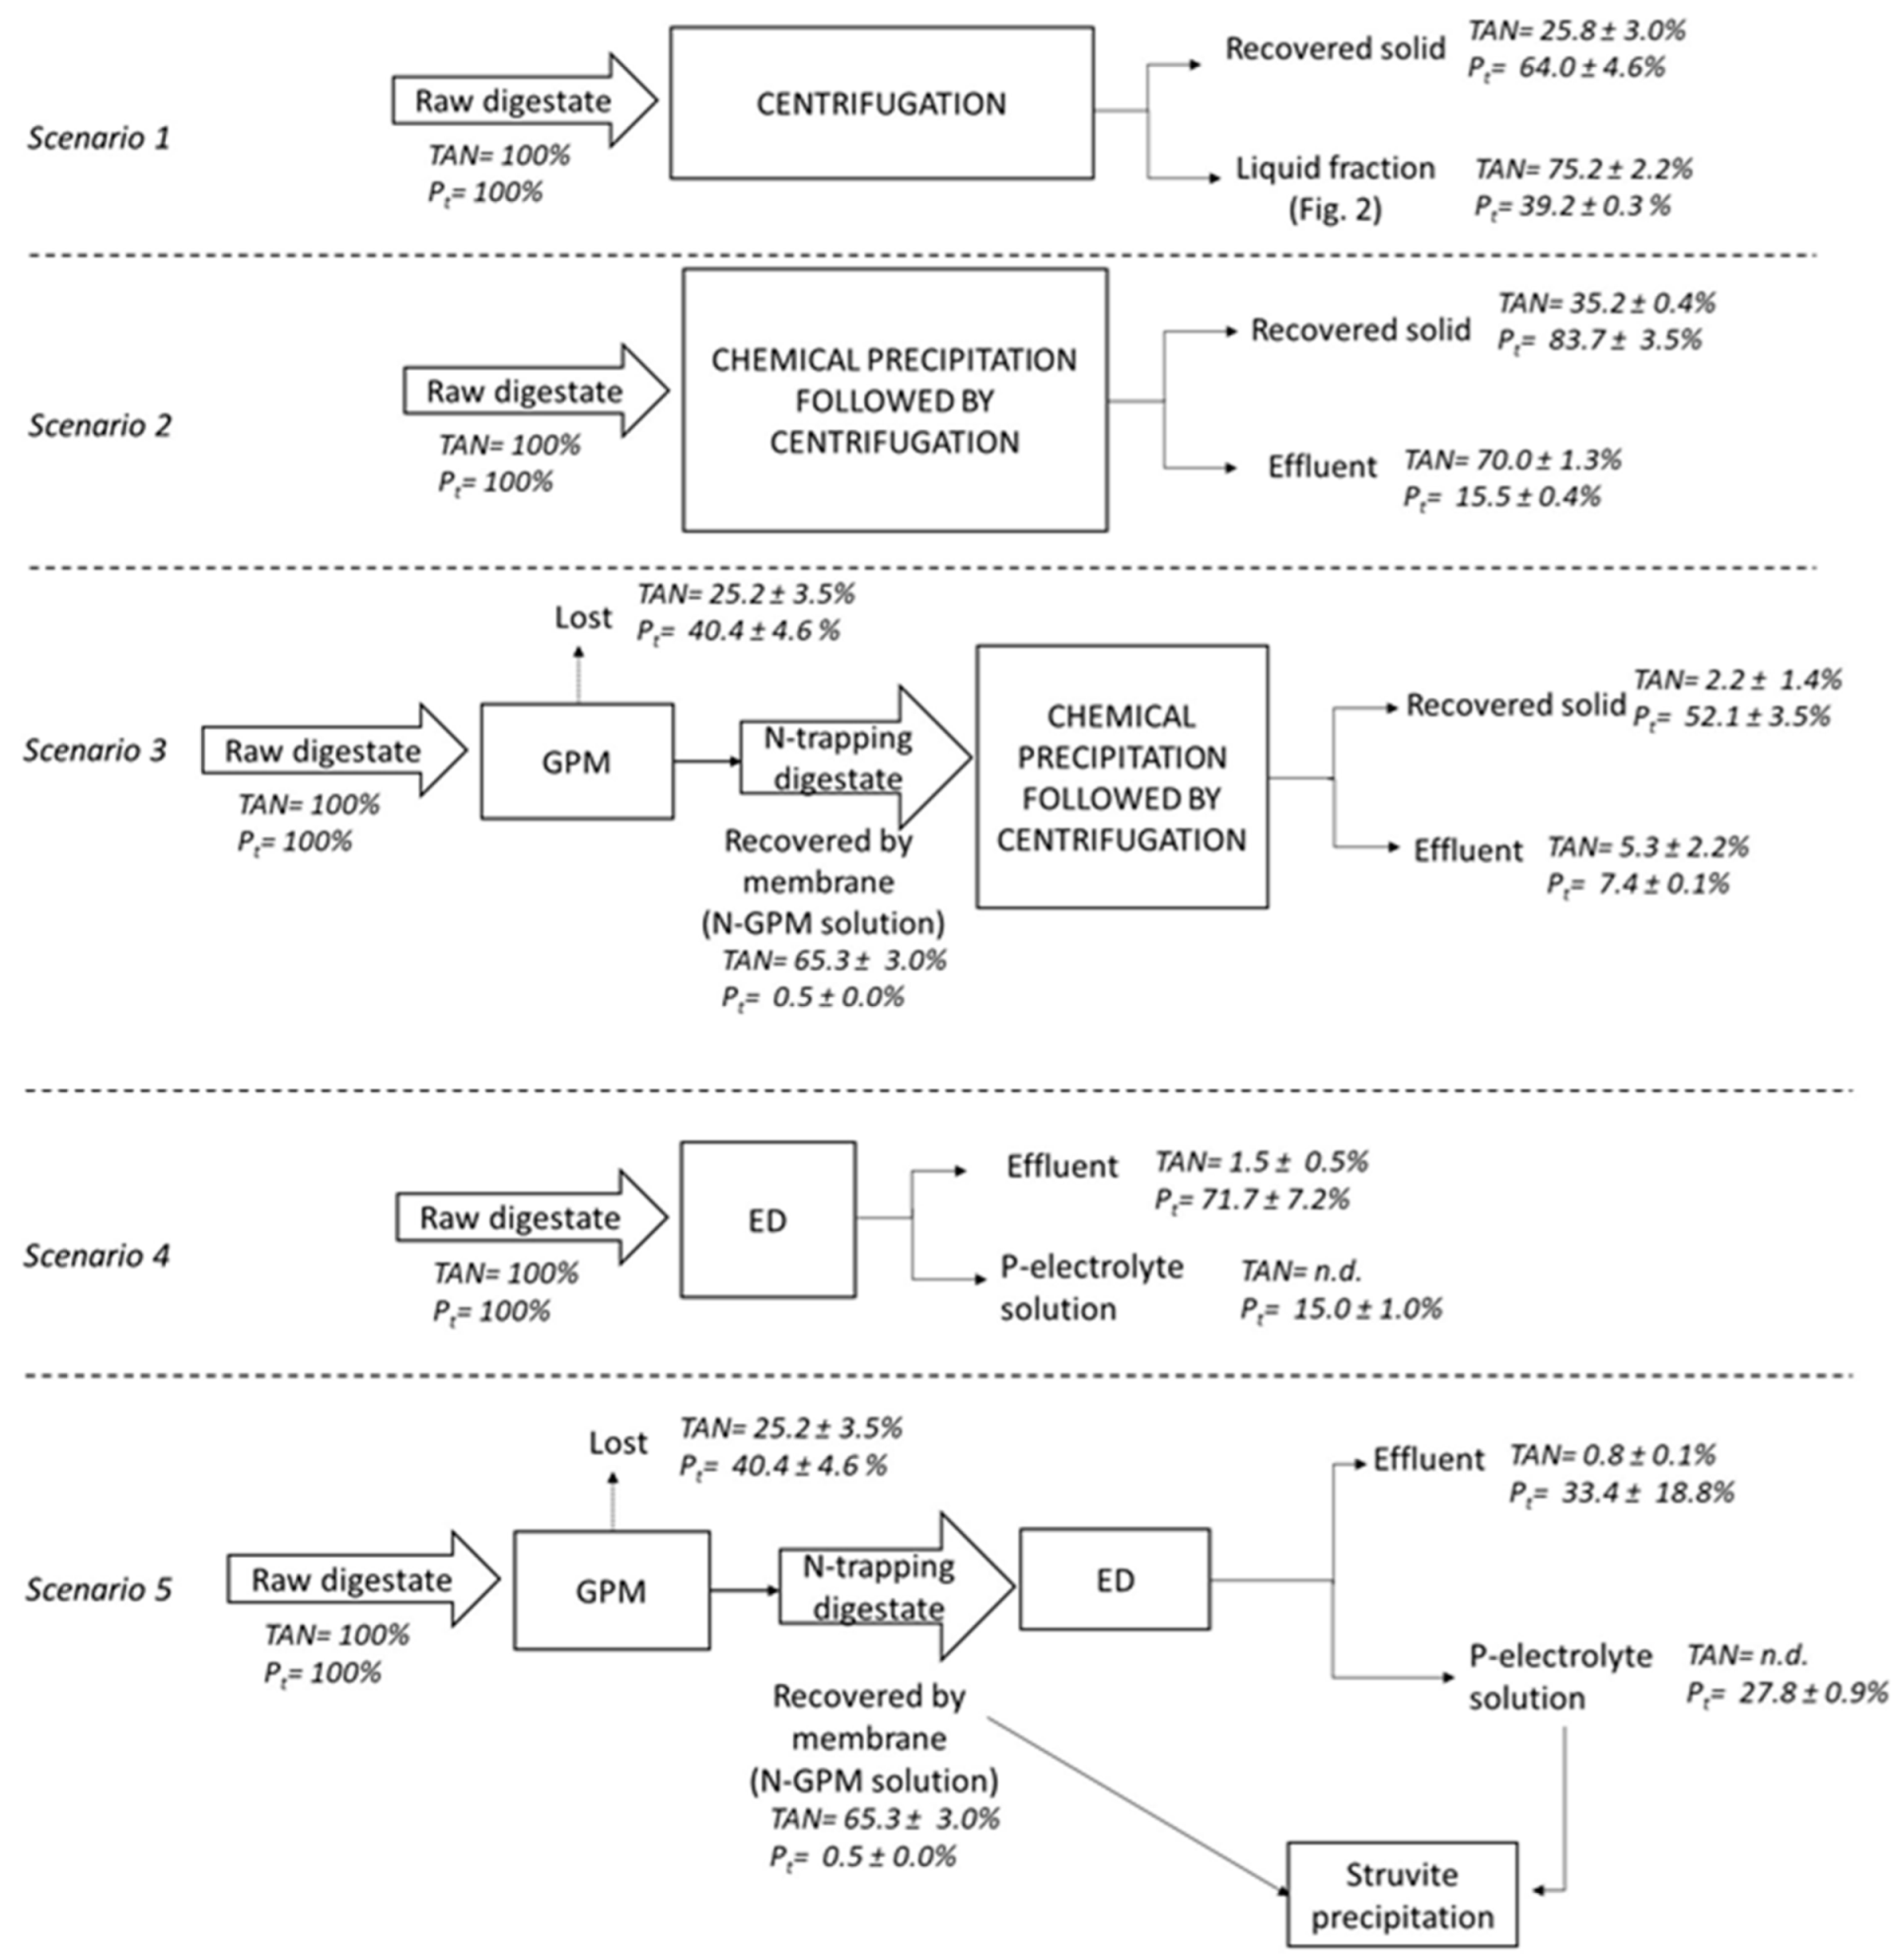
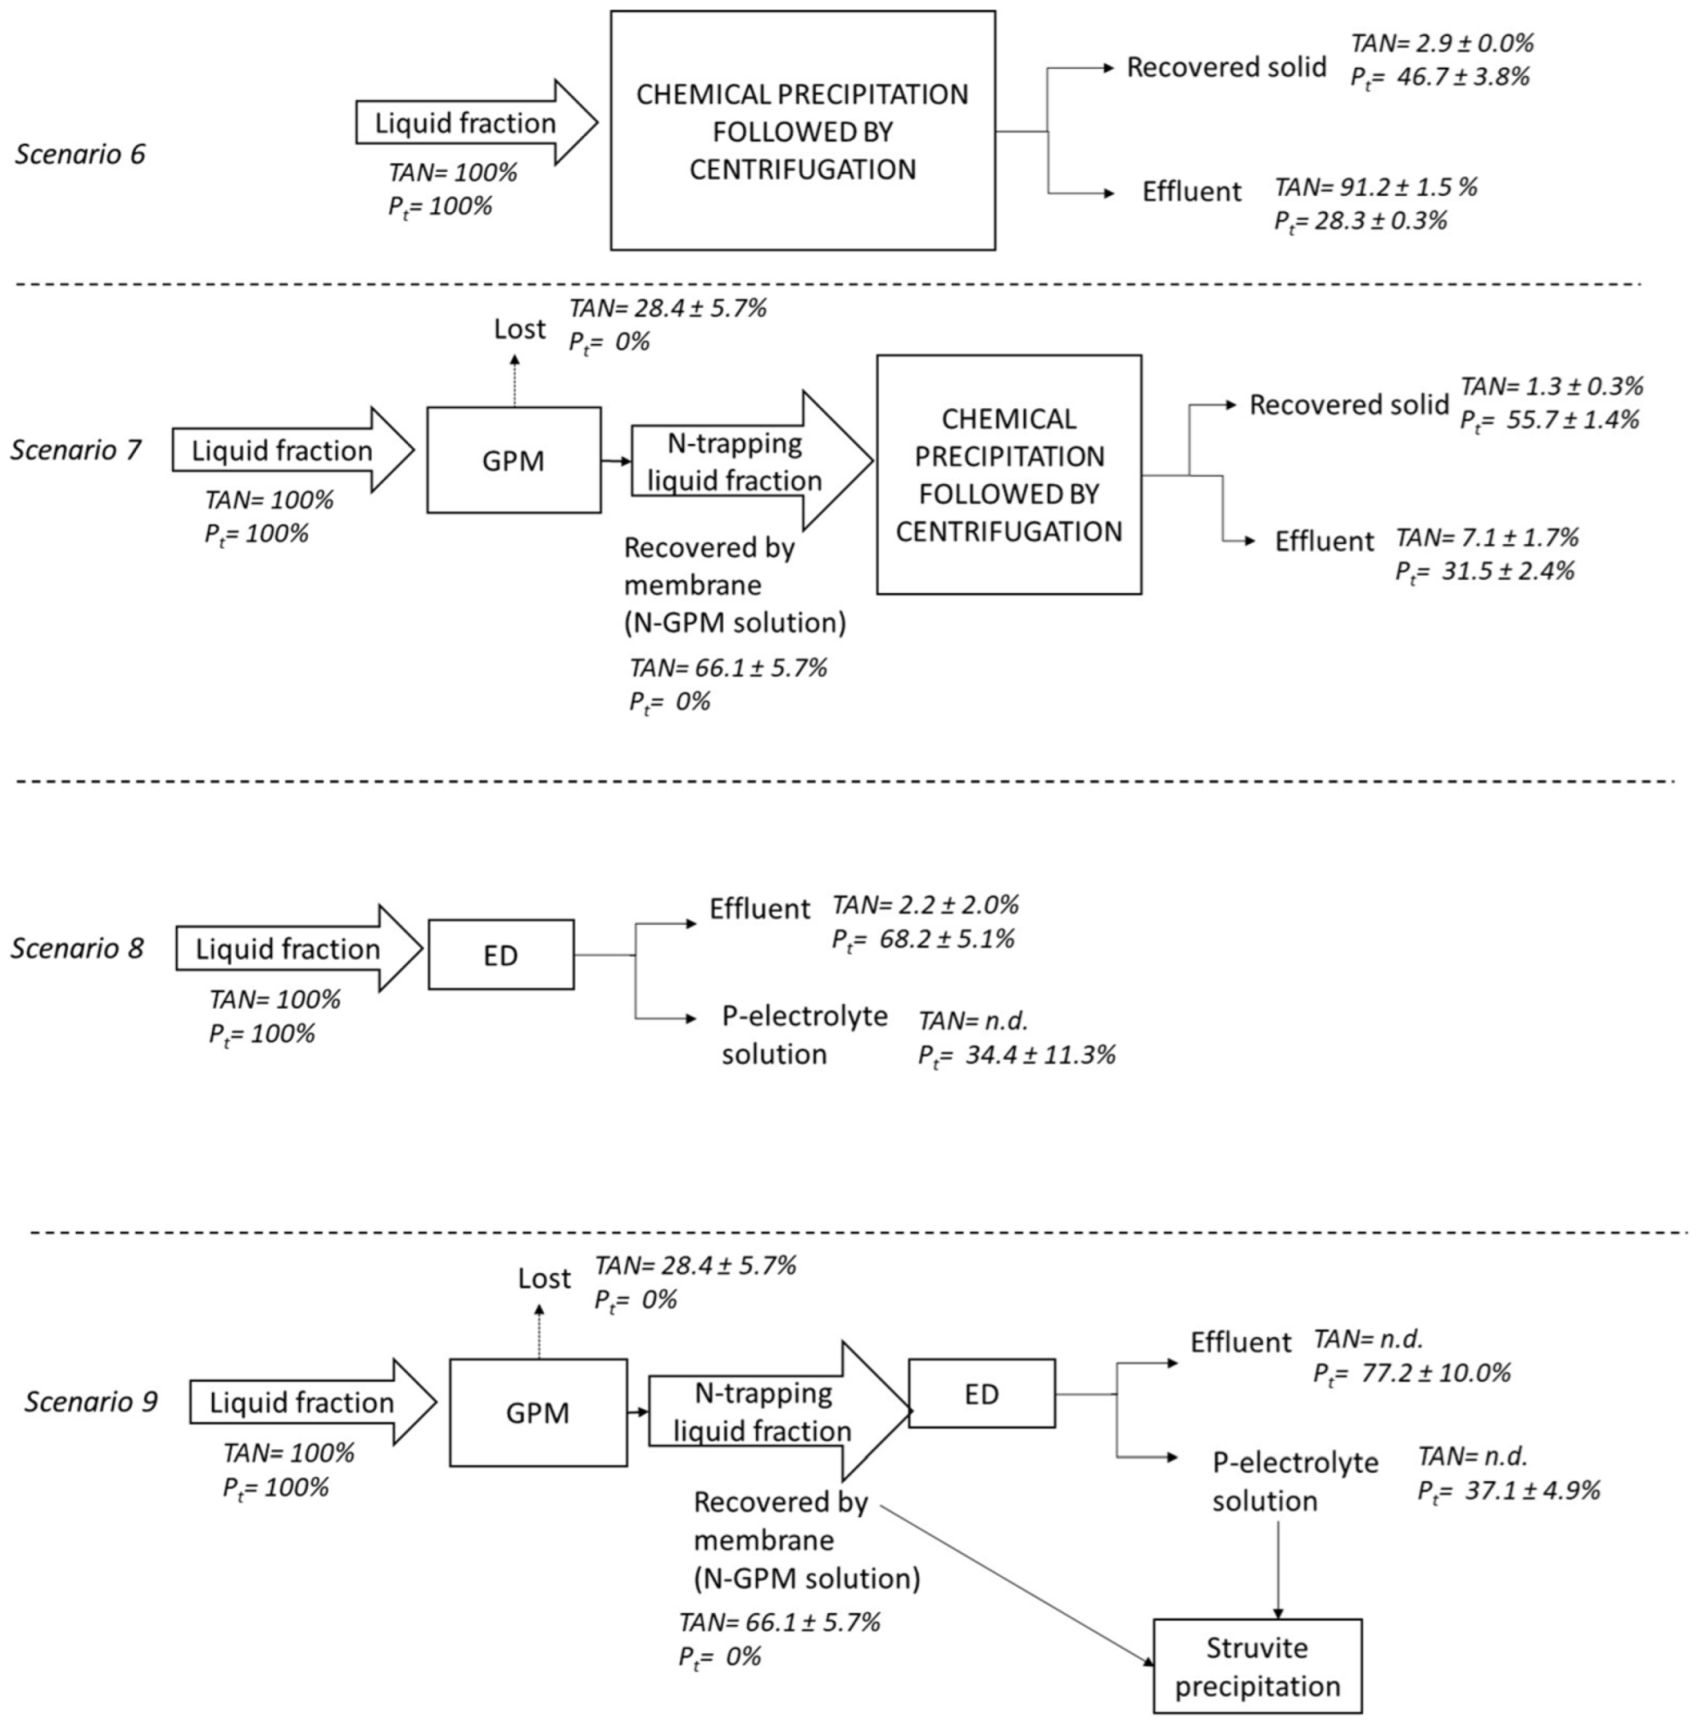
2.2. Nutrient Recovery Scenarios

Nine different scenarios were tested for the recovery of nutrients from the raw digestate (Figure 1) and from the liquid fraction (Figure 2). Specifically, for the raw digestate, the scenarios studied were as follows: (1) centrifugation of raw digestate to obtain solid and liquid fractions; (2) chemical precipitation from the raw digestate followed by centrifugation; (3) N recovery from raw digestate using GPM technology and further chemical precipitation from the N-trapping digestate (i.e., the effluent after the application of the GPM-technology for the recovery of N from digestate); (4) P recovery from the raw digestate using the ED process; and (5) a combination of N recovery from digestate using GPM technology and P recovery using ED from the N-trapping digestate and further secondary struvite formation by mixing the N-GPM solution and the P-electrolyte solution (i.e., the electrolyte after the application of the ED for the recovery of P from the N-trapping solution).
For the liquid fraction after the centrifugation of the raw digestate, the following are the scenarios studied: (6) chemical precipitation from the liquid fraction followed by centrifugation; (7) N recovery from the liquid fraction using GPM technology and further chemical precipitation from the N-trapping liquid fraction (i.e., the effluent after the application of the GPM-technology for the recovery of N from the liquid fraction); (8) P recovery from the liquid fraction through the ED process; and (9) a combination of N recovery from the liquid fraction using GPM technology and P recovery using the ED process from the N-trapping liquid fraction and further struvite formation by mixing the N-GPM solution and the P-electrolyte solution (i.e., the electrolyte after the application of the ED for the recovery of P from liquid fraction). A description of the different techniques is set out in the following Section 2.3, Section 2.4 and Section 2.5.

2.3. N and P Recovery by Chemical Precipitation

N and P recovery was performed by chemical precipitation from the raw digestate (scenario 2), the liquid fraction (scenario 6), from the N-trapping digestate (scenario 3) and the N-trapping liquid fraction (scenario 7), as well as from the P-electrolyte solutions obtained after the ED process (scenarios 5 and 9). The chemical precipitation process was mainly carried out based on the approach outlined by Oliveira et al. [11]. The quantities of N and Mg introduced in each test were determined according to a molar ratio of Mg:N:P set at 2:2:1. Briefly, the Mg and/or N sources were introduced into 150 mL of the sample, and, while stirring, the pH was quickly adjusted to approximately 9 using 5M NaOH. MgCl2 (as MgCl2·6H2O, Panreac) was added as the precipitating agent in all experiments. The N source used in the experiments of scenarios 5 and 9 was the N-GPM solution obtained after GPM technology. A N source was not needed as the ratio TAN:Pt was higher than 2:1 in the experiments from scenarios 2, 3, 6, and 7 (Table 1). The adjustment of the pH to around 9 was not needed in the raw digestate or in the liquid fraction experiments from scenarios 2 and 6 as the initial pH was higher than 9 (Table 1). The suspension was stirred for 1 min and then the stirrer speed was reduced to slow stirring for 60 min to promote the formation and growth of mineral crystals. The suspension was then centrifuged at 5000 rpm (Centrifuge Digtor20, Ortoalresa, Spain) for 5 min.
In scenarios 2, 3, 6, and 7, the total phosphorous (Pt), TAN, and weight were determined in the liquid fractions and in the solid fractions after centrifugation. The N and P recovery efficiency was calculated as follows (Equations (1) and (2)).
TAN recovery efficiency (%) = mass of TAN recovered in the solid fraction/initial mass of TAN in the substrate × 100
P recovery efficiency (%) = mass of P recovered in the solid fraction/initial mass of P in the substrate × 100
For the struvite precipitation assays from the P-electrolyte solutions, resulting from the experiments of scenarios 5 and 9, the efficiency of P precipitation was defined as the amount of P precipitated from the solution (measured as the difference between the initial and final mass of P) divided by the initial amount of P in the solution (Equation (3)).
P precipitated (%) = (initial mass of P in the solution − final mass of P in the solution)/initial mass of P in solution × 100

2.4. N Recovery Experiments Using Gas-Permeable Membrane (GPM)

The N recovery from the raw digestate and from the liquid fraction was carried out under batch conditions. The experimental system included a reactor with a total working volume of 1.5 L (16 cm diameter and 17.5 cm in height) (Figure 3A), as previously described by González-García et al. [19]. The acid reservoir used for TAN capture was a 500 mL Erlenmeyer flask filled with 100 mL of 1 N HCl solution. Ammonium ions were thus recovered in the form of ammonium chloride salt for further struvite precipitation. This strong acid was also used by Oliveira et al. [11], reaching high N recoveries with no detection of membrane degradation. This acidic solution was continuously recirculated using a peristaltic pump (Pumpdrive 5001, Heidolph, Schwabach, Germany) at a flow rate of 11 L d−1 through a tubular GPM submerged inside the reactor. This membrane was made from expanded polytetrafluoroethylene (e-PTFE) and was supplied by Zeus Industrial Products Inc. (Orangeburg, SC, USA). It had a total length of 3.10 m and an outer diameter of 5.2 mm. The membrane’s properties included a density of 0.95 g/cm3, a wall thickness of 0.64 mm, porosity below 60%, and an average pore size of 12.7 ± 5.9 µm. The initial TAN load per membrane surface area was 211 g N/m2 for the raw digestate and 204 g N/m2 for the liquid fraction. The reactor’s contents were continuously stirred using magnetic stir bars. Aeration was supplied at a rate of 0.24 L of air per liter per minute via an air pump (Hailea Aco-2201, Guangdong, China), with a porous stone diffuser installed at the reactor’s base whenever the pH of either the digestate or liquid fraction dropped below 8.5. The airflow was monitored and adjusted using a flow meter (Aalborg, Orangeburg, NY, USA).
Each day, 3 mL of the acidic solution and 10 mL of the substrate were collected to track changes in pH and TAN levels. Furthermore, samples were taken at the beginning and end of the process from both the digestate and the liquid phase to measure total alkalinity, total solid (TS), volatile solid (VS), total Kjeldahl nitrogen (TKN), Pt, metals (copper, zinc, cadmium, nickel, chrome, manganese), and cations (calcium, magnesium, potassium and sodium). The effluent from these experiments after N removal, namely, N-trapping digestate and N-trapping liquid fraction, were used to evaluate the efficiency of the recovery of P by chemical precipitation (Section 2.3) and by ED (Section 2.5). The acidic solution (namely, the N-GPM solution) was used as the N source for the chemical precipitation in scenario 9, as described in Section 2.3.
In each set of experiments, the TAN removal, the TAN recovery efficiency, and the average TAN recovery rate by the GPM system, were calculated according to Equations (4)–(6) as follows.
TAN removal (%) = (Initial mass of TAN − Final mass of TAN)/(Initial mass of TAN) × 100
TAN recovery efficiency (%) = Final mass of TAN in the acidic solution/mass of TAN removed from the substrate × 100
Average TAN recovery (g N m−2 day−1) = mass of TAN recovered in the acidic solution/m2 of membrane and days of experiment × 100

2.5. Phosphorous Recovery by the ED Process

The ED experiments were carried out in a stirred (LBX OS20 series) three-compartment cylindrical Plexiglas cell (8 cm internal diameter) as previously outlined in González-García et al. [18]. The cell was divided into an anolyte compartment (5 cm), a central compartment (10 cm), and a catholyte compartment (5 cm) (Figure 3B). The central compartment contained 450 mL-raw digestate (scenario 4), or N-trapping raw digestate (scenario 5), or liquid fraction (scenario 8), or N-trapping liquid fraction (scenario 9). The anolyte and catholyte compartments contained 500 mL 0.01 M NaNO3. Platinum-coated titanium electrodes (3 mm diameter, 5 cm length) were positioned in the anolyte and catholyte compartments. An anion exchange membrane (AEM; AR204R, SUEZ GE Water and Process Technology, Madrid, Spain) separated the anolyte and central compartments while a cation exchange membrane (CEM; CR67R, SUEZ GE Water and Process Technology) separated the central and catholyte compartments [11]. This setup slows down pH fluctuations in the central compartment, while permitting P and heavy metals into the anolyte and catholyte, respectively [11]. A constant current of 50 mA was maintained using a Hewlett Packard E3612A (HP Agilent, Santa Clara, CA, USA) power supply. The sodium nitrate solution was recirculated between each electrode compartment and an external glass reservoir using magnet pumps (PAN WORLD CO. NH-5PX, Mitsukaido Yamadamachi, Japan) to dissipate gases generated during electrode reactions and prevent the accumulation of concentrated ions layers near the membranes [20]. The ED experiments with raw digestate (scenario 4) and the liquid fraction (scenario 8) ran for 8 days, with N-trapping raw digestate (scenario 5) for 5 days, and with the N-trapping liquid fraction (scenario 9) for 4 days. The experiments were stopped when the voltage value reached the equipment’s maximum capacity, making it impossible to maintain the reference current of 50 mA, or when the electrical conductivity of the raw digestate and N-trapping raw digestate, as well as of the liquid fraction of the digestate and the N-trapping liquid fraction, was near zero, indicating that no more ions were available for electromigration. All the experiments were performed in duplicate.
Regular monitoring of the pH and electrical conductivity (using HANNA Combo probe, Póvoa do Varzim, Portugal) and the Pt concentration was conducted for the raw digestate, the liquid fraction, and the N-trapping effluents, as well as for the anolyte solutions. To prevent metal hydroxide precipitation near the CEM, 1:1 nitric acid (HNO3) was added to the cathode compartment as required. Voltage and current were also recorded daily. Upon completion of the experiment, the substrates and electrolyte volumes were measured and the AEM and CEM, as well as the electrodes, were immersed in 1 M and 5 M nitric acid solutions for 48 h, respectively, to recover any adsorbed P. The Pt concentration was determined in all the solutions at the end of the ED experiments. The P extraction efficiency during the ED process was calculated as the ratio of Pt in the final anolyte to the initial Pt content in the raw digestate (scenario 4), or the N-trapping digestate (scenario 5), or the liquid fraction (scenario 8), or the N-trapping liquid fraction (scenario 9), expressed as a percentage (Equation (7)) [19].
P extraction efficiency (%) = mass of Pt in the anolyte solution at the end of ED/initial mass of Pt in the substrate × 100
The P-electrolyte solutions obtained after the ED process were then used for the chemical precipitation process described in Section 2.3.

2.6. Analytical Methods

Analyses of TS, VS, CODt TKN, and TAN were carried out in duplicate, following the procedures outlined in the APHA Standard Methods [21]. To determine TS, the sample was dried at 105 °C until a stable weight was achieved. The remaining solids were then combusted at 550 °C until a constant weight was reached, with the weight loss during combustion representing the VS content. TAN levels were determined using the distillation and titration method, while TKN was assessed through Kjeldahl digestion followed by distillation, and titration. The total alkalinity was estimated by recording the volume of 0.1 N H2SO4 required to lower the digestate sample’s pH to 4.5, expressed as mg CaCO3 L−1. The concentration of heavy metals (Zn, Ni, Cd, Cr, Cu, and Mn), cations (Ca2+, Mg2+, K+, and Na+), and Pt in the substrates was determined through microwave acid digestion (model CEM MARSX) using 65% HNO3, followed by analysis using inductively coupled plasma (ICP)—Optical Emission Spectrometry, in line with EPA Method 6010D (ICP-OES, 193 Thermo Scientific, Waltham, MA, USA) [22].
TAN and P recovery results were statistically evaluated using one-way analysis of variance (ANOVA), with significance set at p < 0.05, to identify any significant differences.

3. Results and Discussion

3.1. Characterization of the Raw Digestate

The raw digestate used in this study presented a TS content of 41.5 g kg−1 (Table 1), with an average VS/TS ratio value of approximately 66%, which is consistent with the observation made by Akhiar [23]. The pH was alkaline, which could be a result of the degradation of slaughterhouse waste, which usually has a high protein content [24]. In this sense, the raw digestate presented a very high N content compared to other anaerobic digestates produced in agro-industrial biogas plants [17,18]. The combination of alkaline pH and high N content would favor ammonia emissions to the atmosphere during land application as an organic fertilizer, as well as during the GPM treatment. In addition, the TAN:Pt molar ratio was 1:0.03 (Table 1), which would be short of P to cover certain crop requirements [25]. Therefore, the capture of N through the application of the GPM technology could balance digestate nutrient content, enhancing the fertilizing properties of the digestate and reducing the N losses in the environment.

3.2. Nutrient Separation Efficiency of the Centrifugation (Scenario 1)

After the centrifugation of the raw digestate, the solid fraction represented only 22.5% of the initial fresh weight of the raw digestate but contained a high Pt concentration (1595 mg kg−1) (Table 2) that represented 64.0% of the Pt content of the raw digestate (Figure 1, scenario 1). This fits well with Drosg et al. [8], who reported that 55 to 65% of the Pt present in pig manure digestate is found in the solid fraction. The TAN level of the solid fraction was 8519 mg kg−1 (Table 2), which represented about 25.8% of the TAN content in the raw digestate. This solid fraction presented good properties for compost production or for transport over long distances as a concentrated fertilizer [5]. However, the solid fraction retained most of the heavy metals contained in the raw digestate, with an estimated percentage of 70, 85, 72, 79, and 53% of the heavy metals Zn, Cu, Mn, Cd, and Cr, respectively, which poses a risk of soil and water contamination. The liquid fraction represented 77.5% of the initial fresh weight of the raw digestate, retaining most of the TAN contained in the raw digestate (75.2%) and around 39% of the Pt (Figure 1, scenario 1). The TAN:Pt molar ratio of the liquid fraction was 1:0.02 (Table 1), thus increasing the excess of N for covering crop requirements when used as organic fertilizer compared to the raw digestate [22]. The concentration of Na+ and K+ in the liquid fraction was similar to the concentration in the raw digestate; whereas the concentrations of Ca2+ and Mg2+ were highly reduced in comparison with the concentration in the raw digestate; thus, these cations were mainly retained in the solid fraction (Table 1). This is in accordance with the observation made by Popovic et al. [26], who indicated that centrifugation of the digestate removed dry matter and P effectively but is less capable of removing N and K. The presence of high cation concentrations, such as Ca2+ or Na+ in the liquid fraction, can negatively affect the further chemical P precipitation [27,28].

3.3. Effect of the Solid–Liquid Separation on Nutrient Recovery by Chemical Precipitation (Scenarios 2 and 6)

As described in Section 3.2, after centrifugation, the solid fraction contained 64.0% of the initial mass of Pt contained in the raw digestate. With the addition of a Mg salt (MgCl2), an increment in the recovery of Pt to values up to 83.7% was observed in the solid fraction (Figure 1, scenario 2). This yield was similar to—or even higher than—those obtained by other authors under similar conditions. For example, Corona et al. [30] achieved P recovery yields from digestate between 82% and 98% at pH values of 9.0–9.5, and at a Mg:P ratio of 1.5. Chemical precipitation in the liquid fraction obtained after solid–liquid separation of the raw digestate resulted in a lower Pt recovery efficiency (46.7%) (Figure 2, scenario 6).
TAN recovery in the solid fraction improved slightly with the chemical addition, as compared to the centrifugation of the raw digestate, accounting for 25.8% in scenario 1 and 35.2% in scenario 2, respectively (Figure 1, scenario 1 vs. scenario 2). For the liquid fraction, the N recovery efficiency in scenario 6 (Figure 2) was also lower (2.9%) than in scenario 1. The lower nutrient recovery efficiencies after the precipitation of the liquid fraction, compared to those obtained with the raw digestate, suggested that for scenarios 1 and 2, Pt and TAN could be recovered in the solid fraction as part of the organic compounds or in a dissolved form rather than as precipitates. In this sense, Mazzini et al. [31] studied the phosphorous speciation during anaerobic digestion and the subsequent solid–liquid separation. They found that the larger amount of available P flowed to the solid fraction more than in the liquid fraction. In the present study, the estimated amount of struvite per wet mass of the solid fraction was higher for scenario 6 than for scenarios 1 and 2 (Table 2), although they were relatively low for all the scenarios when compared to other studies [29]. In this sense, some authors have reported the hindrance of anaerobic digestate manure to struvite precipitation, which is generally attributed to high concentrations of Ca2+ ions and suspended solids, high ionic strength, high alkalinity, and low soluble reactive P relative to total P [9]. For instance, Moerman et al. [32] found that during the start-up of full-scale plant processing, anaerobic digestated dairy manure struvite was not precipitated due to Ca interference, and only a mixture of struvite and amorphous Ca and Mg phosphates was obtained after reducing the digester effluent Ca2+: PO43− molar concentration ratio from 2.69 to 1.36. Other authors forced struvite precipitation by greatly increasing the Mg: PO43− and PO43−: NH4+ molar ratios in the anaerobic digestion of dairy manure up to 23 and 1.25, respectively [33]. These ratios are very high compared to those used in the present study (Mg:N:P of 2:2:1), where the high cation concentrations present in both the raw digestate and the liquid fraction (Table 1) could interfere with the struvite formation.

3.4. Performance of GPM Technology for Nutrient Recovery from Raw Digestate and the Liquid Fraction (Scenarios 3 and 7)

For both substrates (raw digestate and liquid fraction), a TAN removal of 90% was reached after about 20–21 days of GPM treatment (Figure 4A). During this period, the TAN was reduced from an initial concentration of 7402 ± 66 mg N L−1 to 697 ± 232 mg N L−1 in the raw digestate and from 7179 ± 86 mg N L−1 to 595 ± 3 mg N L−1 in the liquid fraction. The removal presented a uniform linear trend (R2 of 0.9646 and 0.9722 for the raw digestate and the liquid fraction, respectively), as illustrated in Figure 4A. Simultaneously, the TAN levels in the acidic solution rose quickly during the initial days, reaching concentrations between 11,000 and 16,000 mg N L−1 in both experiments (Figure 4B). These concentrations remained approximately constant throughout the experimental period due to the transfer of water vapor across the membrane (a process known as osmotic distillation), as previously described by Darestini et al. [34]. TAN recovery through the membrane steadily increased until approximately day 15, after which the amount of TAN recovered in the acidic solution plateaued, showing minimal to no further recovery (Figure 4C). This behavior followed a second-order curve, similar to what was observed by García-González and Vanotti [35]. The mass of TAN present in the substrate and recovered as ammonium salt accounted for 65.3% for the raw digestate (Figure 1, scenarios 3 and 5) and 66.1% for the liquid fraction (Figure 2, scenarios 7 and 9).
During the first week, the TAN recovery rate was 9.5 ± 0.5 g N m−2 d−1 for the raw digestate and 12.7 ± 1.4 g N m−2 d−1 for the liquid fraction. These values were within the range (8.4–13.9 g N m−2 d−1) of those obtained by González-García et al. [19], who tested the recovery of ammonia from digestate by membrane technology under different membrane area ratios and alkali addition. No significant differences (p > 0.05) were observed for the N recovery efficiency between the digestate and the liquid fraction. These findings demonstrated that the performance of GPM technology for N recovery was not affected by the solid content of the substrate. González-García et al. [19] evaluated the use of GPM technology for the recovery of N from high-solid-content digestate (higher than 80 g TS L−1), obtaining N recovery efficiencies of 80%. In the present study, aeration was only required from day 11 of experimentation with the raw digestate and from day 15 day with the liquid fraction, when the pH was lower than 8.5 due to the removal of NH3 by the GPM, which increases the acidity of the substrate. Consequently, the energy requirement of the GPM process would be low due to the high initial pH of the raw digestate and the liquid fraction.
The pH values after the GPM treatment (8.00 for the N-trapping digestate and 7.85 for the N-trapping liquid fraction; ) (Table 1) were not high enough to effectively precipitate the P with MgCl2 without the addition of alkali (NaOH). Regarding the concentration of heavy metals and cations, no significant changes were observed between the raw digestate and the liquid fraction and the respective N-trapping effluents (Table 1).
The combination of GPM technology with chemical precipitation resulted in high N recoveries (Figure 1, scenario 3; and Figure 2, scenario 7). Specifically, the N-recovery was almost two-fold higher in scenario 3 than in scenarios 1 and 2. In the case of the liquid fraction, the application of the GPM technology before chemical precipitation allowed for the overall N recovery of 67.4% (scenario 7), which is around 23-fold more than with the direct application of chemical precipitation in scenario 6. In addition, applying GPM technology as an initial step improved P recovery efficiency through chemical precipitation, enabling the recovery of 88.0% and 57.9% of the Pt present in the N-trapping digestate and N-trapping liquid fraction, respectively (Table 3). This is because the application of the GPM technology to remove ammonia from livestock wastewater favors the conditions for P precipitation by applying a metal salt, such as a lower concentration of NH4+ and a lower alkalinity [36]. However, during the GPM treatment, the Pt concentration decreased from 561 mg L−1 to 334 mg L−1 in the raw digestate (Table 1). This reduced the overall P recovery efficiency of scenario 3 as compared to scenarios 1 and 2 (Figure 1) for raw digestate. For the liquid fraction, no changes in the Pt concentration were evidenced after the application of the GPM technology (Table 1). Thus, an important aspect to investigate in future research is the undesirable loss of P during the GPM application, which has also been detected in other long-term experiments. For example, García-González and Vanotti [35] documented losses reaching as high as 55% during the recovery of NH4+ from pig manure in a 30-day trial using GPM. This reduction was not observed in other studies with shorter experimental durations, such as Vanotti et al. [36]. Therefore, to avoid this, the first step of the GPM application should be carried out over short periods of time.

3.5. Nutrient Recovery by ED Technology from Raw Digestate and Liquid Fraction (Scenarios 4 and 8)

Initially, the raw digestate contained 561 mg kg−1 of Pt, while the liquid fraction had 242 mg kg−1. By the end of the experiments, these levels had decreased to 431 mg kg−1 and 84 mg kg−1, respectively, as shown in Figure 5A. In experiments with raw digestate, the pH value started at 8.67 ± 0.03 and concluded at 3.66 ± 0.32 (Figure 6A). The voltage rapidly decreased at first then remained stable for several days. Around day 6, it began to increase sharply, eventually reaching the equipment’s maximum capacity (Figure 6B). At this point, the experiment was stopped as it became impossible to maintain the reference current of 50 mA. The electrical conductivity of the raw digestate dropped to 0.23 ± 0.10 mS cm−1 (Figure 6C), suggesting a depletion of ions available for electromigration. The liquid fraction experiments started with a similar initial pH (8.57 ± 0.05) to the raw digestate but ended slightly more acidic at 3.01 ± 0.1 (Figure 6A). These experiments also demonstrated similar trends in voltage and electrical conductivity to those observed in the raw digestate experiments (Figure 6B,C).
In the raw digestate experiments, the initial mass of Pt was 259.67 ± 0.48 mg, while the liquid fraction experiments started with 111.41 ± 4.71 mg of Pt. Upon completion of the experiments, the anolyte contained 39.46 ± 4.06 mg and 38.03 ± 11.01 mg of Pt for raw digestate and liquid fraction, respectively. These results translate to P recovery efficiencies of 15 ± 2% for raw digestate and 34 ± 11% for the liquid fraction. The recovery of Pt in the anolyte showed a linear trend (R2 of 0.9497 and 0.9925, for the raw digestate and the liquid fraction), as illustrated in Figure 5B. The observed difference in recovery efficiencies between raw digestate and the liquid fraction is significant and aligns with findings by Ebbers et al. [37], who reported higher P extraction efficiencies from the liquid fraction of sewage sludge using ED separation. This disparity likely stems from the different physical and chemical properties of the two matrices, with the liquid fraction allowing for easier ion migration in the electric field. However, the overall recovery efficiencies achieved in this study are lower than those reported by González-García et al. [18], who achieved P recovery rates of 74% from anaerobically digested swine manure, or by Guedes et al. [38], who achieved P recovery rates of up to 79% using a two-compartment ED cell on sewage sludge ash. The relatively low recovery efficiency from raw digestate (15 ± 2%) suggests that a significant portion of P may be bound to organic matter or trapped within solid particles, limiting its availability for electromigration. This observation is consistent with the work of Ottosen et al. [39], who demonstrated the challenges of P recovery from sewage sludge using ED separation due to complex P-binding forms. Furthermore, the high variability in recovery efficiency for the liquid fraction (34 ± 11%) indicates that the process may be sensitive to small variations in experimental conditions or the composition of the sample. This variability underscores the need for robust process control and optimization.

3.6. Effect of Prior GPM on Nutrient Recovery by ED (Scenarios 5 and 9)

In scenarios 5 and 9, the P recovery was conducted on the N-trapping raw digestate and the N-trapping liquid fraction, using the ED process. This approach, which involves prior removal of ammonium ions, aims to enhance the P recovery efficiency. At the beginning of the experiments, the N-trapping raw digestate contained 331.44 mg kg−1 of Pt, while the N-trapping liquid fraction had 243.00 mg kg−1 of Pt. At the end of the experiments, the concentrations of Pt had decreased to 195.11 mg kg−1 and 55.80 mg kg−1, respectively, as illustrated in Figure 5A.
For the N-trapping raw digestate experiments, the pH decreased from an initial value of 8.32 ± 0.69 to 3.35 ± 0.24 (Figure 6A). The voltage profile (Figure 6B) showed an initial rapid decrease followed by a sharp increase after day 2, reaching the equipment’s maximum capacity. The experiment was ended when maintaining the 50 mA reference current became unfeasible. The electrical conductivity of the N-trapping raw digestate decreased to 0.22 ± 0.14 mS cm−1 (Figure 6C), indicating ion depletion.
The N-trapping liquid fraction experiments exhibited a lower initial pH (7.51 ± 0.30) as compared to the N-trapping raw digestate but concluded at a similar final pH (3.41 ± 0.01). The voltage and conductivity trends mirrored those of the N-trapping raw digestate experiments (Figure 6B,C), suggesting comparable electrochemical behaviors despite the different initial compositions.
Regarding P recovery, the N-trapping raw digestate experiments started with 150.30 ± 11.84 mg of Pt, while the liquid fraction experiments began with 110.93 ± 4.14 mg. Post-treatment, the anolyte contained 71.97 ± 2.05 mg and 41.02 ± 3.89 mg of Pt for the N-trapping raw digestate and the N-trapping liquid fraction, respectively. These results correspond to P recovery efficiencies of 48 ± 5% for the N-trapping raw digestate and 37 ± 5% for the N-trapping liquid fraction. The P extraction efficiency for the N-trapping raw digestate significantly surpasses that of raw digestate without prior GPM treatment (scenario 4), which means the removal of the ion NH4+ from the wastewater improves the further recovery of P via the ED process as it reduces the number of soluble ions present [11,18]. In addition, the removal of ammonium ions before ED reduces competition between NH4+ and other cations, which should, in theory, enhance P recovery. However, the presence of other competing ions, such as Ca2+, Mg2+, and Fe3+, may still influence phosphate mobility. The higher efficiency in the N-trapping raw digestate as compared to the N-trapping liquid fraction (48 ± 5% vs. 37 ± 5%) suggests that the GPM treatment may have additional beneficial effects on the solid fraction, possibly by altering P binding forms or improving P release during the ED process. This difference in recovery rates may also be influenced by ion-reaction mechanisms, particularly the interactions between phosphate and other coexisting ions during the ED process. The ED process creates concentration gradients that drive ion migration. If the phosphate interacts with other charged species in solution, it may form ion pairs or complexes that are less mobile under the applied electric field. In N-trapping raw digestate, the presence of organic macromolecules may alter ion transport by forming weak complexes with phosphate, preventing its loss to precipitation. In contrast, in the N-trapping liquid fraction, with fewer organic interactions, phosphate ions may be more susceptible to aggregation with counter-ions, limiting P recovery. Further studies on these ion-reaction mechanisms are necessary to fully understand their role in the observed efficiency differences.
In scenarios 5 and 9, the recovery efficiencies achieved in these two scenarios are lower than those reported by some researchers using a different ED process. For example, González-García et al. [18] obtained recovery efficiencies for N and P of 94% and 74% from anaerobically digested swine manure. This highlights potential areas for process optimization, such as adjusting cell design or operational parameters, etc.
Struvite was precipitated using the P recovered from ED and the N recovered from GPM. For the N-trapping raw digestate experiments, the percentage of P precipitated was around 85%; while for the N-trapping liquid fraction, it was 78%. The precipitation efficiencies achieved in this study are promising, falling within the range reported by Rahman et al. [40], and they allowed for a potentially high struvite quality to be recovered without interference in comparison to the product obtained through direct precipitation (Table 2).

3.7. Overall Discussion

Regarding nitrogen recovery, the application of the gas-permeable membrane technology has shown a great potential as compared to centrifugation or chemical precipitation, both for the raw digestate and the liquid fraction. The previous solid–liquid separation did not interfere with the N recovery, which implies important advantages for its industrial application. Recovering N incorporated in waste contributes to saving natural resources (fossil fuels consumed during the production of synthetic fertilizers) and to the circular bio-waste economy. The N-rich solution obtained with a well-known N concentration will reduce the cost of transportation for its application compared to that required for the raw digestate and the liquid fraction. The most critical point would be the reduction of the Pt content in the N-trapping effluent in comparison to the initial substrate, which requires further research. However, an improvement in P recovery could be seen after the application of GPM by centrifugation and ED, which is due to the removal of competitive cations.
Regarding phosphorous recovery, chemical precipitation is affected by solid–liquid separation, with the highest P recovery results obtained from the raw digestate. The previous centrifugation step seems to recover, in the solid fraction, reactive P forms that reduce the further chemical precipitation of P from the liquid fraction. On the other hand, ED showed limitations for P recovery from such high strength raw digestate, likely due to the high cation concentrations of the digestate used in the present study. In this case, the prior solid–liquid separation, as well as the ammonium removal, enhanced phosphorous recovery. In spite of that, the recovery efficiencies attained in this study were low compared to other works.
The integration of GPM technology with the ED process demonstrated enhanced nutrient recovery potential through struvite precipitation. For the N-trapping raw digestate experiments, the precipitation efficiency showed marked improvements compared to conventional single-technology approaches without GPM removal. This can be attributed to (i) the enhanced P concentration and reduced interference due to the removal of competing ions and impurities that typically inhibit struvite formation; this selective removal process may create more optimal conditions for P and the remaining N to combine with magnesium during the precipitation process; (ii) solution chemistry optimization due to the creation of a more favorable ionic strength and solution composition; the removal of certain ionic species through the ED process may have reduced the ionic strength of the solution, which typically enhances struvite crystallization by reducing solubility.
Compared to other nutrient recovery technologies applied to digestate, the GPM and ED processes present the lowest estimated operational costs [18]. The main concern regarding the scaling-up of these technologies is the high investment costs and possible membrane fouling. In the case of the GPM technology, membrane soiling did not impact the TAN recovery in long-term trials [41]. For ED, although membrane fouling occurs, it is not as severe as in pressure-driven membrane filtration systems and can be solved through periodic polarity reversal [42]. The struvite precipitation efficiency using the solutions obtained after the GPM and ED processes is comparable to those reported for some commercially available struvite recovery technologies worldwide (70–95%) [43]. All these insights are very promising when considering an industrial scale-up of the technologies.

4. Conclusions

TAN was successfully recovered from raw digestate and the liquid fraction using GPM technology, with values near 65–66%, regardless of the solid content. This process improved the P recovery by ED due to the removal of ammonia ions. On the other hand, the performance of the ED could be enhanced by the prior solid–liquid separation of the raw digestate. However, the high cation concentration in the digestate interfered in the Pt recovery efficiency by ED. The combination of both membrane technologies offers the possibility of obtaining secondary struvite of high quality with an efficiency of 85%, in contrast to the precipitate obtained through direct chemical precipitation, with a low estimated struvite content. In this way, nutrient-rich solutions obtained by ED and GPM were converted into a solid fertilizer, whose transportation would, in theory, be cheaper, and the application would also be easier than in the case of liquid fertilizers. Future studies should prioritize optimizing process conditions and improving struvite precipitation.

Author Contributions

Conceptualization, B.R. and V.O.; methodology, B.R. and V.O.; software, B.R.; validation, B.R. and V.O.; formal analysis, B.R. and V.O.; investigation, B.R. and V.O.; resources, B.R. and V.O.; data curation, B.R. and V.O.; writing—original draft preparation, B.R. and V.O.; writing—review and editing, B.R., V.O., B.M.-S., M.C.G.-G. and C.D.-F.; visualization, B.R. and V.O.; supervision, B.R.; project administration, B.R.; funding acquisition, B.R. and V.O. All authors have read and agreed to the published version of the manuscript.

Funding

This work has been funded by the National Institute of Research and Agro-Food Technology (INIA) and co-financed with FEDER funds (PID2019-106148RR-C41).

Institutional Review Board Statement

Not applicable.

Informed Consent Statement

Not applicable.

Data Availability Statement

Data are contained within the article.

Acknowledgments

B. Molinuevo-Salces thanks the AEI for the financial support through the grant RYC-2020-029030-I/AEI/10.13039/501100011033. V. Oliveira gives thanks for the National funding by FCT—Foundation for Science and Technology, P.I., through the institutional scientific employment program contract (doi: 10.54499/CEECINST/00077/2021/CP2798/CT0002).

Conflicts of Interest

The authors declare no conflicts of interest.

References

  1. Ren, Y.; Yu, M.; Wu, C.; Wang, Q.; Gao, M.; Huang, Q.; Liu, Y. A comprehensive review on food waste anaerobic digestion: Research updates and tendencies. Bioresour. Technol. 2017, 247, 1069–1076. [Google Scholar] [PubMed]
  2. Amini, A.; Aponte-Morales, V.; Wang, M.; Dilbeck, M.; Lahav, O.; Zhang, Q.; Cunningham, J.A.; Ergas, S.J. Cost-effective treatment of swine wastes through recovery of energy and nutrients. Waste Manag. 2017, 69, 508–517. [Google Scholar] [PubMed]
  3. Ma, H.; Guo, Y.; Qin, Y.; Li, Y.Y. Nutrient recovery technologies integrated with energy recovery by waste biomass anaerobic digestion. Bioresour. Technol. 2018, 269, 520–531. [Google Scholar]
  4. Peng, W.; Lü, F.; Hae, L.; Zhang, H.; Shao, L.; He, P. Digestate management for high-solid anaerobic digestion of organic wastes: A review. Bioresour. Technol. 2020, 297, 122485. [Google Scholar]
  5. Campos, J.L.; Crutchik, D.; Franchi, O.; Pavissich, J.P.; Belmonte, M.; Pedrouso, A.; Mosquera-Corral, A.; Val del Río, A. Nitrogen and phosphorus recovery from anaerobically pretreated agro-food wastes: A review. Front. Sustain. Food Syst. 2019, 2, 91. [Google Scholar]
  6. Al Seadi, T.; Drosg, B.; Fuchs, W.; Rutz, D.; Janssen, R. Biogas digestate quality and utilization. In The Biogas Handbook; Wellinger, A., Murphy, J., Baxter, D., Eds.; Woodhead Publishing Limited: Sawston, UK, 2013; pp. 267–301. [Google Scholar]
  7. Delzeit, R.; Kellner, U. The impact of plant size and location on profitability of biogas plants in Germany under consideration of processing digestates. Biomass Bioenerg. 2013, 52, 43–53. [Google Scholar]
  8. Drosg, B.; Fuchs, W.; Al Seadi, T.; Madsen, M.; Linke, B. Nutrient Recovery by Biogas Digestate Processing; Daxter, IEA Bioenergy: Paris, France, 2015; pp. 7–11. [Google Scholar]
  9. Otieno, B.; Funani, C.K.; Khune, S.M.; Kabuba, J.; Osifo, P. Struvite recovery from anaerobically digested waste-activated sludge: A short review. J. Mater. Res. 2023, 38, 3815–3826. [Google Scholar]
  10. Wang, F.; Fu, R.; Lv, H.; Zhu, G.; Lu, B.; Zhou, Z.; Wu, X.; Chen, H. Phosphate Recovery from Swine Wastewater by a Struvite Precipitation Electrolyzer. Sci. Rep. 2019, 9, 8893. [Google Scholar] [CrossRef] [PubMed]
  11. Oliveira, V.; Dias-Ferreira, C.; González-García, I.; Labrincha, J.; Horta, C.; García-González, M.C. A novel approach for nutrients recovery from municipal waste as biofertilizers by combining electrodialytic and gas permeable membrane technologies. Waste Manag. 2021, 15, 293–302. [Google Scholar]
  12. Romero-Güiza, M.S.; Astals, S.; Mata-Álvarez, J.; Chimenos, J.M. Feasibility of coupling anaerobic digestion and struvite precipitation in the same reactor: Evaluation of different magnesium sources. Chem. Eng. J. 2015, 270, 542–548. [Google Scholar] [CrossRef]
  13. Tao, W.; Fattah, K.P.; Huchzermeier, M.P. Struvite recovery from anaerobically digested dairy manure: A review of application potential and hindrances. J. Environ. Manag. 2016, 169, 46–57. [Google Scholar] [CrossRef] [PubMed]
  14. Santos, A.F.; Mendes, L.S.; Alvarenga, P.; Gando-Ferreira, L.M.; Quina, M.J. Nutrient Recovery via Struvite Precipitation from Wastewater Treatment Plants: Influence of Operating Parameters, Coexisting Ions, and Seeding. Water 2024, 16, 1675. [Google Scholar] [CrossRef]
  15. Ottosen, L.M.; Jensen, P.E.; Kirkelund, G.M. Electrodialytic separation of phosphorous and heavy metals from two types of sewage sludge ash. Sep. Sci. Technol. 2014, 49, 1910–1920. [Google Scholar] [CrossRef]
  16. Guedes, P.; Couto, N.; Mateus, E.P.; Ribeiro, A.B. Phosphorus recovery in sewage sludge by Electrokinetic based technologies: A multivariate and circular economy view. Waste Biomass Valoriz. 2017, 8, 1587–1596. [Google Scholar] [CrossRef]
  17. Fillingham, M.; Vanderzaag, A.C.; Singh, J.; Burtt, S.; Crolla, A.; Kindsley, C.; McDonald, J.D. Characterizing the performance of gas-permeable membranes as an ammonia recovery strategy from anaerobically digested dairy manure. Membranes 2017, 7, 59. [Google Scholar] [CrossRef]
  18. González-García, I.; Oliveira, V.; Molinuevo-Salces, B.; García-González, M.C.; Dias-Ferreira, C.; Riaño, B. Two-phase nutrient recovery from livestock wastewaters combining novel membrane technologies. Biomass Conv. Bioref. 2022, 12, 4563–4574. [Google Scholar] [CrossRef]
  19. González-García, I.; Riaño, B.; Molinuevo-Salces, B.; García-González, M.C. Effect of alkali and membrane area on the simultaneous recovery of nitrogen and phosphorous from digestate by membrane technology and chemical precipitation. Sustainability 2023, 15, 3909. [Google Scholar] [CrossRef]
  20. Ebbers, B.; Ottosen, L.M.; Jensen, P.E. Comparison of two different electrodialytic cells for separation of phosphorus and heavy metals from sewage sludge ash. Chemosphere 2014, 125, 122–129. [Google Scholar]
  21. American Public Health Association. Standard Methods for the Examination of Water, Waste Water APHA, 21st ed.; American Water Works Association and Water Environment Federation: Denver, CO, USA; American Public Health Association: Washington, DC, USA, 2005. [Google Scholar]
  22. USEPA. SW-846 Test Method 6010D: Inductively Coupled Plasma-Optical Emission Spectrometry (ICP-AES); Test Method 6010D; USEPA-Federal Register: Washington, DC, USA, 2014.
  23. Akhiar, A. Characterization of Liquid Fraction of Digestates After Solid-Liquid Separation From Anaerobic Co-Digestion Plants; English. ffNNT: 2017MONTS004ff. fftel-01684830f; Chemical and Process Engineering, Université Montpellier: Montpellier, France, 2017. [Google Scholar]
  24. Palatsi, J.; Viñas, M.; Guivernau, M.; Fernandez, B.; Flotats, X. Anaerobic digestion of slaughterhouse waste: Main process limitations and microbial community interactions. Bioresour. Technol. 2011, 102, 2219–2227. [Google Scholar] [CrossRef]
  25. Antezana, W.; De Blas, C.; García-Rebollar, P.; Rodríguez, C.; Beccaccia, A.; Ferrer, P.; Cerisuelo, A.; Moset, V.; Estellés, F.; Cambra-López, M.; et al. Composition, potential emissions and agriculture value of pig slurry from Spanish commercial farms. Nutr. Cycl. Agroecosyst. 2016, 104, 159–173. [Google Scholar] [CrossRef]
  26. Popovic, O.; Gioelli, F.; Dinuccio, E.; Rolle, L. Centrifugation of digestate: The effect of chitosan on separation efficiency. Sustainability 2017, 9, 2302. [Google Scholar] [CrossRef]
  27. Enyemadze, I.; Momade, F.W.Y.; Oduro-Kwarteng, S.; Essandoh, H. Phosphorous recovery by struvite precipitation: A review of the impact of calcium on struvite quality. J. Water Sanit. Hyg. Dev. 2021, 11, 706–718. [Google Scholar]
  28. Kabdasli, I.; Atalay, Z.; Tünay, O. Effect of solution composition on struvite crystallization. J. Chem. Technol. Biotechnol. 2017, 92, 2921–2928. [Google Scholar]
  29. González-Morales, C.; Fernández, B.; Molina, F.J.; Naranjo-Fernández, D.; Matamoros-Veloza, A.; Camargo-Valero, M.A. Influence of pH and Temperature on Struvite Purity and Recovery from Anaerobic Digestate. Sustainability 2021, 13, 10730. [Google Scholar] [CrossRef]
  30. Mazzini, S.; Borgonovo, G.; Scaglioni, L.; Bedussi, F.; D’Imporzano, G.; Tambone, F.; Adani, F. Phosphorous speciation during anaerobic digestion and subsequent solid/liquid separation. Sci. Total Environ. 2020, 734, 139284. [Google Scholar] [CrossRef] [PubMed]
  31. Corona, F.; Hidalgo, D.; Martín-Marroquín, J.M.; Meers, E. Study of pig manure digestate pre-treatment for subsequent valorisation of struvite. Environ. Sci. Pollut. Res. 2021, 28, 24731–24743. [Google Scholar]
  32. Moerman, W.; Carballa, M.; Vanderkerckhove, A.; Derycke, D.; Verstraete, W. Phosphate removal in agro-industry: Pilot and full-scale operational considerations of struvite crystallization. Water Res. 2009, 43, 1887–1892. [Google Scholar] [CrossRef]
  33. Zheng, L.; Xiaomei, L. Nutrient removal from anaerobically digested cattle manure by struvite precipitation. J. Environ. Eng. Sci. 2006, 5, 285–294. [Google Scholar]
  34. Darestani, M.; Haigh, V.; Couperthwaite, S.J.; Millar, G.J.; Nghiem, L.D. Hollow fibre membrane contactors for ammonia recovery: Current status and future development. J. Environ. Chem. Eng. 2017, 5, 1349–1359. [Google Scholar]
  35. Garcia-González, M.; Vanotti, M. Recovery of ammonia from swine manure using gas-permeable membranes: Effect of waste strength and pH. Waste Manag. 2015, 38, 455–461. [Google Scholar] [CrossRef]
  36. Vanotti, M.B.; Dube, P.J.; Szogi, A.A.; García-González, M.C. Recovery of ammonia and phosphate minerals from swine wastewater using gas-permeable membranes. Water Res. 2017, 112, 137–146. [Google Scholar] [PubMed]
  37. Ebbers, B.; Ottosen, L.M.; Jensen, P.E. Electrodialytic treatment of municipal wastewater and sludge for the removal of heavy metals and recovery of phosphorus. Electrochim. Acta 2015, 181, 90–99. [Google Scholar]
  38. Guedes, P.; Couto, N.; Ottosen, L.M.; Ribeiro, A.B. Phosphorus recovery from sewage sludge ash through an electrodialytic process. Waste Manag. 2014, 34, 886–892. [Google Scholar] [PubMed]
  39. Ottosen, L.M.; Jensen, P.E.; Kirkelund, G.M. Phosphorous recovery from sewage sludge ash suspended in water in a two-compartment electrodialytic cell. Waste Manag. 2016, 51, 142–148. [Google Scholar]
  40. Rahman, M.M.; Salleh, M.A.M.; Rashid, U.; Ahsan, A.; Hossain, M.M.; Ra, C.S. Production of slow release crystal fertilizer from wastewaters through struvite crystallization—A review. Arab. J. Chem. 2014, 7, 139–155. [Google Scholar]
  41. Riaño, B.; Molinuevo-Salces, B.; Vanotti, M.B.; García-González, M.C. Application of gas-permeable membranes for semi-continuous ammonia recovery from swine manure. Environments 2019, 6, 32. [Google Scholar] [CrossRef]
  42. Meng, J.; Shi, X.; Wang, S.; Hu, Z.; Koseouglu-Imer, D.Y.; Lens, P.N.L.; Zhang, X. Application of electrodialysis technology in nutrient recovery from wastewater: A review. J. Water Process Eng. 2024, 65, 105855. [Google Scholar]
  43. Krishnamoorthy, N.; Baishali, D.; Unpaprom, Y.; Ramaraj, R.; Maniam, G.P.; Govindan, N.; Jayaraman, S.; Arunachalam, T.; Paramasivan, B. Engineering principles and process designs for phosphorus recovery as struvite: A comprehensive review. J. Environ. Chem. Eng. 2021, 9, 105579. [Google Scholar]
Figure 1. Description and mass balances of TAN and Pt recovery from the raw digestate in scenarios 1 to 5. n.d.: Not determined.
Sustainability 17 02917 g001
Figure 2. Description and mass balances of TAN and Pt recovery from the liquid fraction after centrifugation in the scenarios 6 to 9. n.d.: not determined.
Sustainability 17 02917 g002
Figure 3. Schematic of the experimental set-up for the use of a GPM to recover TAN from raw digestate and the liquid fraction (A) and the ED process for the recovery of P [12] (B).
Sustainability 17 02917 g003
Figure 4. Performance of GPM for ammonia recovery and removal from raw digestate (Sustainability 17 02917 i001) and from the liquid fraction (Sustainability 17 02917 i002): (A) evolution of the TAN concentration in the raw digestate and in the liquid fraction; (B) TAN concentration in the acidic solution during the GPM treatment of raw digestate and the liquid fraction; and (C) mass of TAN recovered through GPM treatment in the raw digestate and the liquid fraction. Error bars represent the standard deviation.
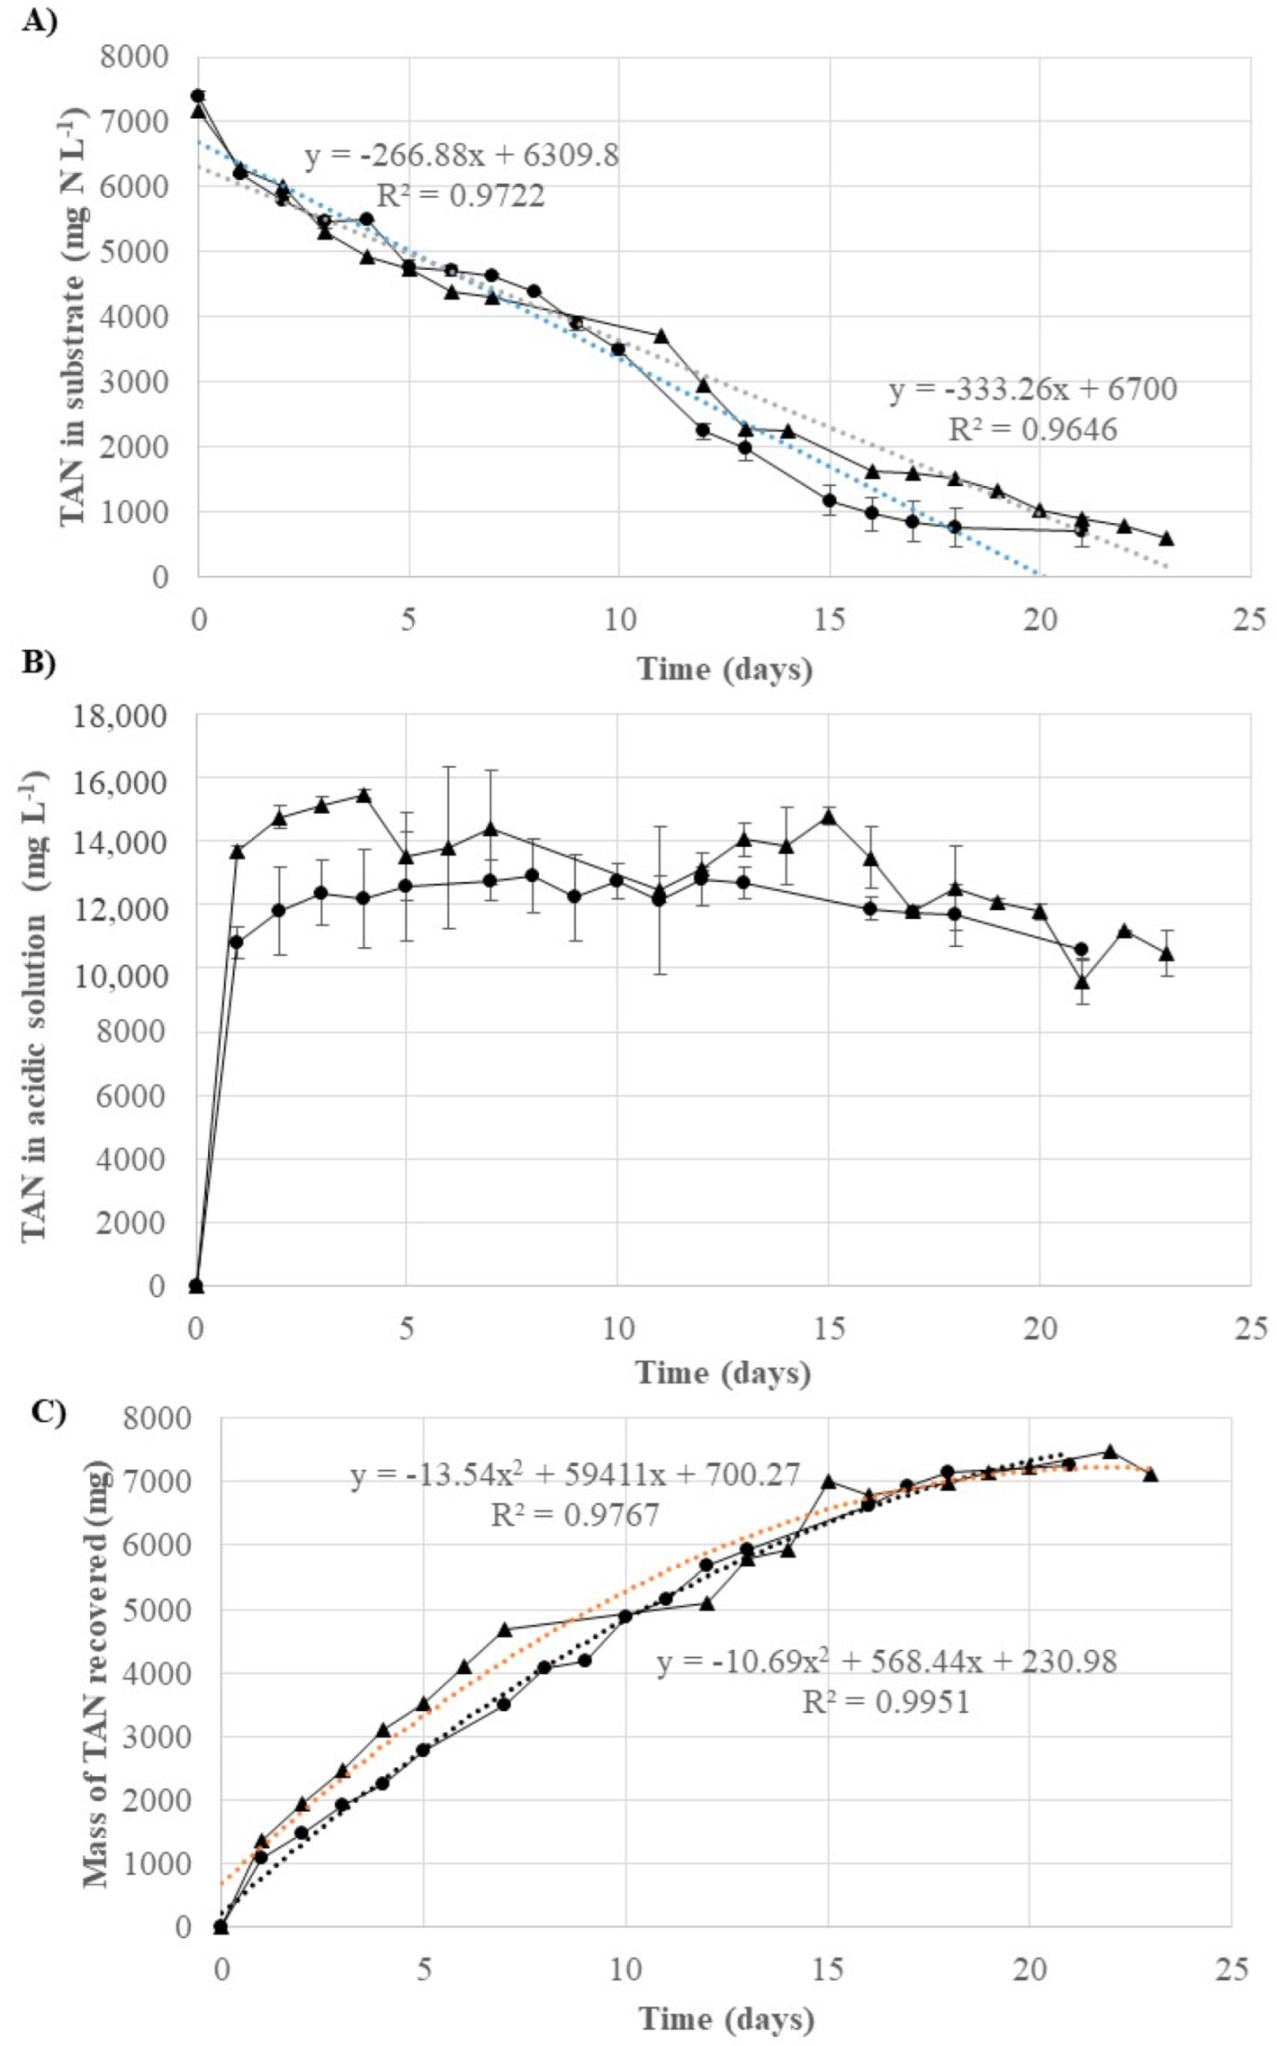
Sustainability 17 02917 g004
Figure 5. Performance of the ED process for P extraction from raw digestate (scenario 4), N-trapping raw digestate (scenario 5), liquid fraction (scenario 8), and N-trapping liquid fraction (scenario 9): (A) evolution of Pt concentration and (B) evolution of Pt concentration in the anolyte.
Sustainability 17 02917 g005
Figure 6. pH (A), voltage (B), and electrical conductivity (C) measured during the ED process of raw digestate (scenario 4), N-trapping raw digestate (scenario 5), liquid fraction (scenario 8), and N-trapping liquid fraction (scenario 9) experiments.
Sustainability 17 02917 g006
Table 1. Chemical characterization of digestate and liquid and solid fractions after centrifugation, as well as N-trapping effluents after GPM treatment.
Raw DigestateLiquid FractionN-Trapping
Digestate
N-Trapping
Liquid Fraction
pH9.47 ± 0.029.32 ± 0.038.00 ± 0.007.85 ± 0.18
Alkalinity (mg CaCO3 L−1)28,283 ± 15626,946 ± 1705343 ± 8235090 ± 155
TS (g kg−1)41.50 ± 0.0427.97 ± 0.0240.90 ± 4.9127.67 ± 0.05
VS (g kg−1)27.60 ± 0.1816.57 ± 0.0025.44 ± 2.7414.96 ± 0.91
TKN (mg kg−1)8520 ± 118173 ± 1062016 ± 5391998 ± 272
TAN (mg kg−1)7402 ± 667179 ± 86697 ± 232595 ± 3
Pt (mg kg−1)561 ± 1242 ± 10334 ± 26236 ± 5
Na (mg kg−1)1848 ± 501758 ± 231741 ± 821677 ± 23
Ca (mg kg−1)270.48 ± 8.9990.50 ± 3.84308.31 ± 13.99117.03 ± 41.22
Mg (mg kg−1)41.24 ± 2.604.08 ± 0.1853.90 ± 1.394.33 ± 0.23
K (mg kg−1)369.00 ± 9.13370.95 ± 15.99354.88 ± 3.87355.97 ± 19.40
Cu (mg kg−1)1.0 ± 0.00.2 ± 0.01.2 ± 0.10.2 ± 0.0
Zn (mg kg−1)4.0 ± 0.11.6 ± 0.15.0 ± 0.42.0 ± 0.1
Cd (µg kg−1)13.2 ± 1.13.7 ± 0.417.8 ± 1.13.7 ± 0.1
Ni (µg kg−1)104.0 ± 3.3121.3 ± 5.7159.5 ± 66.869.5 ± 3.5
Cr (mg kg−1)147.7 ± 6.490.2 ± 2.3154.6 ± 8.547.4 ± 4.6
Mn (mg kg−1)1.65 ± 0.070.60 ± 0.001.95 ± 0.070.55 ± 0.07
Molar ratio TAN:Pt1:0.031:0.021:0.221:0.05
Molar ratio Mg:P1:10.681:46.611:4.861:42.77
Table 2. Composition of the solid fraction obtained in the different scenarios and estimated quantity of the struvite produced.
ScenarioWeight (%)TAN (mg kg−1)TAN
(mmol N kg−1)
Pt
(mg kg−1)
Pt
(mmol kg−1)
Estimated Struvite
(mmol kg−1) a
Estimated Struvite
(g kg−1) b
122.585196081595525212.7
220.812,5008932252737317.8
312.01323952436797919.8
62.97282520394512712731.2
75.534332452436797919.3
a The number of precipitated mmol kg−1 was assumed to be the lowest value between the precipitated mmoles of N and P based on González-Morales et al. [29]. b The struvite per mass of wet solid fraction was estimated as the moles of struvite multiplied by the molar mass of struvite (245 g mol−1).
Table 3. Mass balances for chemical precipitation applied after GPM performance.
Scena-rioTAN BalanceP Balance
N-Trapping (mg N)Effluent
After Centrifugation (mg N)
Solid Fraction After Centrifugation (mg N)Recovery in Solid Fraction (%)N-Trapping (mg)Effluent
After Centrifugation (mg)
Solid Fraction After Centrifugation (mg)Recovery in Solid Fraction (%)
369733815923.03343729288.0
75955149516.02337613557.9
Disclaimer/Publisher’s Note: The statements, opinions and data contained in all publications are solely those of the individual author(s) and contributor(s) and not of MDPI and/or the editor(s). MDPI and/or the editor(s) disclaim responsibility for any injury to people or property resulting from any ideas, methods, instructions or products referred to in the content.

