Article

Sustainable CO2 Storage Assessment in Saline Aquifers Using a Hybrid ANN and Numerical Simulation Model Across Different Trapping Mechanisms

Faculty of Engineering and Applied Science, University of Regina, 3737 Wascana Parkway, Regina, SK S4S 0A2, Canada
*
Author to whom correspondence should be addressed.
Sustainability 2025, 17(7), 2904; https://doi.org/10.3390/su17072904
Submission received: 2 February 2025 / Revised: 9 March 2025 / Accepted: 19 March 2025 / Published: 25 March 2025

Abstract

:
The study represents an innovative method to utilize the strong computational power of CMG-GEM, a numerical reservoir simulator coupled with artificial neural networks (ANNs) to predict carbon storage capacity in saline aquifers. The key parameters in geological storage formations are identified by generating a diverse dataset from CMG-GEM simulation runs by varying the different geological and operational parameters. Robust data analysis was performed to understand the effects of these parameters and access the different CO2 trapping mechanisms. One of the significant novelties of this model is its ability to incorporate additional inputs not previously considered in similar studies. This enhancement allows the model to predict all CO2 trapping mechanisms, rather than being limited to just one or two, providing a more holistic and accurate assessment of carbon sequestration potential. The generated dataset was used in MATLAB to develop an ANN model for CO2 storage prediction across various trapping mechanisms. Rigorous testing and validation are performed to optimize the model, resulting in an accuracy of 98% using the best algorithm, which reflects the model’s reliability in evaluating the CO2 storage. Therefore, the number of simulation runs was significantly reduced, which saves great amounts of computational power and simulation running time. The integration of machine learning and numerical simulations in this study represents a significant advancement in sustainable CO2 storage assessment, providing a reliable tool for long-term carbon sequestration strategies.

1. Introduction

The increasing concentration of CO2 from 280 to 422 ppm in the atmosphere led to an increase in the atmospheric temperature by 1 °C, causing the melting of ice sheets, rising sea levels, loss of habitats, etc. Consequently, global research has concentrated on finding an effective strategy to reduce and mitigate the rise of carbon dioxide (CO2) and greenhouse gas emissions in the atmosphere [1,2,3]. This has resulted in the development of carbon capture and storage (CCS). The successful implementation of CCS as a greenhouse gas emission mitigation strategy relies on the implementation of CO2 sequestration. As such, saline aquifers were considered one of the most promising methods due to their existence in different locations and depths and has huge storage potential. However, the heterogeneity of the geological formations and the complex CO2 dynamics in the different subsurface conditions are the main hurdles facing the accurate and effective prediction of CO2 storage [2,3,4,5,6,7]. Due to the recent advancement in reservoir simulation, modeling CO2 flow in porous media and analyzing the different associated phenomena has become easier, and, as such, CMG-GEM has become very popular in simulations of the various scenarios of CO2 storage [5,6,7].
With recent developments in Artificial Intelligence, artificial neural networks (ANNs) have become a popular technique to model complicated non-linear relations and patterns [6] and are one of the leading techniques used to analyze the output of CMG-GEM simulations. The huge array of generated simulation runs can be used to train and validate the ANN to predict the carbon storage and sequestration potential in saline aquifers with significant accuracy [6,7,8]. Consequently, this study can help when bridging the gap between time-efficient predictive simulation models and detailed numerical simulation evaluations, which takes a long time due to data quality control, optimizing the parameters, and rerunning the model several times. This has resulted in the coupling of CMG-GEM and ANN, and this coupled analysis could be able to analyze the comprehensive dataset generated from the different geological and operational conditions to accurately predict CO2 sequestration under various trapping mechanisms [7,8,9,10]. The importance of the research not only lies in the coupling between the GEM and ANN but also in optimizing injection design and the implementation of CO2 sequestration in saline aquifers, hence contributing to reductions in CO2 levels and mitigating the impact and consequences of climate change, and, consequently, making it a valuable tool for global CCS initiatives. As the demand for sustainable carbon management solutions grows, integrating machine learning with numerical simulations provides a practical and resource-efficient approach to ensuring the long-term viability of CO2 storage [11,12].

2. Carbon Capture and Storage (CCS) in Saline Aquifers

Carbon capture and storage (CCS) is considered one of the most developed technologies in mitigating climate change through reducing atmospheric concentrations of carbon dioxide (CO2), the principal greenhouse gas. The saline aquifers are considered a promising solution among the various options for CO2 storage because of their widespread and huge storage capacity [9,10]. As shown in Figure 1, these underground formations are located deeply onshore and offshore, filled with brine, and considered to have great potential for the secure storage of large amounts of CO2 without exposure to the atmosphere [13,14]. The main geological parameters for adequate storage are the depth, porosity, permeability, and the sealed cap rock to ensure the long-term containment of CO2. Studies have determined several saline formations all over the world, with the tendency to store hundreds to thousands of gigatons of CO2, which can significantly contribute to the different endeavors of mitigating climate change [12,15].
On the other hand, CO2 sequestration in saline aquifers can pose a potential environmental threat, particularly regarding the potential of induced seismicity, cap rock leaks, and contaminated groundwater resources. Therefore, robust site selection, surveillance, monitoring, and proper risk assessment are crucial to checking the surface and subsurface integrity and keeping the environment safe [9,10,16]. Furthermore, worldwide-approved selection criteria and rigorous regulations are essential for the accurate assessment of CO2 storage capacity, long-term injection behavior monitoring, and the feasible economic evaluation of the CCS project [3,9,14,15]. Emerging technologies in geological modeling, monitoring, and surveillance and updated regulatory frameworks can pave the way for tackling these challenges and facilitating the worldwide deployment of CCS in saline aquifers [8,13,17,18].
Figure 1. CCS in saline aquifers [19].
Sustainability 17 02904 g001

2.1. Trapping Mechanisms in CCS

The existence of various efficient trapping mechanisms in the reservoir increases the CCS project’s chance of success and ensures the stable and safe long-term injection of CO2 without it escaping back into the atmosphere. Hence, the accurate evaluation of geological formations is required to understand these mechanisms under various geological conditions and injection strategies and patterns. Figure 2 shows the different trapping mechanisms [9,10,13].

2.1.1. Structural and Stratigraphic Trapping

The primary mechanisms of CO2 trapping are structural and stratigraphic trapping mechanisms, which involve physically containing the CO2 in porous formations under a cap rock [9,13]. Structural trapping occurs when CO2 is injected into a dome-shaped formation and physically trapped under the cap rock. Stratigraphic trapping, on the other hand, occurs when changes in rock properties prevent CO2 from upward migration [15,17].

2.1.2. Residual Trapping

Following injection, the capillary forces cause the CO2 to become immovable in the rock formation’s pore spaces. The process is known as residual trapping and significantly decreases the mobility of CO2 and increases storage security. Furthermore, the risk of large-scale migration and leakage can be reduced over time because the trapped CO2 droplets become isolated from the bulk phase [11,14,18,19].

2.1.3. Solubility Trapping

The formation of water dissolves the CO2, resulting in a more stable, dense phase that has less tendency to move. Parameters like pressure, temperature, and the salinity of the formation water have a significant impact on the process. Over time, the stability of the stored CO2 will increase, as dissolved CO2 is less susceptible to buoyant forces that could push it to the surface [12,14,18,20].

2.1.4. Mineral Trapping

The most permanent CO2 storage was achieved through mineral trapping, where the dissolved CO2 reacts with minerals in the rock formation to create a stable carbonate mineral such as calcite, dolomite, or magnesite. The process effectively locks CO2 permanently into solid mineral forms and is considered the most secure form of CO2 storage, which occurs over longer timescales compared to other mechanisms but significantly contributes to the overall integrity and safety of CCS projects [11,12,19,20,21].
Figure 2. CO2 trapping mechanisms [22].
Sustainability 17 02904 g002

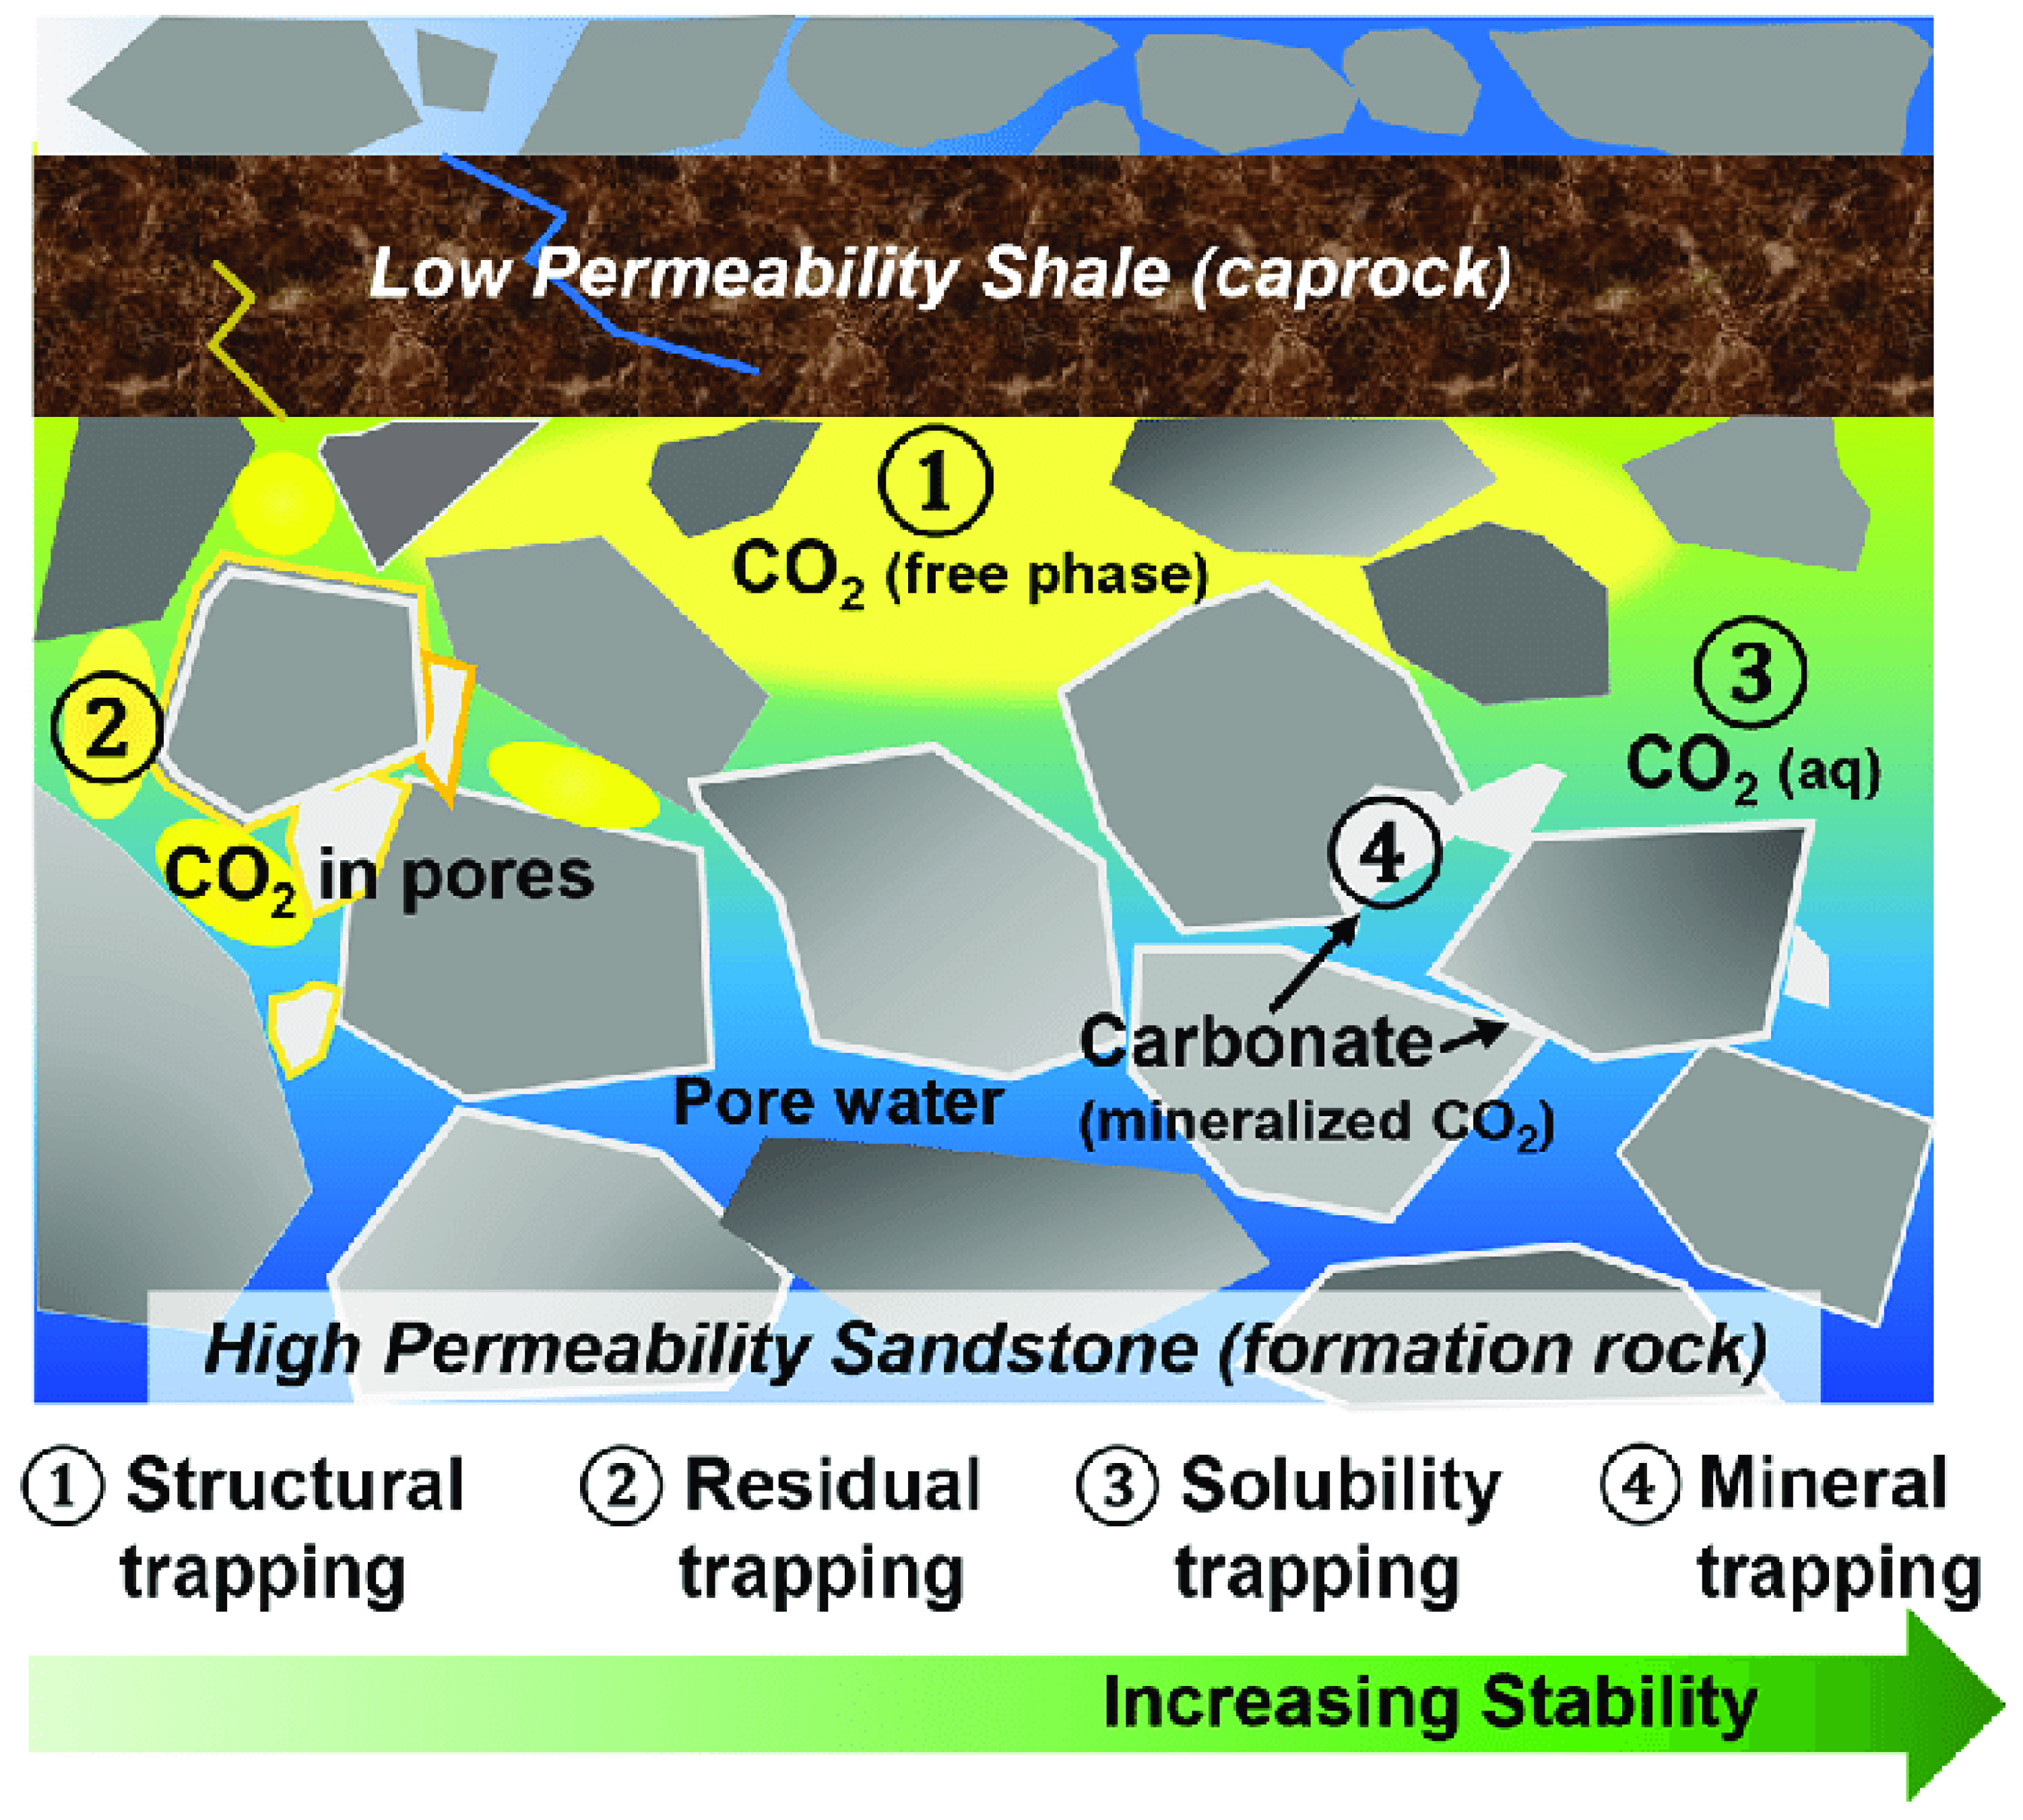
2.2. Importance of Integrated Trapping Mechanisms

Because of the interaction of the various trapping mechanisms, CO2 storage in saline aquifers is generally efficient and secure. As illustrated in Figure 3, structural and residual trapping offers immediate containment in the beginning, while solubility and mineral trapping contribute to long-term stability. Accurate predictions of CO2 behavior depend on the understanding of the timing and dynamics of the different mechanisms and help in the development of effective CCS strategies [10,12,23]. Therefore, thorough research and modeling endeavors to optimize CO2 sequestration potential in saline aquifers are crucial [11,19].

2.3. Utilizing CMG-GEM for CO2 Storage Simulations

The leading-edge simulation tool (CMG-GEM) was generally used in the discipline of carbon capture and storage (CCS) to model the sophisticated processes in CO2 injection and storage in saline aquifers. The advanced simulator delivers a comprehensive analysis of multiphase fluid behavior flow in porous media under varying conditions to design effective and safe CCS injection strategies. The CMG-GEM allows for the modeling of advanced physical processes such as phase changes, reactive transport, and the interaction between CO2, reservoir fluids, and rock matrices [16,22].
The simulation results could help in the optimal storage site selection, CO2 plume migration prediction, trapping mechanisms assessment, and leakage evaluation. In addition, CMG-GEM can analyze the diverse geological formations and simulate different trapping techniques to comprehend the potential for long-term CO2 storage.
It provides detailed insights into the impacts of different geological and operational parameters on CO2 sequestration efficiency [17,23]. Despite its powerful capabilities, there are challenges when simulating large-scale or highly detailed scenarios. The heterogeneity of geological models and the need for extensive data on reservoir characteristics add additional limitations. Consequently, integrating the outcomes of CMG-GEM simulations with other predictive models, such as artificial neural networks (ANNs), holds great promise for advancing CCS evaluation processes to achieve viable and effective contributions toward climate change mitigation strategies [18,19,24,25].

2.4. Predictive Modeling Using Artificial Neural Networks (ANNs)

ANNs are inspired by the biological neural networks that are found in human or animal brains, mimicking the transmission of biological neuron signals to one another, as shown in Figure 4. As such, ANNs are made up of linked nodes, often known as “neurons”, arranged in three levels: an input layer, an output layer, and one or more hidden layers. Each connection between nodes has a specific weight, which is adjusted during the iterative process of the training to reduce the difference between the actual and predicted outputs [6,14,19,25].
In the field of CCS, ANNs became a promising approach for predicting CO2 storage behavior in geological formations, including saline aquifers. ANNs work by training datasets from simulations or experimental observations through which reliable models can be developed to forecast the long-term potential of CO2 injection. Also, it is used for assessing the efficiency of different sequestration strategies and identifying potential risks associated with cap rock leakage or CO2 surface migration [20,26].
Despite the promising applications of ANNs in CCS and other fields, several challenges remain. The main concerns are related to the quality and quantity of data required to train robust and reliable models. In some cases, the availability of high-quality data is a real challenge due to the high costs of acquiring the data, the low data frequency, and the huge uncertainty of the existing data [21,26].
Therefore, one of the solutions to overcome this problem is to search for reliable sources, and a numerical simulation is one of the best techniques to generate extra valid data [21].

2.5. Integration of Simulation Data with ANNs in CCS

The integration of simulation data with artificial neural networks (ANNs) represents a great breakthrough in carbon capture and storage (CCS), coupling powerful machine learning algorithms with simulation tools that have physical modeling capabilities, thus enhancing the ability to forecast outcomes of CO2 sequestration in geological formations and providing a better understanding of CCS processes [18,24].
Simulation tools, such as CMG-GEM, give insights into the physical and chemical processes that drive CO2 injection and storage in saline aquifers, thus generating a huge amount of data and addressing the dynamics of CO2 behavior under diverse scenarios of operational and geological conditions. Although the analysis of a vast amount of data consumes much time and computational power, ANNs can efficiently learn from these relatively lower datasets and provide faster predictions about CO2 storage potential outcomes through learning from patterns and relationships [5,13,17,23].
The synchronization of simulated data with the ANN helps to train the neural networks and leverage detailed geological and process simulations. The integration not only enhances the accuracy of CSS prediction models by integrating complex physical phenomena into the learning process, but also significantly improves computational efficiency. ANNs allow for making rapid predictions once trained, enabling the exploration of a wider range of scenarios and operational strategies without the need for time-consuming simulations for each new set of conditions [17,20,26].
The application can be used to optimize injection strategies, maximizing CO2 storage capacity while understanding the key factors causing the leakage. It can also help in constructing a robust selection criterion for the locations by predicting the response of the different formations to CO2 injection and highlighting the most suitable ones for long-term storage. Furthermore, the approach forecasts the long-term behavior of stored CO2, including migration patterns and the storage capacity under the different trapping mechanisms, which can aid in risk assessment and monitoring plans [20,21,27]. Table 1 displays the most important models related to the prediction of CO2 sequestration and storage (CCS) using machine learning and artificial neural networks (ANNs).
Hence, the main objective of this study is to build a neural network (ANN) model that can accurately predict the storage of CO2 using different trapping methods. The research focused on understanding and highlighting the operational factors that play a crucial role in the CO2 storage process. To achieve this objective, the study relied on CMG GEM to create a dataset covering geological and operational scenarios. The extensive dataset helped the ANN in identifying parameters and their effects, thereby enhancing the model’s capabilities. Consequently, a balance between conducting simulations and ensuring thoroughness in simulations was identified, which involved checks on data quality and the fine-tuning of parameters using multiple iterations.
Table 1. Some important papers of AI and ML applications in the prediction of CO2 sequestration and storage.
Paper TitleDescriptionInput ParametersOutput ParametersKey AdvantagesLimitations
Physics-Based Proxy Modeling of CO2 Sequestration in Deep Saline AquifersThis study uses physics-based proxy modeling with machine learning (ML) to predict CO2 trapping mechanisms’ residual, solubility, and mineral trapping. An expansive dataset generated using a compositional reservoir simulator was used to train and validate four ML models: multilayer perceptron (MLP), random forest (RF), support vector regression (SVR), and extreme gradient boosting (XGB) [12].Basic petrophysical and fluid propertiesResidual, solubility, and structural trapsUses physics-based proxy modelingLimited parameter selection and requires further field-scale validation
Multi-Objective Optimization of CO2 Enhanced Oil Recovery Projects Using a Hybrid Artificial Intelligence ApproachThis study develops a hybrid optimization workflow for CO2—EOR projects considering multiple objective functions. The robustness of the development is confirmed via a field case study. Moreover, this work investigates the relationship between the solutions of the aggregative objective function and the Pareto front, which helps define constraints and reduces the uncertainties involved in the multi-objective optimization process [27].EOR-specific parameters (pressure, injection rates)CO2-EOR-related trapping mechanismsOptimizes CO2-EOR efficiencyNot focused on sequestration
Real-time High-resolution CO2 Geological Storage Prediction using Nested Fourier Neural OperatorsThe study introduces the Nested Fourier Neural Operator (FNO), a machine learning framework designed for the high-resolution, dynamic 3D modeling of CO2 storage at the basin level. This approach uses a hierarchy of FNOs to produce forecasts at varying levels of refinement and accelerates flow predictions by nearly 700,000 times compared to traditional methods. By learning the solution operator for the governing partial differential equations, Nested FNO acts as a versatile alternative to numerical simulators, accommodating diverse reservoir conditions, geological heterogeneity, and injection schemes [28].Geological heterogeneity, injection schemesCO2 flow dynamics (not trapping-specific)faster than traditional simulation modelsRequires significant computational power and requires further field-scale validation
Deep learning-based coupled flow–geomechanics surrogate model for CO2 sequestration This study presents a deep-learning-based surrogate model, the recurrent R-U-Net, for predicting flow and geomechanical responses in CO2 storage operations. Combining convolutional and recurrent neural networks, the model captures the spatial and temporal evolution of CO2 saturation, pressure, and surface displacement fields. Trained on 2000 high-fidelity simulations of storage aquifer realizations, it accurately predicts 3D aquifer dynamics and 2D surface displacement maps, reducing computational demands [29].Flow and geomechanical parametersPressure, saturation, and surface displacementPredicts both subsurface and surface deformationHigh-fidelity training required
Application of machine learning to predict CO2 trapping performance in deep saline aquifersThis study applies machine learning (ML) models—Gaussian Process Regression (GPR), Support Vector Machine (SVM), and random forest (RF) to predict CO2 trapping efficiency in saline formations. A training dataset was developed using uncertainty variables, including geological, petrophysical, and physical parameters, to analyze residual trapping, solubility trapping, and cumulative CO2 injection [30].Geological and petrophysical propertiesResidual, solubility, and cumulative injectionIncorporates uncertainty analysisLacks real-time dynamic modeling and requires further field-scale validation
Sustainable CO2 Storage Assessment in Saline Aquifers Using a Hybrid ANN and Numerical Simulation Model Across Different Trapping Mechanisms (Current Paper)This study employs the Levenberg–Marquardt backpropagation algorithm to develop an artificial neural network (ANN) model for predicting total CO2 storage capacity and its distribution across different trapping mechanisms. The ANN is trained using a wide range of geological and operational parameters, derived from extensive reservoir simulation runs, ensuring that the model captures the complex interactions governing CO2 sequestration.Includes the parameters of the other models plus extra input sets not included in previous models (aquifer volume, hysteresis coefficient, reservoir pressure, and CO2 injection pressure)All four major mechanisms (residual, solubility, mineral, and structural) in addition to CO2 supercritical volume; these outputs are only included in this study✔ Fully conclusive predictions (total CO2 volume + full trapping breakdown)
✔ Balances accuracy and computational efficiency
✔ Real-time adaptability and easy to use
Requires further field-scale validation

3. Methodology

The section discusses the methodology used to integrate simulation data from CMG-GEM with artificial neural networks (ANNs) to predict carbon storage and sequestration potential in saline aquifers. Figure 5 illustrates the dataset generation through the simulation, deployment, and validation processes of the ANN model. Table 2 outlines the parameters for the base case of CO2 injection into a saline aquifer, while Figure 6 displays the corresponding 3D model. In addition, Table 3 includes the range of the dataset, which was used for the development and validation of the ANN model.

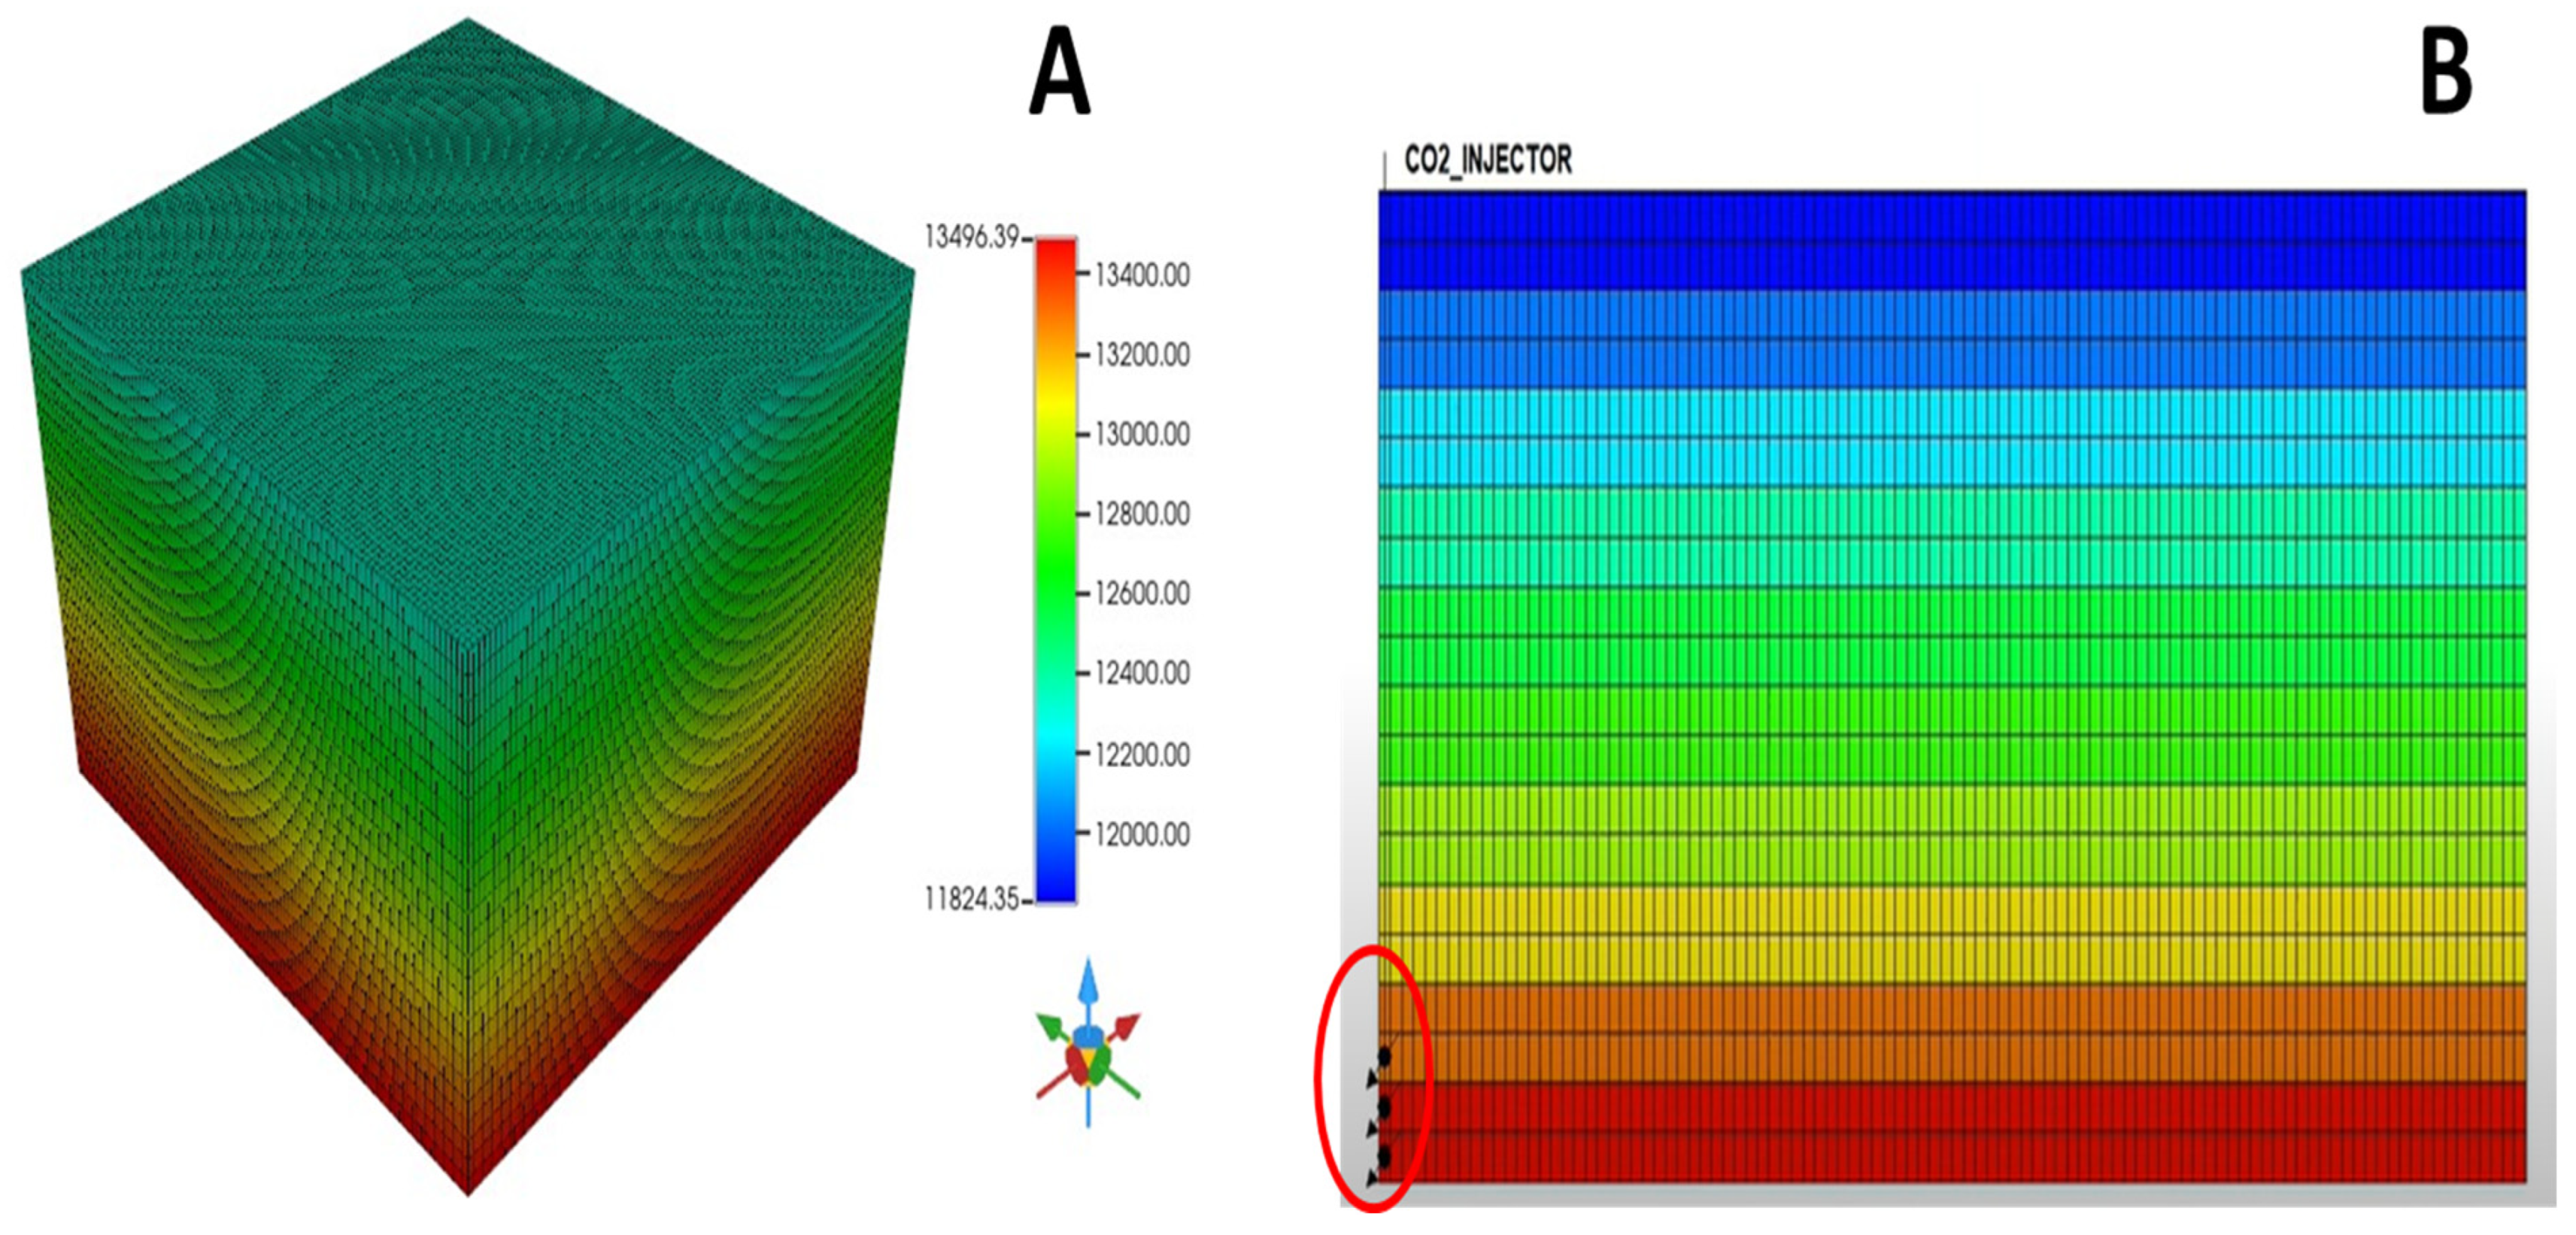
3.1. Data Generation Using 3D Simulation

The CMG-GEM models were designed for simulations of CO2 injection in saline aquifers, mimicking the subsurface conditions. The detailed representation was essential for the evaluation of different CO2 injection scenarios and for understanding their potential impacts.
The base case model consists of 300,000 cells divided into a 100 × 100 × 30 grid, and the CO2 injection well was located at grid block (1, 1, 1), which was perforated in the bottom three layers (from 28 to 30). The model’s constraints were set at a maximum bottom hole pressure of 45,000 kPa and a maximum surface gas rate of 12,000 m3/day. The sensitivity analysis included the maximum constraint values to study their impact on CO2 sequestration capacity. Also, the aqueous and mineral components were customized by selecting specific aqueous reactions and specific mineral/solids reactions, which are indicated in Equations (1)–(6).
This customization allows for a more accurate representation of the chemical processes involved in CO2 sequestration.
CO2 + H2O = (H+) + (HCO3−)
(H+) + (OH−) = H2O
(CO3−−) + (H+) = (HCO3−)
Calcite (CaCO3) + (H+) = (Ca++) + (HCO3−)
Dolomite (CaMg (CO3)2) + 2(H+) = (Ca++) + 2(HCO3−) + (Mg++)
Anorthite (CaAI2Si2O8) + 8(H+) = 2(AI+++) + (Ca++) + 4H2O + 2SiO2
The model’s running time is set for 200 years, a duration deliberately chosen as optimal for observing the effects of mineral and aqueous ion trapping mechanisms. Before this period, these effects may not be fully apparent, and beyond this time frame, the increase in sequestration is expected to plateau, rendering additional simulation time unnecessary.
This careful selection of simulation duration ensures a thorough and efficient analysis of the trapping mechanisms, maximizing the model’s effectiveness in predicting long-term CO2 storage outcomes.
Figure 6. (A) Simulation model 3D view and (B) simulation model side view.
Sustainability 17 02904 g006
Using the base case, a rigorous simulation sensitivity analysis was performed on the 9 critical parameters, including injector bottom hole pressure (BHP), CO2 injection rate, thickness, hysteresis coefficient, horizontal and vertical permeability, porosity, reservoir pressure, and aquifer volume. In addition, the results of the simulation determine the CO2 storage capacity in different trapping mechanisms, including CO2 supercritical, structural, residual, mineralized, and dissolved aqueous ions. The value distribution of critical parameters and different trapping mechanisms is shown in Figure 7. The range of data for this study as shown in Table 3 was selected based on a comprehensive review of the literature. This ensured that the parameters and conditions used in the model were grounded in established research, providing a robust foundation for the simulations and analyses. By aligning with existing studies, the model gains credibility and relevance, thereby facilitating accurate predictions of CO2 sequestration capacity [12,27,31].
The histograms presented in Figure 7 provide a detailed representation of the distribution of key reservoir parameters and CO2 trapping mechanisms, offering valuable insights into their behavior across the dataset. Each parameter plays a critical role in determining how CO2 is stored within the subsurface, whether as a supercritical fluid, within structural traps, dissolved in brine, or mineralized within the rock matrix.
The reservoir thickness is predominantly between 4 and 6 m, indicating that most reservoirs in this dataset are relatively thin. While thicker formations may offer greater storage capacity, their effectiveness in CO2 trapping depends on additional factors such as permeability and pressure. The hysteresis coefficient, which influences residual CO2 trapping through capillary forces, peaks around 0.2 and rarely exceeds 0.5. This suggests that most reservoirs exhibit moderate capillary trapping effects, which can enhance long-term CO2 retention.
The bottom hole flowing pressure is primarily concentrated between 42,500 and 45,000 psi, displaying a bimodal distribution that may indicate the presence of distinct reservoir types—possibly shallow and deep formations with varying pressure regimes. Similarly, CO2 injection rates are mostly clustered between 7000 and 8500 units, reflecting a relatively uniform injection strategy across the dataset. However, outliers reaching 12,000 suggest that certain reservoirs require higher injection rates, likely due to variations in permeability or lithological properties.
Permeability exhibits notable variation. Horizontal permeability is highly skewed, with most values below 400 mD, but a distinct subset around 1000 mD suggests the presence of highly permeable reservoirs. This has significant implications for CO2 mobility, as higher permeability facilitates migration but may also increase leakage risks if not properly managed. In contrast, vertical permeability follows a more normal distribution centered around 0.25, indicating limited vertical CO2 movement, which can enhance structural trapping in layered formations.
Porosity ranges from 0.15 to 0.30, peaking at 0.25, indicating that most reservoirs have moderate storage potential. A similar trend is observed in reservoir (aquifer) pressure, which is predominantly within 9000–9500 psi, with some values extending to 11,500 psi. Higher pressures enhance CO2 dissolution in brine and maintain CO2 in its supercritical state, reducing leakage risks. Aquifer volume, a key factor in CO2 dissolution, peaks around 8000, suggesting that many reservoirs contain substantial brine-filled spaces conducive to long-term CO2 storage through solubility trapping.
Figure 7. Distribution of critical parameters for different trapping mechanisms.
Sustainability 17 02904 g007
Examining the CO2 total storage (supercritical) and all trapping mechanisms, the supercritical CO2 displayed most values clustering around 0.8 × 10⁸ and extending up to 1.6 × 10⁸. This suggests that many reservoirs maintain conditions that are conducive to CO2 remaining in its dense, supercritical phase. Residual trapping, governed by hysteresis effects and pore structure, peaks around 3 × 10⁷, highlighting the moderate role of capillary forces in CO2 retention.
Structural trapping, where CO2 accumulates in geological formations, is the dominant storage form, with data points clustering around 0.2 × 10⁸. This suggests that many reservoirs in the dataset do not rely heavily on structural traps, potentially due to high permeability or geometries that facilitate CO2 migration.
Mineralization, where CO2 reacts with rock-forming minerals to create stable carbonates, is relatively low, with most values below 2 × 10⁷, though some higher outliers exist. This aligns with the fact that mineralization is a slow process requiring specific geochemical conditions.
CO2 dissolution emerges as a significant trapping mechanism, with most values peaking around 0.75 × 10⁷ and extending to 2 × 10⁷. This suggests that dissolution plays a crucial role in long-term storage, likely supported by high reservoir pressures and large aquifer volumes, which enhance CO2 solubility in brine.
Overall, understanding these distributions enhances the refinement of reservoir models, the selection of the reservoir (aquifer), and the optimization of carbon sequestration strategies to improve long-term storage efficiency.

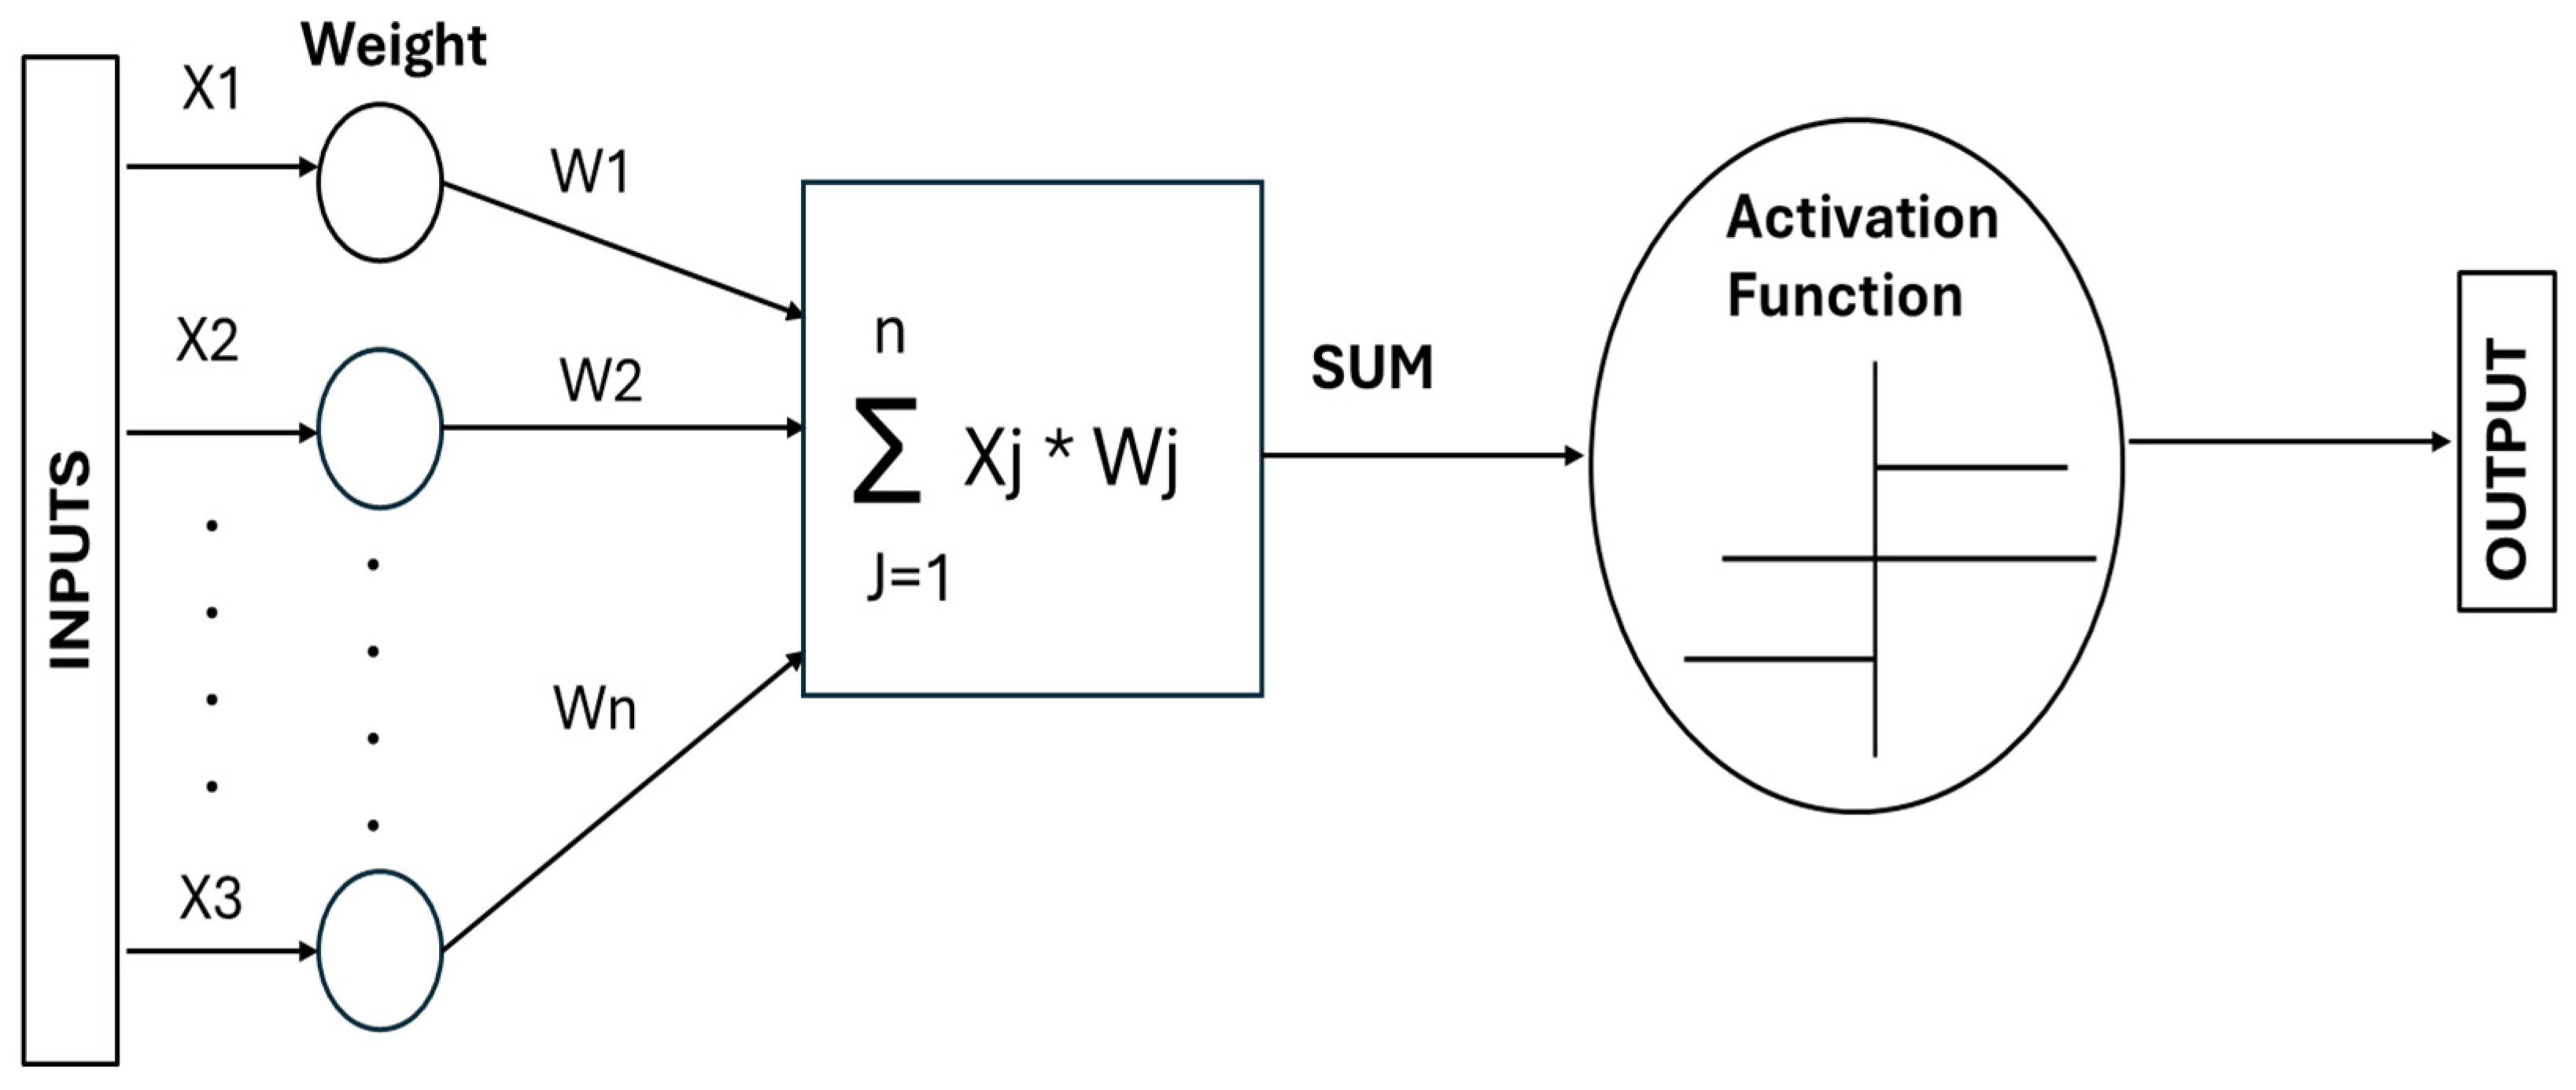
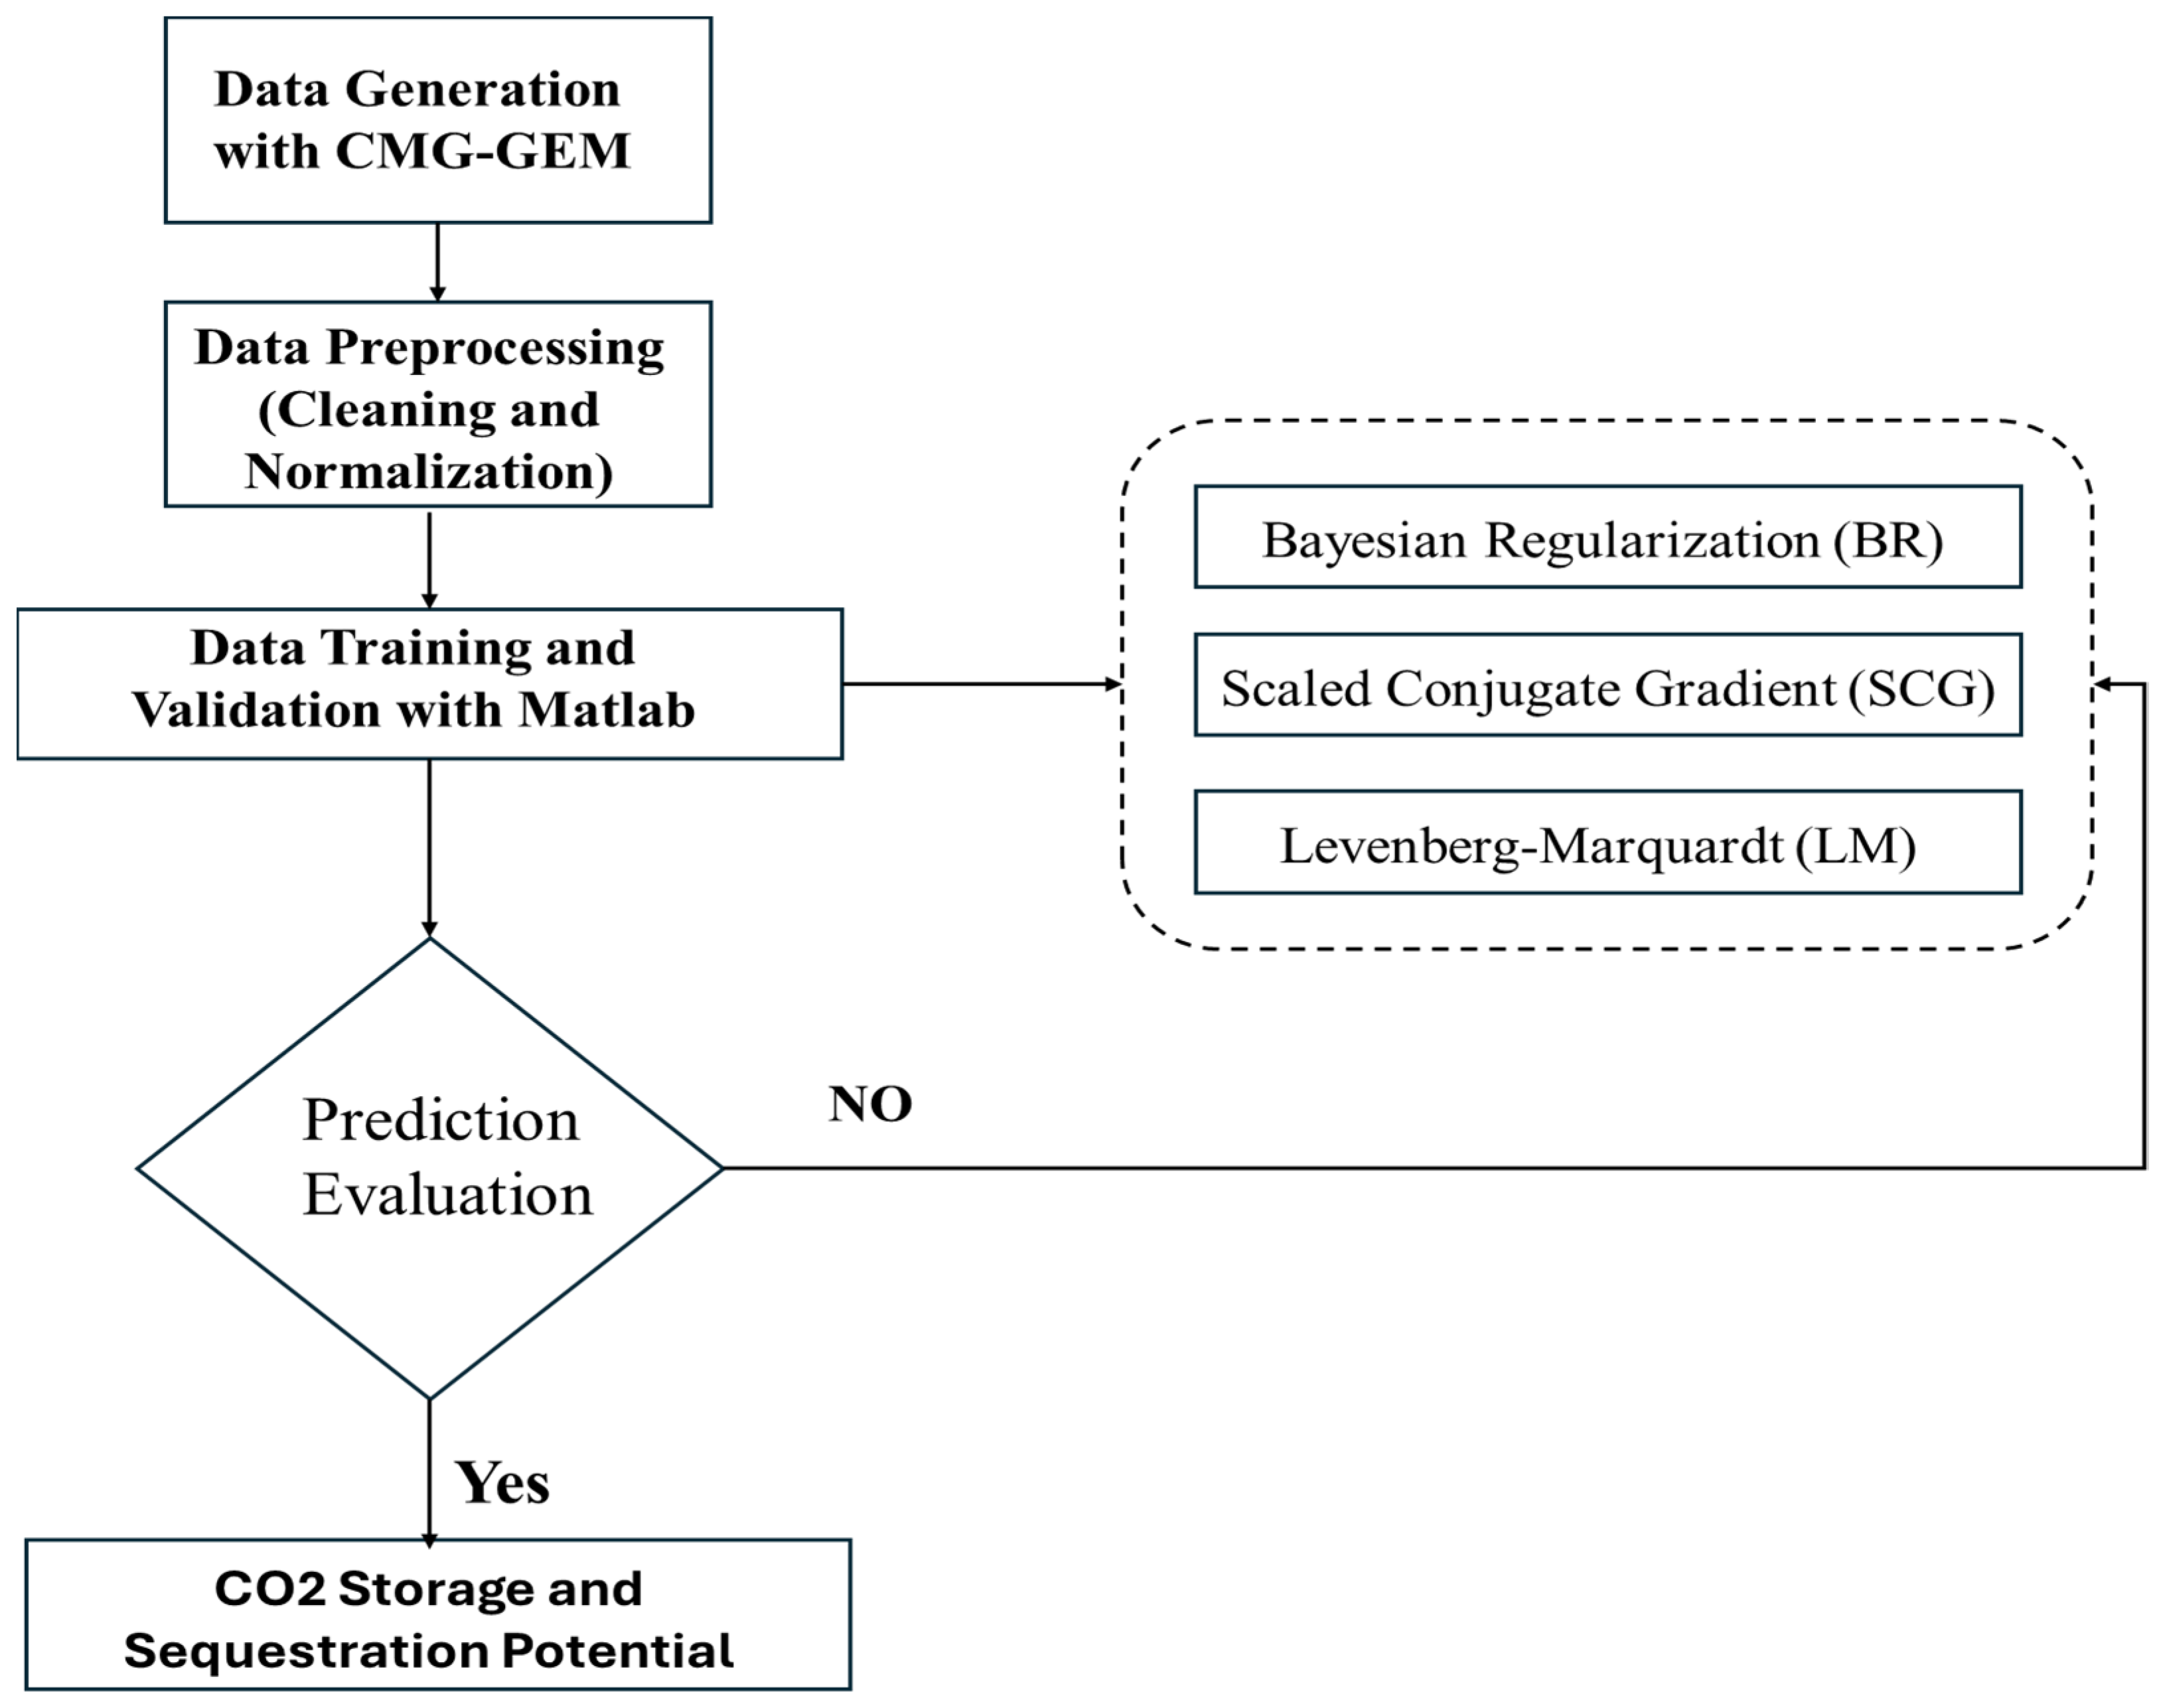
3.2. ANN Model Development

From the 250 CMG-GEM simulation runs, a dataset was prepared for ANN model training, including data cleaning and normalization. The 250 CMG-GEM runs were designed to capture a wide range of geological conditions, including variations in reservoir properties, injection rates, and aquifer dynamics.
Sensitivity analysis confirms that the model responds realistically to changes in input parameters, ensuring robustness. The ANN model was trained using a diverse dataset, ensuring strong generalization capability rather than overfitting to a specific scenario. The dataset was then divided into different categories for training (70% of data), validation (15%), and testing (15%) to create a comprehensive framework for the model’s development and evaluation [23,24]. The 15% testing dataset was completely excluded from training, effectively acting as external unseen data. The number of hidden layers and neurons was optimized to ensure the model’s efficiency in capturing the hidden patterns and relations in the dataset. Through experimentation with different numbers of hidden layers, ranging from 7 to 12, it was determined that 10 layers yielded the best predictions. This configuration provided the optimal balance, enhancing the model’s ability to accurately interpret complex data.
The selection of a 10-hidden-layer architecture was guided by a systematic sensitivity analysis, evaluating model performance across various network depths. The results indicated that architectures with fewer than 10 hidden layers led to underfitting, where the model failed to fully capture the relationships between input features and CO2 trapping mechanisms. This limitation was particularly evident in predicting complex non-linear dependencies, such as mineral trapping, where model accuracy declined significantly. The reduced depth of these networks restricted their ability to learn intricate interactions among geological, petrophysical, and operational parameters, leading to less reliable predictions.
Conversely, increasing the number of hidden layers beyond 10 initially resulted in marginal improvements in training accuracy. However, deeper architectures introduced overfitting, where the model became overly specialized in the training data and struggled to generalize to unseen scenarios. This issue was compounded by a substantial increase in computational time, limiting the model’s practicality for real-time applications and large-scale reservoir simulations. The diminishing returns in predictive accuracy, coupled with an excessive number of parameters, made deeper architectures prone to memorizing training data rather than learning meaningful patterns.
Based on these findings, the 10-layer architecture was identified as the optimal configuration, offering a balance between accuracy, generalization, and computational efficiency. It effectively captured the complex dependencies among key parameters, including aquifer volume, hysteresis effects, and CO2 saturation dynamics, without exhibiting underfitting or overfitting issues. Furthermore, this architecture aligns with existing research on deep learning applications in subsurface modeling, reinforcing its reliability for CO2 storage predictions. By integrating this systematically optimized design, the proposed model ensures accurate, computationally efficient, and scalable predictions, making it a robust tool for assessing CO2 sequestration potential across diverse geological conditions.
While training the ANN model, the backpropagation algorithm was used with the learning rate, epochs, and batch size as hyper-parameters, which were adjusted to reduce prediction errors. The high accuracy of the developed model was achieved through a critical iterative learning process and quantitative assessment using metrics like RMSE and R2 to ensure the model can be applied confidently in different scenarios.
Finally, as shown in Figure 8, the models’ architecture consists of an input layer, with 9 input nodes corresponding to the simulation parameters and 10 hidden layers for data processing, and an output layer, with 5 outcomes for sequestration and storage predictions [32,33,34].

3.3. Different ANN Algorithms in MATLAB

MATLAB provides a robust neural network module for developing and training ANNs. There are several training algorithms, including Levenberg–Marquardt, Bayesian Regularization, and scaled conjugate gradient, each with unique characteristics, functions, advantages, and applications. The selection criteria of the algorithm in MATLAB depends on the dataset size and model complexity.
Table 3. Input parameters range.
ParametersHighest ValueLowest Value
Thickness (m)103
Hysteresis factor0.60.1
Injector BHP, KPa50,00030,000
Injection Rate (m3/day)12,0007000
Horizontal Permeability (md)100050
Vertical Permeability (md)0.50.1
Porosity (%)0.30.08
Reservoir Pressure, KPa11,8008000
Aquifer Volume, m310,0001000
Thickness (m)103
Hysteresis factor0.60.1
As highlighted in Table 4, knowing the characteristics and applications of these algorithms can guide the user to the best selection to optimize the performance of their neural network models [35].

4. Results and Discussion

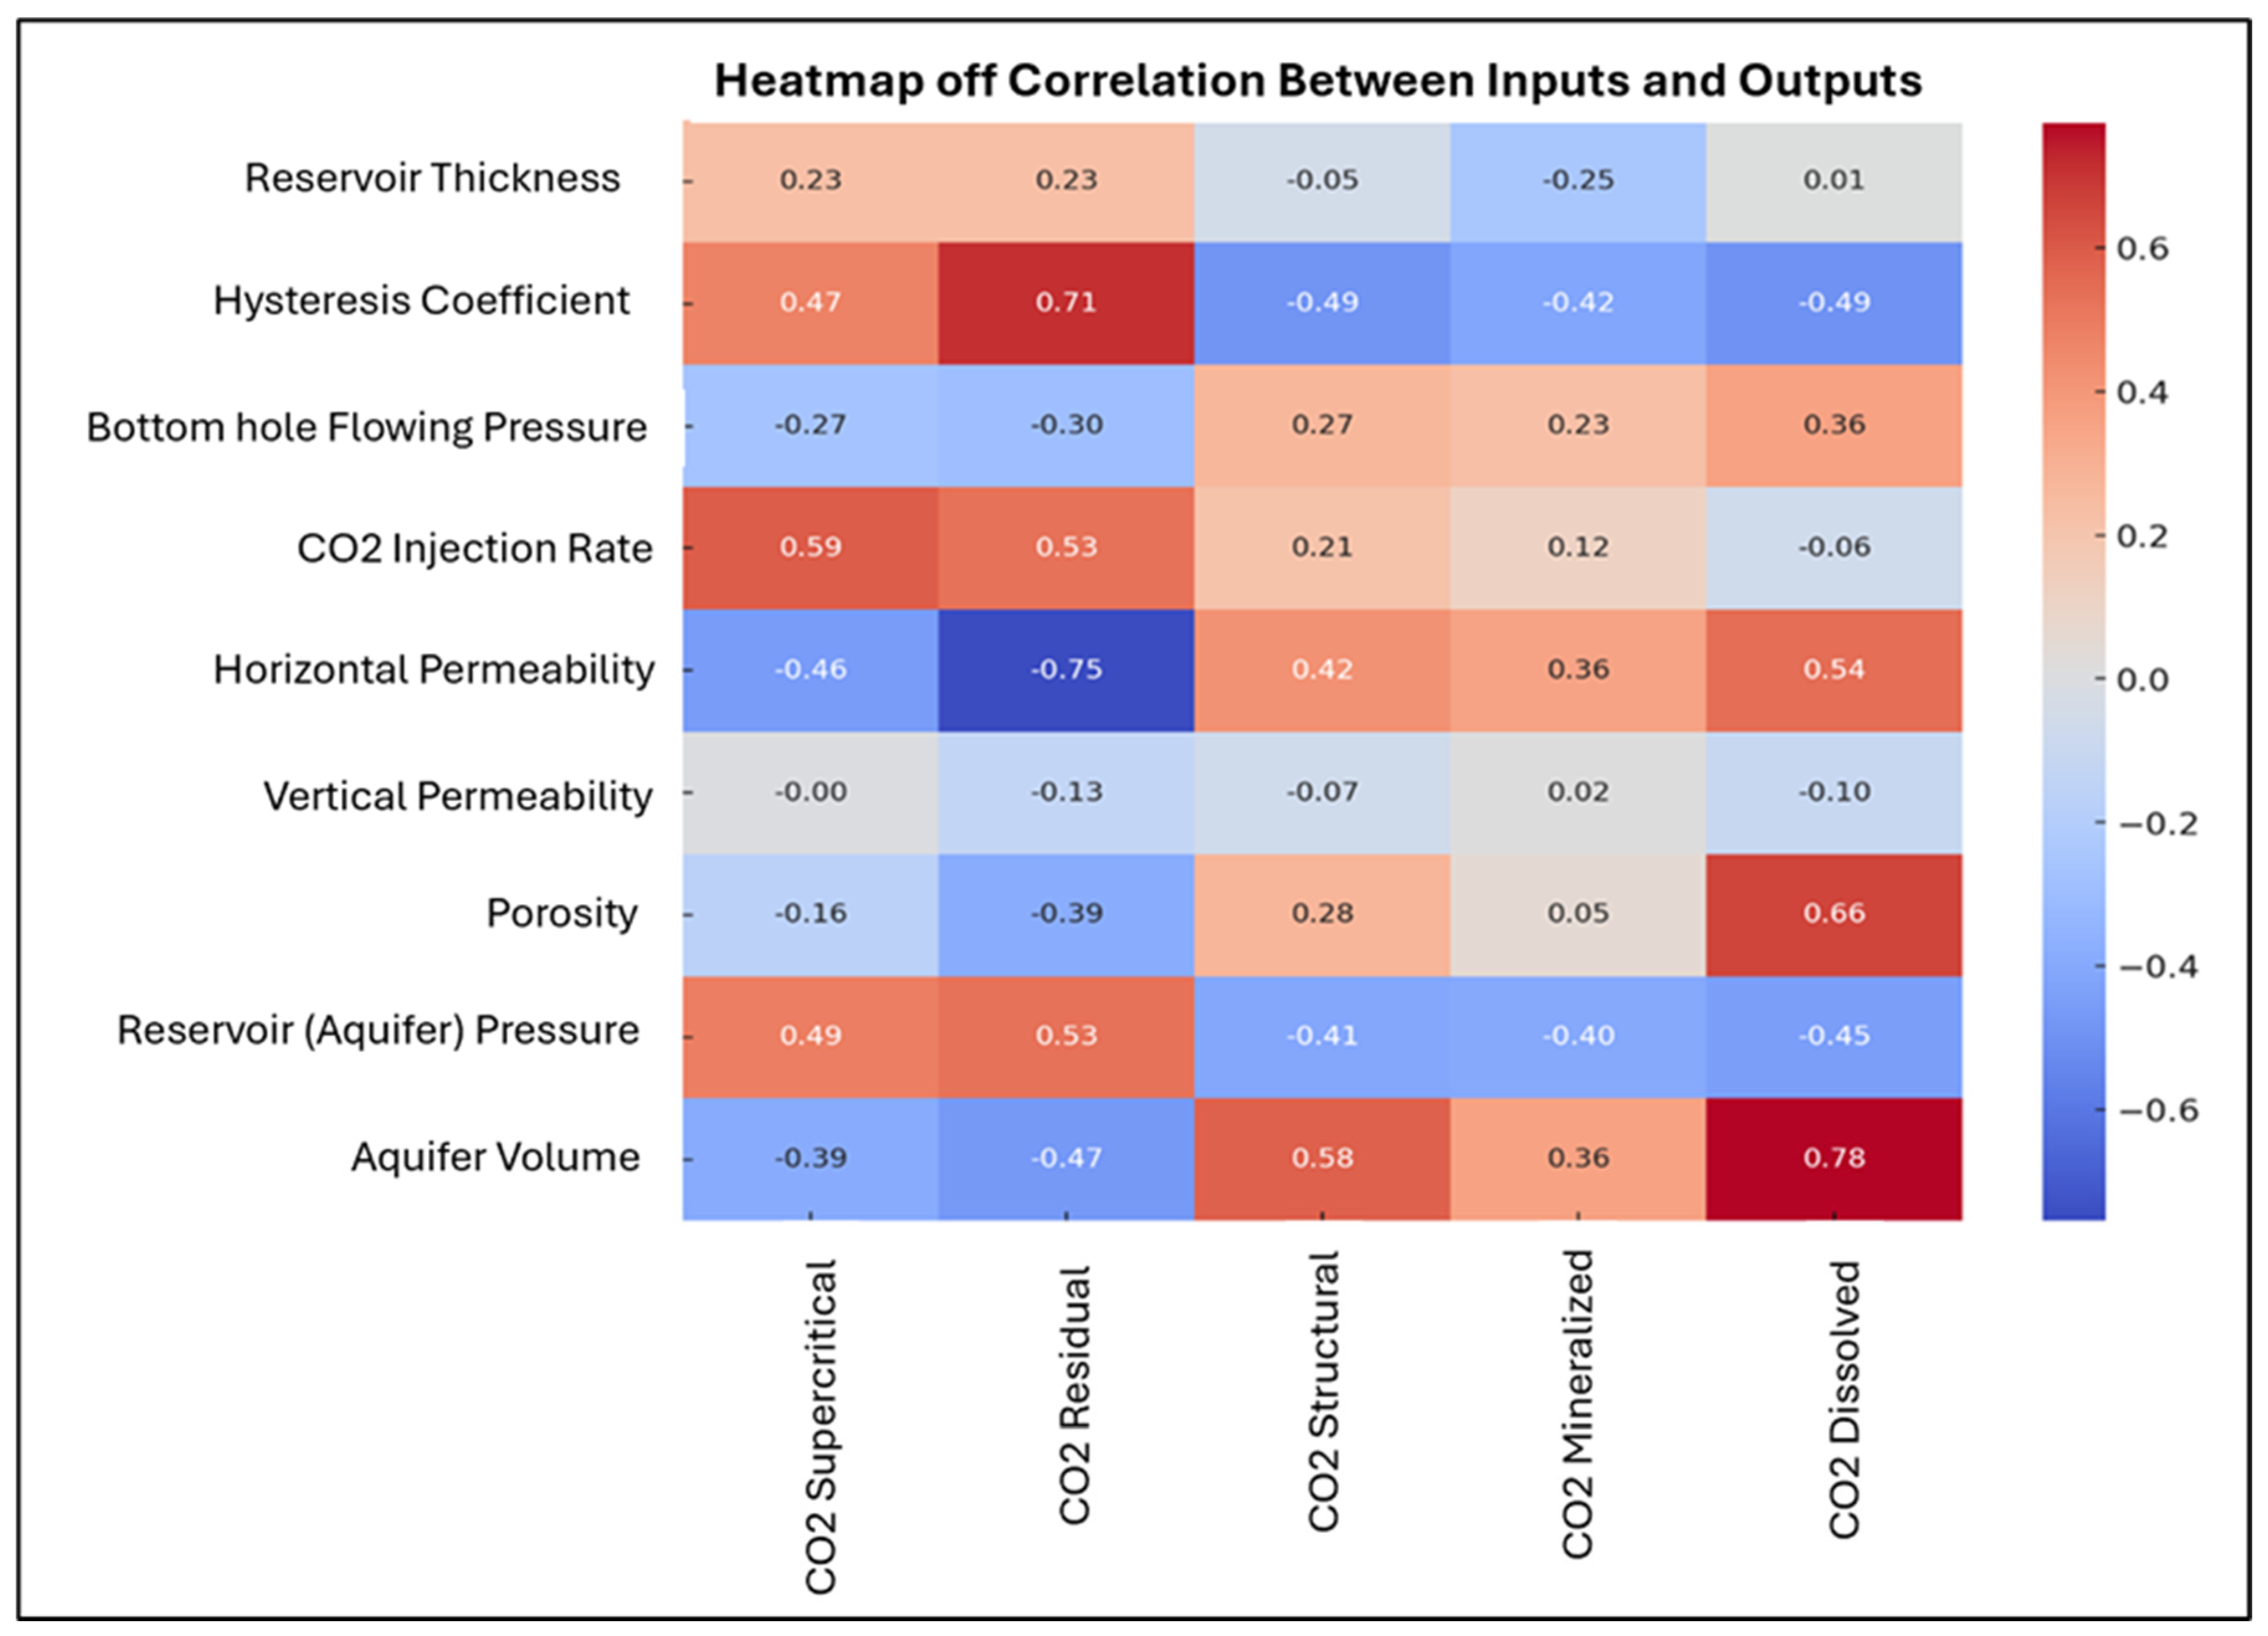
4.1. Impact of Different Parameters on Different Traps

The study presents an innovative approach for predicting carbon storage and sequestration potential in saline aquifers by integrating simulation data from CMG-GEM with artificial neural networks (ANNs). This methodology is based on the generation of a detailed dataset through comprehensive sensitivity analysis using CMG-GEM simulations and then using these generated simulation runs to develop, train, and validate an ANN model customized to predict CO2 sequestration outcomes. The correlation heatmap matrix in Figure 9 shows the relationships between the different parameters in the dataset, including the CO2 trapping states (supercritical, structural, dissolved, mineral, and residual) and other operational and subsurface properties. The color gradient and the correlation coefficients indicate a strong interaction between these parameters and were shown to range from −1 (perfect negative correlation) to +1 (perfect positive correlation), with 0 indicating no correlation.
The heatmap in Figure 9 provides valuable insights into how various reservoir parameters influence CO2 trapping mechanisms through physical and geological processes. A comprehensive understanding of these correlations necessitates an in-depth analysis of fluid flow dynamics, capillary forces, and CO2 phase behavior in subsurface conditions.
Reservoir thickness exhibits a weak positive correlation with supercritical and residual CO2, as thicker formations offer greater storage capacity, allowing CO2 to remain trapped in these forms. However, its negative correlation with structural and mineralized trapping suggests that increased formation thickness promotes greater CO2 dispersion, thereby reducing the localized concentrations required for mineralization and structural accumulation.
The hysteresis coefficient plays a critical role in residual trapping, with a strong positive correlation (0.71). This relationship arises because hysteresis enhances capillary forces, preventing CO2 migration after injection ceases. Consequently, higher levels of hysteresis reduce structural, mineralized, and dissolved CO2 trapping, as a greater proportion of CO2 remains immobilized within the pore space rather than migrating into structural traps or dissolving in formation water.
The bottom hole flowing pressure is negatively correlated with supercritical and residual CO2, indicating that higher pressures promote CO2 expansion and dissolution rather than retention in these phases. Conversely, its positive correlation with structural, mineralized, and dissolved CO2 suggests that elevated pressures enhance buoyancy-driven CO2 migration, thereby increasing the likelihood of accumulation in structural traps and dissolution into formation brine.
The CO2 injection rate is directly associated with supercritical and residual trapping, as higher injection rates lead to increased CO2 saturation, which enhances capillary trapping. However, its weak negative correlation with dissolved CO2 suggests that higher injection rates reduce the immediate mixing of CO2 with brine, thereby lowering dissolution efficiency.
Horizontal permeability strongly influences CO2 residual trapping, as evidenced by its significant negative correlation (−0.75). Higher permeability facilitates fluid mobility, reducing the potential for CO2 entrapment within pore throats. However, it positively correlates with structural, mineralized, and dissolved trapping, as increased permeability promotes CO2 migration to structural highs, enhances contact with brine for dissolution, and facilitates mineral interactions.
In contrast, vertical permeability exhibits minimal correlation with CO2 trapping mechanisms. Since CO2 migration is predominantly lateral, vertical permeability plays a limited role, unless strong vertical pressure gradients are present, which are uncommon in most reservoirs.
Porosity demonstrates a moderate negative correlation with residual CO2, indicating that increased pore space reduces the likelihood of CO2 entrapment in isolated pore clusters. However, porosity exhibits a strong positive correlation with dissolved CO2, as a higher porosity allows for greater brine availability, thereby enhancing CO2 solubility in formation water.
Reservoir pressure exerts a dual influence on CO2 trapping. Higher pressures support supercritical and residual trapping by maintaining CO2 in its supercritical phase. However, elevated pressures also reduce buoyancy effects, thereby limiting CO2 migration into structural traps and dissolution in brine, which explains its negative correlation with structural, mineralized, and dissolved CO2.
Aquifer volume is another critical parameter affecting CO2 trapping. Larger aquifer volumes decrease supercritical and residual CO2 trapping, as CO2 disperses over a broader area rather than remaining concentrated in high-saturation zones. However, larger aquifer volumes enhance structural and dissolved trapping by providing additional space for CO2 accumulation in structural highs and increasing brine availability for dissolution.
A significant discovery was that the correlations observed among input and output parameters were not statistical coincidences but were rooted in established physical and scientific principles. This made sure that the explanations were not derived from number associations but were supported by a scientific foundation. Therefore, this methodology bolsters the credibility of our research and aids in devising strategies for CO2 sequestration.

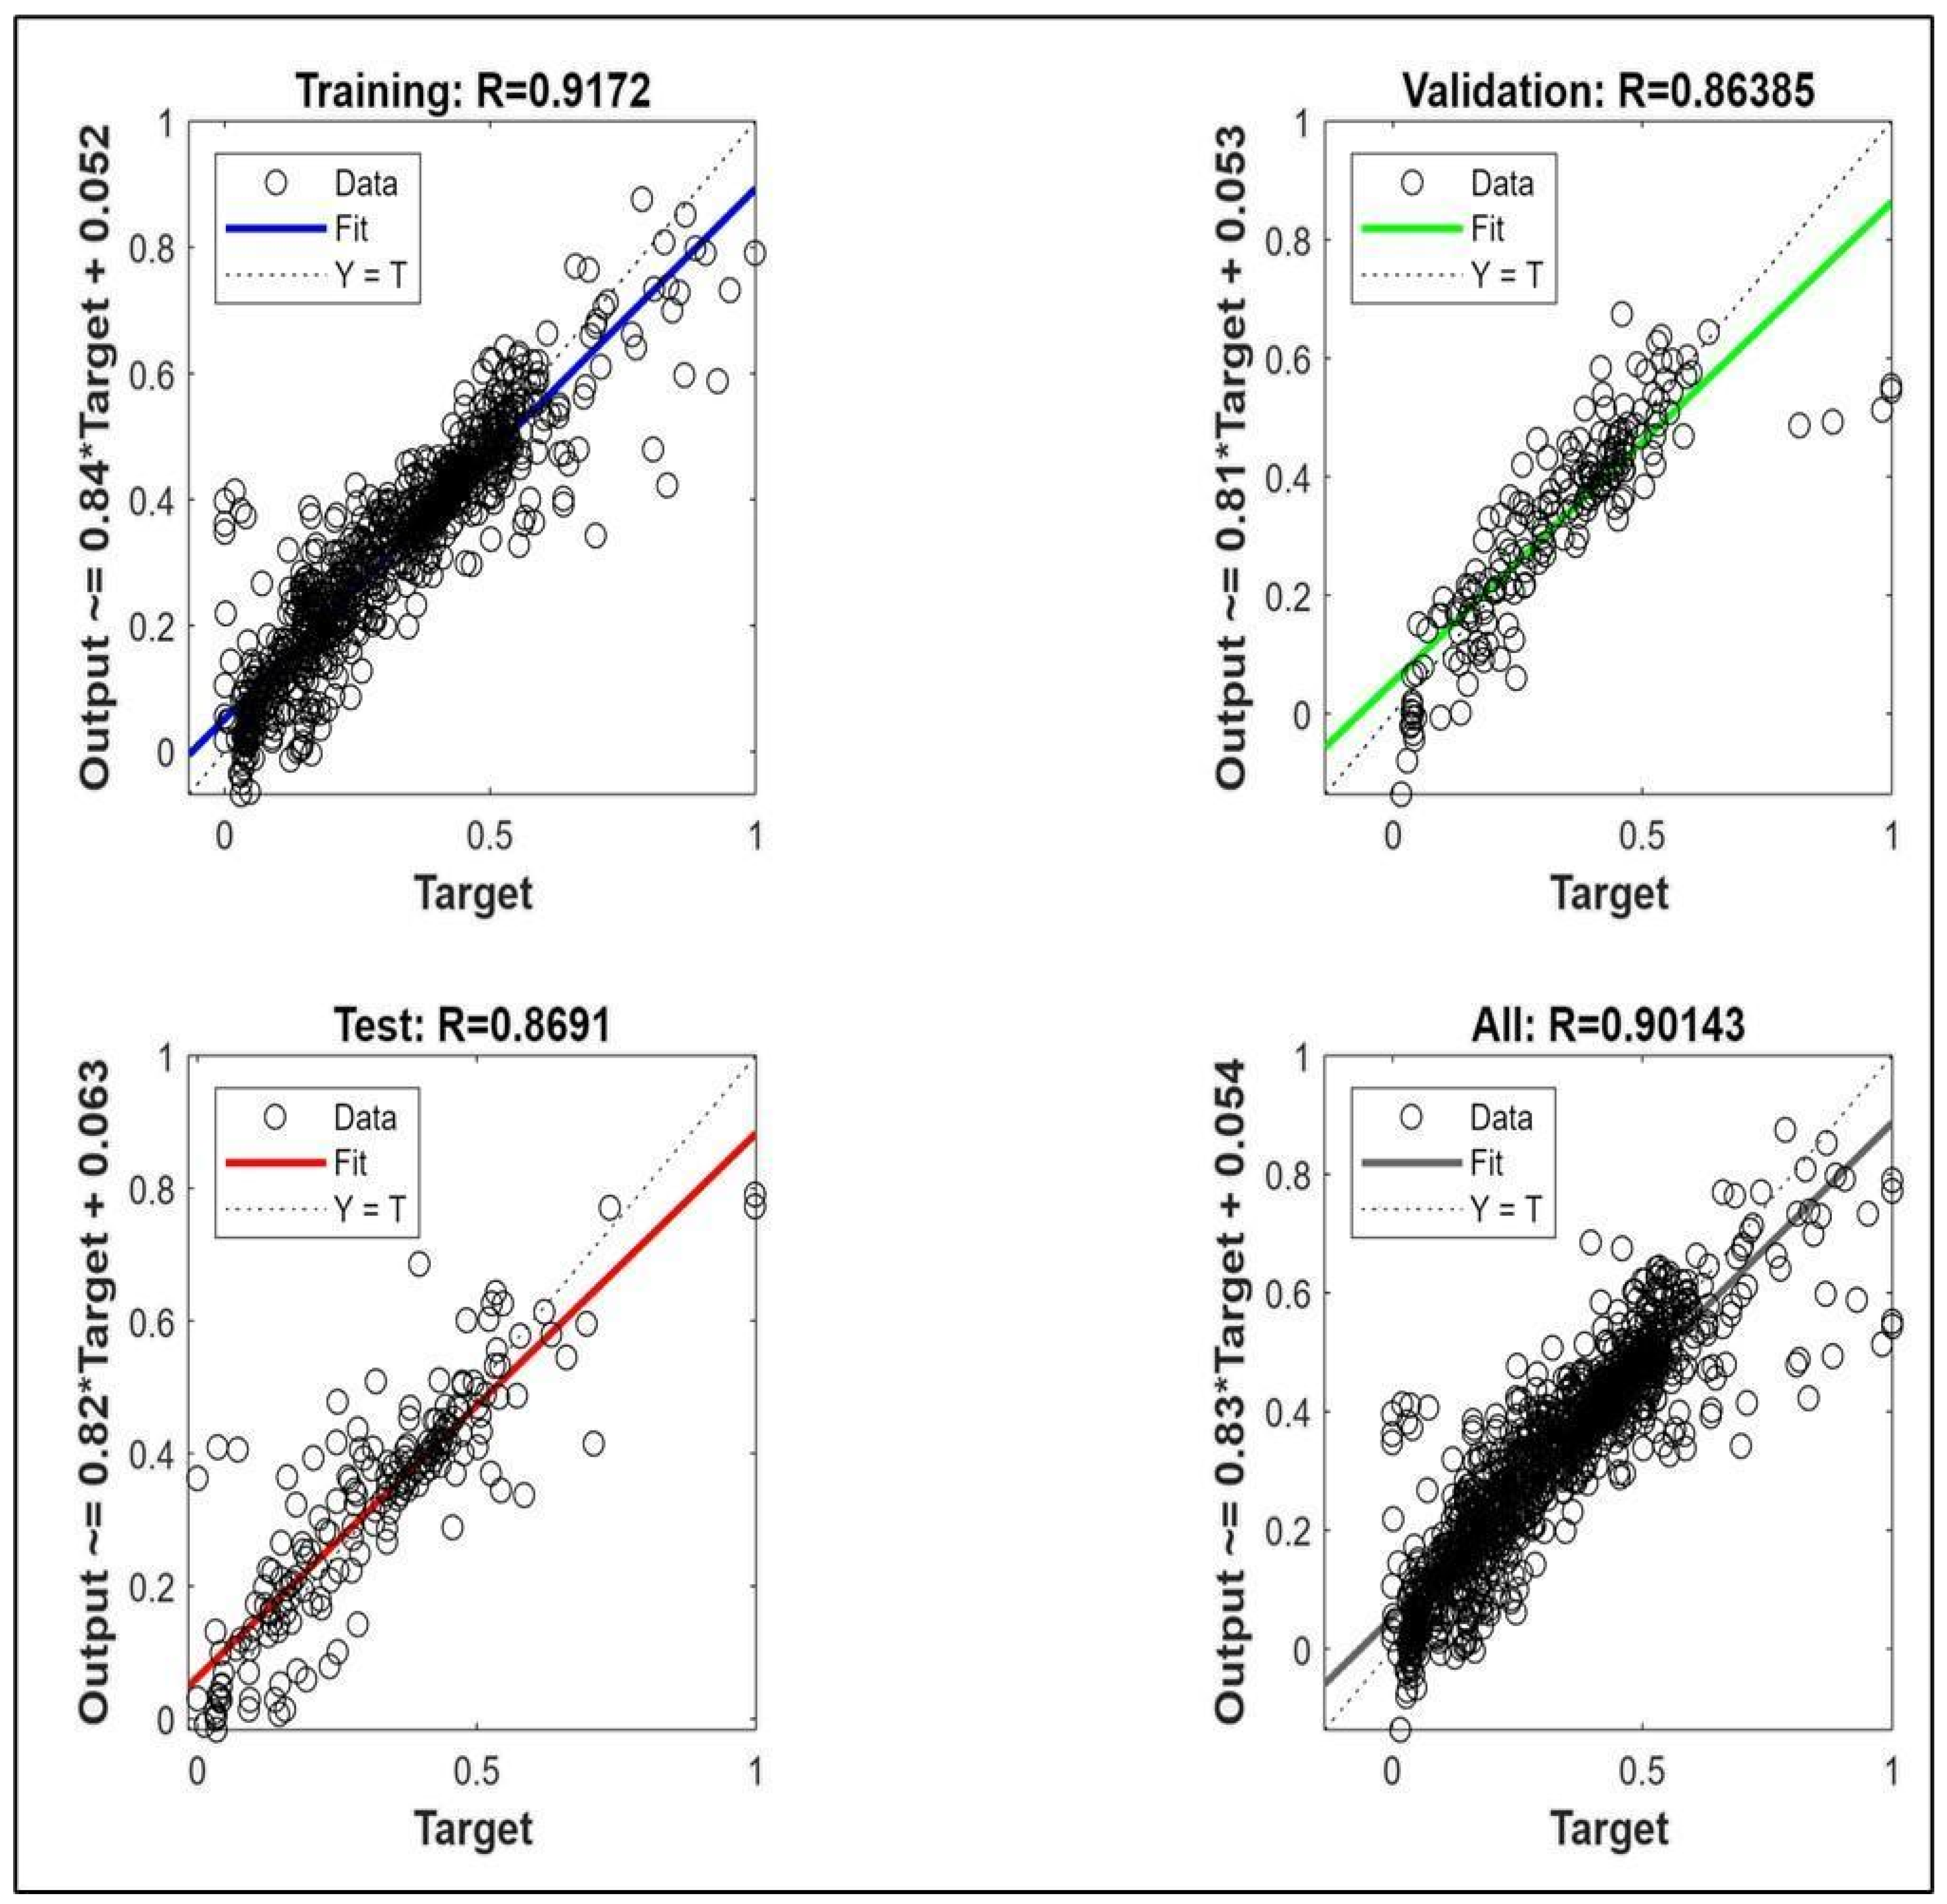
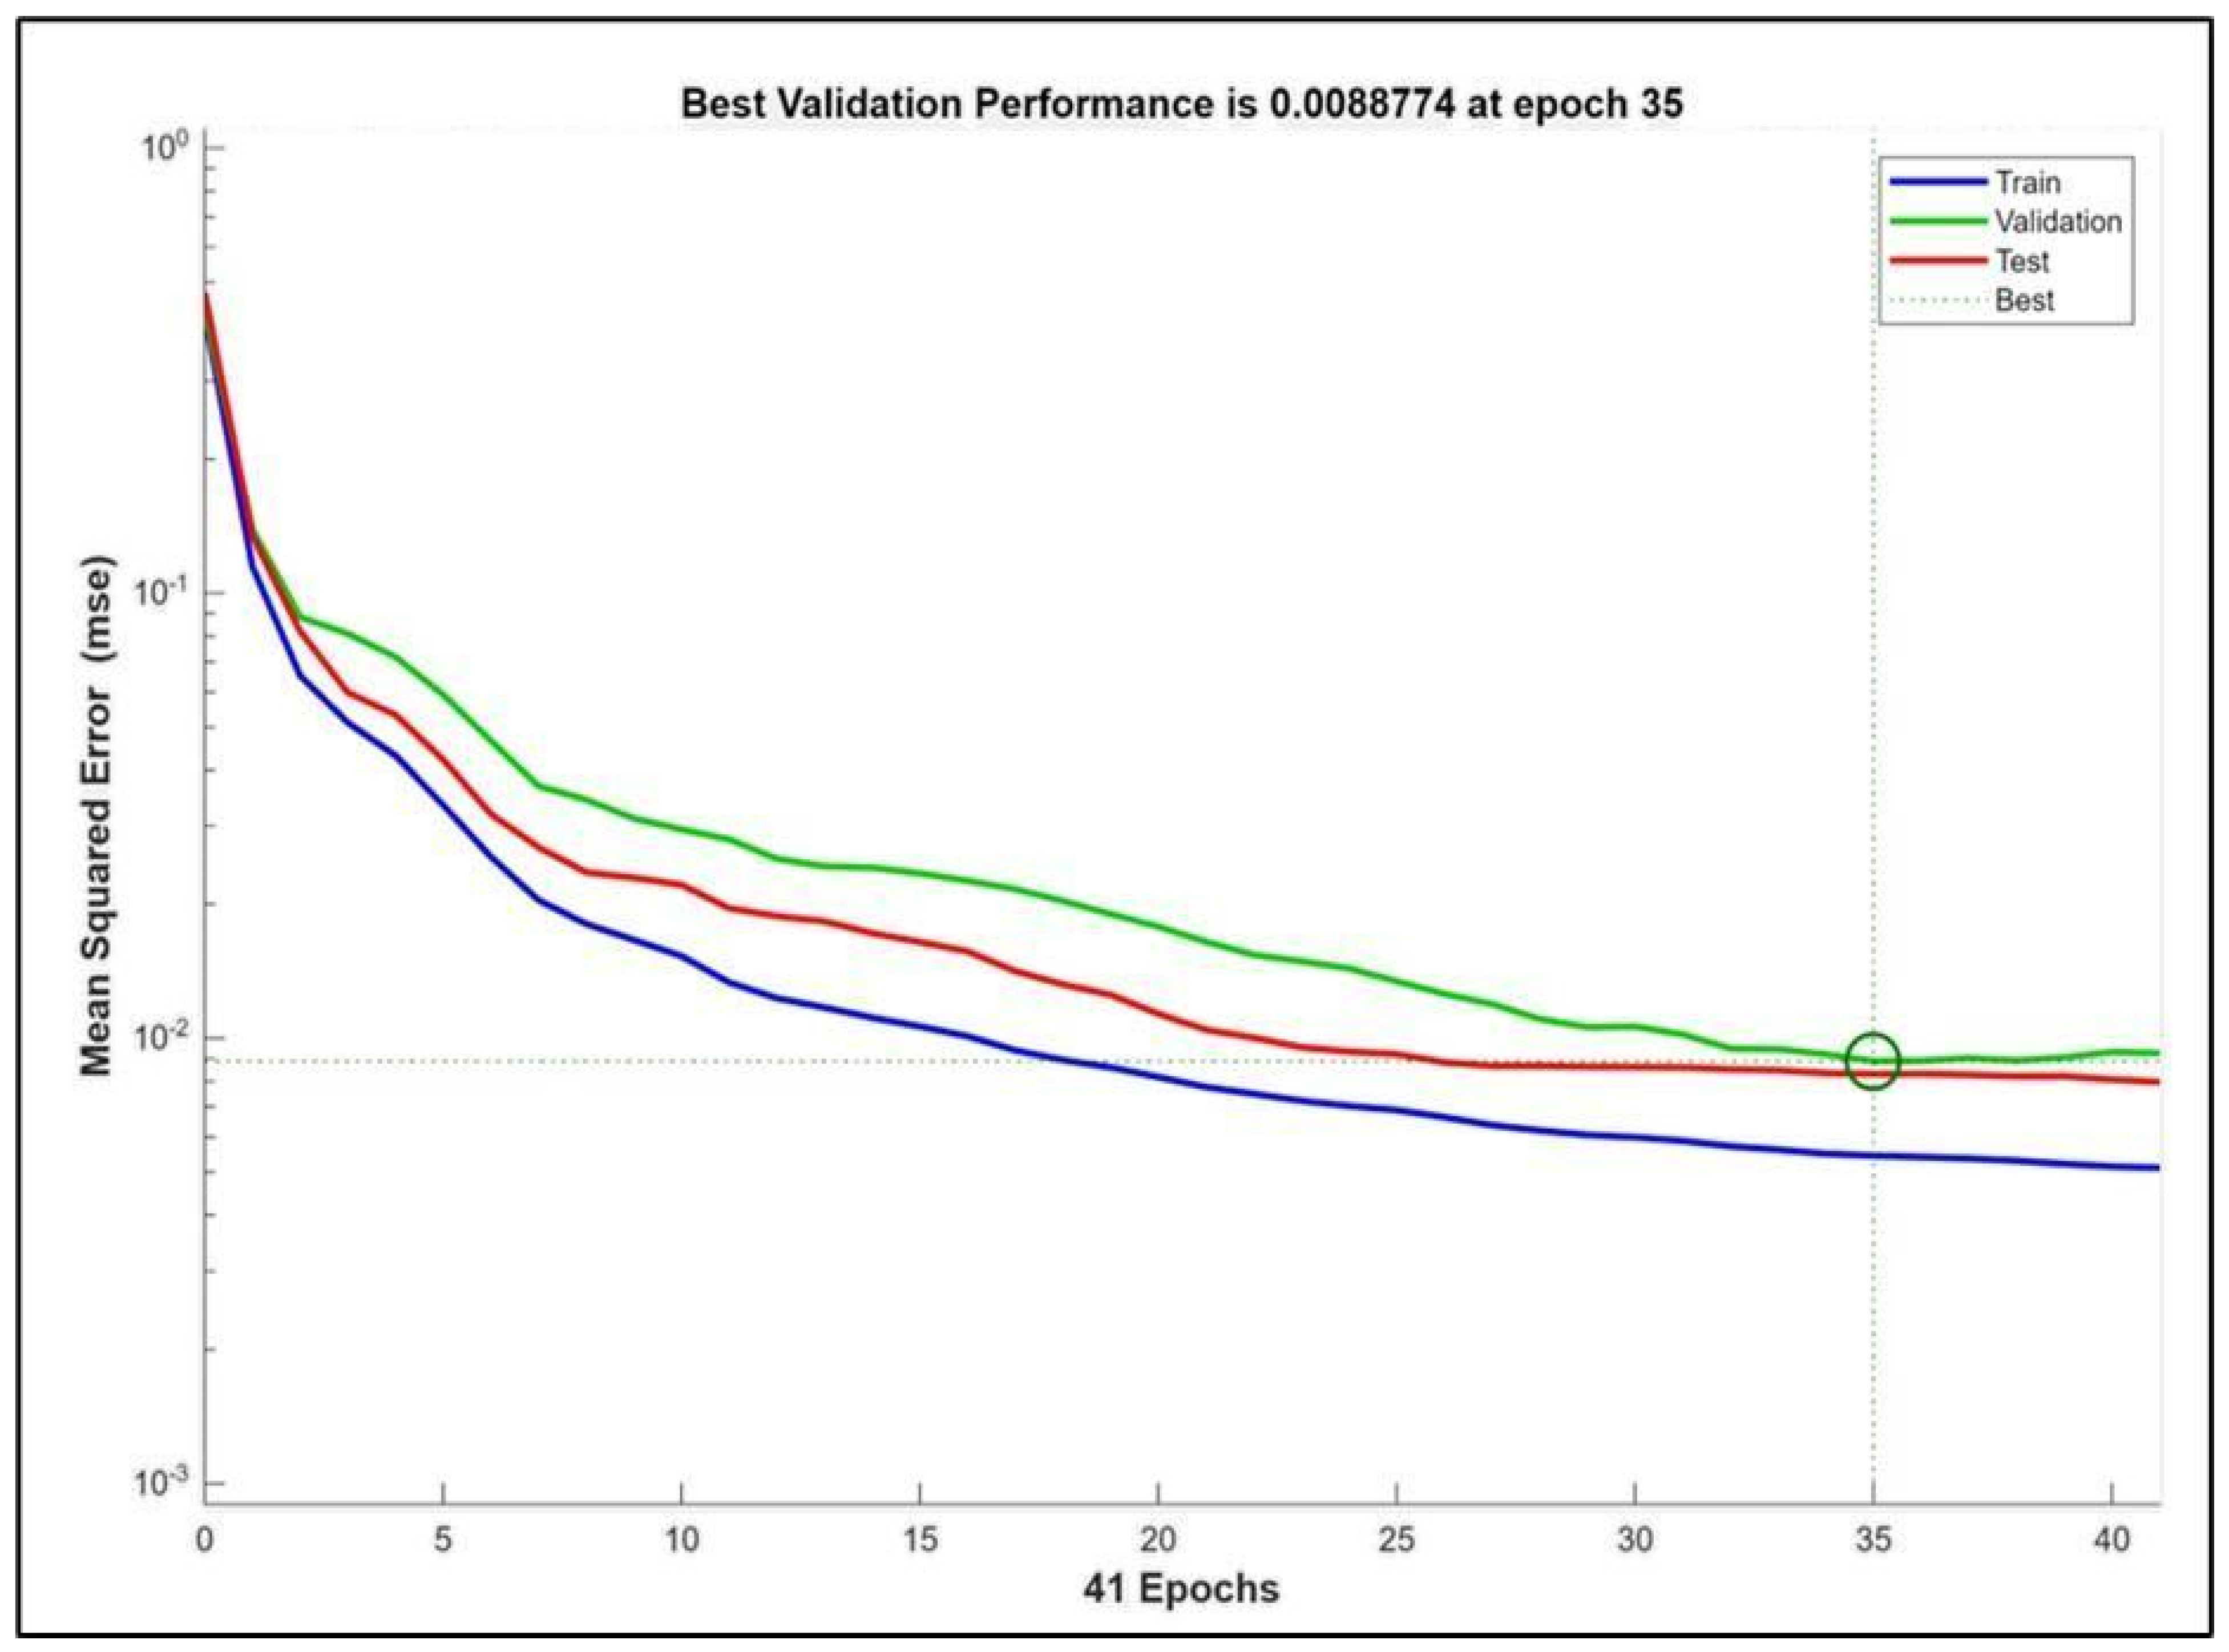
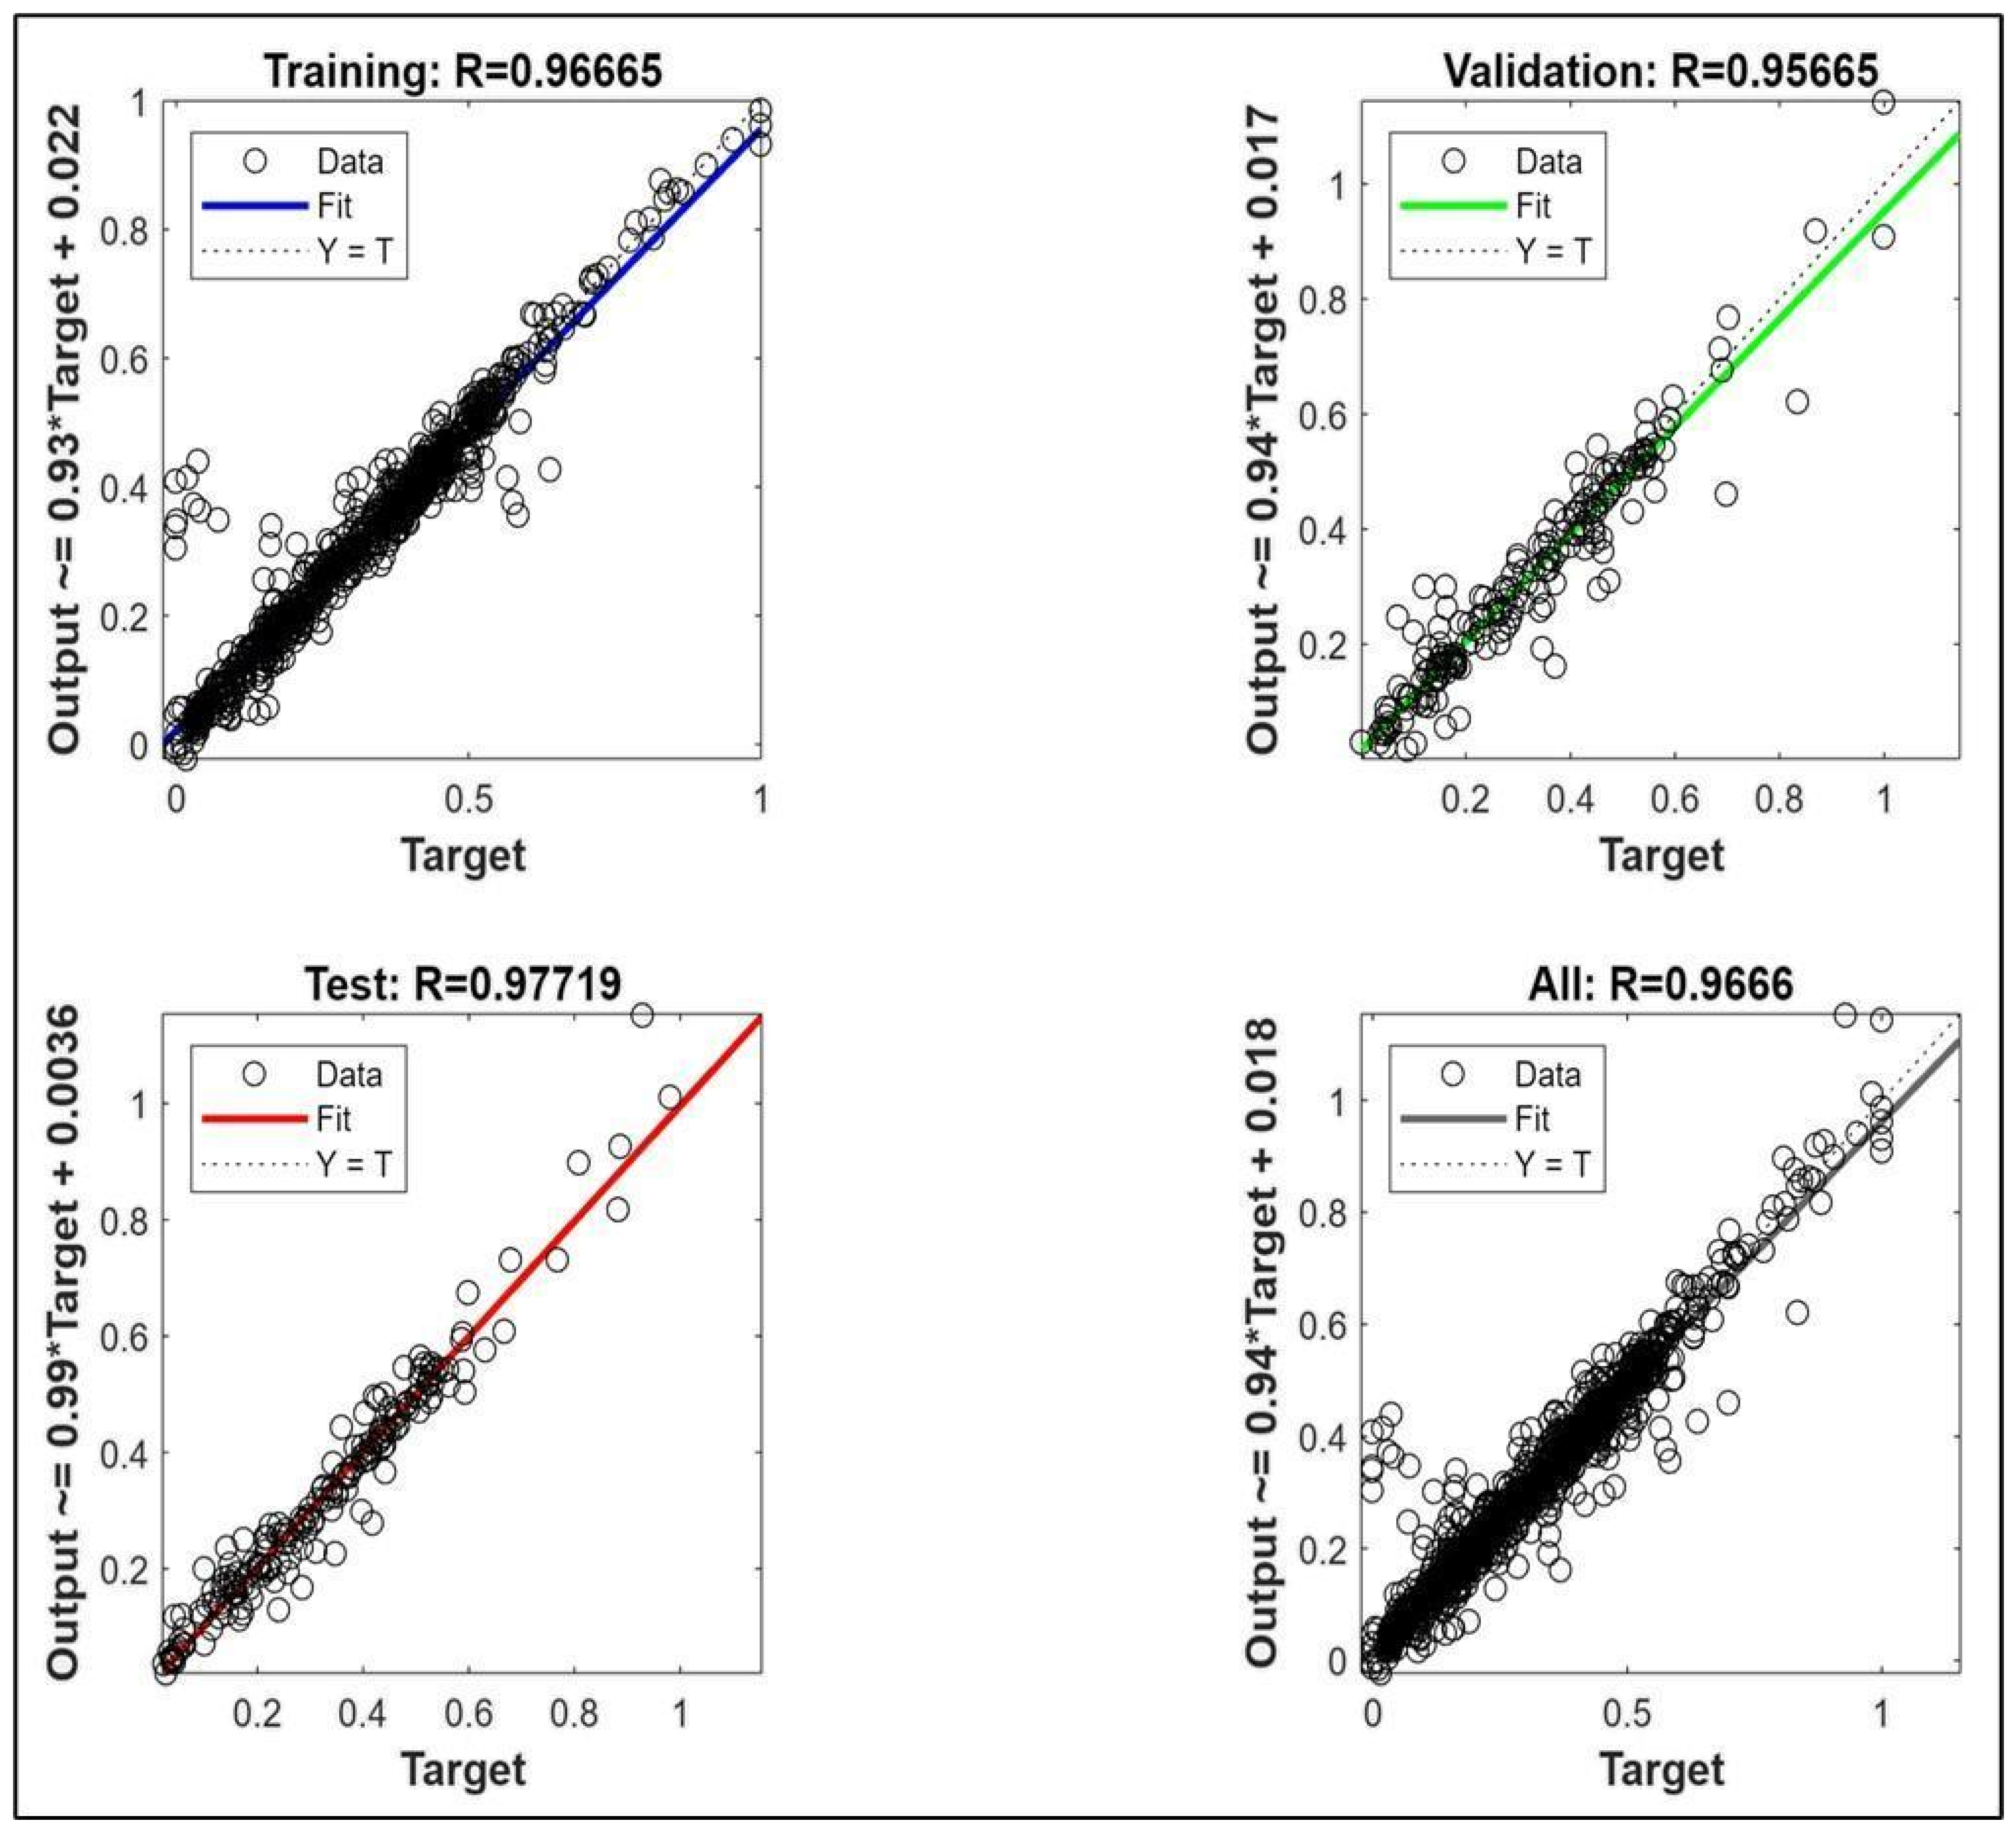
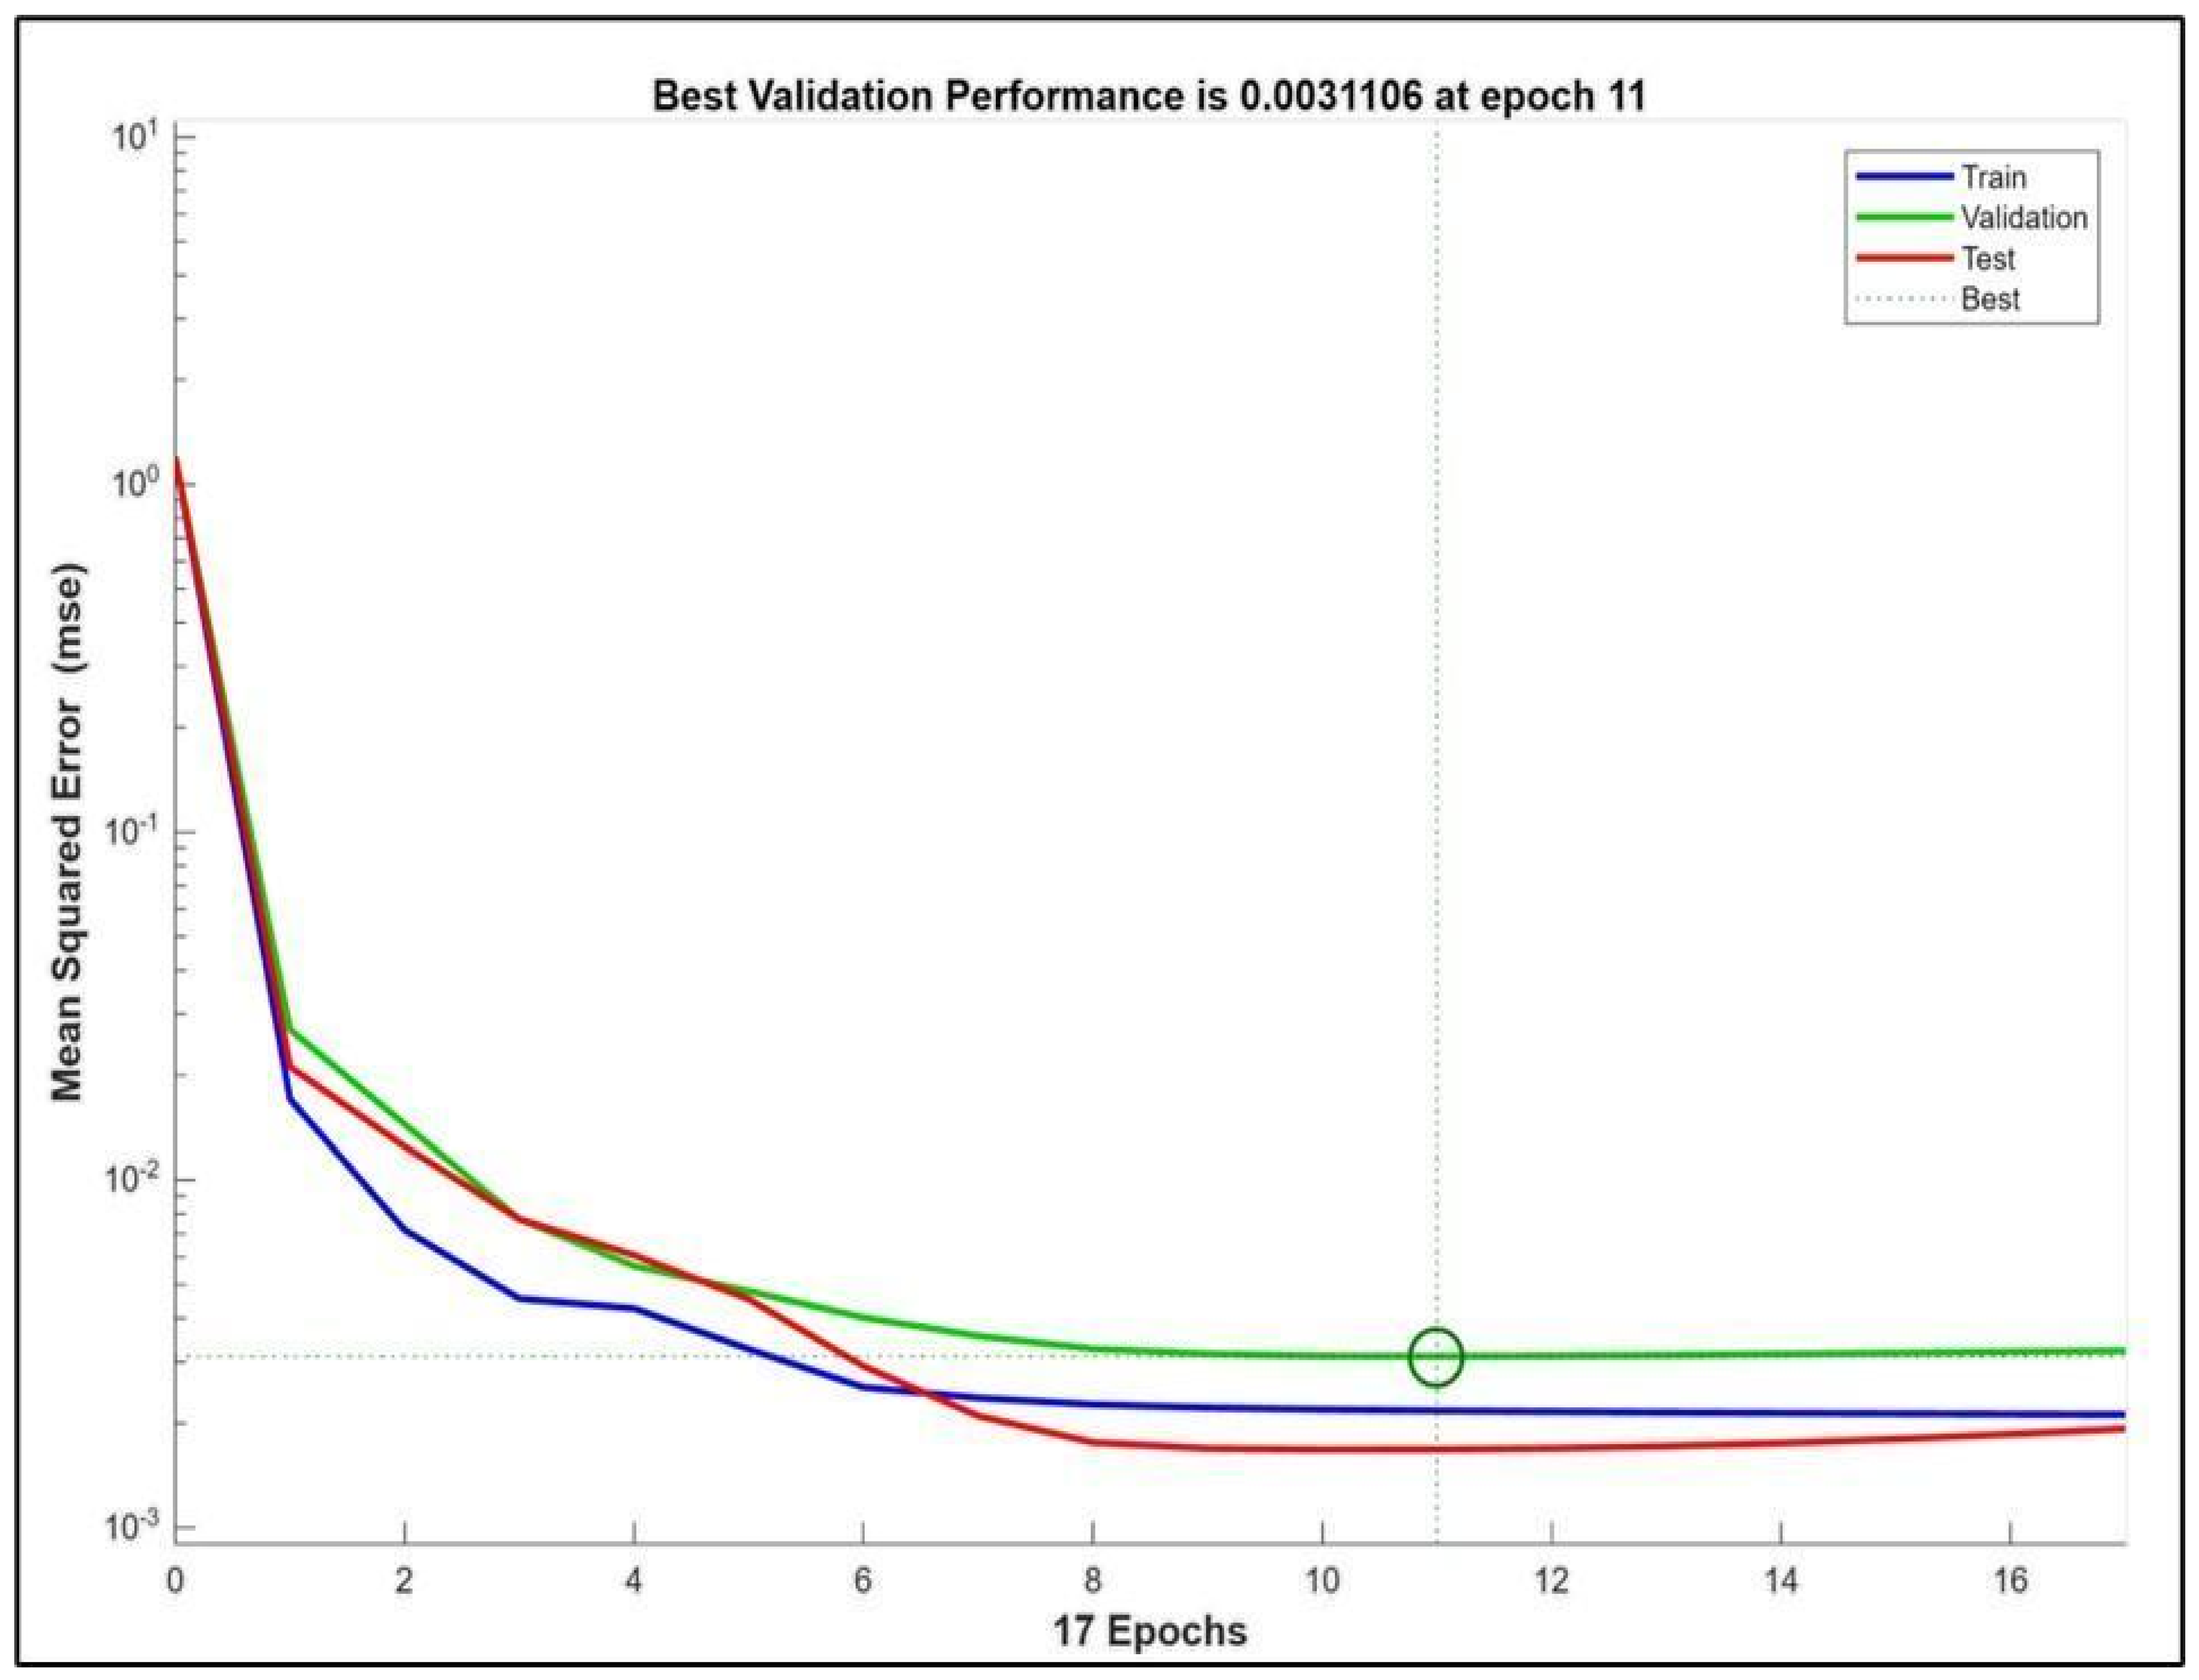
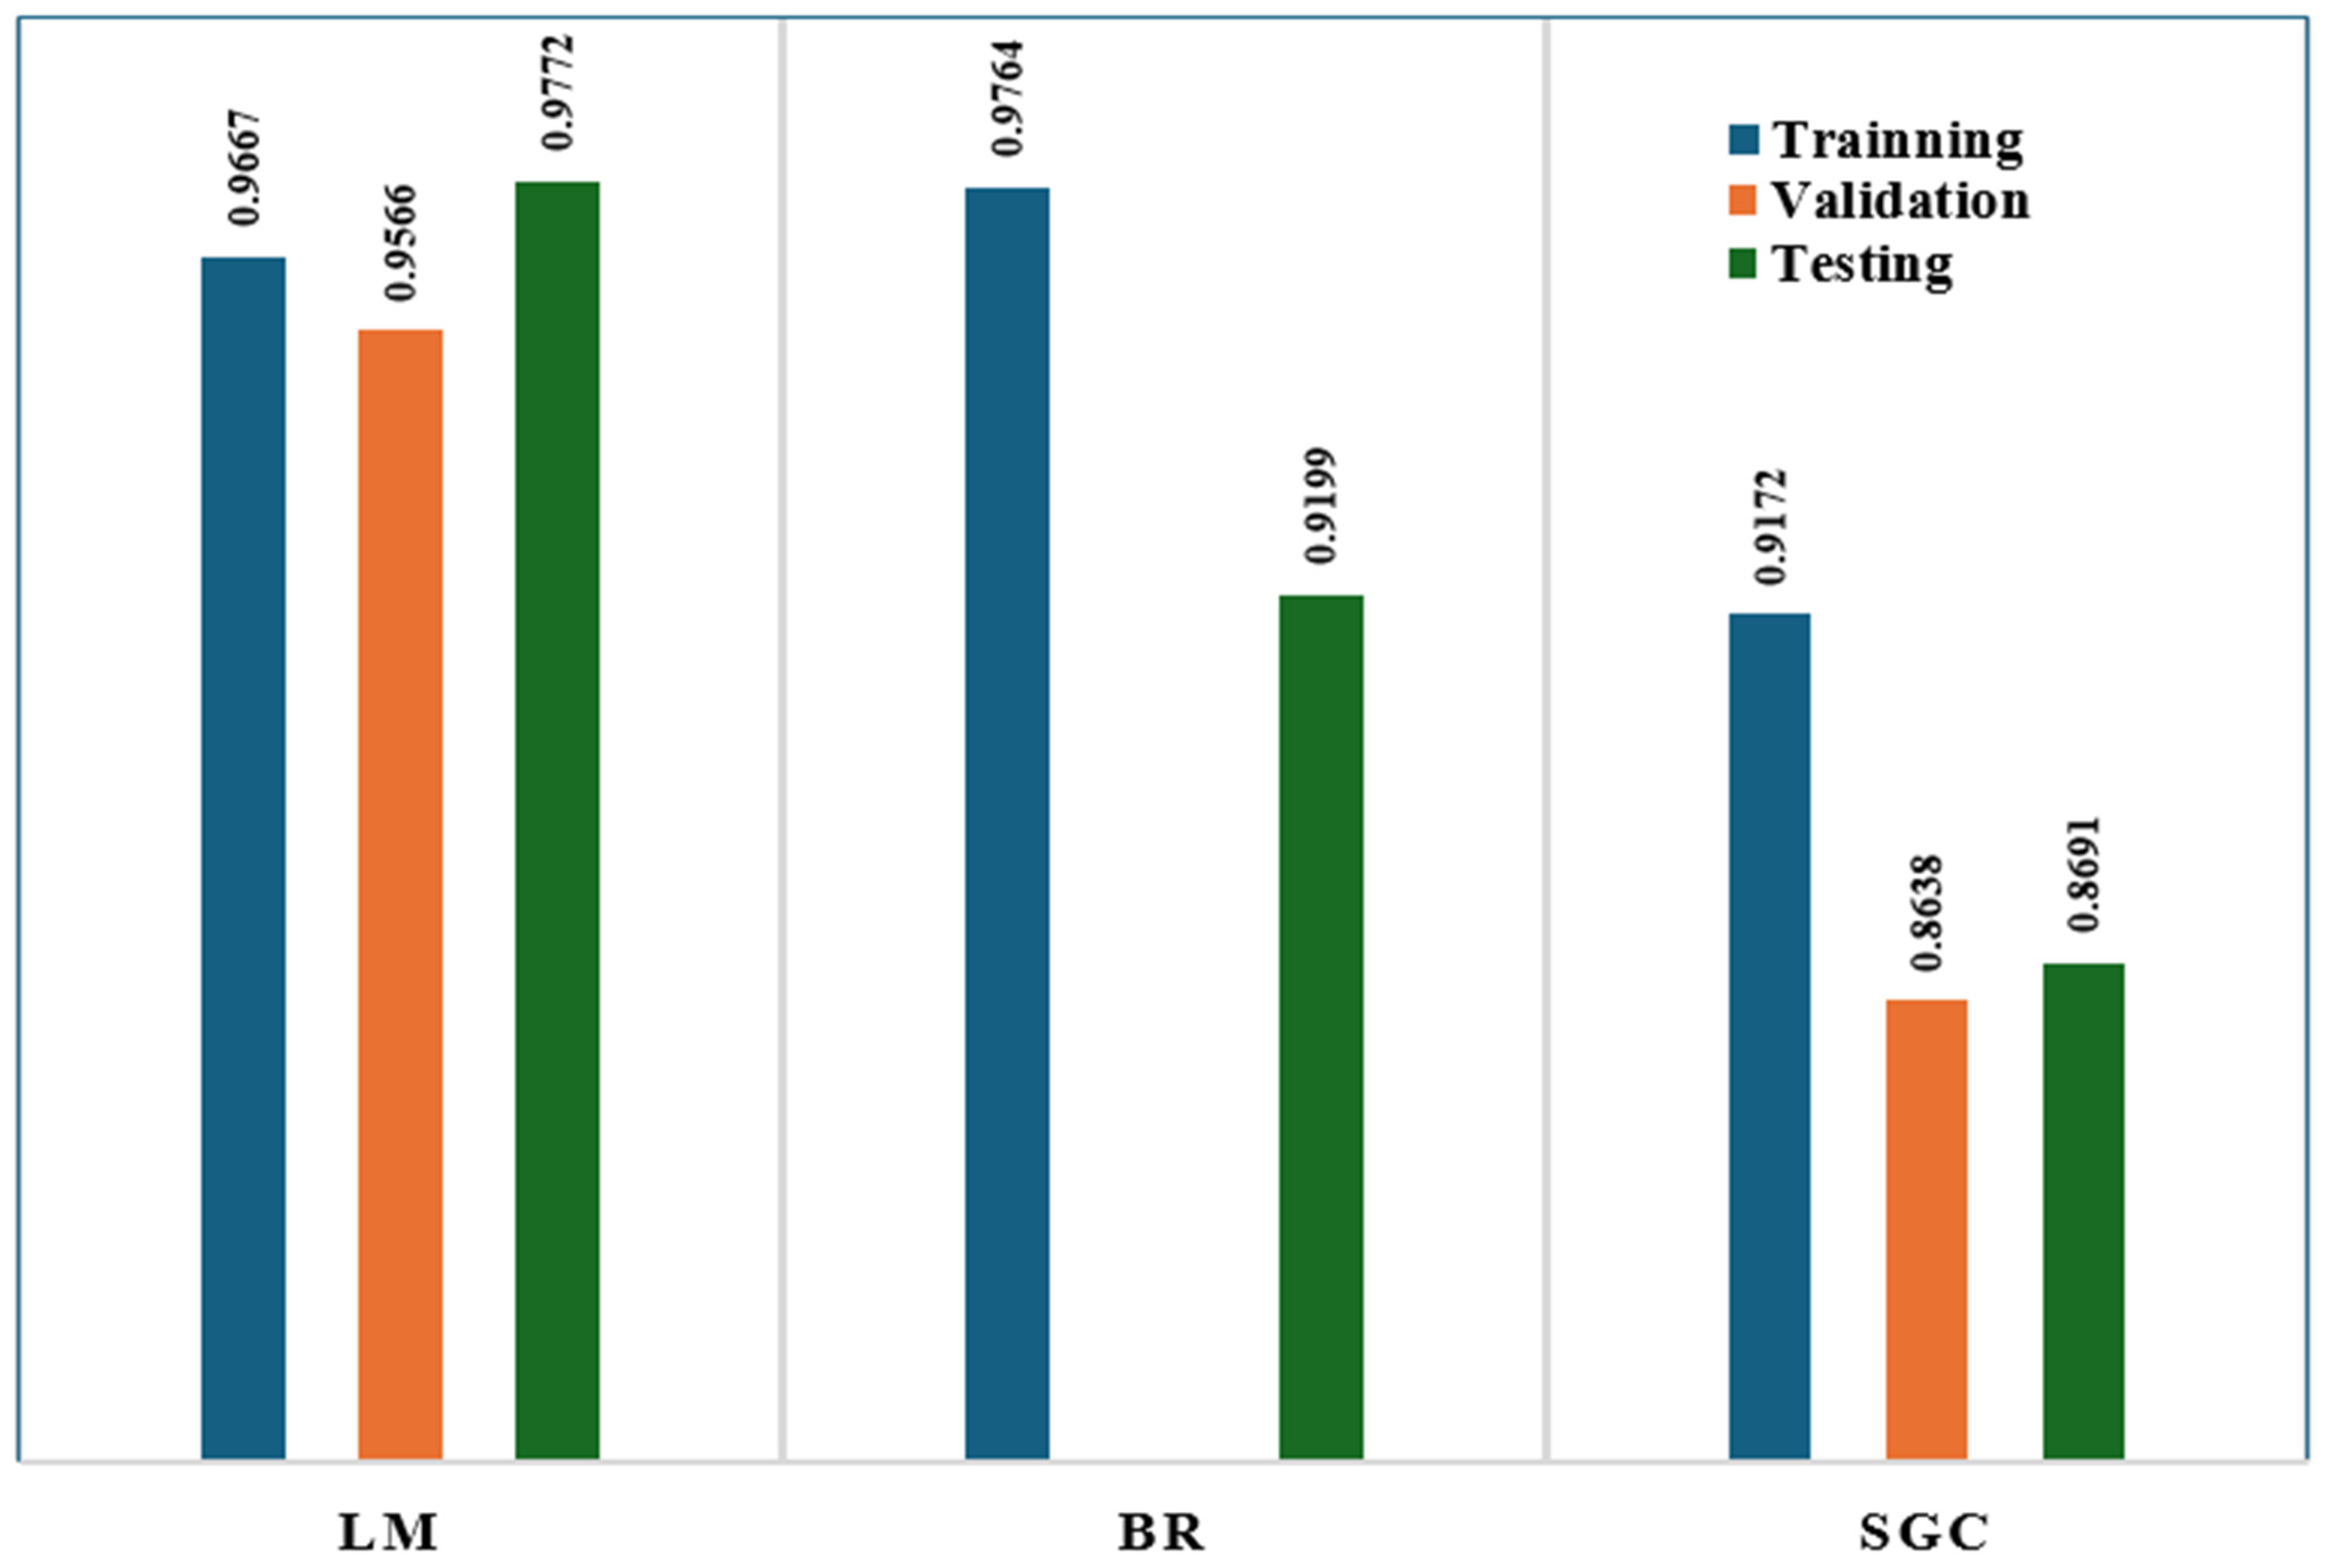
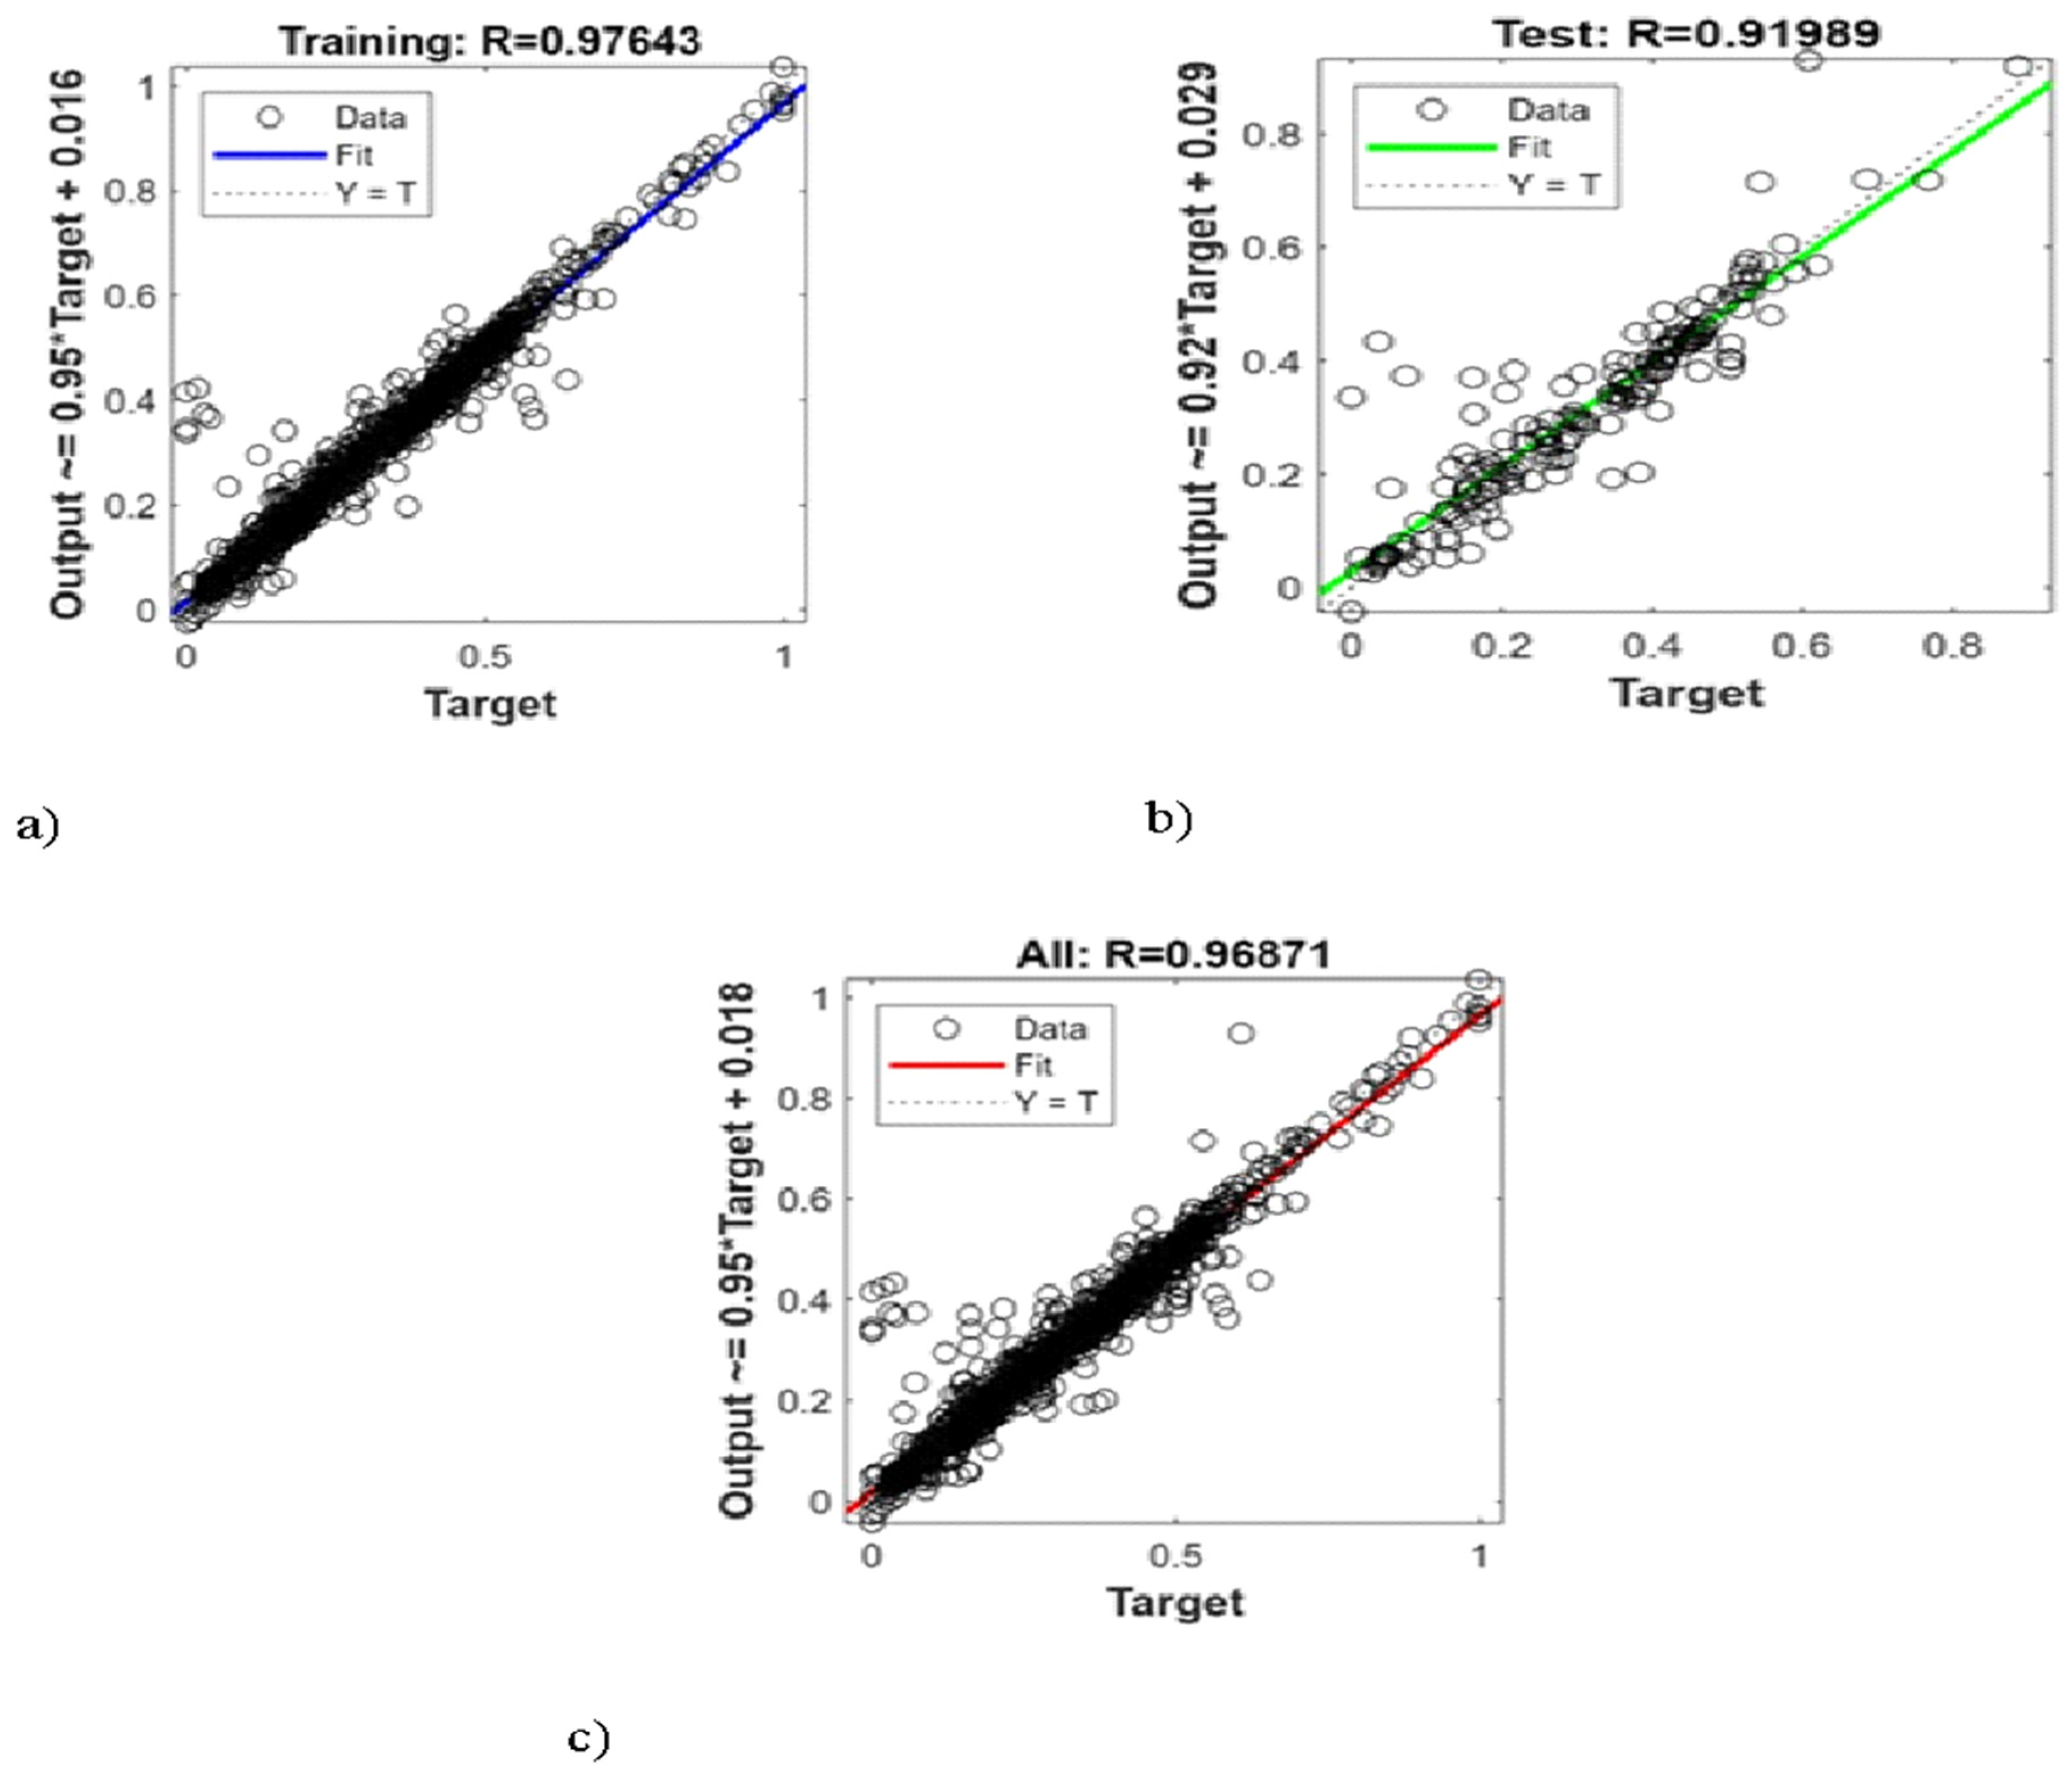
4.2. Evaluating the Reliability and Accuracy of the Models

Following this analysis, an ANN model was constructed based on data from 250 simulation runs divided into training (70%), validation (15%), and testing (15%) sets. Moreover, this study encompasses an evaluation of three ANN training algorithms, namely Levenberg–Marquardt (LM), Bayesian Regularization (BR), and scaled conjugate gradient (SCG), to forecast carbon storage potential in saline aquifers.
Figure 10 illustrates the accuracy of Bayesian Regularization using three scatter plots. Each plot represents the connection between the predicted outputs from the ANN model and the actual data, likely utilized for regression analysis. The first plot on the left, labeled as “Training”, displays a fit line that showcases how well the predicted values align with the actual values in the training dataset (Figure 10a). The correlation coefficient (R) stands at 0.97643, indicating a correlation and implying that the model effectively predicts training data. Moving to the plot labeled as “Test” featuring a green fit line (Figure 10b), the test dataset with an R-value of 0.91989 signifies a correlation, albeit one lower than that of the training set, suggesting a slightly diminished performance of the model on unseen data. Lastly, examining the plot titled “All” (Figure 10c) which encompasses all data points (both training and test), we observe a correlation coefficient for the entire dataset at 0.96871. This indicates that the overall predictive performance across all data is robust.
Figure 11 displays a graph illustrating the squared error (MSE) of a machine learning model’s performance, throughout its training process, measured across training epochs. The y-axis (logarithmic scale) indicates the error, which measures the average of the squares of errors. The x-axis shows the number of epochs or iterations that the training process has undergone. The red line (train) represents the MSE for the training dataset at each epoch, reflecting how well the model fits to the training data. Meanwhile, the blue line (test) shows the MSE for the testing dataset, indicating how effectively the model predicts unseen data. The line (best) highlights when the training performance with the best MSE was achieved. These patterns suggest that both training and testing errors decrease significantly in epochs, signifying learning and notable enhancement in model performance. Following this decline, both lines stabilize, while there is a decrease in the training MSE before leveling off, suggesting that the model has largely converged and is not markedly improving on its trained data anymore. The highest performance was reached during epoch 205, as indicated by the line, which represents the optimal training achievement, with an MSE of 0.0016234.
The divergence between the training and testing trajectories following the epochs indicates a disparity in how the model performs on familiar data compared to unfamiliar data. This implies overfitting, where the model picks up patterns in the training data that may not apply effectively to new datasets.
Figure 12 shows a histogram displaying errors categorized into 20 bins and was utilized to showcase the distribution of prediction errors by the ANN model during both the training and testing phases. The x-axis represents the variance between predicted values (outputs) and actual values (targets), while the y-axis indicates the frequency of errors falling within each bin. Additionally, a vertical orange line at zero error signifies instances where predictions perfectly align with values.
The histogram demonstrates high model accuracy as instances, from both the training and testing datasets, cluster near the zero-error point. This suggests that for several predictions, the model’s output closely matches the targets. The spread of bars beyond the peak provides insights into error variance, with narrower central peaks and fewer instances in bins indicating a more consistent and accurate model. The varying heights of the red bars in each bin illustrate how well the model performs on training data compared to test data. It is best if the performance, in both training and testing sets, is consistent across all categories, showing that the model can adapt effectively. A notable gap could suggest problems such as overfitting, especially if the errors in training are significantly lower.
In Figure 13, four scatter plots demonstrated how the scaled conjugate gradient model performed on various data subsets, namely training, test, and validation, and the combined dataset (all). Each plot depicted the relationship between the model’s predicted outputs and the actual values. The top left plot (training) had a correlation coefficient of 0.9172, indicating a correlation and accurate predictions on the training data. On the other hand, the top right plot (validation) showed a lower correlation of 0.86385 compared to training, suggesting that the model performs slightly less effectively but still reasonably well on this unseen dataset. The bottom left plot (test) had a similar correlation coefficient of 0.8691 to validation, indicating generalization to data but at a slightly lower level than training. The plot (all) with an R-value of 0.90143 aggregating performance across all datasets showcased strong overall predictive performance.
In Figure 14, the mean squared error (MSE) illustrates how an ANN model performed over training epochs by comparing three datasets: training, validation, and test. The y-axis represents the squared error, which is a measurement of the average squares of errors showing the average squared difference between the model’s estimated values and the actual estimated values. Using a log scale helps in visualizing changes across a range of error magnitudes. On the x-axis, we see the number of training epochs, illustrating how the model’s training progresses over time. All three lines exhibit a decrease in the MSE in the training phase, indicating quick learning and significant enhancements in model performance. Following this drop, the lines start to converge and level off, indicating that the model is nearing its learning limit from existing data with further improvements in reducing errors.
The circular marker on the validation line at epoch 35 highlights where the lowest MSE for the validation set occurs, suggesting this as a model without overfitting after adequate training. The MSE value, at this stage, is 0.0088774.
Figure 13. Scaled conjugate gradient model efficiency.
Sustainability 17 02904 g013
Figure 14. Scaled conjugate gradient model performance.
Sustainability 17 02904 g014
Figure 15 displays the distribution of prediction errors generated by the model across three datasets: training, validation, and test. The histogram reveals that most errors cluster around zero, indicating that the model’s predictions closely match the values. This suggests that the model is generally accurate. The majority of errors are concentrated in bins with instances of larger errors in both directions, demonstrating that significant errors are infrequent, which is favorable for a predictive model. The distribution of errors in the training data is similar to that of the validation and test data, albeit with variations in frequency in the bins.
The training data appear centered and compact, indicating a fit between the models and training data. Meanwhile, validation data play a role in assessing how well the model performs on data. The resemblance between the patterns of bars and blue bars during validation suggests generalization. The test data evaluates how well the model performs under conditions. The alignment of bars with green ones indicates strong generalization by the model, although there are some areas where test errors are slightly higher, pointing to potential limitations or areas for enhancement within the model.
Figure 15. Scaled conjugate gradient error histogram.
Sustainability 17 02904 g015
In Figure 16, the Levenberg–Marquardt (LM) performance was displayed, showcasing plots for the training, validation, test, and entire datasets (combining all data). The top left plot (training) with R = 0.96665 indicated a correlation between the model’s predictions and actual values in the training dataset, demonstrating excellent model performance during training. The validation performance with R = 0.95665 showed a level of accuracy.
The test plot R = 0.97719 showcased a correlation for the test dataset compared to the training set, suggesting that the model is well tuned and generalizes effectively to new data. The bottom right plot (all) with R = 0.9666 reflected a correlation across all data subsets (training, validation, test, and combined), indicating the consistent performance of the model across different datasets.
Figure 16. Levenberg–Marquardt gradient model efficiency.
Sustainability 17 02904 g016
The performance plot in Figure 17 illustrates how the mean squared error (MSE) evolves over different epochs for the training, validation, and test datasets during the training process of an artificial neural network (ANN). The x-axis represents the number of epochs, which indicates how many times the model has passed through the entire dataset, while the y-axis (logarithmic scale) represents the MSE, a measure of prediction error. Lower MSE values indicate better performance, meaning the predicted values are closer to the actual values.
At the start of training (epoch 0), the MSE is relatively high for all three datasets (training, validation, and test), indicating that the model initially makes large errors. However, as training progresses, the errors rapidly decrease, demonstrating that the model is learning and improving its predictions. The training error (blue line) continues to decrease steadily, showing that the model is fitting the training data well. The validation error (green line) also decreases initially, reaching its lowest point at epoch 11, where the best validation performance (MSE = 0.0031106) is recorded, as indicated by the green circle. The test error (red line) follows a similar trend, showing that the model performs well on unseen data.
Beyond epoch 11, the validation error begins to level off and slightly increase, while the training error continues to decrease. This suggests the onset of overfitting, where the model starts memorizing the training data instead of learning generalizable patterns. Overfitting reduces the model’s ability to make accurate predictions on new data. Ideally, training should be stopped at the point of the best validation performance (epoch 11) using early stopping to prevent unnecessary overfitting and ensure the best generalization.
Overall, this plot indicates that the ANN model effectively learns from the data, with a well-defined optimal stopping point at epoch 11. The relatively small gap between the training, validation, and test errors suggests that the model generalizes well. However, stopping at the optimal epoch is crucial to maintaining this generalization ability, ensuring reliable predictions for CO2 sequestration potential and other reservoir engineering applications.
Figure 17. Levenberg–Marquardt model performance. Note: the circle represent the number of epoches.
Sustainability 17 02904 g017
Figure 18 of the LM error histogram reveals a clustering of instances in bins, particularly around zero. This pattern indicates that a large portion of predictions made by the model are very close to the values that indicate accuracy levels. It seems that errors in validation data align closely with those in training data during the validation phase, signifying the generalization of the model at this stage. The prominent peak in the bin is mostly positive as it suggests that most predictions are accurate. The narrow histogram distribution, around zero error, is considered optimal, suggesting that deviations from the values are minimal. This suggests that the ANN effectively captures the complex relationships between input parameters and CO2 trapping mechanisms. The training dataset (blue bars) dominates the distribution, which is expected, as the model is optimized to fit these data. The validation and test datasets (green and red bars, respectively) also show errors mostly centered around zero, though with slightly wider distributions, indicating a small degree of variability when applied to unseen data.
The symmetry of the error distribution suggests that the model is not systematically biased toward overestimating or underestimating CO2 storage, which is a positive indication of balanced predictions. However, there are some larger error values at both extremes, suggesting that in a few cases, the model struggles to accurately predict CO2 storage. These outliers may be due to complex geological conditions or edge cases that were not well represented in the training data. Improving the model’s accuracy in these scenarios could involve expanding the dataset to cover more geological variations, refining feature selection, or incorporating additional geomechanical and geochemical factors.
Overall, the histogram confirms that the ANN model performs well, with errors being low and well distributed across datasets, ensuring strong generalization and reliability for CO2 sequestration predictions. However, addressing the small number of high-error cases could further enhance the model’s robustness, making it even more suitable for real-world CCS applications.
Finally, Figure 19 presents the R2 (coefficient of determination) values for three different machine learning algorithms—Levenberg–Marquardt (LM), Bayesian Regularization (BR), and scaled conjugate gradient (SCG)—evaluated across training, validation, and testing datasets. The results provide valuable insights into the accuracy, generalization capability, and robustness of these models in predicting CO2 sequestration potential under different trapping mechanisms in saline aquifers.
Among the models, Bayesian Regularization (BR) achieves the highest R2 value in the training phase, indicating that it fits the training data exceptionally well. However, its performance drops noticeably in the validation and testing phases, which is a strong indicator of overfitting. This suggests that BR may have learned the noise and specific patterns of the training dataset rather than the underlying general relationships, limiting its ability to make accurate predictions for new, unseen data.
In contrast, scaled conjugate gradient (SCG) exhibits lower R2 values across all datasets, meaning it is less effective at capturing the variance in CO2 storage data. The weaker performance of SCG suggests that the algorithm struggles to model the non-linear relationships governing CO2 trapping mechanisms, potentially due to its gradient-based optimization strategy, which might not be well suited for complex, high-dimensional datasets in reservoir engineering applications.
On the other hand, the Levenberg–Marquardt (LM) model demonstrates strong R2 values across training, validation, and testing datasets, with particularly high performance in the testing phase. This indicates that LM effectively balances accuracy and generalization, making it resilient to overfitting while still capturing the intricate relationships governing CO2 storage in saline aquifers. The superior generalization performance of LM suggests that it can provide reliable predictions for real-world CCS applications, ensuring that future storage sites are optimally designed based on accurate forecasts of supercritical, residual, structural, mineralized, and dissolved CO2 storage.
Furthermore, the robust performance of the LM algorithm aligns with its well-established reputation for handling non-linear optimization problems efficiently, making it a preferred choice for modeling complex subsurface processes. Unlike other gradient-based approaches, LM blends the advantages of both Gauss–Newton and gradient descent methods, allowing it to converge quickly with minimal computational overhead while maintaining high accuracy. This makes it an ideal candidate for large-scale CO2 storage simulations, where computational efficiency and precision are both crucial.
Overall, the findings confirm that the Levenberg–Marquardt model is the most suitable choice for CO2 sequestration predictions, as it consistently provides high accuracy across all data splits. Its ability to generalize well to unseen (test) data makes it particularly valuable for long-term carbon storage planning, risk assessment, and decision-making in sustainable CCS projects. By leveraging this advanced machine learning approach, the study ensures that CO2 trapping mechanisms are effectively modeled, reducing uncertainties and contributing to more secure and efficient carbon storage strategies.
Figure 19. R2 values of different algorithms.
Sustainability 17 02904 g019

4.3. Strengths, Limitations and Future Work

Our study presents several key strengths that distinguish it from previous models. It incorporates a broader range of input parameters, including aquifer volume, hysteresis coefficient, and pressure variations, which are often overlooked in prior studies. Additionally, it predicts all major CO2 trapping mechanisms—residual, solubility, mineral, and structural—providing a comprehensive evaluation of sequestration performance. The model offers greater flexibility and evaluation leverage by allowing users to analyze how different reservoir properties influence CO2 storage efficiency, making it a practical tool for decision-making across diverse geological settings. Furthermore, validation and sensitivity analysis have been strengthened, as the revised model includes a sensitivity analysis demonstrating the impact of input parameters on trapping mechanisms, thus reinforcing its robustness. ANN-based predictions have also been benchmarked against physics-based simulations, ensuring consistency with well-established reservoir models.
Also, it helps with one of the most critical phases of any carbon capture and storage (CCS) project to identify optimal storage sites that ensure maximum CO2 retention and minimal environmental risks. The proposed artificial neural network (ANN) model can be used to streamline this process by evaluating potential storage sites based on key geological parameters such as reservoir thickness, porosity, permeability, and aquifer volume. By leveraging simulation-driven predictions, it can determine a site’s long-term viability. It also identifies the most favorable trapping mechanisms, such as structural, residual, and dissolved trapping, providing insights for risk mitigation strategies. Additionally, the model can enhance regulatory compliance by generating data-driven forecasts that align with government and industry standards for CCS projects. By integrating this approach early in the site selection phase, high-potential reservoirs can be prioritized, reducing uncertainties and ensuring the efficient allocation of financial and technical resources.
The ANN model plays a vital role in operational planning by optimizing CO2 injection rates, ensuring that the different trapping mechanisms are enhanced while preventing formation fracturing or unwanted pressure accumulation. Additionally, the model predicts storage capacity over time, allowing engineers to determine the ideal injection duration and volume based on reservoir characteristics. By simulating various operational scenarios, the model helps identify the most effective long-term sequestration strategies. Furthermore, integrating the ANN model with real-time monitoring data enables operators to dynamically adjust injection parameters, responding proactively to unexpected subsurface changes. Incorporating ANN-driven predictions into reservoir management workflows improves CO2 retention efficiency, extends the storage site’s lifespan, and reduces operational risks, making it a crucial tool for optimizing CCS projects.
Despite these strengths, securing real field data for validation remains a significant challenge. The long-term nature of CO2 trapping means that mechanisms such as mineralization and residual trapping take decades or centuries to develop, and there are no fully mature CO2 storage projects with complete injection and long-term monitoring data available for validation. Additionally, limited public data from CO2 storage sites restricts access to critical field information, as most projects focus primarily on short-term injection monitoring, and existing data are often proprietary. These limitations create barriers to fully validating the model’s performance against real-world CO2 storage scenarios, highlighting the need for alternative verification approaches, such as synthetic data generation and advanced numerical simulations.
While the proposed ANN model demonstrates strong predictive capabilities for CO2 storage and trapping mechanisms, it is important to acknowledge its inherent limitations. One of the primary challenges of ANN models is their lack of interpretability, often referred to as the “black-box” nature of neural networks. Unlike traditional physics-based reservoir models, which provide clear cause-and-effect relationships between inputs and outputs, ANNs rely on complex, non-linear transformations that make it difficult to directly interpret how specific parameters influence CO2 trapping behavior.
To address this limitation, sensitivity analysis was conducted to determine the relative importance of input parameters, highlighting which geological and operational factors have the most significant impact on CO2 storage. This helped to identify the key drivers of CO2 trapping efficiency, offering greater confidence in the model’s outputs.
Another critical aspect that requires discussion is model uncertainty. Given that ANNs are data-driven, their performance is highly dependent on the quality, representativeness, and completeness of the training dataset. In cases where certain reservoir conditions are underrepresented in the dataset, the model may struggle to generalize, leading to higher prediction uncertainties. To mitigate this, future work should focus on incorporating uncertainty quantification techniques, such as Monte Carlo simulations or Bayesian neural networks, which can provide confidence intervals around predictions and help assess the model’s reliability in various geological scenarios.
For future development, the model should incorporate detailed geomechanical considerations, including cap rock integrity, fault networks, and fracture behavior, to better capture the structural stability of CO2 storage sites. Additionally, geochemical interactions between rock minerals and formation water across different lithologies should be integrated to improve the accuracy of mineral trapping predictions. By addressing these factors, future research can enhance the model’s ability to provide a more comprehensive and realistic representation of CO2 storage dynamics, ultimately improving its applicability and reliability in diverse geological settings.

5. Conclusions

The study has effectively integrated the CMG-GEM simulation data and artificial neural networks (ANNs) models using MATLAB in a robust method for predicting the potential of carbon storage and sequestration in saline aquifers.
  • The generation of the diverse dataset from 250 CMG-GEM simulations using detailed sensitivity analysis in the development of ANN models yielded a diverse dataset covering several subsurface and operation scenarios.
  • This generated dataset is used to develop different ANN models with different algorithms while including the optimization of the number of inputs, outputs, and hidden layers.
  • Then, based on the results, the final ANN was chosen to encompass 9 inputs with 10 hidden layers and 5 outputs.
  • The inputs represented in the geological and operational parameters include the porosity, grid thickness, both horizontal and vertical permeability, injection rate, bottom hole flowing pressure, hysteresis factor, aquifer volume, and reservoir pressure.
  • The outputs included the CO2 trapping states, including structural, residual, dissolved, mineralized, and total (supercritical).
  • The Levenberg–Marquardt (LM) algorithm is selected as it showed higher stability and efficiency compared to the other algorithms, with an impressive coefficient of determination (R2) of 0.977 in forecasting CO2 sequestration.
  • The methodology deployed in the research provides a scalable framework that leverages sophisticated simulation tools alongside machine learning techniques, thereby enriching our comprehension of CCS processes. A sensitivity analysis integral to the simulation phase was instrumental in pinpointing pivotal parameters that influence CO2 sequestration, which in turn guided the development of the ANN model and ensured its applicability to practical scenarios.
Furthermore, the predictive model achieved in the study can provide a crucial contribution to the risk assessment processes, economic analyses, and site selection criteria for CCS projects to overcome the threats of climate change and pave the way for more effective and proper carbon management strategies.
Finally, from a sustainability perspective, this model plays a crucial role in enhancing the efficiency and environmental responsibility of carbon capture and storage (CCS) practices. By providing accurate predictions of CO2 behavior, it enables the better planning and management of storage sites, ensuring that CO2 is securely trapped with minimal risk of leakage. This not only enhances the long-term stability of sequestration projects but also helps mitigate potential environmental impacts. Ultimately, the model supports the transition toward more sustainable carbon management solutions, contributing to the global efforts reducing greenhouse gas emissions and combating climate change.

Author Contributions

Conceptualization, M.H. and E.S.; methodology, M.H.; software, M.H.; validation, M.H.; formal analysis, M.H.; investigation, M.H. and E.S.; resources, M.H.; data curation, M.H.; writing—original draft preparation, M.H.; writing—review and editing, M.H. and E.S.; visualization, M.H; supervision, E.S.; project administration, M.H. and E.S.; funding acquisition, N/A. All authors have read and agreed to the published version of the manuscript.

Funding

This research received no funding.

Institutional Review Board Statement

Not applicable.

Informed Consent Statement

Not applicable.

Data Availability Statement

Data may be available upon request.

Acknowledgments

We would like to express our sincere gratitude to Jacob Muthu for his valuable contribution to the initial proofreading of this paper. His expertise and thoughtful feedback were greatly appreciated.

Conflicts of Interest

The authors declare no conflict of interest.

References

  1. Aminu, M.; Nabavi, S.; Rochelle, C.; Manović, V. A review of developments in carbon dioxide storage. Appl. Energy 2017, 208, 1389–1419. [Google Scholar] [CrossRef]
  2. Umrani, R.; Jones, R.; Ware, C.; Janise, D.; Ozah, R.; Joshi, N. Evaluating an Area of Review for CO2 Sequestration and Storage: A Subsurface Modelling Workflow Tied to Regulatory Guidelines. In Proceedings of the Offshore Technology Conference, Houston, TX, USA, 1–4 May 2023. [Google Scholar] [CrossRef]
  3. Leung, D.; Caramanna, G.; Maroto-Valer, M. An overview of current status of carbon dioxide capture and storage technologies. Renew. Sustain. Energy Rev. 2014, 39, 426–443. [Google Scholar] [CrossRef]
  4. McLaughlin, H.; Littlefield, A.A.; Menefee, M.; Kinzer, A.; Hull, T.; Sovacool, B.K.; Bazilian, M.D.; Kim, J.; Griffiths, S. Carbon capture utilization and storage in review: Sociotechnical implications for a carbon reliant world. Renew. Sustain. Energy Rev. 2023, 177, 113215. [Google Scholar] [CrossRef]
  5. Xu, S.; Baslaib, M.; Keebali, A.; Para, H.; BinAmro, A. Potential for Permanent CO2 Geological Storage, an Onshore Abu Dhabi Large Scale Assessment. In Proceedings of the Abu Dhabi International Petroleum Exhibition and Conference, Abu Dhabi, United Arab Emirates, 31 October 2022. [Google Scholar] [CrossRef]
  6. Yusuf, M.; Ibrahim, H. A comprehensive review on recent trends in carbon capture, utilization, and storage techniques. J. Environ. Chem. Eng. 2023, 11, 111393. [Google Scholar] [CrossRef]
  7. Peter, K.; Sally, M.B.; Hélène, P.; Peter, P.; Jennifer, W. An Overview of the Status and Challenges of CO2 Storage in Minerals and Geological Formations. Front. Clim. 2019, 1, 9. [Google Scholar] [CrossRef]
  8. Mwenketishi, G.T.; Benkreira, H.; Rahmanian, N. A Comprehensive Review on Carbon Dioxide Sequestration Methods. Energies 2023, 16, 7971. [Google Scholar] [CrossRef]
  9. Benson, S.; Orr, F. Carbon Dioxide Capture and Storage. MRS Bull. 2008, 33, 303–305. [Google Scholar] [CrossRef]
  10. Bashir, A.; Ali, M.; Patil, S.; Aljawad, M.S.; Mahmoud, M.; Al-Shehri, D.; Hoteit, H.; Kamal, M.S. Comprehensive review of CO2 geological storage: Exploring principles, mechanisms, and prospects. Earth-Sci. Rev. 2024, 249, 104672. [Google Scholar] [CrossRef]
  11. Kamashev, A.; Amanbek, Y. Reservoir Simulation of CO2 Storage Using Compositional Flow Model for Geological Formations in Frio Field and Precaspian Basin. Energies 2021, 14, 8023. [Google Scholar] [CrossRef]
  12. Application of artificial neural networks for reservoir characterization with limited data. J. Pet. Sci. Eng. 2005, 49, 212–222. [CrossRef]
  13. Bachu, S. CO2 Storage in Geological Media: Role, Means, Status and Barriers to deployment. Prog. Energy Combust. Sci. 2008, 34, 254–273. [Google Scholar] [CrossRef]
  14. Bachu, S.; Bonijoly, D.; Bradshaw, J.; Burruss, R.; Holloway, S.; Christensen, N.P.; Mathiassen, O.M. CO2 storage capacity estimation: Methodology and gaps. Int. J. Greenh. Gas Control 2007, 1, 430–443. [Google Scholar] [CrossRef]
  15. Song, Y.; Sung, W.; Jang, Y.; Jung, W. Application of an artificial neural network in predicting the effectiveness of trapping mechanisms on CO2 sequestration in saline aquifers. Int. J. Greenh. Gas Control 2020, 98, 103042. [Google Scholar] [CrossRef]
  16. Khanal, A.; Shahriar, M.F. Physics-Based Proxy Modeling of CO2 Sequestration in Deep Saline Aquifers. Energies 2022, 15, 4350. [Google Scholar] [CrossRef]
  17. Bourg, I.; Beckingham, L.; DePaolo, D. The Nanoscale Basis of CO2 Trapping for Geologic Storage. Environ. Sci. Technol. 2015, 49, 10265–10284. [Google Scholar] [CrossRef] [PubMed]
  18. Saadatpoor, E.; Bryant, S.L.; Sepehrnoori, K. New Trapping Mechanism in Carbon Sequestration. Transp. Porous Media 2010, 82, 3–17. [Google Scholar] [CrossRef]
  19. Novak Mavar, K.; Gaurina-Medimurec, N.; Hrnčević, L. Significance of Enhanced Oil Recovery in Carbon Dioxide Emission Reduction. Sustainability 2021, 13, 1800. [Google Scholar] [CrossRef]
  20. Burnside, N.; Naylor, M. Review and implications of relative permeability of CO2/brine systems and residual trapping of CO2. Int. J. Greenh. Gas Control 2014, 23, 1–11. [Google Scholar] [CrossRef]
  21. Emami-Meybodi, H.; Hassanzadeh, H.; Green, C.P.; Ennis-King, J. Convective dissolution of CO2 in saline aquifers: Progress in modeling and experiments. Int. J. Greenh. Gas Control 2015, 40, 238–266. [Google Scholar] [CrossRef]
  22. Iglauer, S. Dissolution Trapping of Carbon Dioxide in Reservoir Formation Brine—A Carbon Storage Mechanism; INTECH Open Access Publisher: London, UK, 2011; pp. 233–262. [Google Scholar] [CrossRef]
  23. Dumitrache, L.N.; Suditu, S.; Ghețiu, I.; Pană, I.; Brănoiu, G.; Eparu, C. Using Numerical Reservoir Simulation to Assess CO2 Capture and Underground Storage, Case Study on a Romanian Power Plant, and Its Surrounding Hydrocarbon Reservoirs. Processes 2023, 11, 805. [Google Scholar] [CrossRef]
  24. Farajzadeh, R.; Salimi, H.; Zitha, P.L.J.; Bruning, J. Numerical Simulation of Density-Driven Natural Convection in Porous Media with Application for CO2 Injection Projects. Int. J. Heat Mass Transf. 2007, 50, 5054–5064. [Google Scholar] [CrossRef]
  25. Muradkhanli, L. Neural Networks for Prediction of Oil Production. IFAC-Pap. Online 2018, 51, 415–417. [Google Scholar] [CrossRef]
  26. Khan, C.; Ge, L.; Rudolph, V. Reservoir Simulation Study for CO2 Sequestration in Saline Aquifers. Int. J. Appl. Sci. Eng. 2015, 5, 30–45. [Google Scholar]
  27. You, J.; Ampomah, W.; Sun, Q.; Kutsienyo, E.J.; Balch, R.S.; Cather, M. Multi-Objective Optimization of CO Enhanced Oil Recovery Projects Using a Hybrid Artificial Intelligence Approach. In Proceedings of the SPE Annual Technical Conference and Exhibition, Calgary, AB, Canada, 30 September–2 October 2019. [Google Scholar] [CrossRef]
  28. Wen, G.; Li, Z.; Long, Q.; Azizzadenesheli, K.; Anandkumar, A.; Benson, S.M. Real-time High-resolution CO2 Geological Storage Prediction using Nested Fourier Neural Operators. Energy Environ. Sci. 2023, 16, 1732–1741. [Google Scholar] [CrossRef]
  29. Tang, M.; Ju, X.; Durlofsky, L.J. Deep-learning-based coupled flow-geomechanics surrogate model for CO2 sequestration. Int. J. Greenh. Gas Control 2022, 118, 103692. [Google Scholar] [CrossRef]
  30. Thanh, H.V.; Lee, K.-K. Application of machine learning to predict CO2 trapping performance in deep saline aquifers. Energy 2022, 239, 122457. [Google Scholar] [CrossRef]
  31. Ranganathan, P.; van Hemert, P.; Rudolph, E.S.J.; Zitha, P.Z. Numerical modeling of CO2 mineralisation during storage in deep saline aquifers. Energy Procedia 2011, 4, 4538–4545. [Google Scholar] [CrossRef]
  32. Shokir EM, E.M.; Hamed, M.M.; Ibrahim AE, S.; Mahgoub, I. Gas lift optimization using artificial neural network and integrated production modeling. Energy Fuels 2017, 31, 9302–9307. [Google Scholar] [CrossRef]
  33. Bahaa, M.; Shokir, E.; Mahgoub, I. Soft Computation Application: Utilizing Artificial Neural Network to Predict the Fluid Rate and Bottom Hole Flowing Pressure for Gas-lifted Oil Wells. In Proceedings of the Abu Dhabi International Petroleum Exhibition & Conference, Abu Dhabi, United Arab Emirates, 12–15 November 2018. [Google Scholar] [CrossRef]
  34. Ibrahim, A.F.; Elkatatny, S. Data-driven models to predict shale wettability for CO2 sequestration applications. Sci. Rep. 2023, 13, 10151. [Google Scholar] [CrossRef]
  35. The MathWorks Inc. MATLAB, version 9.13.0 (R2022b); The MathWorks Inc.: Natick, MA, USA, 2022; Available online: https://www.mathworks.com (accessed on 15 April 2024).
Figure 3. Contribution of different trapping mechanisms with time [24].
Sustainability 17 02904 g003
Figure 4. Basic working mechanism of neural networks.
Sustainability 17 02904 g004
Figure 5. Workflow schematic chart.
Sustainability 17 02904 g005
Figure 8. ANN model architect.
Sustainability 17 02904 g008
Figure 9. Correlation heatmap between inputs and outputs parameters.
Sustainability 17 02904 g009
Figure 10. Bayesian Regularization model efficiency.
Sustainability 17 02904 g010
Figure 11. Bayesian Regularization model performance.
Sustainability 17 02904 g011
Figure 12. Bayesian Regularization error histogram.
Sustainability 17 02904 g012
Figure 18. Levenberg–Marquardt error histogram.
Sustainability 17 02904 g018
Table 2. Saline aquifer system input parameters [8].
Aquifer ParametersValues
Grid number300,000 (100 × 100 × 30)
Length (m)1000
Width (m)1000
Depth at the top (m)1400
Thickness (m)30
Permeability (md)150
Porosity (%)0.23
Salinity (M)1.7
ComponentCO2
Critical Pressure (atm)72.8
Critical Temperature (K)304.2
Table 4. Comparison of MATLAB algorithms [35].
AlgorithmPerformance and AccuracyUse Cases
Bayesian Regularization (BR)
  • It helps in achieving better generalization by avoiding overfitting, which is especially useful for models that are intended to perform well on unseen data.
  • It is known for Automatic Complexity Tuning because it negates the need for the manual tuning of regularization parameters, as it automatically finds a balance between fitting the data and keeping the model simple.
Well-suited for regression problems and complex pattern recognition tasks where model generalization was crucial.
Scaled Conjugate Gradient (SCG)
  • It was computationally efficient, making it suitable for large-scale problems.
  • The algorithm does not require a line search per iteration, which reduces the number of function evaluations and further contributes to its efficiency.
It is advantageous for training large neural networks and handling datasets where computational resources are limited.
Levenberg–Marquardt (LM)
  • It is faster than other algorithms for training moderate-sized networks.
  • It is suitable for applications where time is a critical factor.
  • It often converges to a solution with a smaller sum of squared errors, providing high accuracy for the trained model.
It is effective for function approximation, pattern recognition, and time-series prediction problems where the dataset size is not excessively large.
Disclaimer/Publisher’s Note: The statements, opinions and data contained in all publications are solely those of the individual author(s) and contributor(s) and not of MDPI and/or the editor(s). MDPI and/or the editor(s) disclaim responsibility for any injury to people or property resulting from any ideas, methods, instructions or products referred to in the content.

