Abstract
The excessive occupation of ecological space (ES) due to city expansion and construction can reduce a variety of natural values and socioeconomic benefits, which would also bring challenges associated with ecological rights and justice between urban areas (with economic impetus) and rural areas (with rich ecological endowments). A more sustainable development mode is required to shift population–industry–land (PIL) allocation from urban-led commensalism (ULC) to PIL interaction by urban–rural mutualism (URM). Thus, an urban–rural integration six-step symbiotic framework (UISS) was built to reflect how the change in urban–rural integration symbiotic mode (the ULC to URM transformation process) can ameliorate socioeconomic inequity in ecological space (IES). Moreover, the two-way fixed-effects model and heterogeneity analysis are used to discuss how the improvement of urban–rural integration symbiotic development level (URI) ameliorates the IES under socioeconomic development to reduce the unfairness, differences between regions, and mismatch of gravity centers from the perspective of spatiotemporal and dynamic changes under various symbiotic environments. The comprehensive multi-perspective analysis of IES based on the symbiotic framework (MEU) was applied to reflect the effect of dynamic PIL interaction changes from ULC mode to URM mode on IES in Yunnan Province, China. The results can be obtained as follows: (1) The URI including symbiotic units of PIL shows a steady rise in growth, with a maximum growth rate of 22.89%, which indicates that the URI has changed from the urban-led commensalism development mode to the urban–rural mutualism development mode. (2) The IES in temporal unfairness has been steadily alleviated, but the spatial differences remain obvious due to the unique symbiotic environment. The dynamic changes in the distance of the gravity centers between ES and PO-IN reflect an increasing mismatch in some regions (e.g., Kunming), while decreasing in others (e.g., Qujing). (3) URI generates a significant symbiotic effect on IES to reduce unfairness, differences, and mismatch, especially through the integration of industrial and population symbiotic units. The heterogeneity analysis shows that a good symbiotic environment, including business environment, industrial structure, transportation conditions, and government size, is conducive to ameliorating IES through the environmental adaptability of symbiotic units. All the results can provide a scientific reference for regional sustainable planning and management under mutualistic population–industry–land interaction between urban and rural areas.
1. Introduction
The population–industry agglomeration in a central city and the expansion of construction land would restrict ecological space (ES) such as forest, grassland, and wetland, which would lead to the diminishment of a range of natural values and socioeconomic benefits that ecosystems provide [1]. As an important ecological security barrier in southwest China, Yunnan Province is rich in ecological resources, including all types of ecosystems except marine and desert. According to the data of the third National Land Survey of Yunnan Province released in 2021, the total ecological space of forest, garden, grass, and wetland in the province accounted for nearly 70%; the area of forest land, especially, exceeded 60% [2]. These ecological spaces are of great significance for maintaining regional ecological balance, providing ecological services, and promoting social and economic development. However, in the context of accelerating urbanization, the traditional dual division of urban and rural relations leads to the tilt of socioeconomic resources towards the city and the shrinkage of rural ecological resources [3,4]. This phenomenon not only generates urban–rural structural inequity in land-resource allocation and socioeconomic development patterns but also affects the ecological rights and justice of residents [5,6]. Therefore, addressing this issue requires a paradigm shift in the interaction and linkages of population, industry, and land (PIL) from an urban-led commensalism mode to an urban–rural mutualism mode. Rather than viewing PIL multi-factors in opposition, a more sustainable model is needed that encourages cooperation and mutual benefit between urban and rural areas, ensuring that both economic development and ecological preservation can coexist in harmony. Urban–rural integration is deemed an important way to solve this inequity problem and adjust the relationship between urban and rural subsystems through the sustainable interaction of factors and rational allocation of resources, which could change the mode from competition to cooperation and ensure a dynamic equilibrium of factors [7,8]. With the blurring of boundaries between the countryside and the city environments, the urban–rural divide is gradually narrowed due to the two-way flow and reasonable allocation of PIL, which helps to promote the harmonious development of socioeconomic and ecological space protection [1,9].
In previous studies, most of the relevant studies on urban–rural integration initially based on dual economic theory directly explored the linkage and interaction between urban and rural areas from a single perspective [10,11]. With the advancement of urbanization, some scholars focused on urban–rural systematization. Multi-dimensional factors have been incorporated into the urban–rural integration system, covering many aspects (such as environment, space, and society) to quantitatively analyze the level of urban–rural integration. For example, Kūle (2014), based on literature and interviews, fully considers the influence of ideology, institutions, and policies on rural–urban interactions in Latvia to promote mutually positive rural–urban relations [12]. Ma et al. (2020) employed multiple analytical methods to assess urban–rural integration in Gansu Province, highlighting the spatial variations in quality of life and integration levels [13]. Zhang et al. (2023) employed a comprehensive index model method to assess the level of urban–rural integration in Heilongjiang Province, China from the perspective of economic, space-social, and ecological [14]. Meanwhile, some researchers emphasize that urban–rural integration promotes the full flow of factors between urban and rural areas based on the “flow space” theory, which indicates that regional development has gradually transformed from “Space of Place” to “Space of Flow” [15,16]. Moreover, introducing symbiosis theory into the exploration of urban–rural integration is an effective way to promote the equality of status between urban and rural areas from a holistic perspective. The symbiosis theory was first used to describe dissimilar organisms living together in nature [17]. It emphasizes the interaction and dependency between organisms, forming a stable symbiotic system through resource sharing, energy exchange, and information exchange [18]. According to the symbiotic theory, the symbiotic development of urban and rural integration can shape hybrid multifunctional environments through resource sharing and complementarity, which helps to blur the administrative boundaries and signs of identity between the countryside and the city [19,20,21,22]. This integration contributes to the efficient allocation of resources and services across urban and rural areas, creating a more cohesive and sustainable system of regional development. As noted by Wang et al. (2016), such symbiotic relationships enable rural and urban areas to benefit mutually through the exchange of materials, information, and energy, improving socioeconomic conditions in both regions [23].
However, the flow and exchange of factors would narrow the urban–rural development gap, yet lead to a contradiction between limited ecological resources and increased demand due to population and industrial agglomeration [24,25]. The expansion of construction land may restrict ecological space, which would increase the inequity of residents’ ecological rights and benefits [24,26,27]. As a part of the natural ecosystem, ecological space is an important support for improving the living environment and ecological rights of residents, involving not only ecological value and interests but also inequity and welfare issues [28,29]. In the past, some scholars focused on natural resource allocation and environmental pollution using the Gini coefficient and per capita index method to analyze the equity of ecological and environmental issues [30,31]. Meanwhile, some scholars have discussed the driving factors of equity of ecology or environment from the aspects of economy, space, and population, which indicates the trade-off between economic and ecological factors. For example, Li et al. (2021) explored the significant impact of natural and socioeconomic factors (e.g., climate, topography, economy) on urban green-space equity at the level of accessibility, coverage, and per capita [32]. Shi et al. (2023) analyzed the positive impact of GDP growth on ecological well-being to explore the balance point between protection and development [33]. Lu et al. (2024) explored the driving effect of population and economic growth on the equity of urban public green spaces [34]. From the perspective of urban green-space distribution, ecosystem services, and environmental burden, the important role of different equity factors is discussed. However, most research perspectives focus on the level of urban green space, while ignoring the positive role of the changes in urban–rural relations brought about by the flow and sharing of various factors in the process of urbanization. In addition, as the three most active factors in regional development, the relationship and structure of population, industry, and land play a crucial role in the process of urbanization, regional coordinated development, and ecological resource allocation. He and Shao (2018) took the Beijing–Tianjin–Hebei region as the research region, assessed the degree of population, land, and industrial urbanization, and used the coupled coordination degree model to measure the coordination of PLIU [35]. Huang et al. (2021) adopted a coupled coordination model combined with a spatial metrology model to explore the coupled coordination of population, land, and industry to improve urban quality [36]. Shan et al. (2022) constructed an integrated model to study the coordination relationship between urban population–land spatial patterns (UPLSPs) and ecological efficiency (EE) and put forward policy suggestions for new-type urbanization development and ecological civilization construction [37]. However, with the rapid expansion of cities restricting the rural ecological space, more attention should be paid to the flow of factors and the reallocation of resources between urban and rural areas, which could help to better capture the ecological inequality across spatial scales.
Therefore, the paper constructed an urban–rural integration six-step symbiotic framework (UISS) to reflect the relationship of symbiotic mode URI and symbiotic effect IES after urban–rural symbiotic units (population–industry–land, PIL) reach the optimal symbiotic mode, such as reasonable population distribution, land planning, and industrial layout, to solve the problem of imbalance between urban and rural development and the inequity of ecological and socioeconomic factors. Meanwhile, the two-way fixed-effects model and heterogeneity analysis can be used to analyze how URI influences IES under socioeconomic development from temporal unfairness, spatial differences, and dynamic change in mismatch, which can promote the transformation from an imbalanced state to a harmonious state under multiple symbiotic environments. The comprehensive multi-perspective analysis of IES based on the symbiotic framework (MEU) was applied in Yunnan Province to reflect the unfairness, differences, and mismatch under symbiotic units’ (PIL) interaction and cooperation, which could help to realize the goal of harmonious development of socioeconomic benefits and ecological welfare.
2. Materials and Methods
2.1. Study Area
Yunnan Province is located in the southwest of China and belongs to the low-latitude inland area. The region borders Guizhou and Guangxi in the east, Sichuan in the north, and Tibet in some parts of the northwest. The terrain is mainly a mountainous plateau, which decreases step by step from north to south. The total land area is 38.32 million hectares, among which agricultural land constitutes 34.27 million hectares, accounting for 89.67% [2]. Among the agricultural land, forest land accounted for the largest proportion of 24.97 million hectares, followed by a cultivated land area of 5.49 million hectares, a garden area of 2.57 million hectares, and a wetland and grassland area of 1.36 million hectares (as shown in Figure 1).
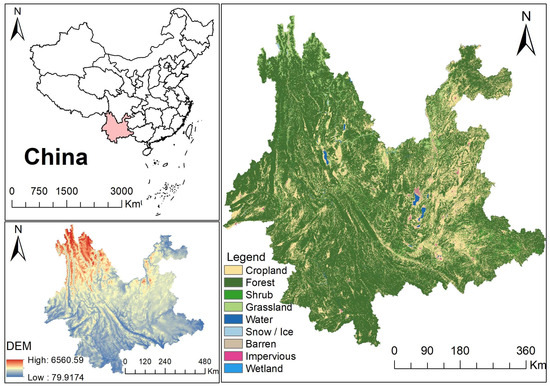
Figure 1.
Location and land-use type in Yunnan.
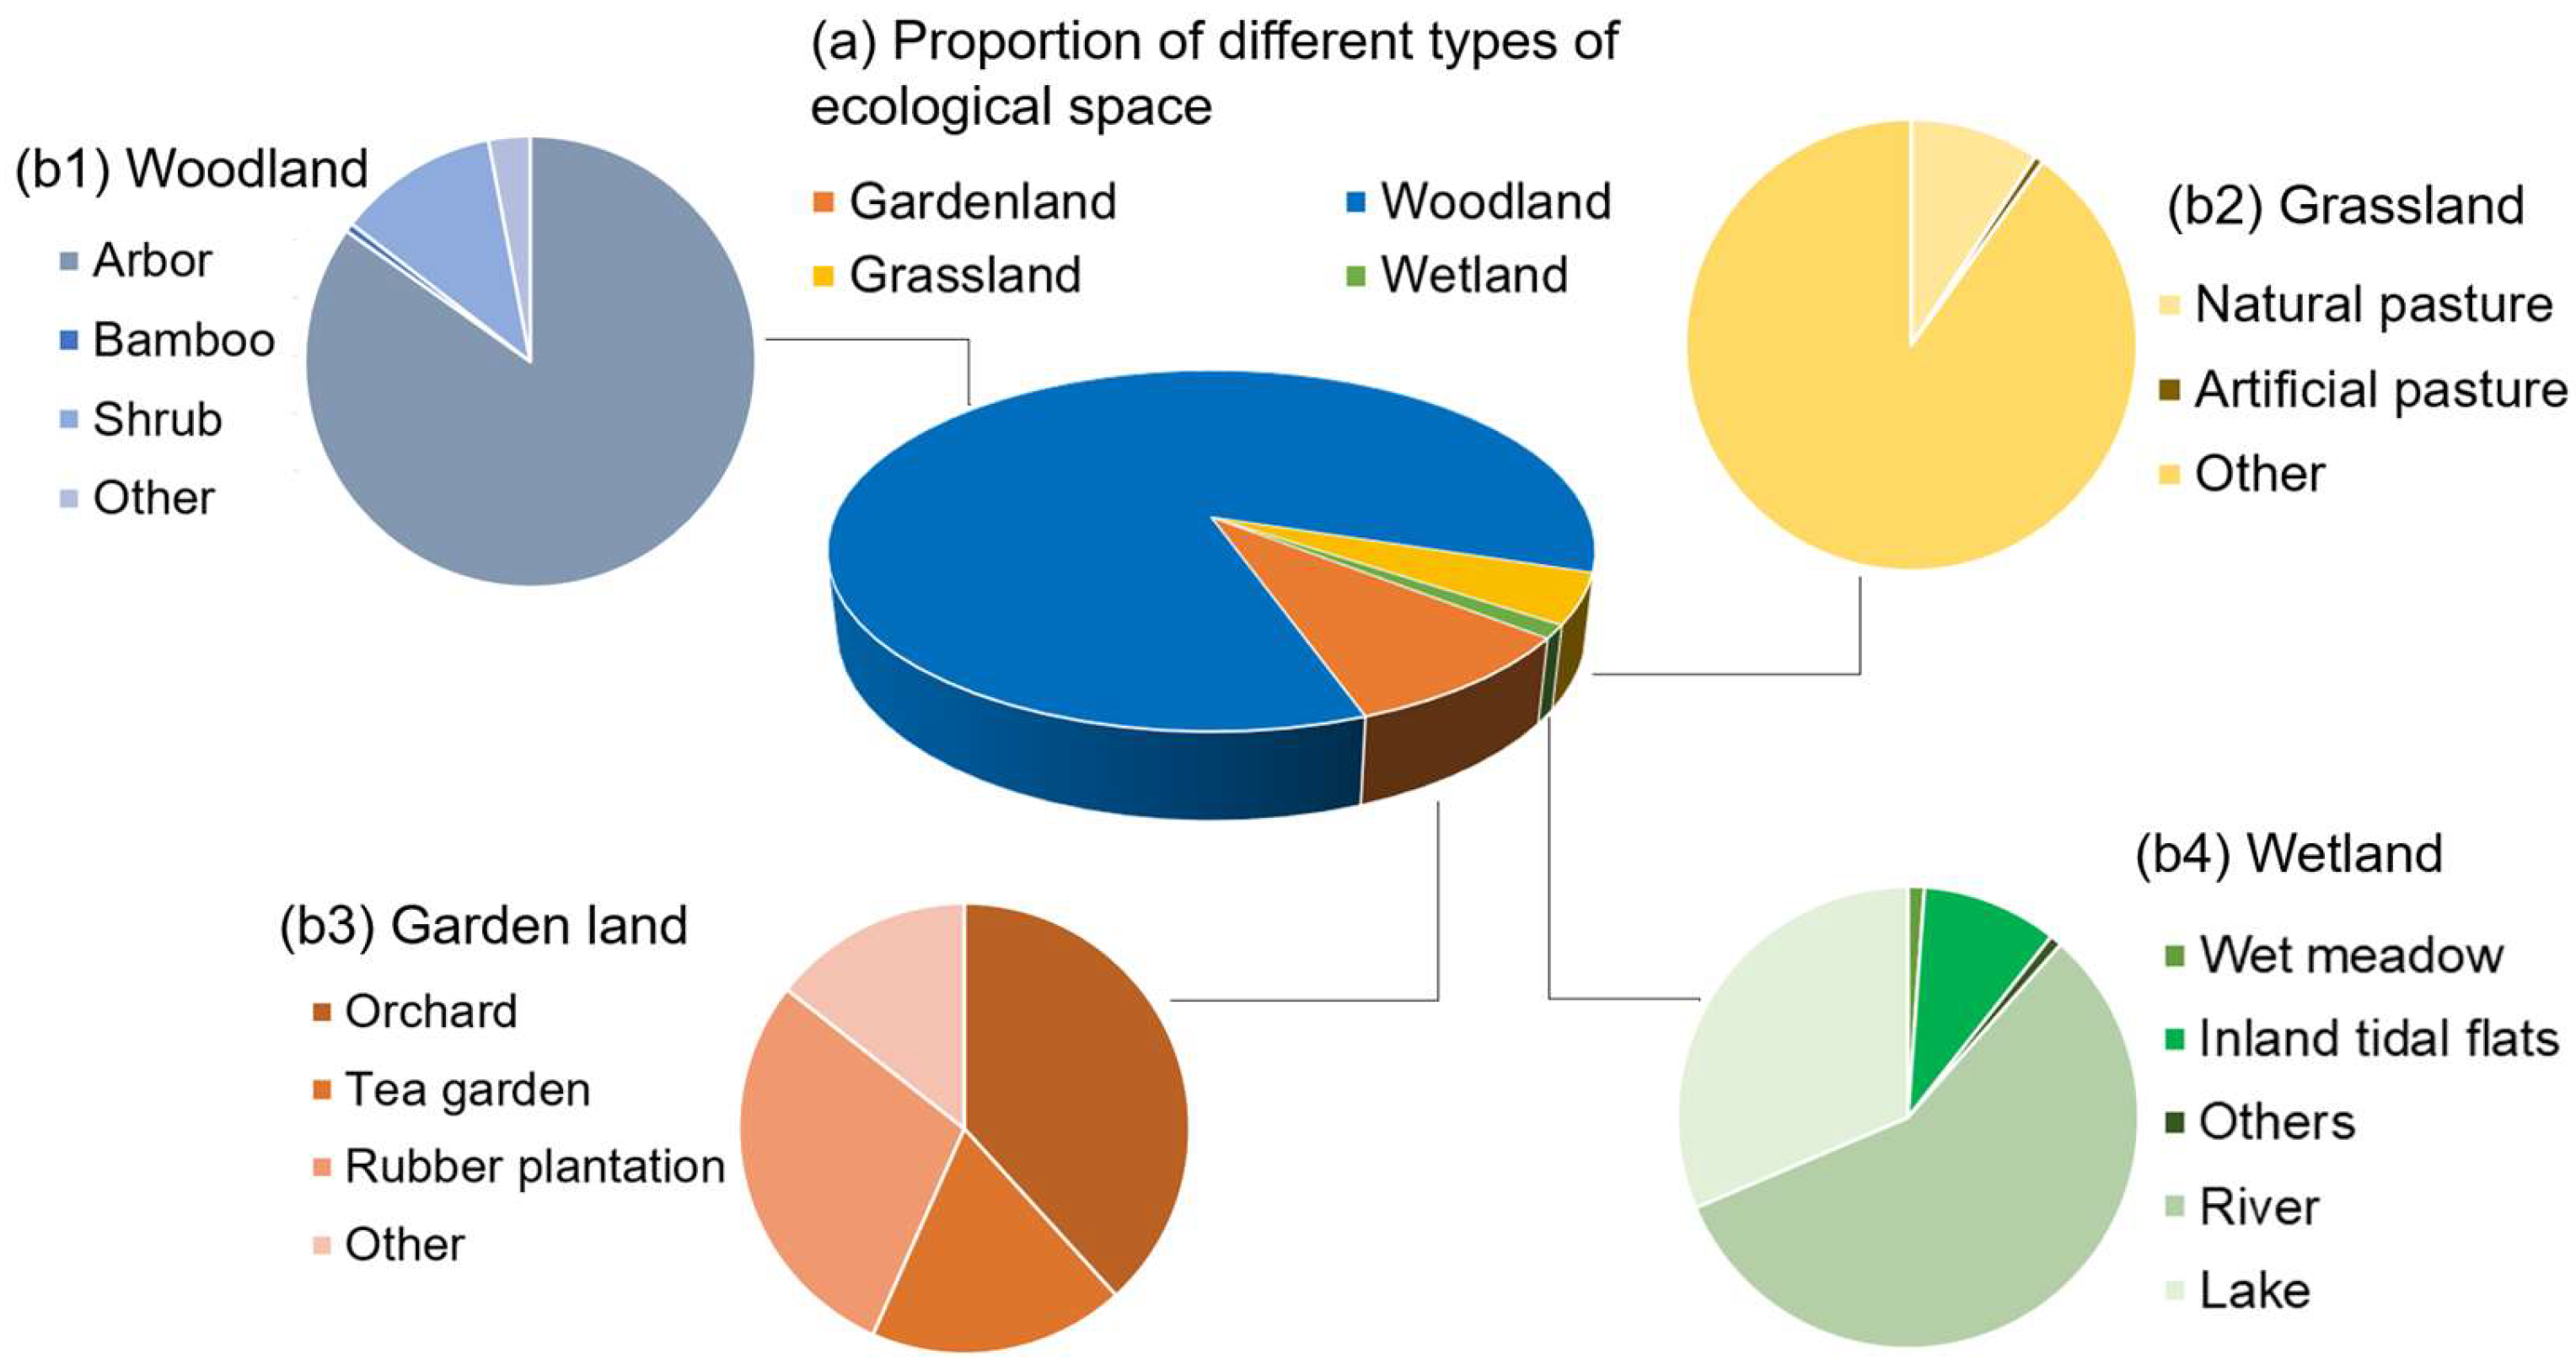
As an important ecological protection area in southwest China, Yunnan Province has a broad distribution of ecological spaces with a variety of vegetation types, including all types of ecosystems except for marine and desert. Due to the diversity of climate types and the complexity of geomorphology, the spatial differences in natural environment factors such as heat, soil, and water are very pronounced, resulting in ecological spaces that are widely distributed, rapidly changing, and highly diverse in Yunnan Province. In recent years, through the protection and restoration of important ecological spaces, Yunnan Province has improved the self-restoration ability of the ecosystem and effectively maintained ecological security, which can give full play to the role of ecological advantages in Yunnan’s economic and social development. Figure 2 presents the specific classification of major ecological spaces in Yunnan Province. Forest land is the most important type of ecological space in Yunnan Province, accounting for more than 80% of the total ecological space, and is mainly distributed in Pu’er, Chuxiong, and six other regions. Garden land accounts for nearly 10% of the ecological space and is mainly distributed in Honghe and Lincang. Although grasslands and wetlands occupy a relatively small proportion of Yunnan Province’s ecological space, they remain crucial components due to their essential roles in maintaining ecological balance and providing ecological services. The relevant land resource data come from the main data bulletin of the Third National Land Survey of Yunnan Province released by the Yunnan Provincial People’s Government and the Yunnan Provincial Statistical Yearbook (2023), released by the Yunnan Provincial Bureau of Statistics [2,38].
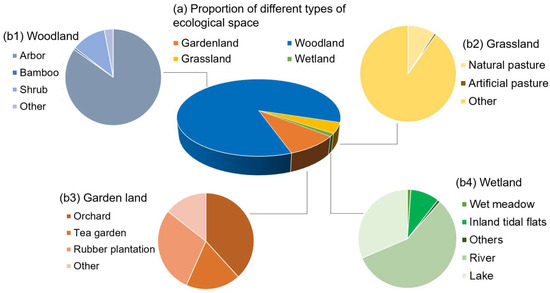
Figure 2.
The categories of ecological space in Yunnan Province in 2022.
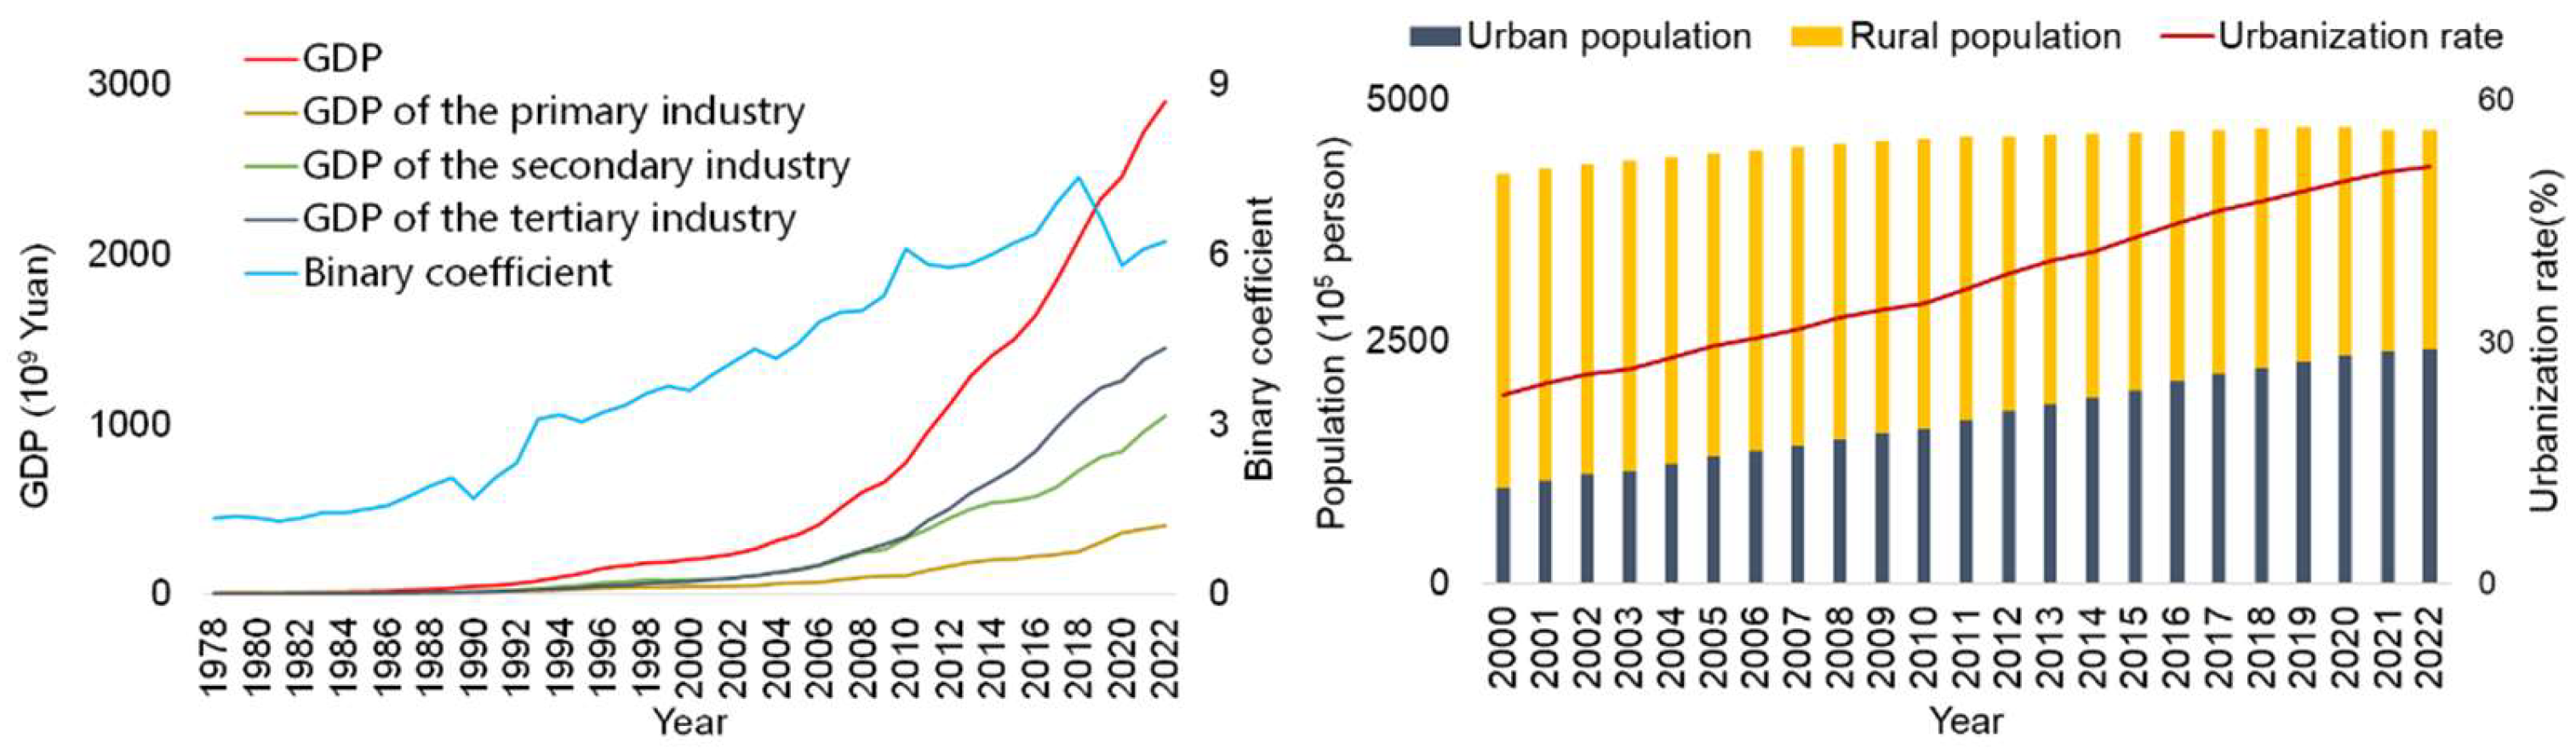
In recent years, the economic development and urbanization process of Yunnan Province has accelerated, and the urbanization rate has increased from 2000 to 2020. Yunnan Province has 16 prefecture-level administrative regions, including 8 prefecture-level cities and 8 autonomous prefectures, totaling 129 county-level regions. The total GDP of economic development factors has increased significantly, especially since 2018. The GDP of the region was RMB 2895.42 billion, and the per capita GDP was RMB 61,716 in 2022. The permanent resident population was 46.93 million, including 24.27 million urban residents and 23.5 million rural residents, with an urbanization rate of 51.72 percent. Although the total population has decreased, the urbanization rate has increased annually due to the change in urban and rural population structure (a gradual increase in the urban population and a decrease in the rural population). The economic and demographic trends of Yunnan Province over the years are shown in Figure 3. The economic and demographic data are sourced from the Yunnan Provincial Bureau of Statistics and published in the Yunnan Provincial Statistical Yearbook [38,39,40,41,42,43,44,45,46].
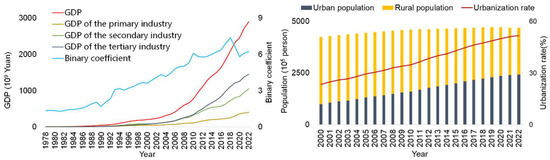
Figure 3.
Economic development and population growth of Yunnan Province from 2014 to 2022.
Due to its unique geographical location and climatic environment, Yunnan Province has a wide distribution of ecological spaces. As a province with abundant ecological resources, the development of resource-dependent industries can promote rapid economic growth in the short term, but with diminishing marginal returns, the economic benefits they generate gradually decrease. In the long run, however, excessive consumption of ecological resources and encroachment on ecological space will not only fail to sustain economic growth but also be detrimental to the improvement of residents’ ecological well-being, leading to severe imbalances between ecological and economic development in various cities. Meanwhile, in the process of pursuing economic benefits, the unregulated expansion of all kinds of construction land in some areas leads to a sharp reduction in ecological space, posing challenges to sustainable development.
These problems may result in an imbalance between urban and rural development and the inequities in ecological and socioeconomic aspects, which contradicts the goal of harmonious development. Therefore, in the context of urbanization, it is necessary to develop a framework to analyze the impact of urban–rural integration symbiosis on the socioeconomic inequities in ecological space from a comprehensive multi-perspective. Among them, the research evaluates the urban–rural integration symbiotic index based on “population-industry-land (PIL)” to explore the level of urban–rural interaction and linkage. Meanwhile, this study analyzes the socioeconomic inequity in ecological space from three perspectives, including temporal unfairness, spatial difference, and dynamic change in mismatch under urban–rural integration symbiotic development.
2.2. Research Methods
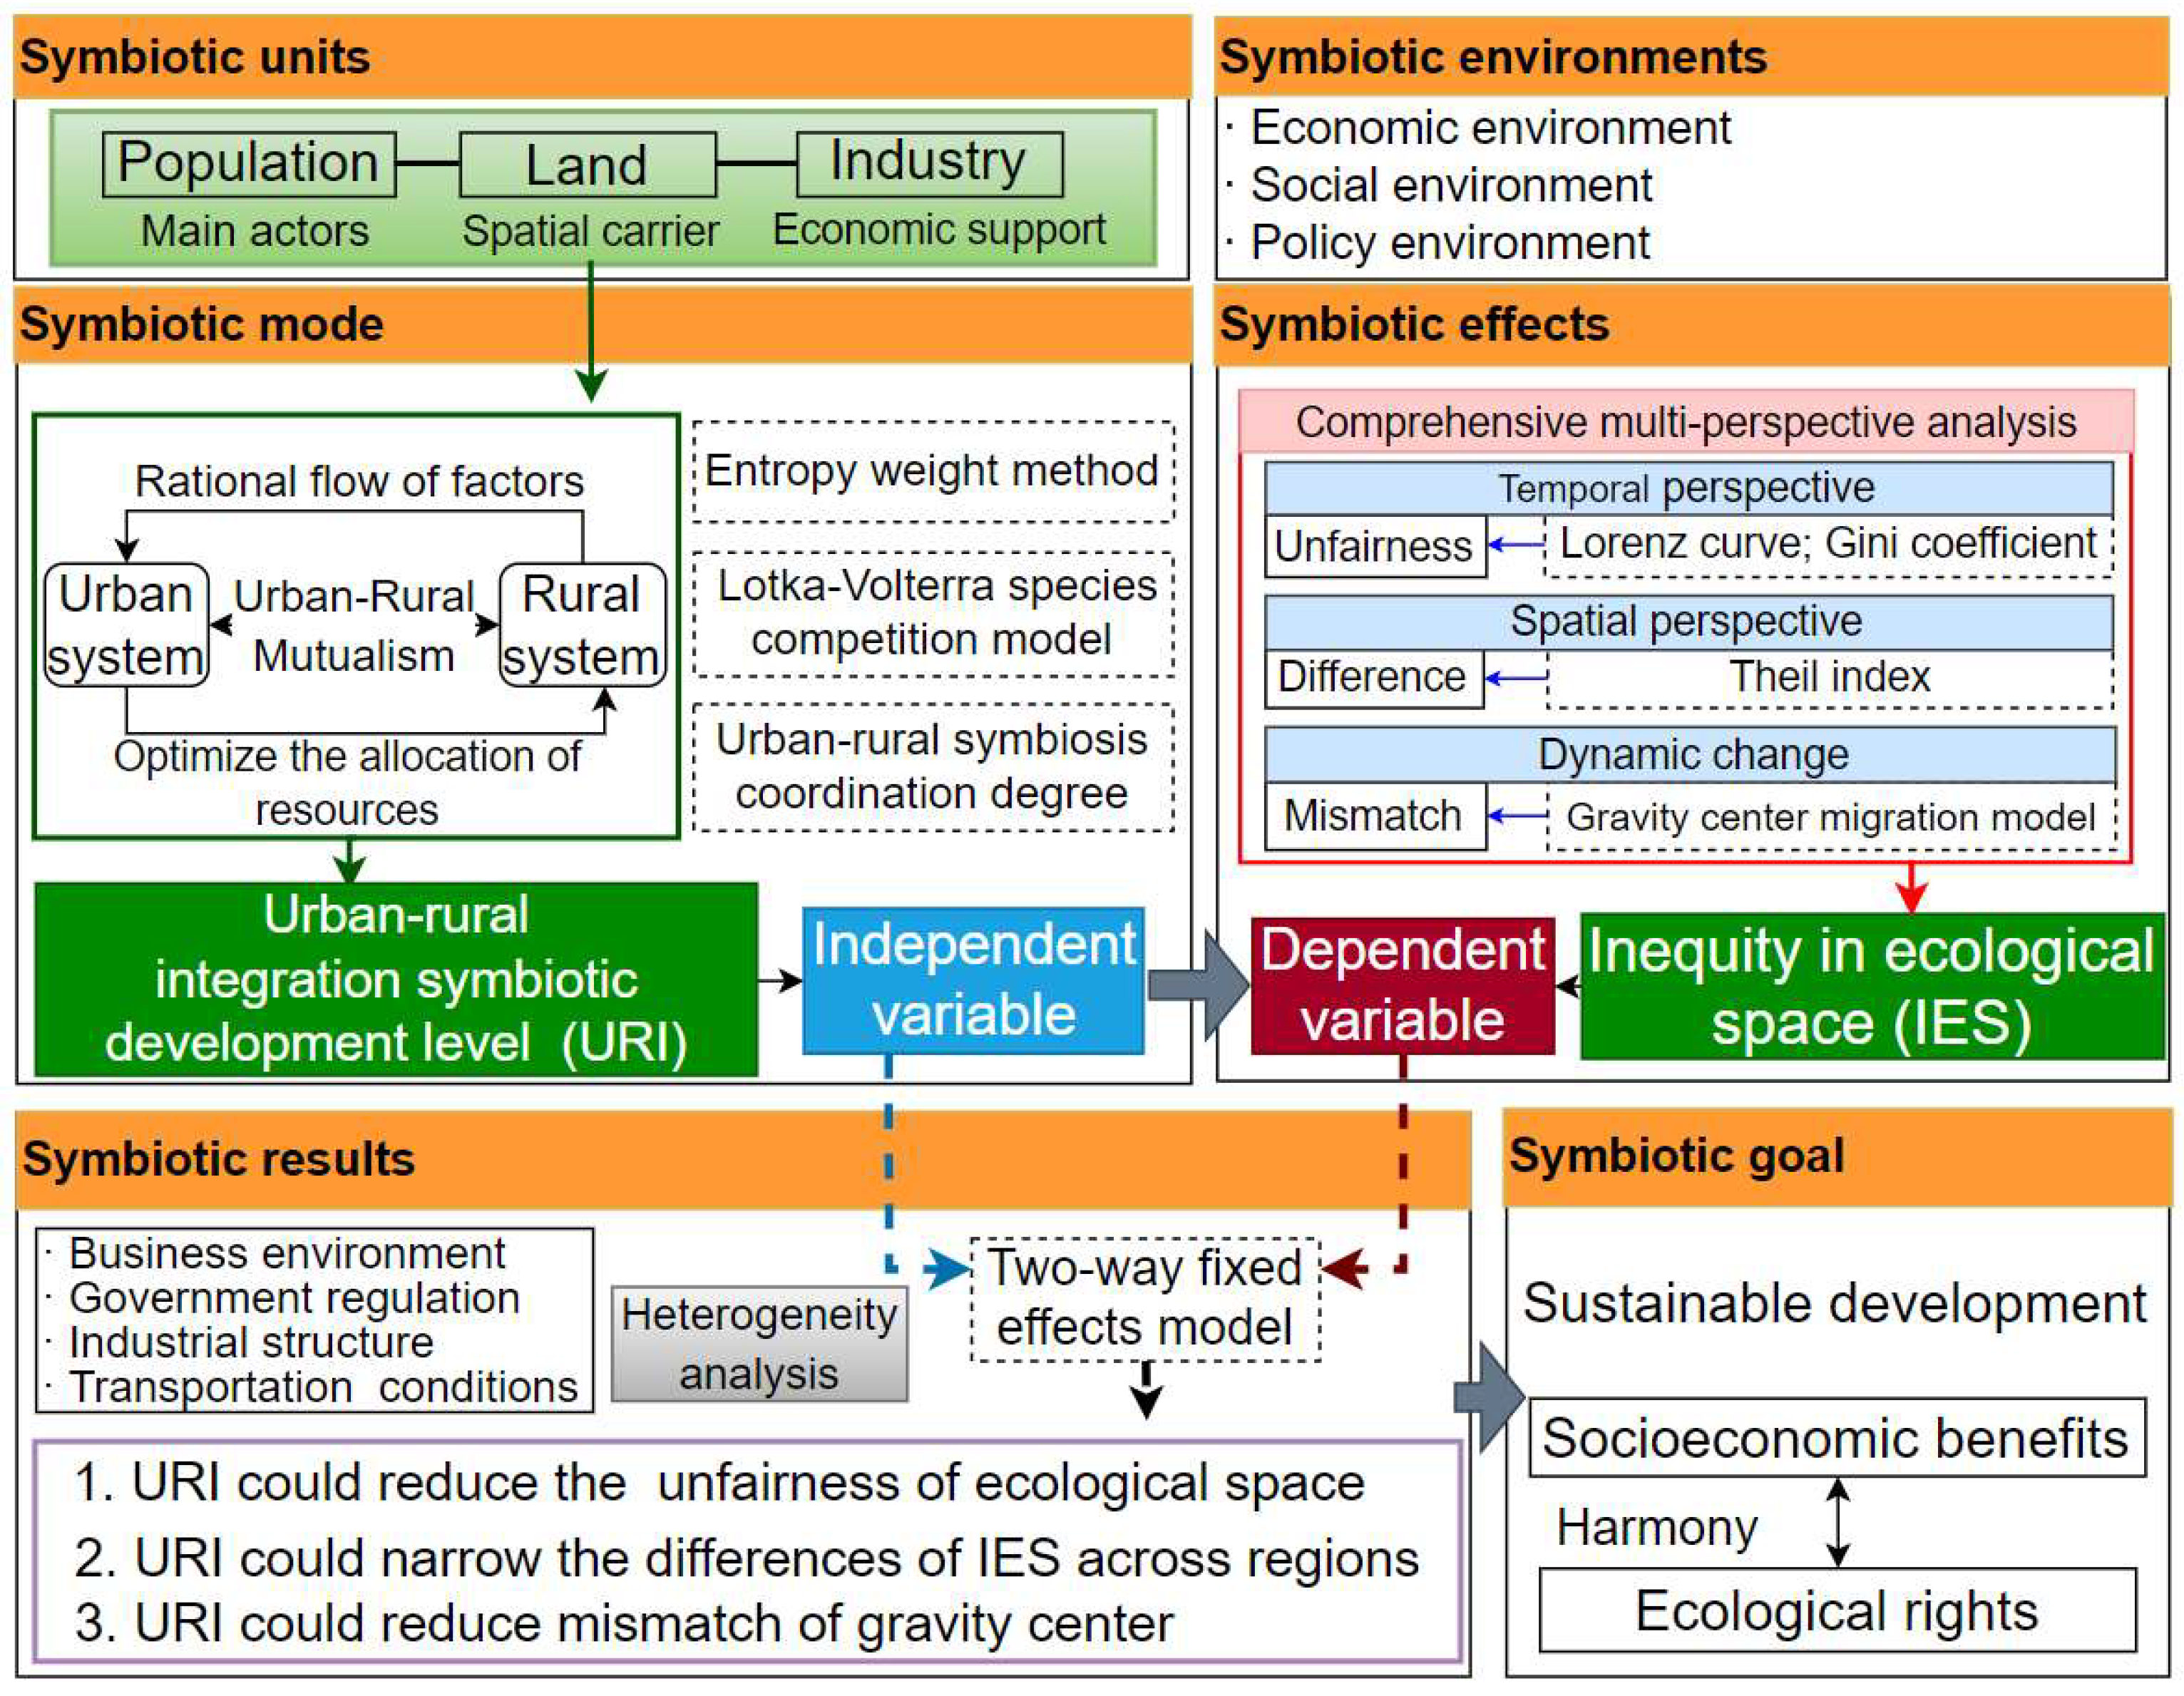
Symbiosis theory was originally used to describe the coexistence of different organisms in nature, emphasizing the basic material conditions and interconnections between symbiotic individuals [17]. The symbiotic system consists of three basic elements: symbiotic units, symbiotic mode, and symbiotic environments, which are the prerequisites for evaluating the characteristics and dynamic changes in symbiotic patterns [47]. Since the 1950s, symbiosis theory has been widely applied in economics [48], management [49], agricultural science [50], industrial ecology [51,52] and other fields, demonstrating good applicability, especially in the study of regional integration, which provides a new perspective and method for solving the problem of inter-regional cooperation and coordinated development [18]. Based on the symbiosis theory, an interrelated organic system was built, incorporating the urban and rural systems, which can reflect the interaction and linkage among three symbiotic units (population, industry, and land). The population is the main actor, the land is the spatial carrier, and industry is the economic support, which together form the three most active components promoting regional development in the symbiotic environment (such as the economic, social, and policy environment). With the improvement of the speed of factor flow and the rationality of resource allocation between urban and rural areas, the symbiotic mode between urban and rural systems has gradually changed to integrative symbiosis (i.e., mutualism), indicating cooperation and complementary advantages between the two systems. The process promotes new interactions and connections among ecological, population, and industrial factors, adjusting the inequity in ecological space (reducing unfairness, differences, and mismatch), which indicates the change in symbiotic effects. The continuous improvement of the development level of urban–rural integration symbiosis can produce positive symbiotic results for the inequity in ecological space, in which fairness is constantly improving and the differences and mismatches are gradually decreasing. The ultimate symbiotic goal of urban–rural system integration is to achieve sustainable development and the harmony of ecological rights and socioeconomic benefits in a long-term and stable manner. Therefore, this paper constructs the urban–rural integration six-step symbiotic framework of “Symbiotic Units–Symbiotic Environments–Symbiotic Mode–Symbiotic Effects–Symbiotic Results–Symbiotic Goal” (UISS). A comprehensive multi-perspective analysis of IES based on the symbiotic framework (MEU) is developed to analyze the influence of URI on IES under socioeconomic development. Detailed research steps are shown in Figure 4.
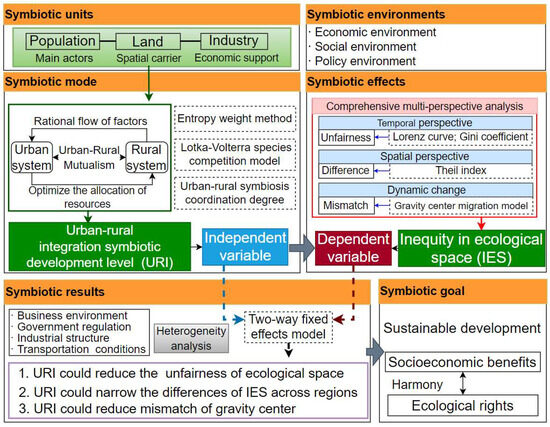
Figure 4.
The comprehensive multi-perspective analysis of IES under socioeconomic development based on symbiotic framework (MEU).
2.2.1. Evolution Index System of Urban–Rural Integration Symbiotic System Based on Population–Industry–Land (PIL) Interaction in Yunnan Province
The research constructs the evaluation index of an urban–rural integration symbiotic system (URI) based on population–industry–land (PIL) to analyze the mode and level of urban–rural integration using the Lotka–Volterra species competition model, urban–rural symbiotic coordination degree method and entropy weight method, which reflects the phenomenon of mutualism between the two symbiotic systems of urban and rural. Typical indicators are selected for the three-dimensional symbiotic unit of population, land, and industry from the two symbiotic systems of urban development and rural development, respectively, to construct an evaluation index system of urban–rural integrated development that reflects the urban–rural symbiotic relationship (as shown in Table 1). Urban and rural integration data are sourced from the Yunnan Provincial Bureau of Statistics and published in the Yunnan Provincial Statistical Yearbook [38,39,40,41,42,43,44,45,46].

Table 1.
Evaluation index of urban–rural integration symbiotic development level based on PIL.
Considering that the indicator units and dimensions used in the construction of the indicator system vary, the importance of indicators also differs. Therefore, to reasonably assess the impact of different indicators, this paper uses the entropy weight method to weigh the indicators. Firstly, the range method is used to standardize the relevant indicators, which need to be processed uniformly to eliminate the above effects. The standardization method of positive and negative indicators is as follows:
where is the original data, and are the standardized data, and and are the minimum and maximum values in the original data, respectively.
After obtaining the urban development level and rural development level, respectively, by linear weighting through the entropy method, the mode and level of urban–rural integration are analyzed. The Lotka–Volterra species competition model and urban–rural symbiosis coordination degree were used to measure the mode and level of urban–rural integration.
where is the level of urban development; is the level of rural development; and are the highest values of urban and rural development levels, respectively; and are the growth rates of the urban and rural development levels (%); is the effect of the rural subsystem on the urban subsystem; and is the effect of the urban subsystem on the rural subsystem. Referring to relevant studies, when = 0 and < 0, urban–rural integration develops into an urban-led commensalism symbiosis model; when is = 0 and < 0, urban–rural integration develops into a rural-led commensalism symbiosis model; when and are both < 0, urban–rural integration develops into an urban–rural mutualistic symbiosis model, which is an ideal model of two-way urban–rural interaction. The formula for calculating the level of urban–rural integrated development is as follows:
where is the level of urban–rural integrated development; and is the maximum value of and .
2.2.2. Comprehensive Multi-Perspective Analysis of Inequity in Ecological Space (IES) Under Population-Industry Development (PO-IN)
Based on previous studies in the literature, this paper defines the improvement of inequity in ecological space as the reduction in unfairness, differences, and mismatch [53,54]. Therefore, this study discusses the socioeconomic inequity in ecological space (IES) in Yunnan Province using a comprehensive multi-perspective analysis method to identify the temporal unfairness, spatial differences, and dynamic change in mismatch. (1) From the temporal perspective, the Lorenz–Gini coefficient method is used to analyze the relationship between ES and PO-IN development from 2014 to 2022, which can effectively assess the unfairness of ecological space under the PO-IN. (2) From the spatial perspective, the Theil index is used to reveal the inequity differences between and within regions. (3) From the dynamic change perspective, the gravity-center migration model was used to measure the distance of the gravity center and the mismatch between ES and PO-IN. The comprehensive multi-perspective analysis method can not only analyze the static unfairness of ecological space but also consider regional disparities and spatiotemporal dynamic changes.
- (1)
- Temporal unfairness research: Gini coefficient and Lorenz curve
This study uses the Lorenz curve and Gini coefficient to study the unfairness of ES in Yunnan Province. The per capita ES ownership in Yunnan Province is ranked from low to high, and the cumulative percentage of ES and the cumulative percentage of PO and IN constitute the Lorenz curve, which illustrates the unfairness of ES allocation. The calculation method of the Gini coefficient is shown in Formula (5):
where is the Gini coefficient, which ranges between 0 and 1; is the number of cities in Yunnan Province; is the proportion of the ES contained in the city relative to the total ES of the province; is the ratio of PO-IN factors, including population and industry in group compared to the total amount of the province. This study categorizes the Gini coefficient of ES and PO-IN equity into five levels: absolute average, relatively average, reasonable, large gap, and wide gap (as shown in Table 2).
Table 2.
Gini coefficient threshold division.
- (2)
- Spatial difference research: Theil index
The Theil index is commonly used to measure the degree of difference in economic or other social issues and can be divided into within-group differences and between-group differences. Therefore, this study uses the Theil index to analyze the differences in different cities of Yunnan Province and within each city. The calculation method is shown in Formula (6):
In Formula (6), the first part on the right of the equal sign is the within-group (inter-regional) difference, that is, the overall difference between different cities in Yunnan Province, where is the number of cities in Yunnan Province. The second part is the between-group (intra-regional) difference, that is, the difference between different counties and urban areas in different cities of Yunnan Province, where is the number of counties and urban areas in the ith city; E is the ecological space area of Yunnan Province; M represents population and industry development.
- (3)
- Dynamic change in mismatch research: Gravity-center migration model
This study uses the gravity center migration model to analyze whether there is a mismatch phenomenon in the distribution of ES and PO-IN in Yunnan Province. The coordinates of the gravity center are shown in Formulas (7) and (8):
where (, ) represents the barycentric coordinates in period t, is the index attribute value of the th city in Yunnan Province in period t, this study includes ES, population and industry, and (, ) is the geographical coordinates of the city.
Through the above formula, the coordinates of the ES gravity center (, ), the population gravity center (, ), and the industry gravity center (, ) in Yunnan Province can be obtained. The distance between different centers of gravity can be calculated, as shown in Formulas (9) and (10):
where and are the distances between ES and PO-IN, respectively. If Z is closer to 0, the degree of overlap of the gravity center coordinates is higher, indicating that ES and PO-IN are better matched. The closer Z is to 1, the worse the matching is, indicating that the mismatch between ES and PO-IN is more serious.
2.2.3. The Effect of URI on IES Under Socioeconomic Development: The Two-Way Fixed Effect Model
On this basis, this study further explores the symbiotic effect generated by the urban–rural integration symbiosis model, which helps analyze whether the interaction and rational allocation of symbiotic units (population–industry–land) can have a positive effect on IES under socioeconomic development [55,56]. Based on the above analysis, this study uses city-level data in Yunnan Province from 2014 to 2022 based on the two-way fixed-effects model to analyze the effect of URI on IES in Yunnan Province.
where represents the city; denotes the year in Yunnan province; represents the urban–rural integration symbiotic development level; represents the socioeconomic inequity in ecological space as the explained variable, including unfairness, difference, and mismatch. At the same time, government scale, financial development, innovation level, business environment, and transportation conditions are selected as control variables ; is the individual-fixed effect; is the time-fixed effect, and is the disturbance term. The description of relevant variables is shown in Table 3.
Table 3.
Description of variables.
2.3. Data Sources
The data are sourced from the China Statistical Yearbook (2015–2023), the Yunnan Statistical Yearbook (2015–2023), and the Third National Land and Land Survey (2021) [2,38,39,40,41,42,43,44,45,46]. Combined with the land-cover characteristics and data limitations of the study area, this study classifies gardens, grasslands, forests, and wetlands in the study area as ecological space. The population and industry factors are measured using the total resident population at the end of the year and the regional gross domestic product (GDP).
3. Results
3.1. Analysis of URI Based on PIL in Yunnan Province
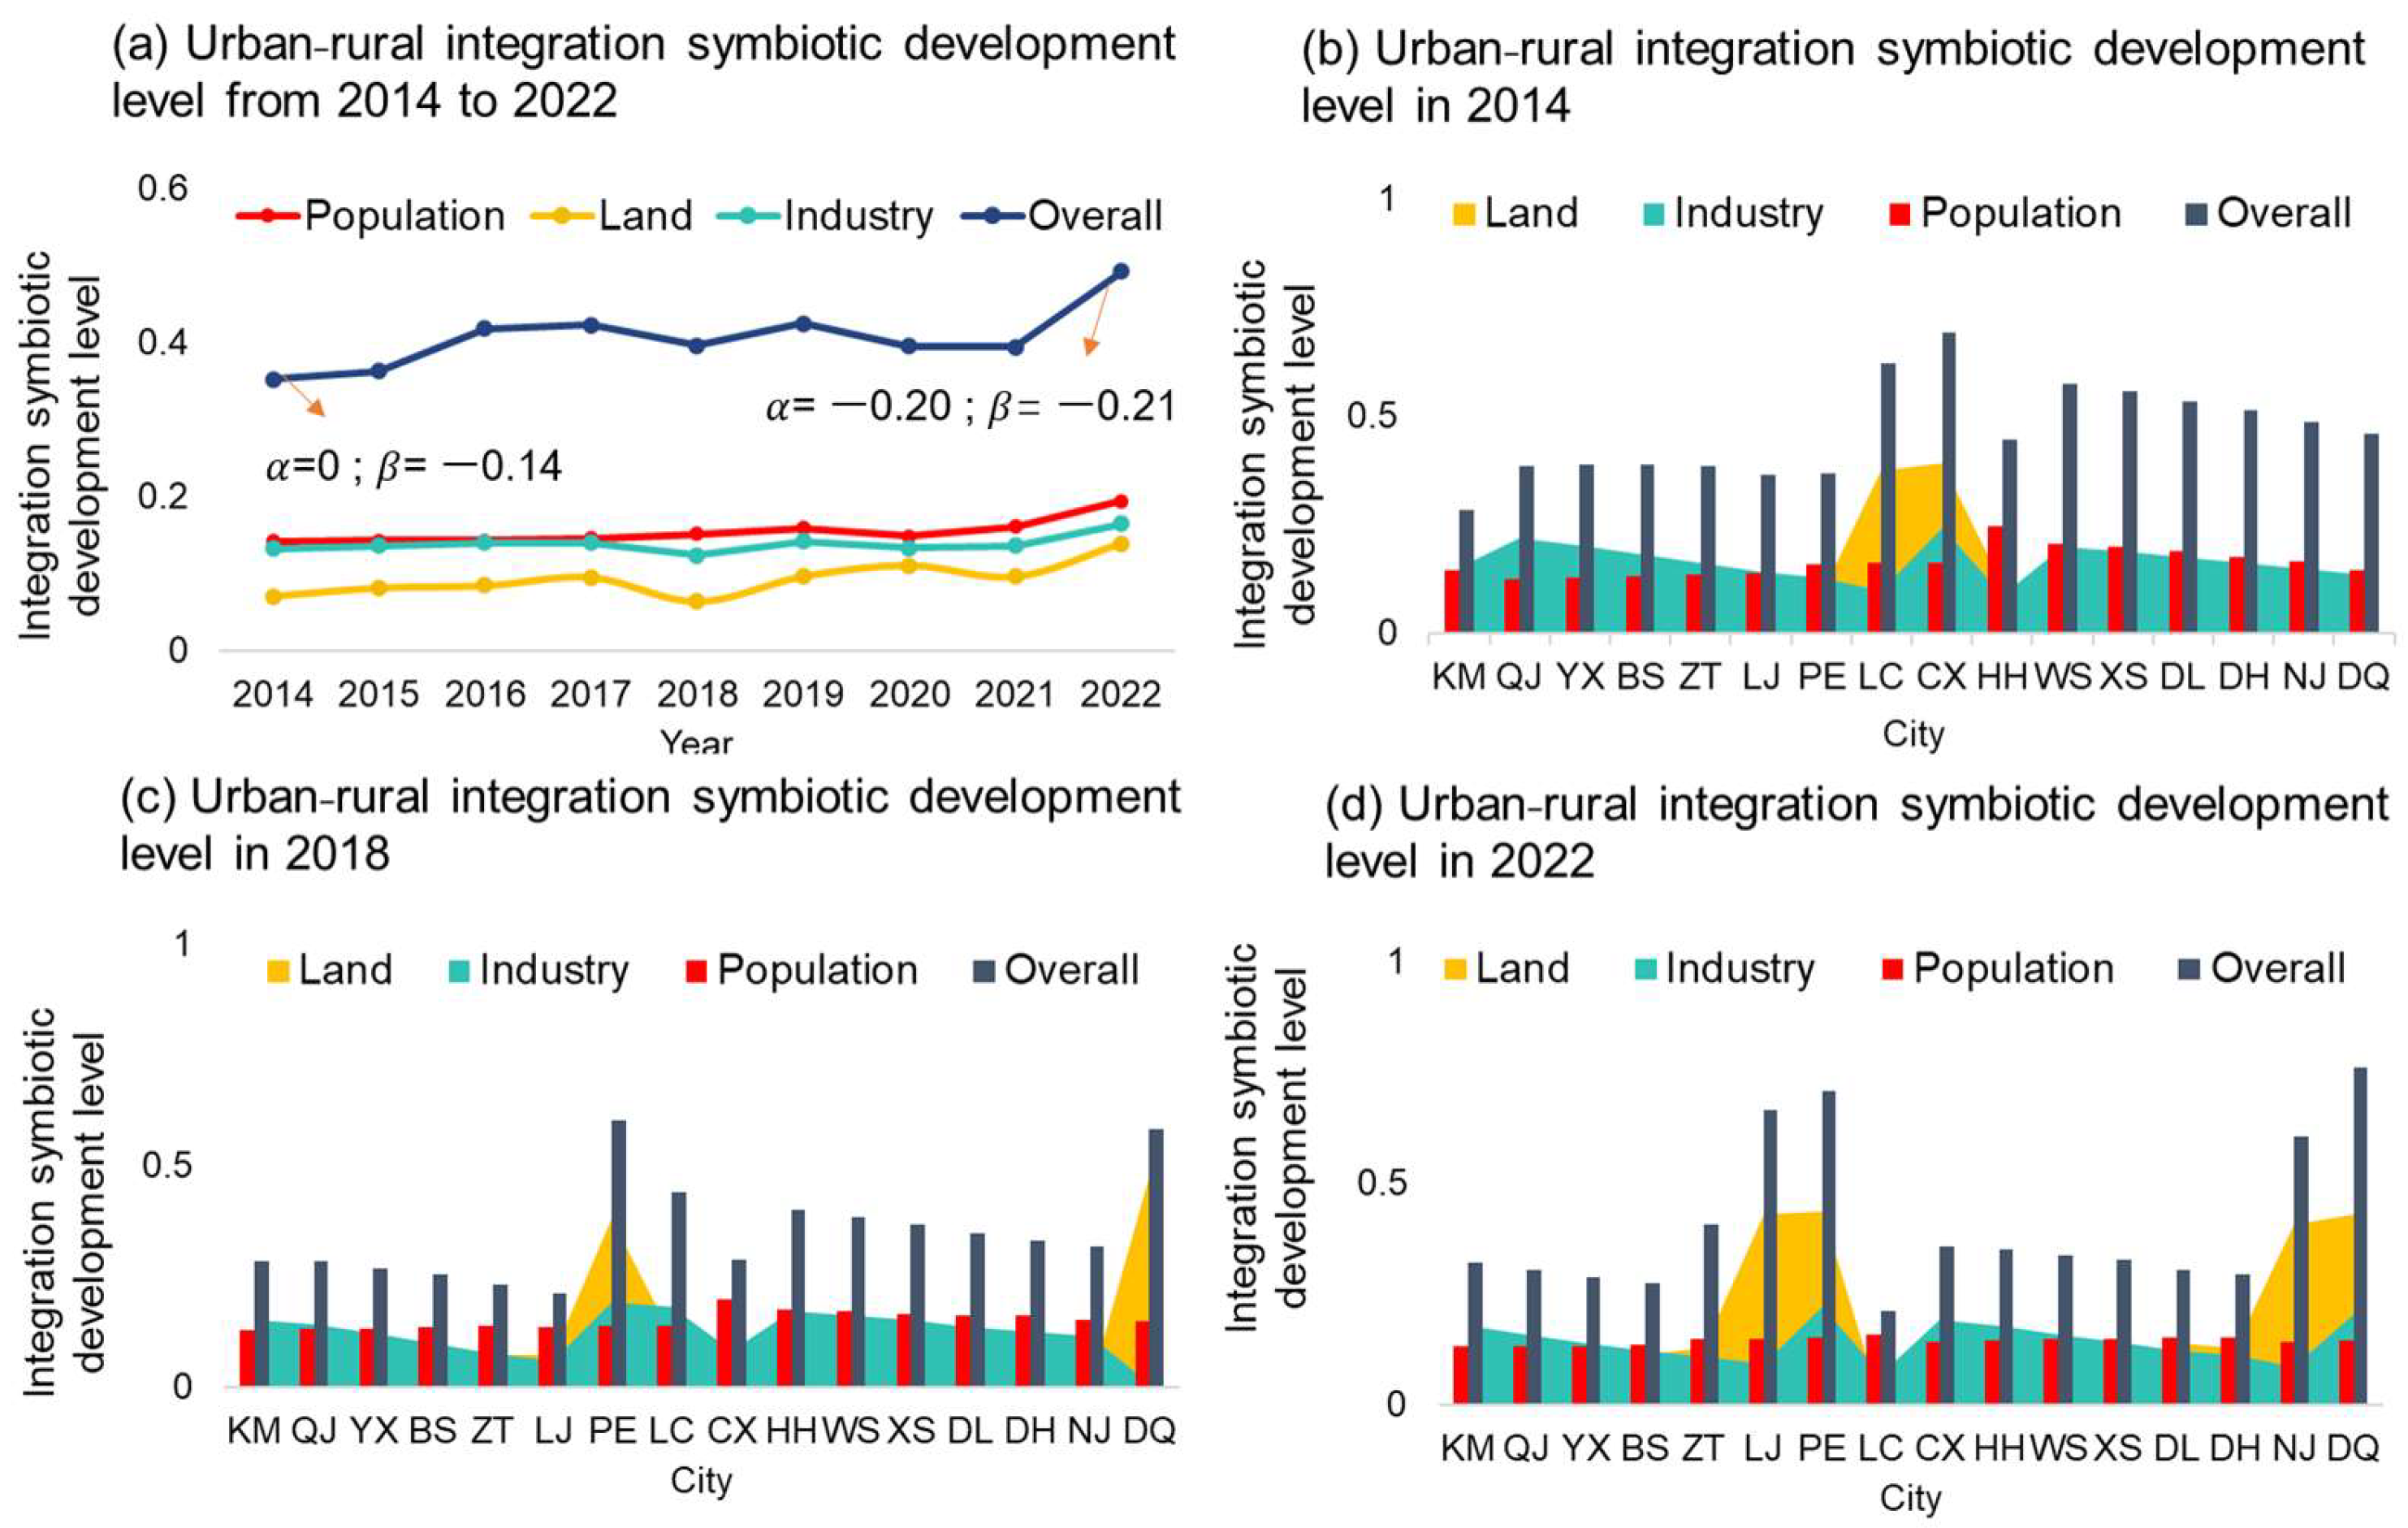
From 2014 to 2022, the overall urban–rural integration symbiotic development level (URI) in Yunnan Province showed a fluctuating upward trend, which indicates that the symbiotic mode has changed from the early urban-led commensalism phase ( = 0 and < 0) to the urban–rural mutualism phase ( < 0 and < 0). URI fluctuated slightly between 0.36 and 0.41 from 2014 to 2018, and after 2018, URI increased significantly with a maximum growth rate of 22.89%, indicating a positive transformation in the flow and allocation pattern of factors, which contributes to equal resource exchange and sustainable development (as shown in Figure 5). (a) The integration symbiosis of the population unit has a relatively fast growth rate and a relatively high growth rate from 0.144 in 2014 to 0.174 in 2022, which marks important support for the development of urban–rural integration symbiosis. (b) The integration symbiosis of the land unit has the best integration effect from 2014 to 2022, increasing from 0.101 to 0.128. Although the level of land integration is still low, it has increased by 27%, which has played an important role in improving the overall urban–rural integration level. (c) The level of integration symbiosis of the industry unit is moderate, increasing from 0.14 to 0.16 between 2014 and 2022. In some areas, such as Pu’er (PE) and Deqing (DQ), the overall urban–rural integration has been significantly improved, and the land integration is more obvious, indicating that these areas have gradually enhanced ecological protection in recent years. The degree of URI in Yunnan Province has notably improved in recent years, indicating that the flow pattern of urban–rural factors in this region is undergoing a positive transformation, which is conducive to the gradual shift toward the equal exchange of resources and a virtuous cycle of development.
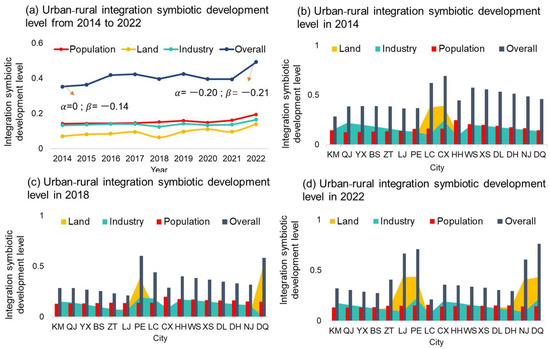
Figure 5.
Analysis of urban–rural integration in Yunnan province. Note: Kunming (KM), Qujing (QJ), Yuxi (YX), Baoshan (BS), Zhaotong (ZT), Lijiang (LJ), Pu’er (PE), Lincang (LC), Chuxiong (CX), Honghe (HH), Wenshan (WS), Xishuangbanna (XS), Dali (DL), Dehong (DH), Nujiang (NJ), Diqing (DQ).
3.2. Temporal Unfairness of Ecological Space (ES) with Consideration of Population-Industry Development (PO-IN)
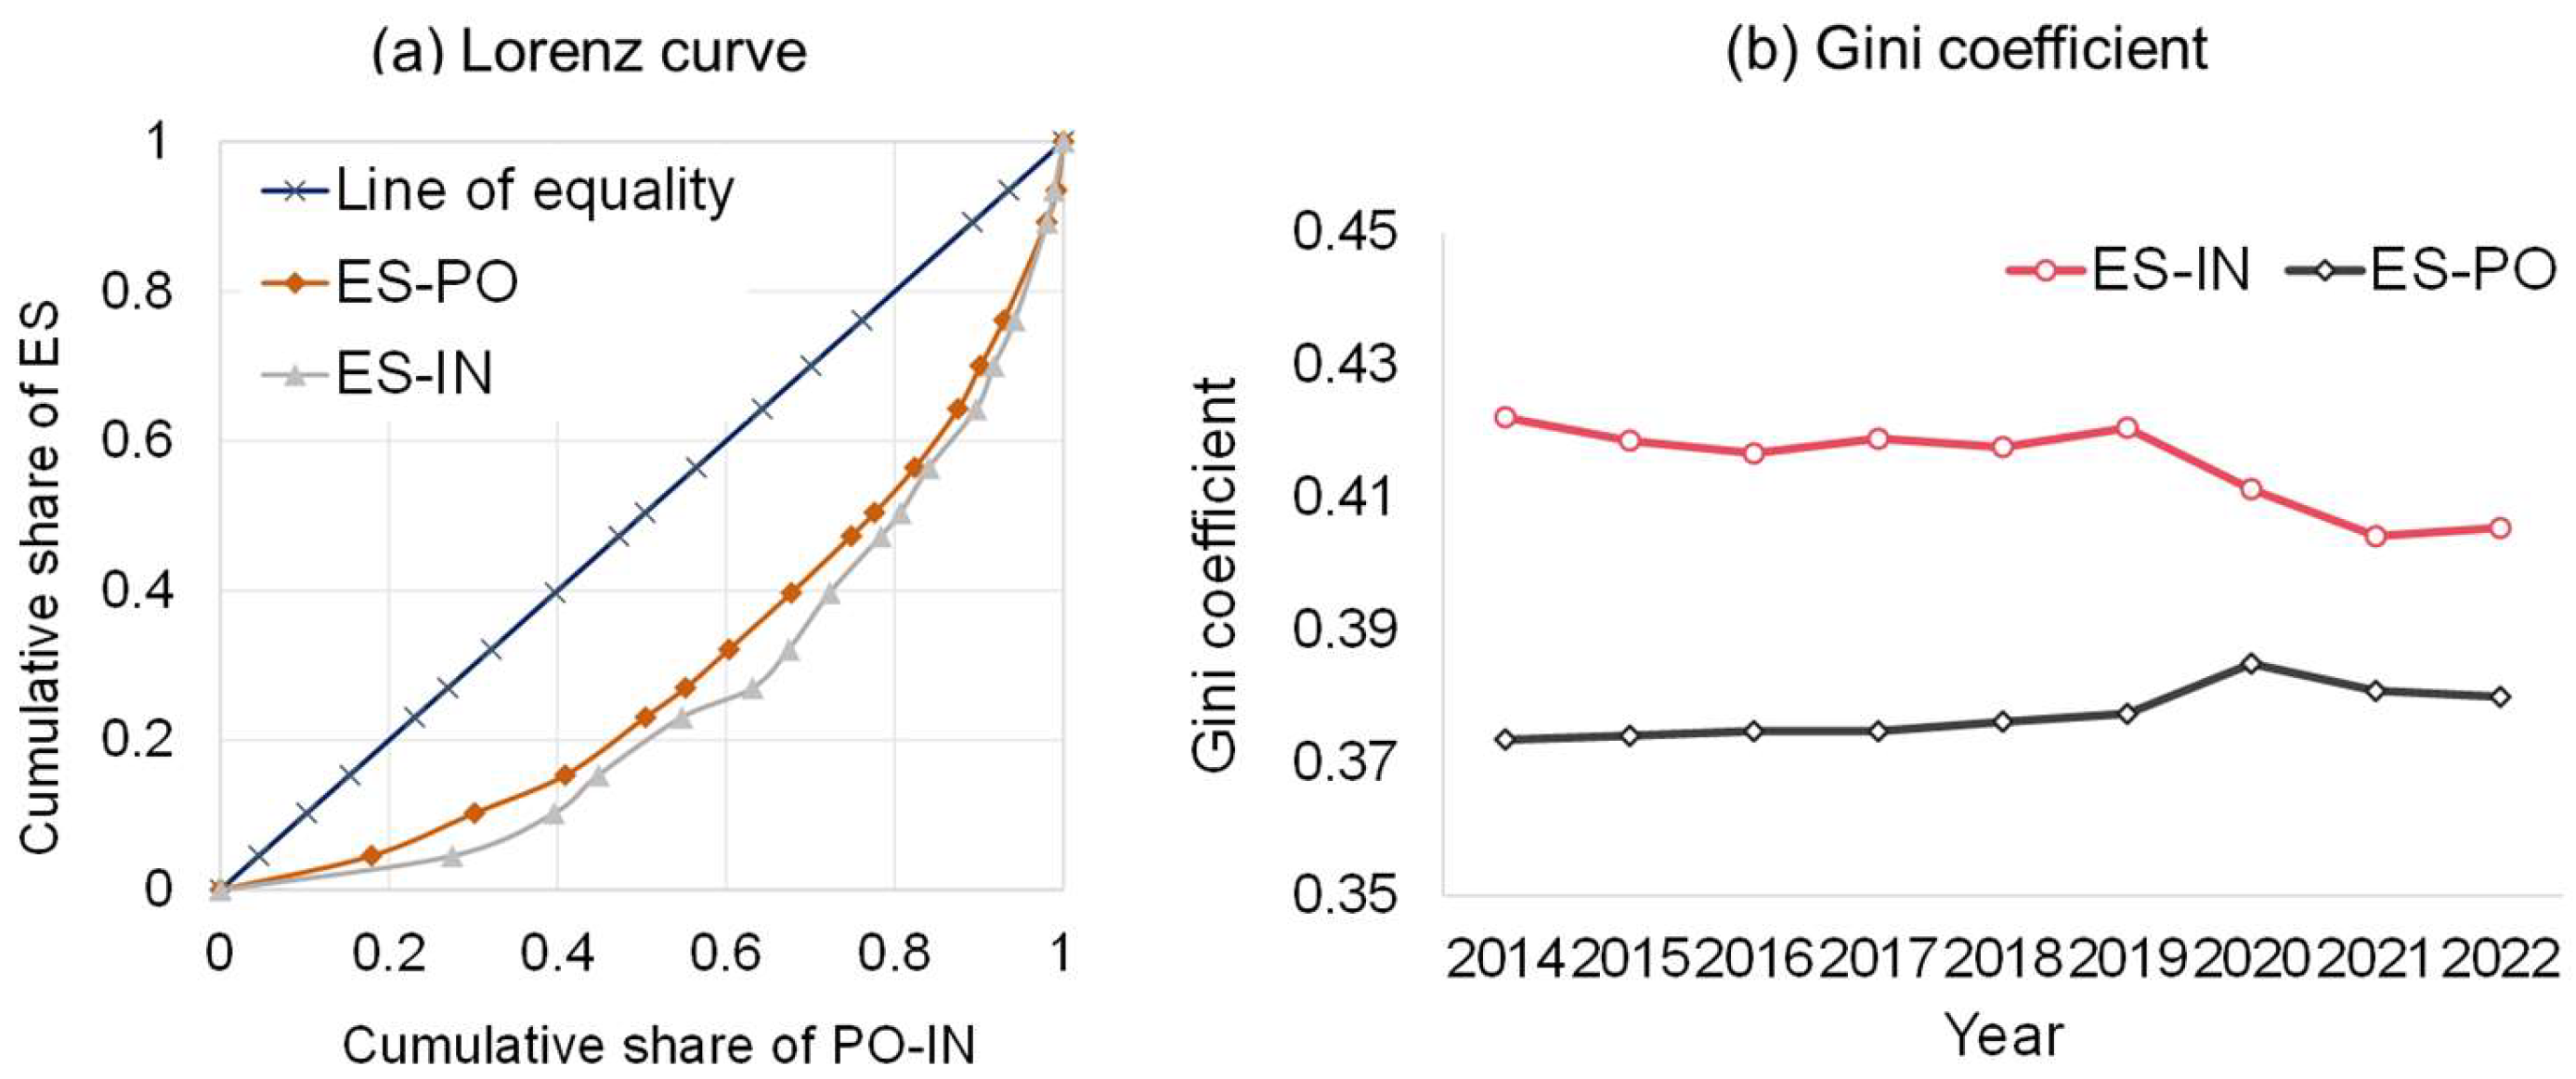
As illustrated in Figure 6, the Gini coefficient of ES and PO in Yunnan Province from 2014 to 2022 is in a more reasonable state. However, the Gini coefficient is fluctuating and rising, suggesting that if this trend continues, it could approach the 0.4 warning line in the next few years. Therefore, policy intervention is needed to facilitate timely adjustments to prevent fragmentation in natural ecology and population development. Furthermore, when comparing the Lorenz curves for ES-PO and ES-IN, it becomes evident that the ES-IN curve displays a greater degree of curvature, reflecting more severe inequities. Analyzing the recent trends in the Gini coefficient reveals that, while the fairness associated with ES and IN is still at a stage of significant disparity, there is a consistent downward trend. Nonetheless, the Gini coefficient for ES-IN in Yunnan Province in 2022 remains above 0.4, indicating that the distribution relationship between ecological resources and economic growth has not yet achieved equity. Nevertheless, it is showing signs of gradual improvement and is shifting towards greater equity.
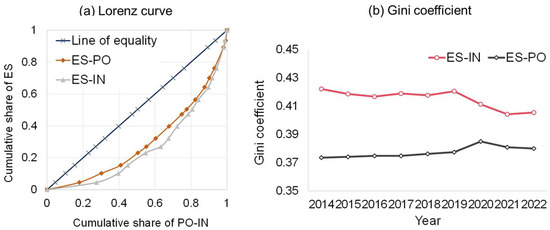
Figure 6.
Temporal unfairness of ES based on PO-IN by Lorenz curve and Gini coefficient.
3.3. Spatial Differences in ES with Consideration of PO-IN
This study categorizes the spatial differences among the cities in Yunnan Province based on the Natural Breaks method using ArcGIS 10.7. The method is based on clustering thinking, which ensures that the similarity within each group is maximized, and lets the similarity between different groups be kept to a minimum. The specific classification categories are shown in Table 4.
Table 4.
The spatial difference level between ES and PO-IN in Yunnan Province.
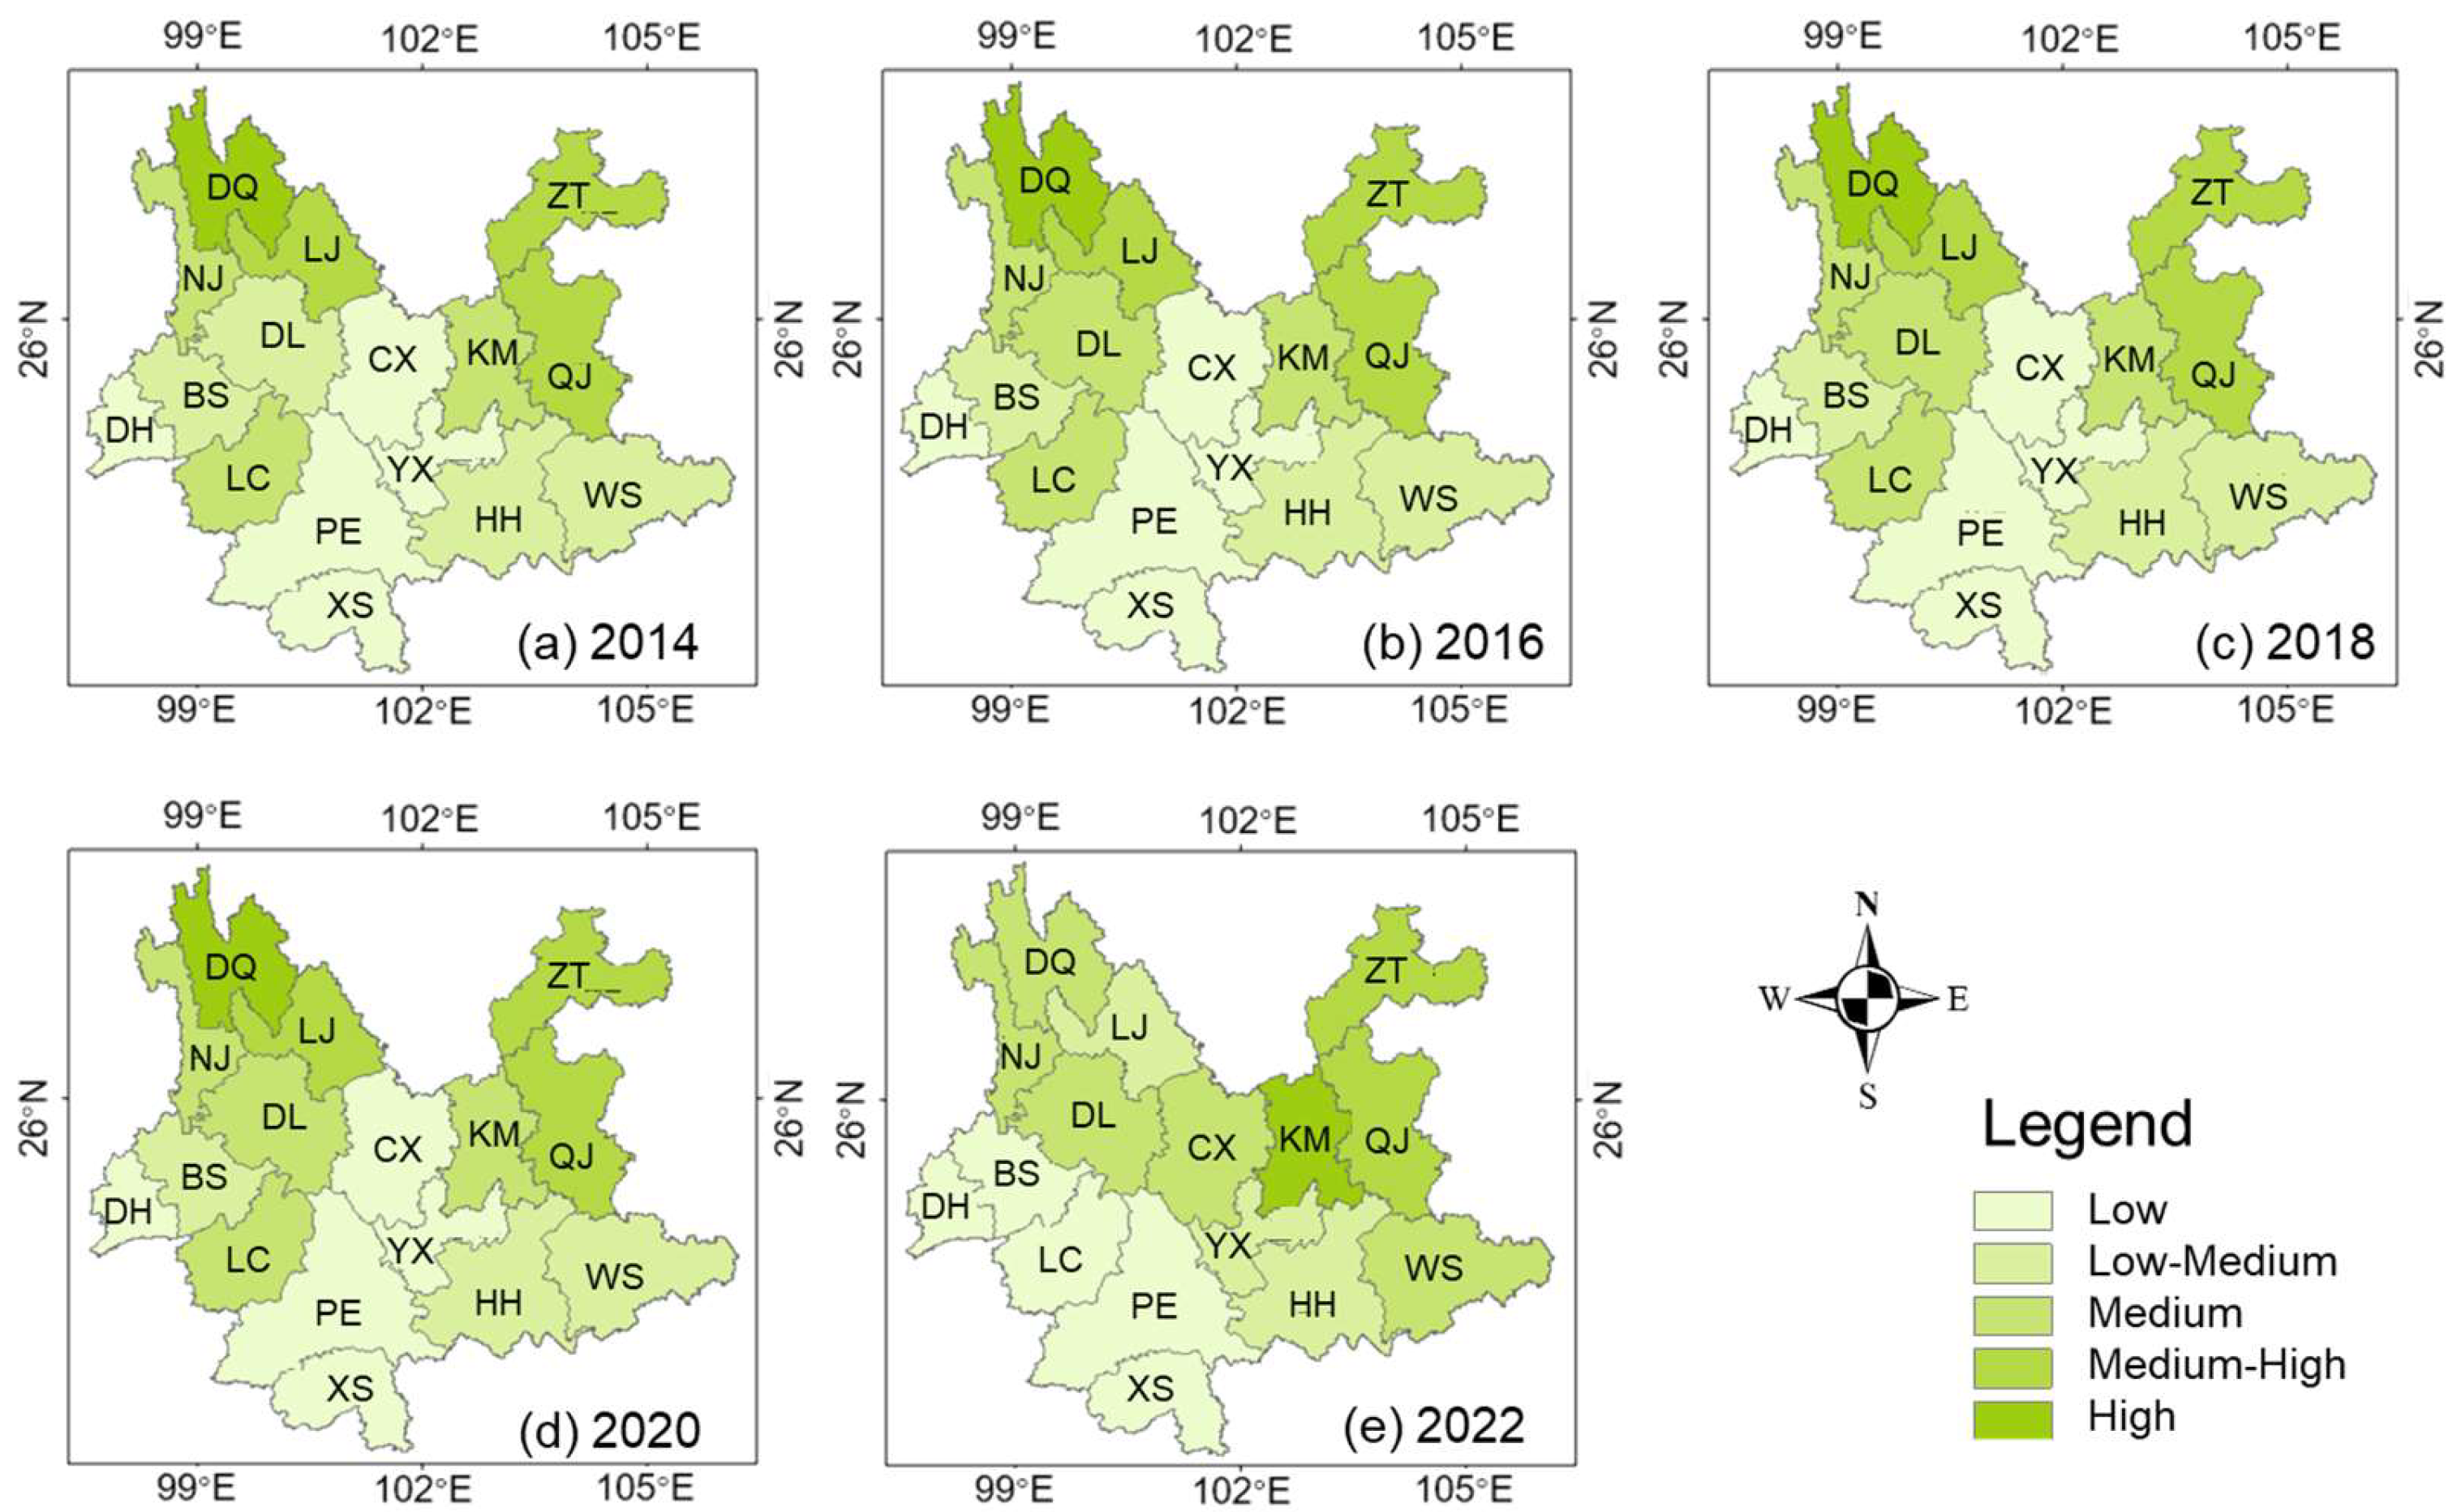
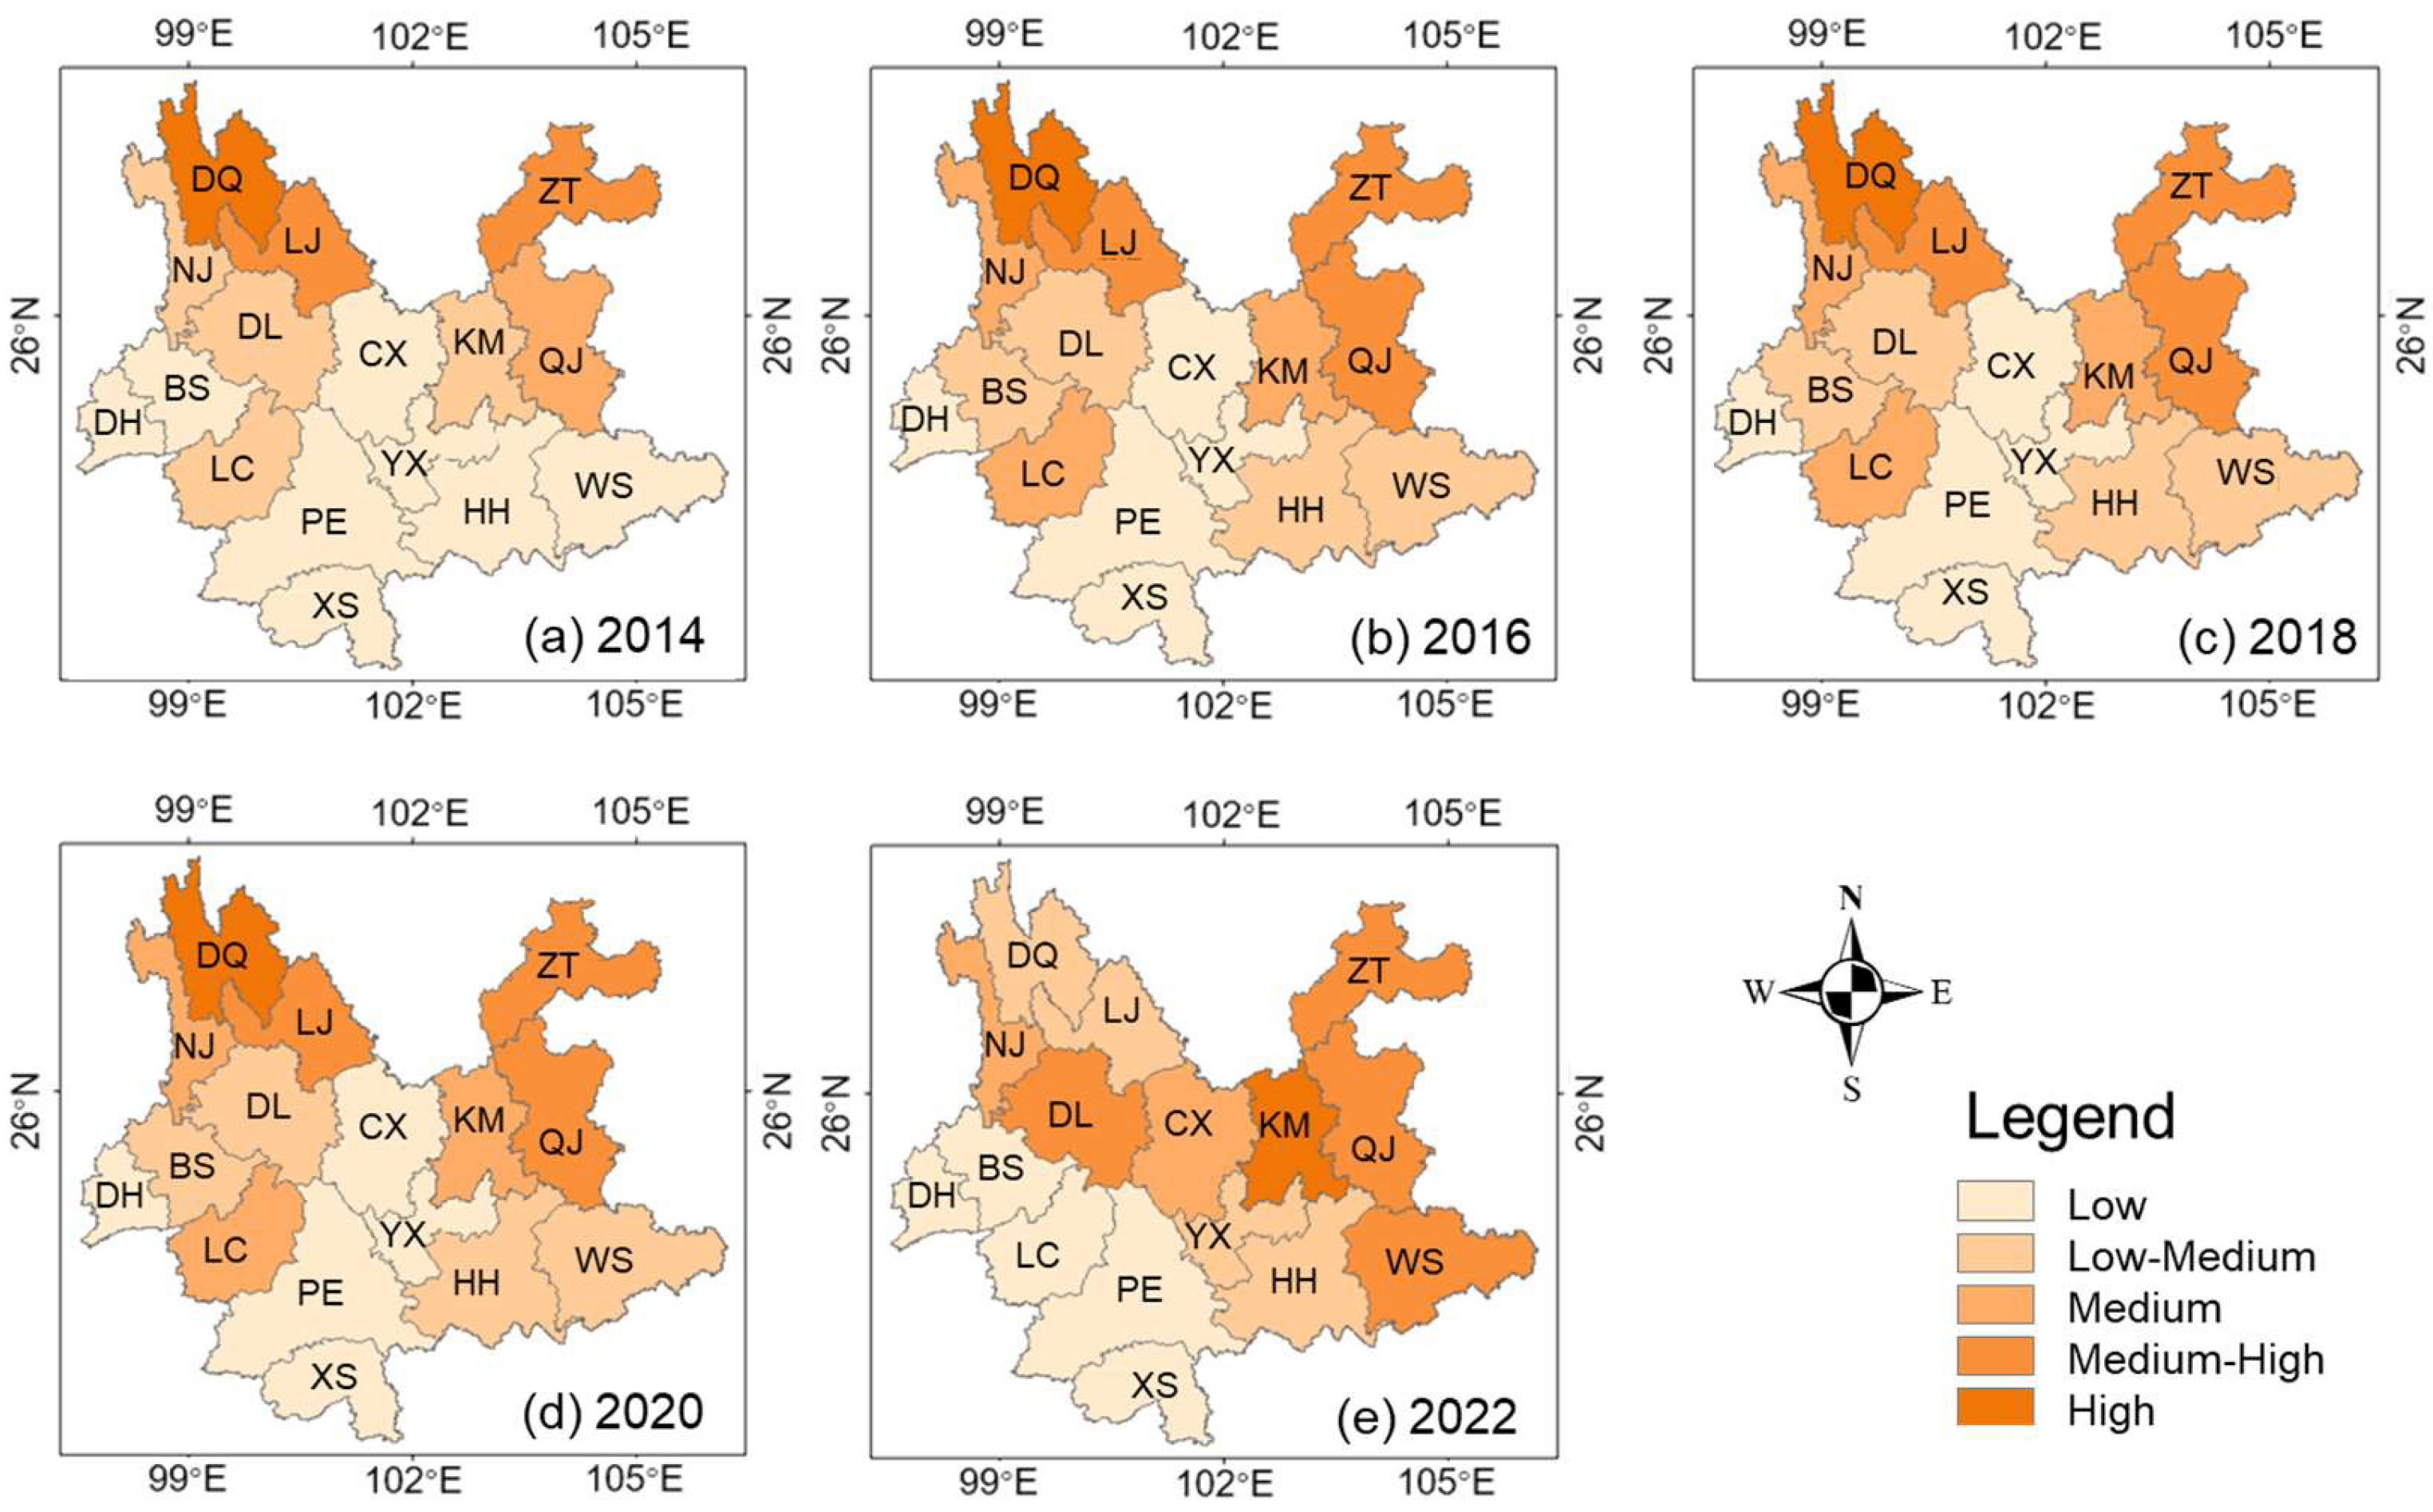
Figure 7 shows the pattern of spatial differences between ES and PO in Yunnan Province from 2014 to 2022. Among them, the difference in distribution between ES and PO in Kunming (KM) has gradually become wider in recent years due to the north–south development mode of KM’s main urban area, leading to an increase in construction land, which in turn has narrowed the distribution range of ES. The population in the central city is highly concentrated, surpassing 60% of the total population, while the area of ES accounts for only one-sixth of the total land area, which exacerbates the degree of difference between ES and PO distribution. At the same time, with a large number of modern service and high-tech enterprises settled in the central city, combined with the special industries of Chenggong New District and Airport Economic Zone, the concentration of PO in and around the main city is increasing, which further expands the mismatch with ecological space. Contrastingly, cities such as Yuxi (YX), Honghe (HH), Wenshan (WS), and Dali (DL) with a low to medium degree of spatial disparity are mostly located in mountainous and hilly areas. In these areas, ES is widely distributed (especially forests), accounting for nearly 70% of the ES in Yunnan Province, while the POP accounts for less than 60% of the area, resulting in a relatively balanced alignment between population distribution and ES. Conversely, cities like Pu’er (PE), Xishuangbanna (XS), and Dehong (DH) have maintained a minimal mismatch between ES and PO in recent years, indicating that the allocation of ecological space resources in these regions is comparatively well suited to PO distribution. It can be attributed to the fact that PO concentration in these areas is mostly in the form of linear clusters, scattered points, or rings, which promotes an even spatial distribution. The spatial pattern ensures that these areas are surrounded by rich ecological spaces, which helps ecosystems mitigate the adverse effects of frequent human activities on the environment.

Figure 7.
The spatial difference between ES and PO in Yunnan Province from 2014 to 2022.
Figure 8 demonstrates the pattern of spatial differences between ES and IN in Yunnan Province from 2014 to 2022. It shows that the differences in distribution between ES and IN within Kunming (KM) and Qujing (QJ) are more pronounced because the main area of economic activities is concentrated in the city center. KM has developed four regional open corridors with the main urban area as the center, while QJ has also extended the Xuanwei sub-central city based on its three central cities, showing a development trend from northeast to southwest. This phenomenon has inevitably resulted in differences and asymmetries in the distribution patterns of ES and IN across the two regions, as urban development patterns and industrial structures continue to change. In contrast, cities like Dali (DL), Zhaotong (ZT), and Wenshan (WS) exhibited a middle–high degree of difference between ES and IN, primarily influenced by geographic conditions and the distribution of ecological resources. The long-strip expansion mode results in the industry being less clustered within a given area, indicating that the economic distribution pattern in these regions is looser compared to more aggregated areas, which is more conducive to reducing the difference between ES and IN. Moreover, cities in the middle and lower levels of difference, such as Nujiang (NJ), Chuxiong (CX), Diqing (DQ), and Lijiang (LJ), contain some areas where socioeconomic development levels are similar to those in the main urban areas. A multiple-centers development model can achieve a more balanced distribution of economic and industrial activities within the city, effectively mitigating the extremes of the differences between ES and IN.
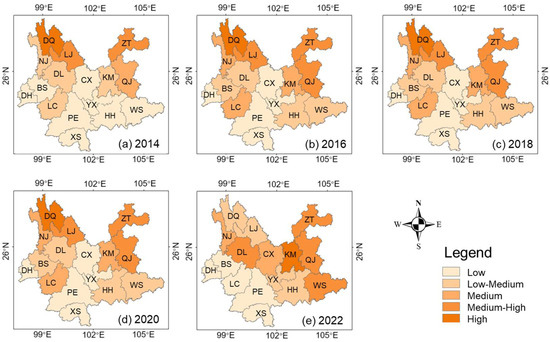
Figure 8.
The spatial difference between ES and IN in Yunnan Province from 2014 to 2022.
3.4. Dynamic Change in Mismatch Between ES and PO-IN
In recent years, the strengthening of ecological protection and restoration in northern Yunnan Province has caused the gravity center of ecological space to gradually shift southwards. At the same time, influenced by the industrial development and population agglomeration of large cities (such as Kunming), the overall population-industry layout pattern has changed, causing the gravity center to shift toward the southeast. Figure 9 shows that the ES of Yunnan Province remained essentially unchanged from 2014 to 2020, but exhibited a significant shift to the south in the past two years. Although the IN gravity center and the PO gravity center also tend to move south, the eastward shift is more pronounced, primarily due to the rapid economic development and population agglomeration of Kunming, the capital of Yunnan Province, which has led to a dislocation of factor gravity centers in the socioeconomic landscape. In recent years, Yunnan Province has taken the initiative to integrate into and serve the national ecological security system, scientifically plan ES and urban space, and construct an ecological security pattern of “three screens, two belts, six corridors, and multiple points”. At the same time, the province has continued to increase the protection and restoration of natural ecosystems, promote the greening of the national territory, and implement major projects for the protection and restoration of important ecosystems. In particular, Yuxi (YX), Honghe (HH), Pu’er (PE), Lincang (LC), and other areas have seen significant growth in ES, effectively shifting the gravity center of ES further south.
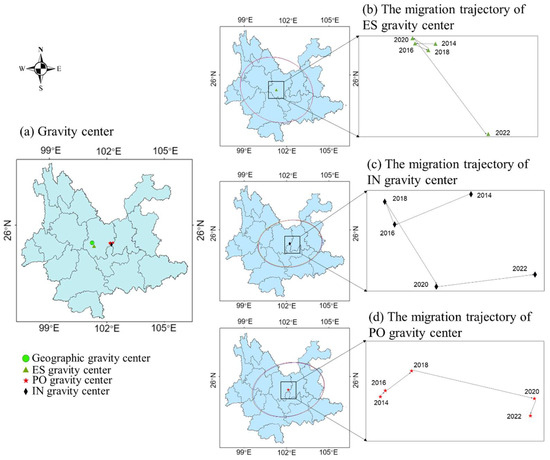
Figure 9.
Location and migration trajectory of ES, IN, and PO gravity center in Yunnan Province.
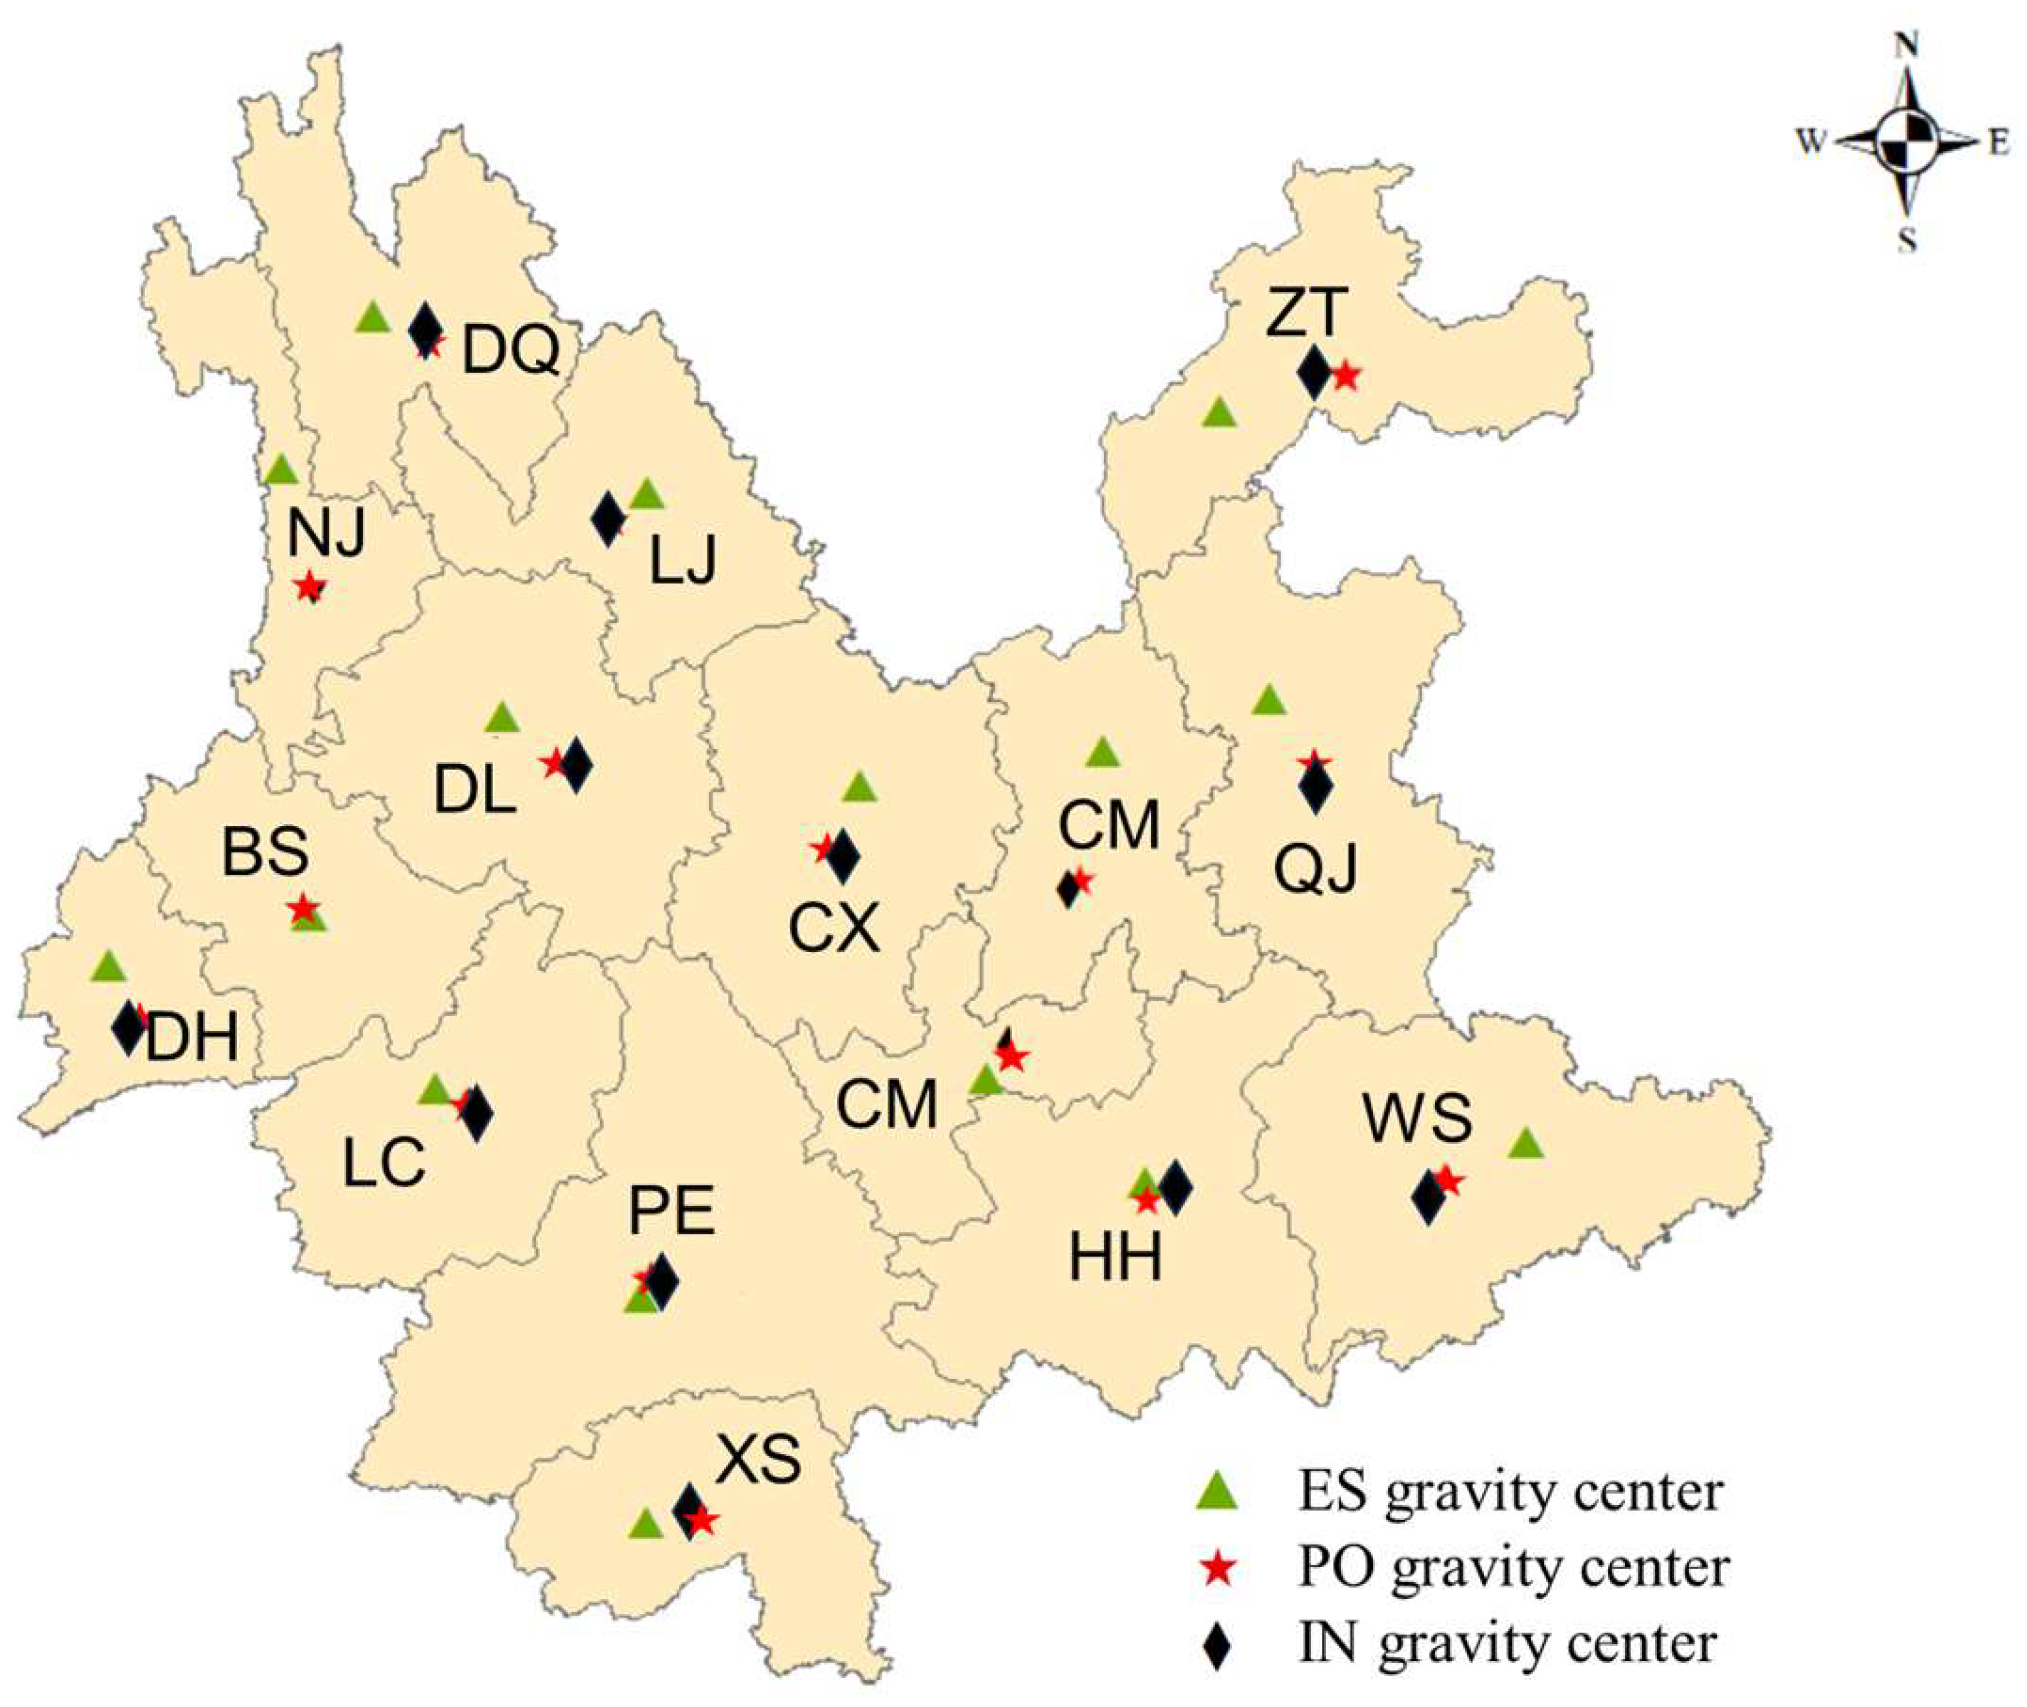
Figure 10 shows the distribution of the gravity center of ES and PO-IN in Yunnan Province in 2022, indicating the mismatch in the centers of gravity among different cities and towns varies significantly. Among them, the distances of the gravity centers between ES and PO-IN in regions such as Pu’er (PE), Lijiang (LJ), and Honghe (HH) are close, which indicates that there is a high degree of matching between the ecological resources and the socioeconomic development. On the other hand, the gravity centers of ES in some regions like Kunming (KM), Zhaotong (ZT), and Qujing (QJ) are significantly distant from the PO-IN gravity centers, indicating a low degree of matching between the gravity centers.
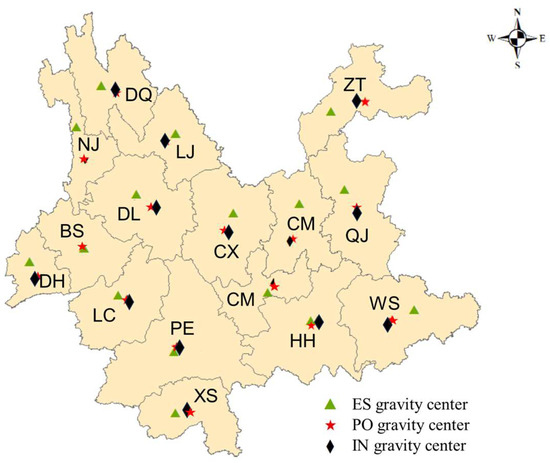
Figure 10.
Distribution of ES and PO-IN gravity center in Yunnan Province in 2022.
The movement in the distance of the gravity center between ES and PO-IN reflects the dynamics of mismatch across regions. According to the change in the gravity center distance of ES with PO-IN from 2014 to 2022, the paper classifies each state and city into three categories: expanding (such as KM), shortening (such as QJ), and minor fluctuation (such as ZT), as shown in Figure 11.
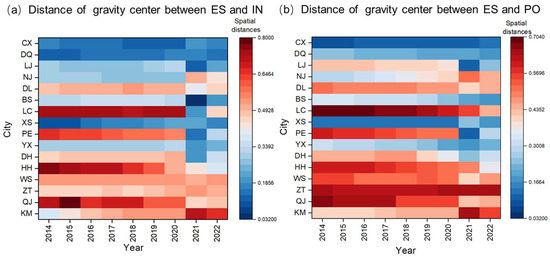
Figure 11.
Changes in distance between ES and PO-IN gravity center in Yunnan Province from 2014 to 2022.
The mismatch between the gravity center of ES and the gravity center of PO-IN in Kunming (KM) is the highest in the province over the period 2014–2022, and the distance between the centers of gravity has been increasing year by year. This is because the ecological space distribution pattern in Kunming (KM) is more in the south and less in the north. In recent years, the central city of Kunming has adopted a north–south spatial development mode, to gradually improve the construction level and quality of the main city. At the same time, with the rapid development of Chenggong New District and the Airport Economic Zone attracting a large number of special industries and enterprises, the gravity center of population and IN is constantly moving to the south, which causes the distance between the gravity center of ES and the gravity center of economic factors to increase year by year. In contrast, the gravity center of population and IN in Qujing (QJ) has shifted a relatively small distance, and the ES, PO, and IN share of each district and county are relatively consistent. However, along with the steady progress of ecological environment construction in Qujing (QJ), the population and IN share of the main urban area maintains a steady increase, and the gravity center of ES has moved toward the southeast main urban area (Zhan Yi and Qilin districts), which causes the difference in the distance between the ES and the economic factors decrease rapidly. It indicates that the regional match between the ES of Qujing (QJ) and the concentrated distribution of the population and IN has been gradually improving. The relative position of the distance between ES and the gravity center of PO-IN in Zhaotong (ZT) remains relatively stable. The gravity center of PO-IN in Zhaotong (ZT) is concentrated in the central region, while the gravity center of ES is in the southwest. All three types of centers of gravity show a tendency to change gradually to the south, but the moving position is relatively small, indicating the characteristics of the change in the gravity center of ecological and economic factors remain unchanged.
3.5. Analysis of the Impact of URI on IES Under Socioeconomic Development
Table 5 shows the empirical results of the impact of URI on IES under socioeconomic development. The results show that under the condition that other control variables remain unchanged, the improvement of URI in Yunnan Province can significantly reduce unfairness, thereby reducing the inequity in ecological space. At the same time, the improvement of URI can reduce the Theil index to alleviate differences between regions. Moreover, the development of URI helps to narrow the distance between the gravity centers to reduce the mismatch.
Table 5.
Impact of URI on the IES.
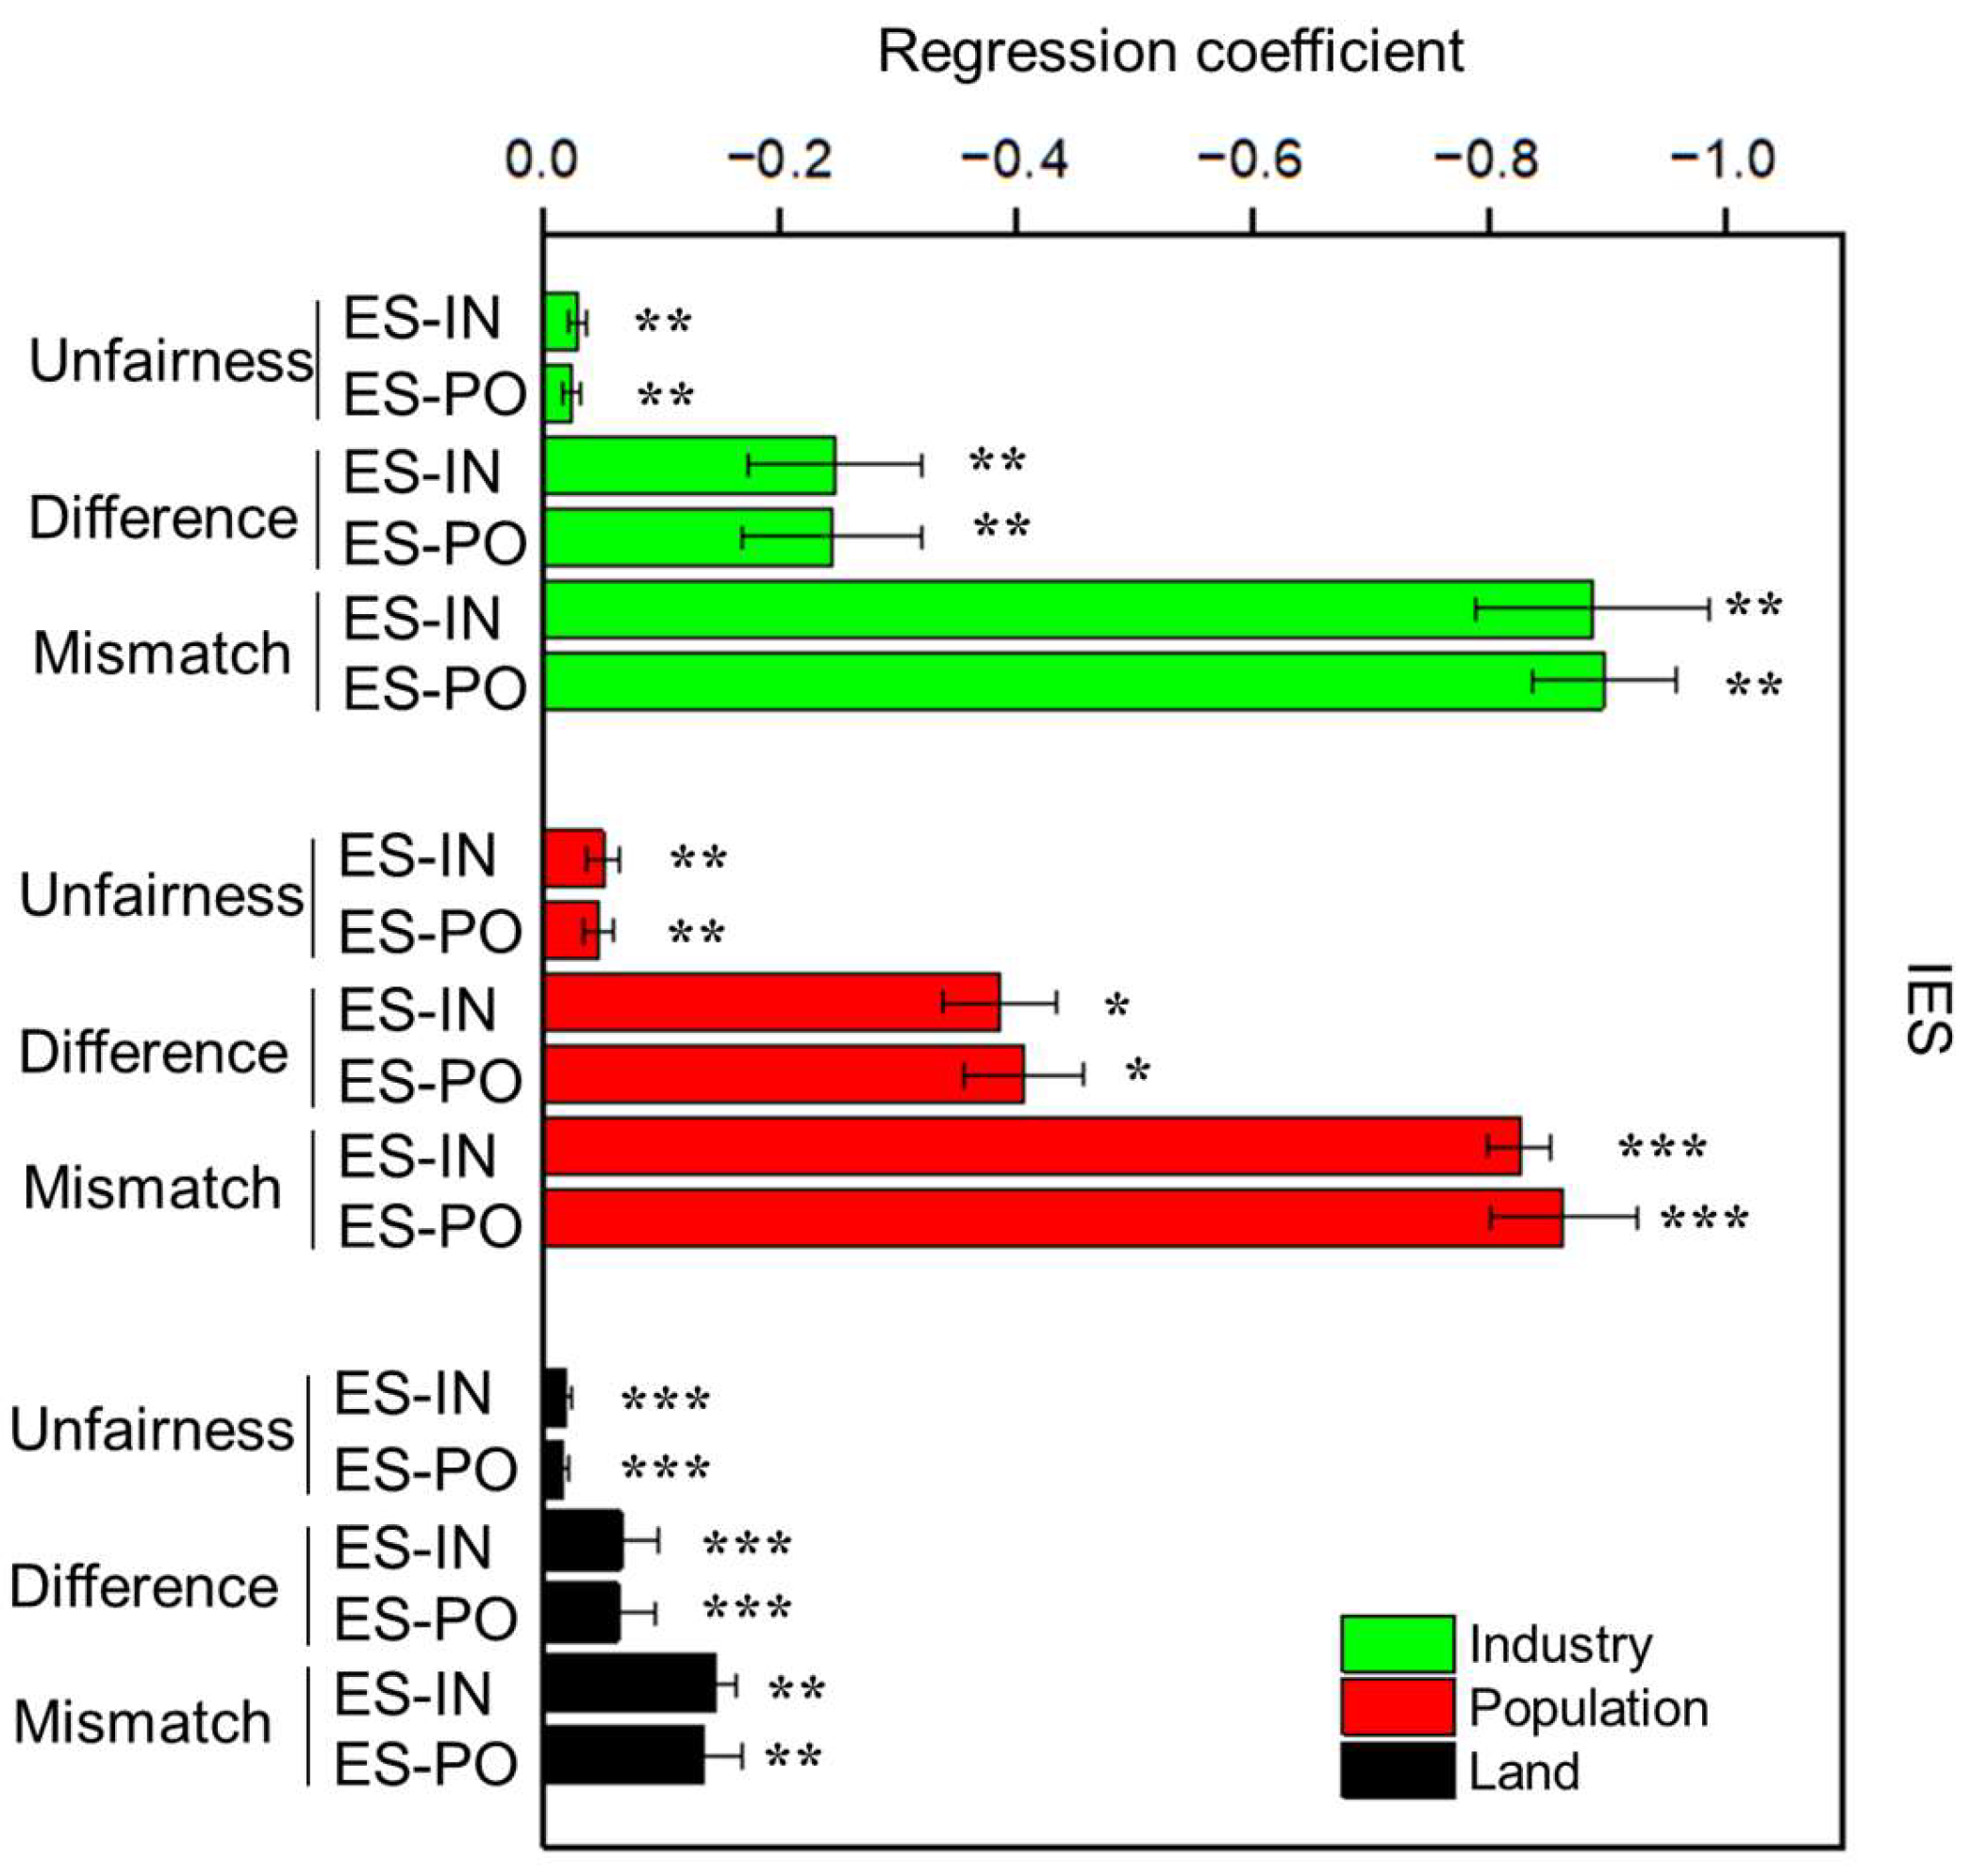
According to the urban–rural integration symbiotic system, this study further explores the differentiated impacts of the three symbiotic units of population–industry–land on the IES under socioeconomic development. According to Figure 12, the three types of urban–rural integration symbiosis can significantly reduce the degree of unfairness. Furthermore, URI could reduce the Theil index between regions and the distance between gravity centers to affect the difference and mismatch of IES, and the improvement of URI can reduce the distance between the center of gravity, differences, and mismatch of IES, and effectively promote the harmonious development level of regional socioeconomic benefits and ecological rights. Specifically, industry unit integration symbiosis plays a significant role in promoting its compatibility, followed by population-unit integration, and finally land-unit integration. It indicates that promoting industrial optimization and transformation, as well as facilitating orderly urban–rural population mobility and labor employment transformation, remain important priorities for promoting regional harmonious development in Yunnan Province. At the same time, special attention should also be paid to promoting the protection and restoration of ecological land and to rationally planning the land-use pattern between construction land and ecological land.

Figure 12.
Differential impacts of different symbiotic units on the IES. The symbols *, **, and *** represent a significance level of 10%, 5%, and 1%, respectively.
3.6. Analysis of Heterogeneity
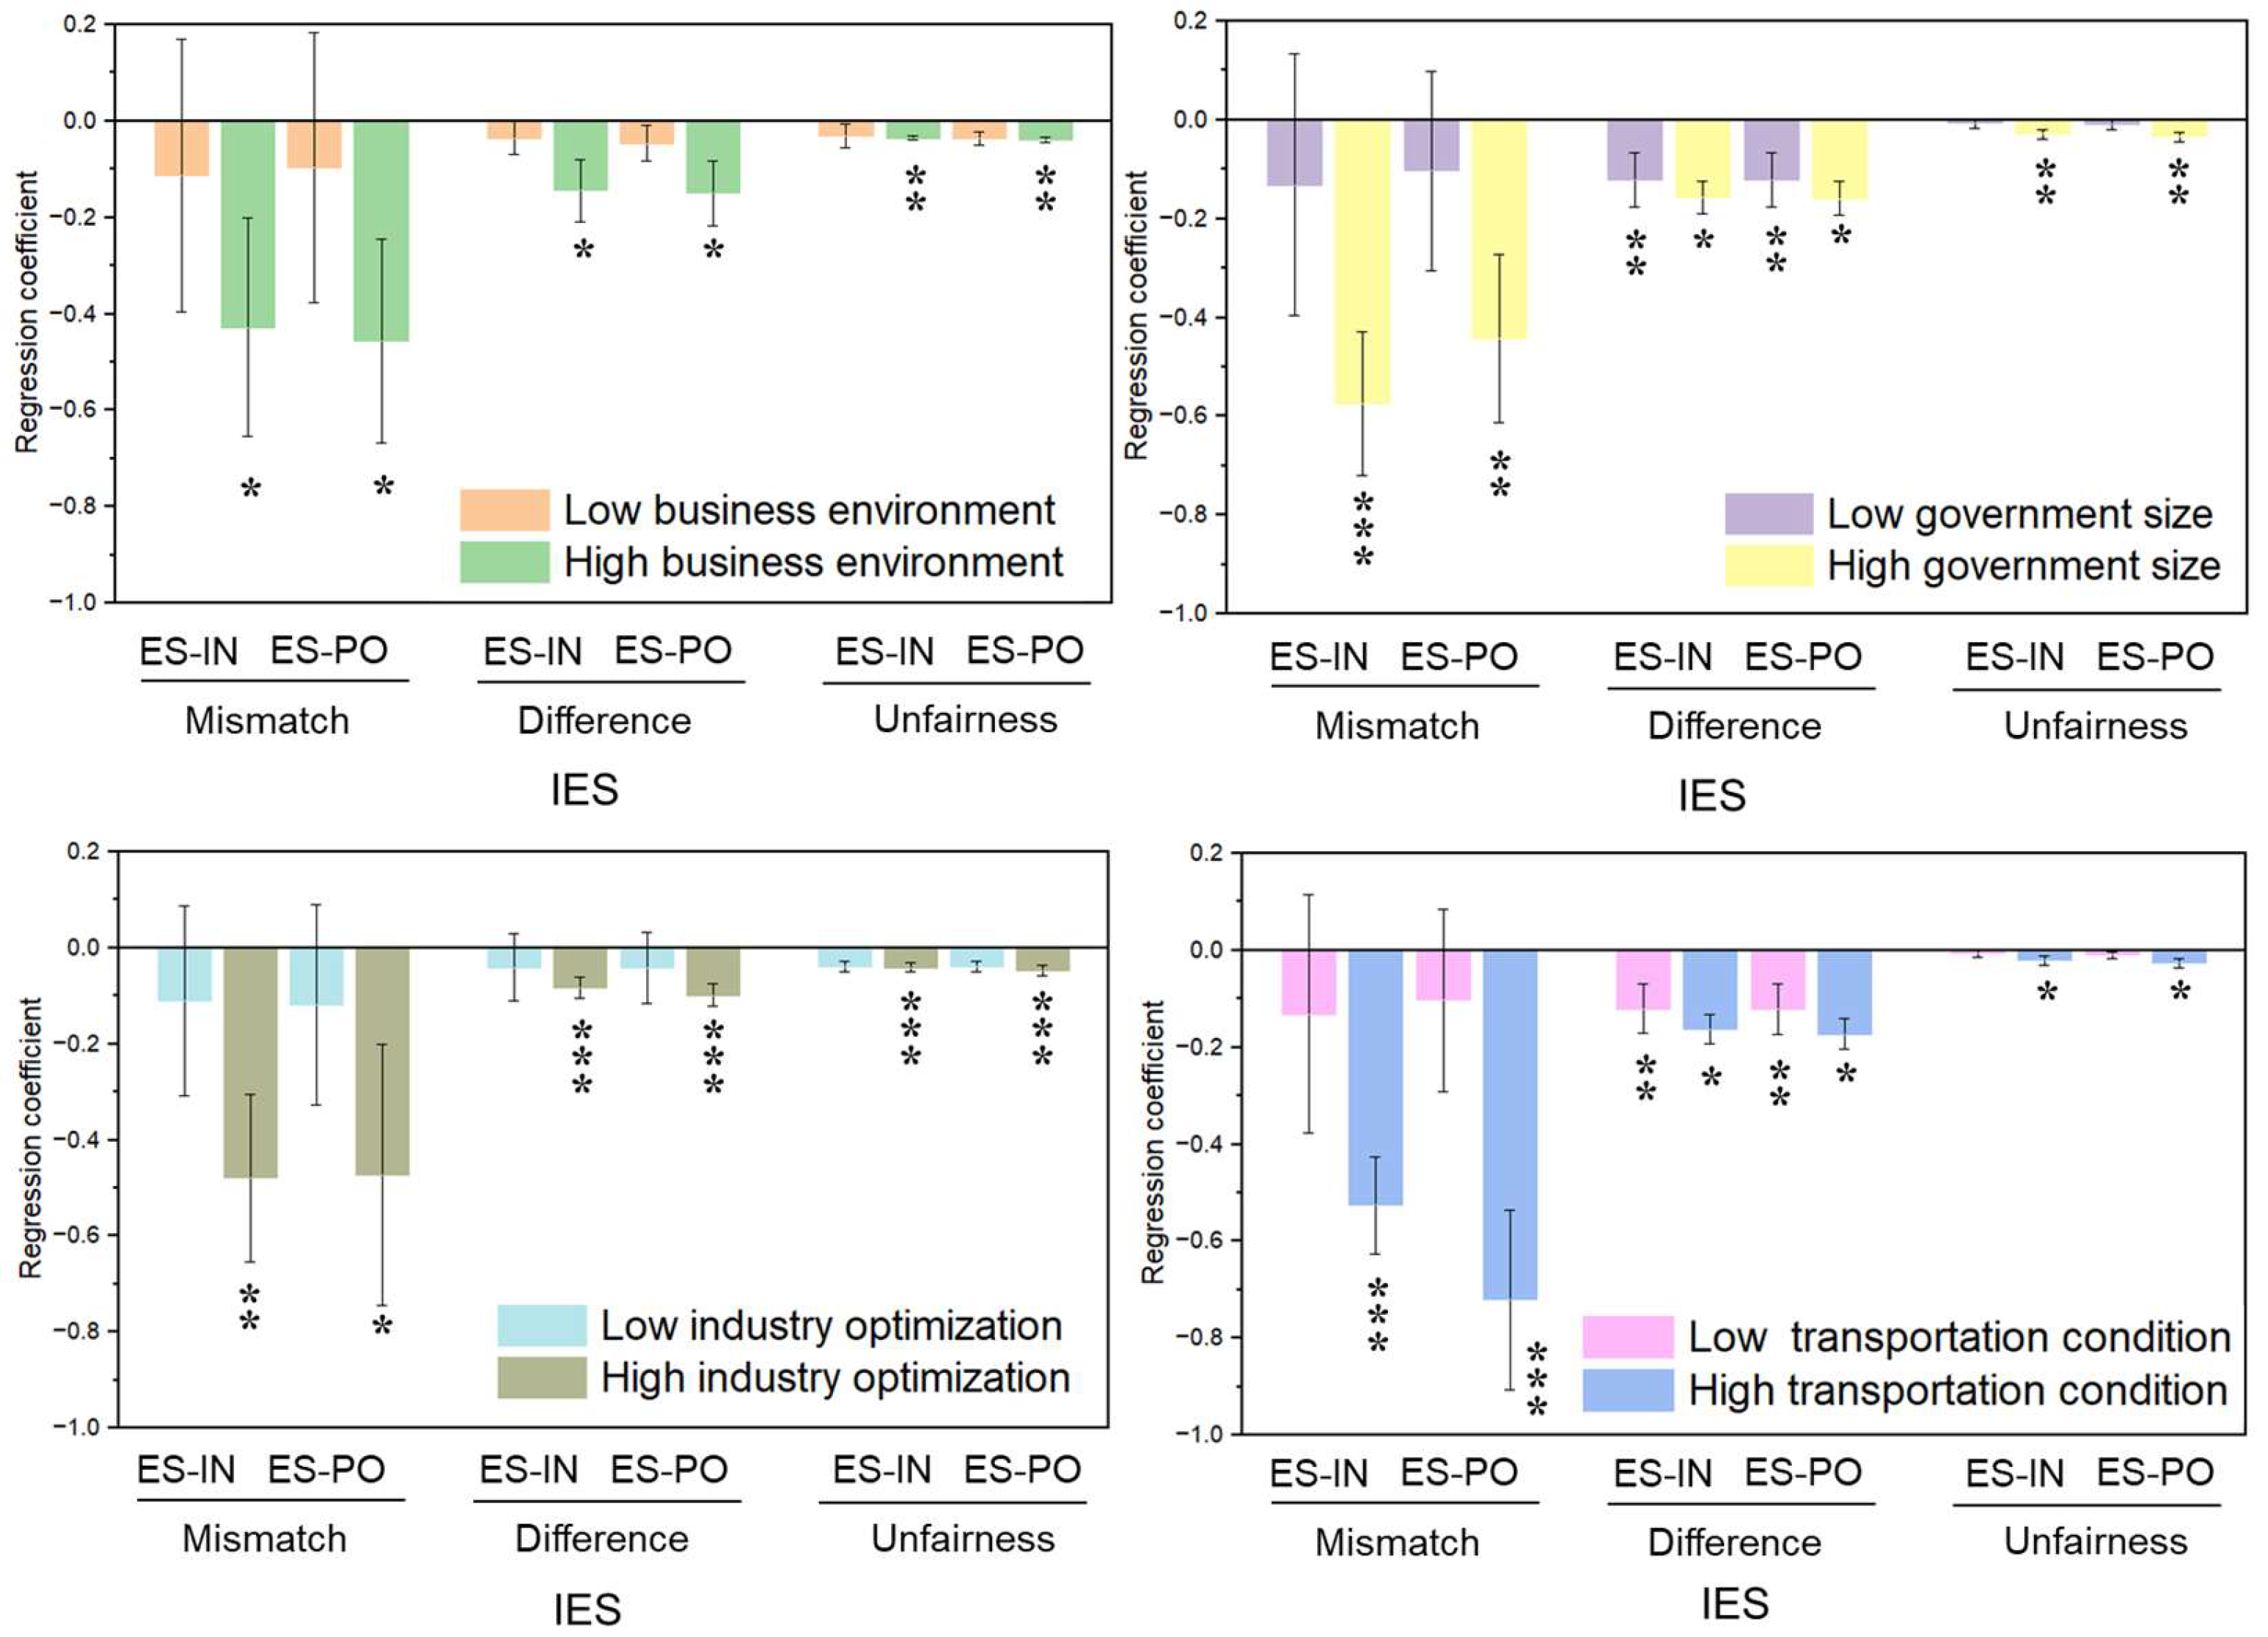
According to the above analysis, the symbiotic effect of IES is influenced by multi-dimensional symbiotic environments. Therefore, this paper further analyzes heterogeneity from four aspects: business environment, government regulation, industrial structure, and transportation conditions to explore the realization path of urban–rural integration to promote the harmonious development of socioeconomic benefits and ecological rights under symbiotic environments (as shown in Figure 13). The results show that transportation conditions between regions and active government expenditure can ameliorate IES, which helps to reduce the unfairness, differences, and mismatch in the distribution of ecological space relative to population and economic growth. Meanwhile, in a region highly dependent on ecological resources, a good business environment and industrial structure can help transform ecological advantages into industrial advantages, which will be conducive to promoting economic transformation and realizing the goal of harmonious development through urban–rural integration. It indicates that in the context of urban–rural integration, policymakers should pay attention to the combination of the role of government and the market in promoting equity development of ecological space distribution and socioeconomic development, which is crucial for achieving sustainable development.

Figure 13.
Analysis of heterogeneity under various symbiotic environments. The symbols *, **, and *** represent a significance level of 10%, 5%, and 1%, respectively.
4. Conclusions and Discussion
In this study, an urban–rural integration six-step symbiotic framework (UISS), including “Symbiotic Unit–Symbiotic Environment–Symbiotic Modes–Symbiotic Effect–Symbiotic Result2013Symbiotic Goal”, was built to reflect the relationship between urban–rural integration symbiotic development level (URI) and socioeconomic inequity in ecological space (IES) after urban–rural symbiotic unit (population–industry–land, PIL) interactions change from an urban-led commensalism mode to an urban–rural mutualism mode. Meanwhile, the two-way fixed-effects model and analysis of heterogeneity are used to discuss how URI influences IES under socioeconomic development from temporal unfairness, spatial differences, and dynamic changes in mismatch, which provides a realistic path for solving the problem of imbalance between urban and rural development and the inequity of ecological and socioeconomic conditions under symbiotic environments. Moreover, a comprehensive multi-perspective analysis of IES based on the symbiotic framework (MEU) can be applied to Yunnan Province to reflect the process of unfairness, differences, and mismatch under symbiotic units’ (PIL) mutualism interaction and cooperation. The research results aim to provide support and suggestions for territorial spatial planning, as well as ecological protection and restoration in Yunnan Province, which could help to better promote sustainable development.
The research results of the paper are as follows: (1) The integration symbiotic development of urban and rural areas in Yunnan Province shows a fluctuating upward trend with a maximum growth rate of 22.89%. Among them, the population unit exhibits the highest level of integration symbiosis, rising from 0.144 in 2014 to 0.174 in 2022, which is the main driving force of URI. Although the level of land-unit integration symbiosis is low, the growth rate is the fastest, which has a positive driving effect on the overall improvement of urban–rural integration symbiosis. However, the level of industrial unit integration symbiosis is relatively low. It is evident that the degree of urban–rural integration in Yunnan Province has been significantly improved in recent years, indicating that the flow pattern of urban–rural factors in this region is undergoing a positive transformation, which facilitates the gradual advancement of equal resource exchange and a virtuous cycle of development. (2) The Gini coefficient of ES-PO in Yunnan Province remains within a relatively reasonable range from 2014 to 2022, but it has increased in the past two years, which reflects the underlying trend of inequity. Although the Gini coefficient of ES-IN has gradually declined in recent years, it is still above the warning line of 0.4. Therefore, it is necessary to adjust the relationship among ecological space production, economic growth, and population distribution in Yunnan Province promptly to ensure environmental equity. (3) There are still spatial differences in the socioeconomic inequity in ecological space in Yunnan Province (including both between and within regions). On the one hand, industrial economic activities and population flows increasingly concentrate in large and medium-sized cities, leading to differences in the socioeconomic development and urbanization level of various cities, which further exacerbate spatial differences. For example, the main urban area of Kunming is home to more than 60% of the total population. On the other hand, it is related to the population distribution and development planning of each city, influencing the migration of the population-industry gravity center. The development and construction planning of the main urban area is more concentrated, resulting in excessive economic population density in local urban space, which increases the difference between ES and PO-IN. On the contrary, those areas with relatively scattered urban construction (a form of strips, scattered points, or rings) or rich surrounding ecological resources exhibit better equity. (4) The ecological protection and the urbanization of large cities in Yunnan Province drive a shift in the gravity center of ES-PO-IN. The adjustment of gravity-center distance, including shortening (e.g., QJ), expanding (e.g., KM), and minor fluctuations (e.g., ZT), results in dynamic changes in mismatch, which further affect the socioeconomic inequity in ecological space. (5) Improvements in urban–rural integration symbiotic development level in Yunnan Province can produce a symbiotic effect that reduces the socioeconomic inequity in ecological space, effectively reducing the unfairness, difference, and mismatch. In addition, in the context of rapid urban–rural integration, a favorable symbiotic environment including business environment, industrial structure, transportation conditions, and fiscal expenditure is more conducive to ameliorating IES.
Based on the above analysis, this study puts forward policy suggestions to promote Yunnan Province in better achieving sustainable development under the background of urban–rural integration. Firstly, to improve the utilization efficiency of ecological land, it is necessary not only to promote ecological protection and enhance ecological value but also to further carry out land consolidation and restoration in ecologically damaged areas, which helps to realize the ecological prosperity of the entire province. Secondly, land planners should systematically arrange living, production, and ecological spaces, combining comprehensive land renovation with rural revitalization. Urban and rural transportation environments should be further improved to enhance urban–rural connectivity. Thirdly, it is important to build a multi-dimensional environmental and digital industrial system to vigorously promote industrial ecology and ecological industrialization, which could help to optimize and upgrade the industrial structure. Additionally, while effectively protecting the natural landscape pattern, the government should promote the transformation of the regional ecological and resource advantages into industrial and economic advantages through preferential policies and financial subsidies. By creating a sound business environment, the region can fully leverage its unique comparative advantages, thereby better promoting harmonious development.
Author Contributions
Conceptualization, X.A., X.Z. and L.M. (Lijun Meng); methodology, X.A.; software, X.A.; validation, X.A. and L.M. (Lijun Meng); formal analysis, X.A. and L.M. (Lijun Meng); investigation, X.Z.; resources, X.Z.; data curation, X.A.; writing—original draft preparation, X.A.; writing—review and editing, X.Z. and L.M. (Lixuan Ma); visualization, X.A.; supervision, X.Z.; project administration, X.Z. and L.M. (Lixuan Ma); funding acquisition, X.Z. and L.M. (Lixuan Ma). All authors have read and agreed to the published version of the manuscript.
Funding
This research was funded by the Yunnan Social Science Foundation, grant number YB2023014.
Institutional Review Board Statement
Not applicable.
Informed Consent Statement
Not applicable.
Data Availability Statement
The data that support the findings of this study are available upon request from the corresponding author.
Conflicts of Interest
The authors declare no conflicts of interest.
References
- Zeng, Q.; Chen, X. Identification of urban-rural integration types in China—An unsupervised machine learning approach. China Agric. Econ. Rev. 2023, 15, 400–415. [Google Scholar]
- Yunnan Provincial Government. Main Data of the Third National Land Survey of Yunnan Province. Available online: https://www.yn.gov.cn/ywdt/bmdt/202112/t20211222_231960.html (accessed on 9 March 2025).
- Shen, W.; Zhang, J.; Zhou, X.; Li, S.; Geng, X. How to Perceive the Trade-Off of Economic and Ecological Intensity of Land Use in a City? A Functional Zones-Based Case Study of Tangshan, China. Land 2021, 10, 551. [Google Scholar] [CrossRef]
- Eickhouta, B.; Van Meijl, H.; Tabeau, A.; Van Rheenen, T. Economic and ecological consequences of four European land use scenarios. Land Use Policy 2007, 24, 562–575. [Google Scholar]
- Liu, H.; Chen, W.; Sun, S.; Yu, J.; Zhang, Y.; Ye, C. Revisiting China’s Urban Transition from the Perspective of Urbanisation: A Critical Review and Analysis. Sustainability 2024, 16, 4122. [Google Scholar] [CrossRef]
- Chen, M.; Gong, Y.; Lu, D.; Ye, C. Build a people-oriented urbanization: China’s new-type urbanization dream and Anhui model. Land Use Pol. 2019, 80, 1–9. [Google Scholar]
- Yang, Y.; Bao, W.; Wang, Y.; Liu, Y. Measurement of urban-rural integration level and its spatial differentiation in China in the new century. Habitat Int. 2021, 117, 102420. [Google Scholar]
- Rao, C.; Gao, Y. Evaluation Mechanism Design for the Development Level of Urban-Rural Integration Based on an Improved TOPSIS Method. Mathematics 2022, 10, 380. [Google Scholar] [CrossRef]
- Delgado-Vinas, C.; Gomez-Moreno, M.-L. The Interaction between Urban and Rural Areas: An Updated Paradigmatic. Methodological and Bibliographic Review. Land 2022, 11, 1298. [Google Scholar] [CrossRef]
- Tacoli, C. The links between urban and rural development. Environ. Urban. 2003, 15, 3–12. [Google Scholar]
- Champion, T.; Hugo, G. Introduction: Moving Beyond the Urban–Rural Dichotomy; Ashgate Publishing Limited: Surrey, UK, 2004; pp. 3–24. [Google Scholar]
- Kūle, L. Urban–Rural Interactions in Latvian Changing Policy and Practice Context. Eur. Plan. Stud. 2014, 22, 758–774. [Google Scholar]
- Ma, L.; Liu, S.; Fang, F.; Che, X.; Chen, M. Evaluation of urban-rural difference and integration based on quality of life. Sustain. Cities Soc. 2020, 54, 101877. [Google Scholar]
- Zhang, N.; Yao, Y.; Wang, L.; Li, Q. Spatial-Temporal Coupling Analysis of Land Use Function and Urban-Rural Integration in Heilongjiang, China. Land 2023, 12, 2152. [Google Scholar] [CrossRef]
- Douglass, M. A regional network strategy for reciprocal rural-urban linkages—An agenda for policy research with reference to Indonesia. Third World Plan. Rev. 1998, 20, 1. [Google Scholar]
- Zhou, J.N.; Bi, X.H.; Zou, W. Driving mechanism of urban-rural integration in Huaihai Economic Zone: Based on the space of flow. J. Nat. Resour. 2020, 35, 1881–1896. [Google Scholar]
- Paracer, S.; Ahmadjian, V. Symbiosis: An Introduction to Biological Associations; Oxford University Press: Oxford, UK, 2002. [Google Scholar]
- Tian, Y. Mutualistic Pattern of Intra-Urban Agglomeration and Impact Analysis: A Case Study of 11 Urban Agglomerations of Mainland China. ISPRS Int. J. Geo-Inf. 2020, 9, 565. [Google Scholar] [CrossRef]
- Su, Y.; Yan, Y.; Liu, C. Symbiosis Evolution of Regional Knowledge Innovation Ecosystem: The Relevance of Lotka-Volterra Model. Sci. Technol. Soc. 2024, 29, 373–396. [Google Scholar]
- Wang, J.; Meng, F.; Dong, L.; Yu, S.; Zhang, Y. A Comparative Study on the Identification Methods of Urban-Rural Integration Zones from the Perspective of Symbiosis Theory and Urban Expansion Theory. Land 2023, 12, 1272. [Google Scholar] [CrossRef]
- Smith, G.; Archer, R.; Nandwani, D.; Li, J. Impacts of Urbanization: Diversity and the Symbiotic Relationships of Rural, Urban, and Spaces in-Between. Int. J. Sustain. Dev. World Ecol. 2018, 25, 276–289. [Google Scholar]
- Griffin, T.L.C.; Smailes, P.J.; Argent, N.M. Shaping the Rural-Urban Symbiosis: Density, Dispersal, Remoteness, and Town Size in South-East Australia. Growth Change 2012, 43, 198–227. [Google Scholar]
- Wang, C.; Huang, B.; Deng, C.; Wan, Q.; Zhang, L.; Fei, Z.; Li, H. Rural Settlement Restructuring Based on Analysis of the Peasant Household Symbiotic System at Village Level: A Case Study of Fengsi Village in Chongqing, China. J. Rural. Stud. 2016, 47, 485–495. [Google Scholar] [CrossRef]
- Xiao, L.; He, Z.; Wang, Y.; Guo, Q. Understanding Urban-Rural Linkages from an Ecological Perspective. Int. J. Sustain. Dev. World Ecol. 2017, 24, 37–43. [Google Scholar] [CrossRef]
- Zhou, L.; Tu, W.; Li, Q.; Guan, D. A Heterogeneous Streaming Vehicle Data Access Model for Diverse IoT Sensor Monitoring Network Management. IEEE Internet Things J. 2024, 11, 26929–26943. [Google Scholar] [CrossRef]
- Lin, T.; Grimm, N.B. Comparative study of urban ecology development in the U.S. and China: Opportunity and Challenge. Urban Ecosyst. 2015, 18, 599–611. [Google Scholar]
- Zhou, L.; Zhao, Z.; He, Q.; Du, J.; Mu, F.; Ma, W.; Guan, D.; Zhang, X. RMCVI: A Refined Urban Vitality Perception Index Considering Mountain Characteristics. Trans. GIS 2025, 29, e13292. [Google Scholar] [CrossRef]
- Wang, X.; Wang, D.; Lu, J.; Gao, W.; Jin, X. Identifying and Tracking the Urban-Rural Fringe Evolution in the Urban-Rural Transformation Period: Evidence from a Rapidly Urbanized Rust Belt City in China. Ecol. Indic. 2023, 146, 109856. [Google Scholar]
- He, Q.; Zhou, L.; Zhang, F.; Guan, D.; Zhang, X. Efficient and Accurate Leakage Points Detection in Gas Pipeline Using Reinforcement Learning-Based Optimization. IEEE Sens. J. 2024, 24, 27640–27652. [Google Scholar] [CrossRef]
- Du, X.; Meng, Y.R.; Fang, C.L.; Li, C. Spatio-temporal characteristics of coupling coordination development between urbanization and eco-environment in Shandong Peninsula urban agglomeration. Acta Ecol. Sin. 2020, 40, 5546–5559. [Google Scholar]
- Gai, M.; Wang, Y.F.; Ma, G.D.; Hao, H.J. Evaluation of the Coupling Coordination Development between Water Use Efficiency and Economy in Liaoning Coastal Economic Belt. J. Nat. Resour. 2013, 28, 2081–2094. [Google Scholar]
- Li, X.; Ma, X.; Hu, Z.; Li, S. Investigation of urban green space equity at the city level and relevant strategies for improving the provisioning in China. Land Use Policy 2021, 101, 105144. [Google Scholar]
- Shi, J.; Li, S.; Liu, M.; Li, X.; Yan, H.; Dong, C. Ecological well-being and its equity in various economic contexts: Evidence from 130 cities in the yangtze river economic belt. Ecol. Indic. 2023, 156, 111093. [Google Scholar]
- Lu, Y.; Chen, R.; Chen, B.; Chen, B. Inclusive green environment for all? An investigation of spatial access equity of urban green space and associated socioeconomic drivers in China. Landsc. Urban Plan. 2024, 241, 104926. [Google Scholar]
- He, S.W.; Shao, X. Spatial clustering and coupling coordination of population-land-economic urbanization in Beijing-Tianjin-Hebei Region. Econ. Geogr. 2018, 38, 95–102. [Google Scholar]
- Huang, L.; Yang, P.; Zhang, B.; Hu, W. Spatio-Temporal Coupling Characteristics and the Driving Mechanism of Population-Land-Industry Urbanization in the Yangtze River Economic Belt. Land 2021, 10, 400. [Google Scholar] [CrossRef]
- Shan, L.; Jiang, Y.; Liu, C.; Zhang, J.; Zhang, G.; Cui, X. Conflict or Coordination? Spatiotemporal Coupling of Urban Population-Land Spatial Patterns and Ecological Efficiency. Front. Public Health 2022, 10, 890175. [Google Scholar] [CrossRef]
- National Bureau of Statistics of China. The Statistical Yearbook of Yunnan Province (SYY) 2022; China Statistics Press: Beijing, China, 2023. [Google Scholar]
- National Bureau of Statistics of China. The Statistical Yearbook of Yunnan Province (SYY) 2014; China Statistics Press: Beijing, China, 2015. [Google Scholar]
- National Bureau of Statistics of China. The Statistical Yearbook of Yunnan Province (SYY) 2015; China Statistics Press: Beijing, China, 2016. [Google Scholar]
- National Bureau of Statistics of China. The Statistical Yearbook of Yunnan Province (SYY) 2016; China Statistics Press: Beijing, China, 2017. [Google Scholar]
- National Bureau of Statistics of China. The Statistical Yearbook of Yunnan Province (SYY) 2017; China Statistics Press: Beijing, China, 2018. [Google Scholar]
- National Bureau of Statistics of China. The Statistical Yearbook of Yunnan Province (SYY) 2018; China Statistics Press: Beijing, China, 2019. [Google Scholar]
- National Bureau of Statistics of China. The Statistical Yearbook of Yunnan Province (SYY) 2019; China Statistics Press: Beijing, China, 2020. [Google Scholar]
- National Bureau of Statistics of China. The Statistical Yearbook of Yunnan Province (SYY) 2020; China Statistics Press: Beijing, China, 2021. [Google Scholar]
- National Bureau of Statistics of China. The Statistical Yearbook of Yunnan Province (SYY) 2021; China Statistics Press: Beijing, China, 2022. [Google Scholar]
- Li, C.; Lin, S.; Wang, Y.; Chen, L. Evaluation of regional integration in urban agglomeration area from the perspective of urban symbiosis. Sustain. Cities Soc. 2024, 105, 105338. [Google Scholar]
- Dong, L.; Zhang, H.; Fujita, T.; Ohnishi, S.; Li, H.; Fujii, M.; Dong, H. Environmental and Economic Gains of Industrial Symbiosis for Chinese Iron/Steel Industry: Kawasaki’s Experience and Practice in Liuzhou and Jinan. J. Clean. Prod. 2013, 59, 226–238. [Google Scholar] [CrossRef]
- Jiao, W.; Boons, F. Toward a Research Agenda for Policy Intervention and Facilitation to Enhance Industrial Symbiosis Based on a Comprehensive Literature Review. J. Clean. Prod. 2014, 67, 14–25. [Google Scholar] [CrossRef]
- Omacini, M.; Semmartin, M.; Pérez, L.I.; Gundel, P.E. Grass—Endophyte Symbiosis: A Neglected Aboveground Interaction with Multiple Belowground Consequences. Appl. Soil Ecol. 2012, 61, 273–279. [Google Scholar] [CrossRef]
- Huang, M.; Wang, Z.; Chen, T. Analysis on the Theory and Practice of Industrial Symbiosis Based on Bibliometrics and Social Network Analysis. J. Clean. Prod. 2019, 213, 956–967. [Google Scholar] [CrossRef]
- Chertow, M.; Ehrenfeld, J. Organizing Self-Organizing Systems. J. Ind. Ecol. 2012, 16, 13–27. [Google Scholar] [CrossRef]
- Wu, L.; Kim, S.K. Does socioeconomic development lead to more equal distribution of green space? Evidence from Chinese cities. Sci. Total Environ. 2021, 757, 143780. [Google Scholar] [PubMed]
- Chen, X.; Li, F.; Li, X.; Hu, Y.; Hu, P. Quantifying the demographic distribution characteristics of ecological space quality to achieve urban agglomeration sustainability. Environ. Res. Lett. 2021, 16, 094025. [Google Scholar]
- Ren, F.; Chen, L.; Li, T.; Li, M. Spatial Changes of Suburban Forest Ecological Functions and Their Impact on Ecological Equity in the Process of Urbanization-A Case Study of Jiangning District, Nanjing, China. Forests 2023, 14, 1308. [Google Scholar] [CrossRef]
- Koo, B.W.; Boyd, N.; Guhathakurta, S.; Botchwey, N. Environmental Equity and Spatiotemporal Patterns of Urban Tree Canopy in Atlanta. J. Plan. Educ. Res. 2023, 43, 166–181. [Google Scholar]


Disclaimer/Publisher’s Note: The statements, opinions and data contained in all publications are solely those of the individual author(s) and contributor(s) and not of MDPI and/or the editor(s). MDPI and/or the editor(s) disclaim responsibility for any injury to people or property resulting from any ideas, methods, instructions or products referred to in the content. |
© 2025 by the authors. Licensee MDPI, Basel, Switzerland. This article is an open access article distributed under the terms and conditions of the Creative Commons Attribution (CC BY) license (https://creativecommons.org/licenses/by/4.0/).